
Biological Role of Pazopanib and Sunitinib Aldehyde Derivatives in Drug-Induced Liver Injury

 , ,
, ,
Abstract
:
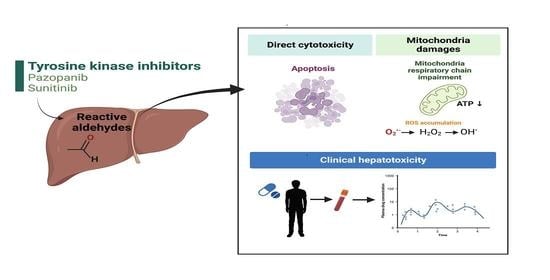
1. Introduction
2. Materials and Methods
2.1. Chemicals and Solvents
2.2. Cell Culture
2.3. LDH Release, Caspase 3/7 Activation and ATP Measurement
2.4. Evaluation of the Mitochondrial Respiration in HepG2 Cells
2.5. Mitochondrial Superoxide Accumulation in HepG2 Cells
2.6. Superoxide Dismutases 1 and 2 Gene Expression in HepG2 Cells
2.7. Proteomic Analysis
2.8. Patients and Hepatotoxicity Data
2.9. Preparation of Patients’ Samples for Pazopanib Aldehyde Quantification
2.10. UPLC-MS/MS Analysis
2.11. Statistical Analyses
3. Results
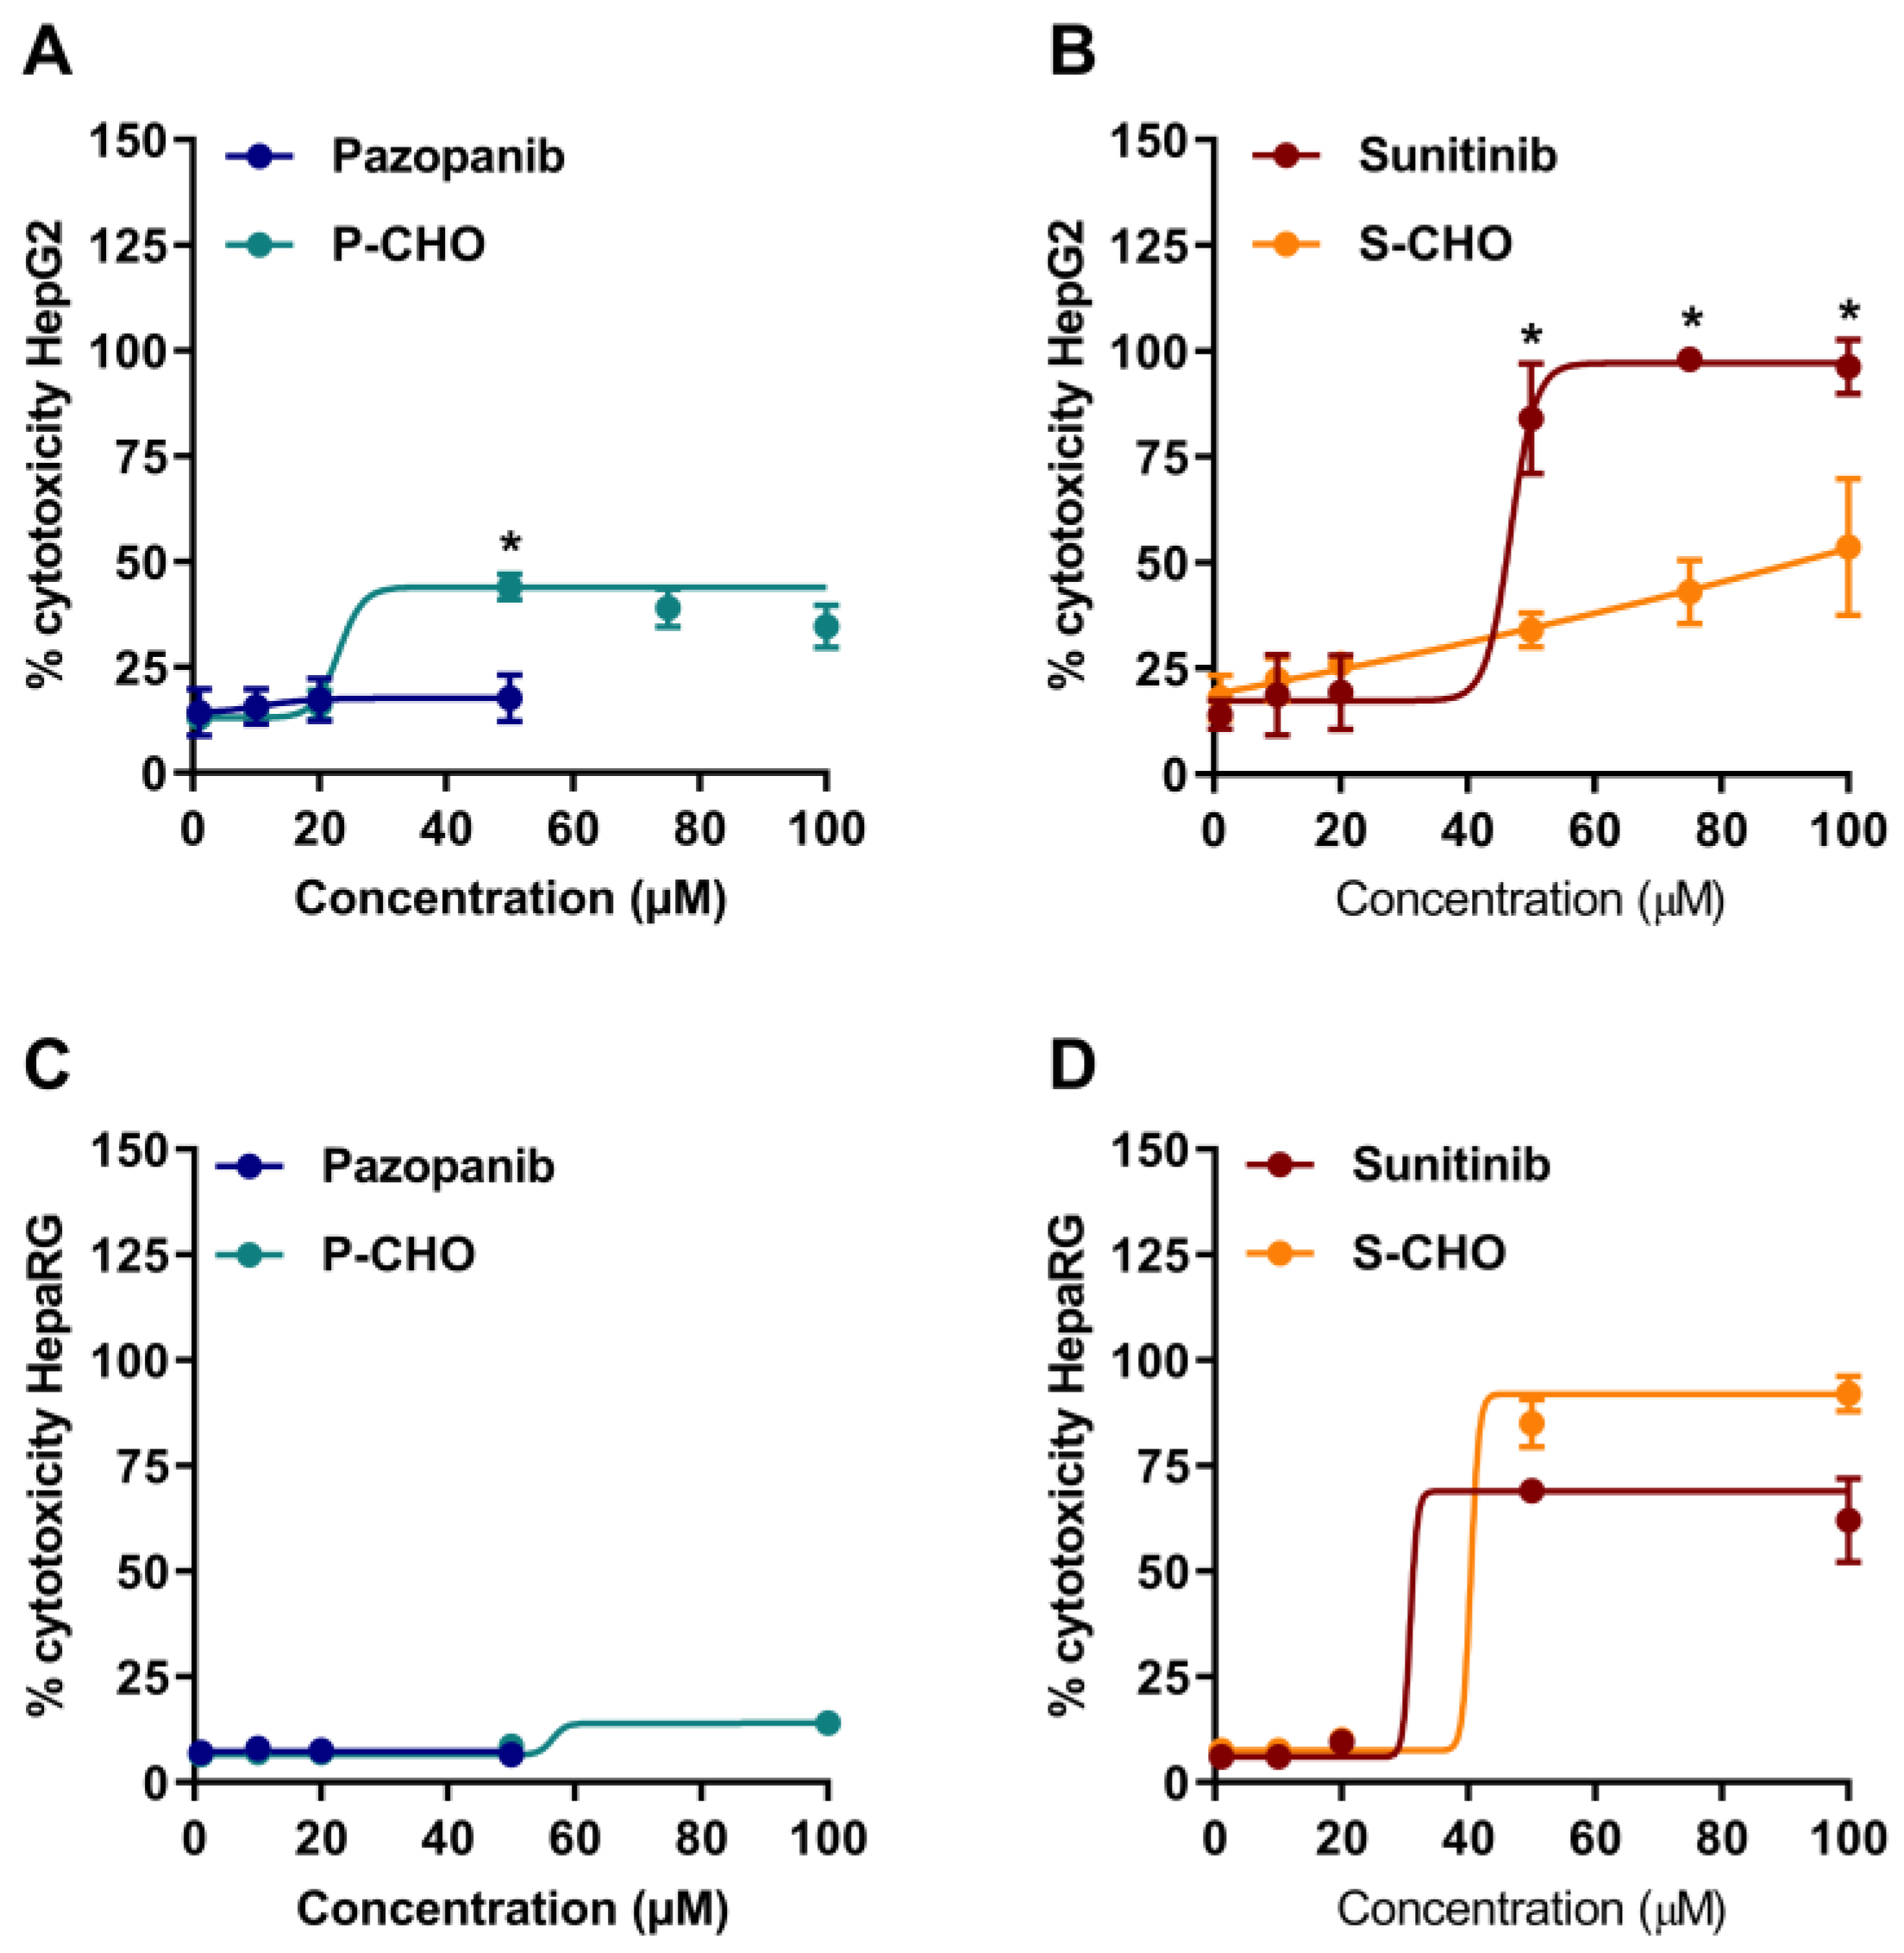
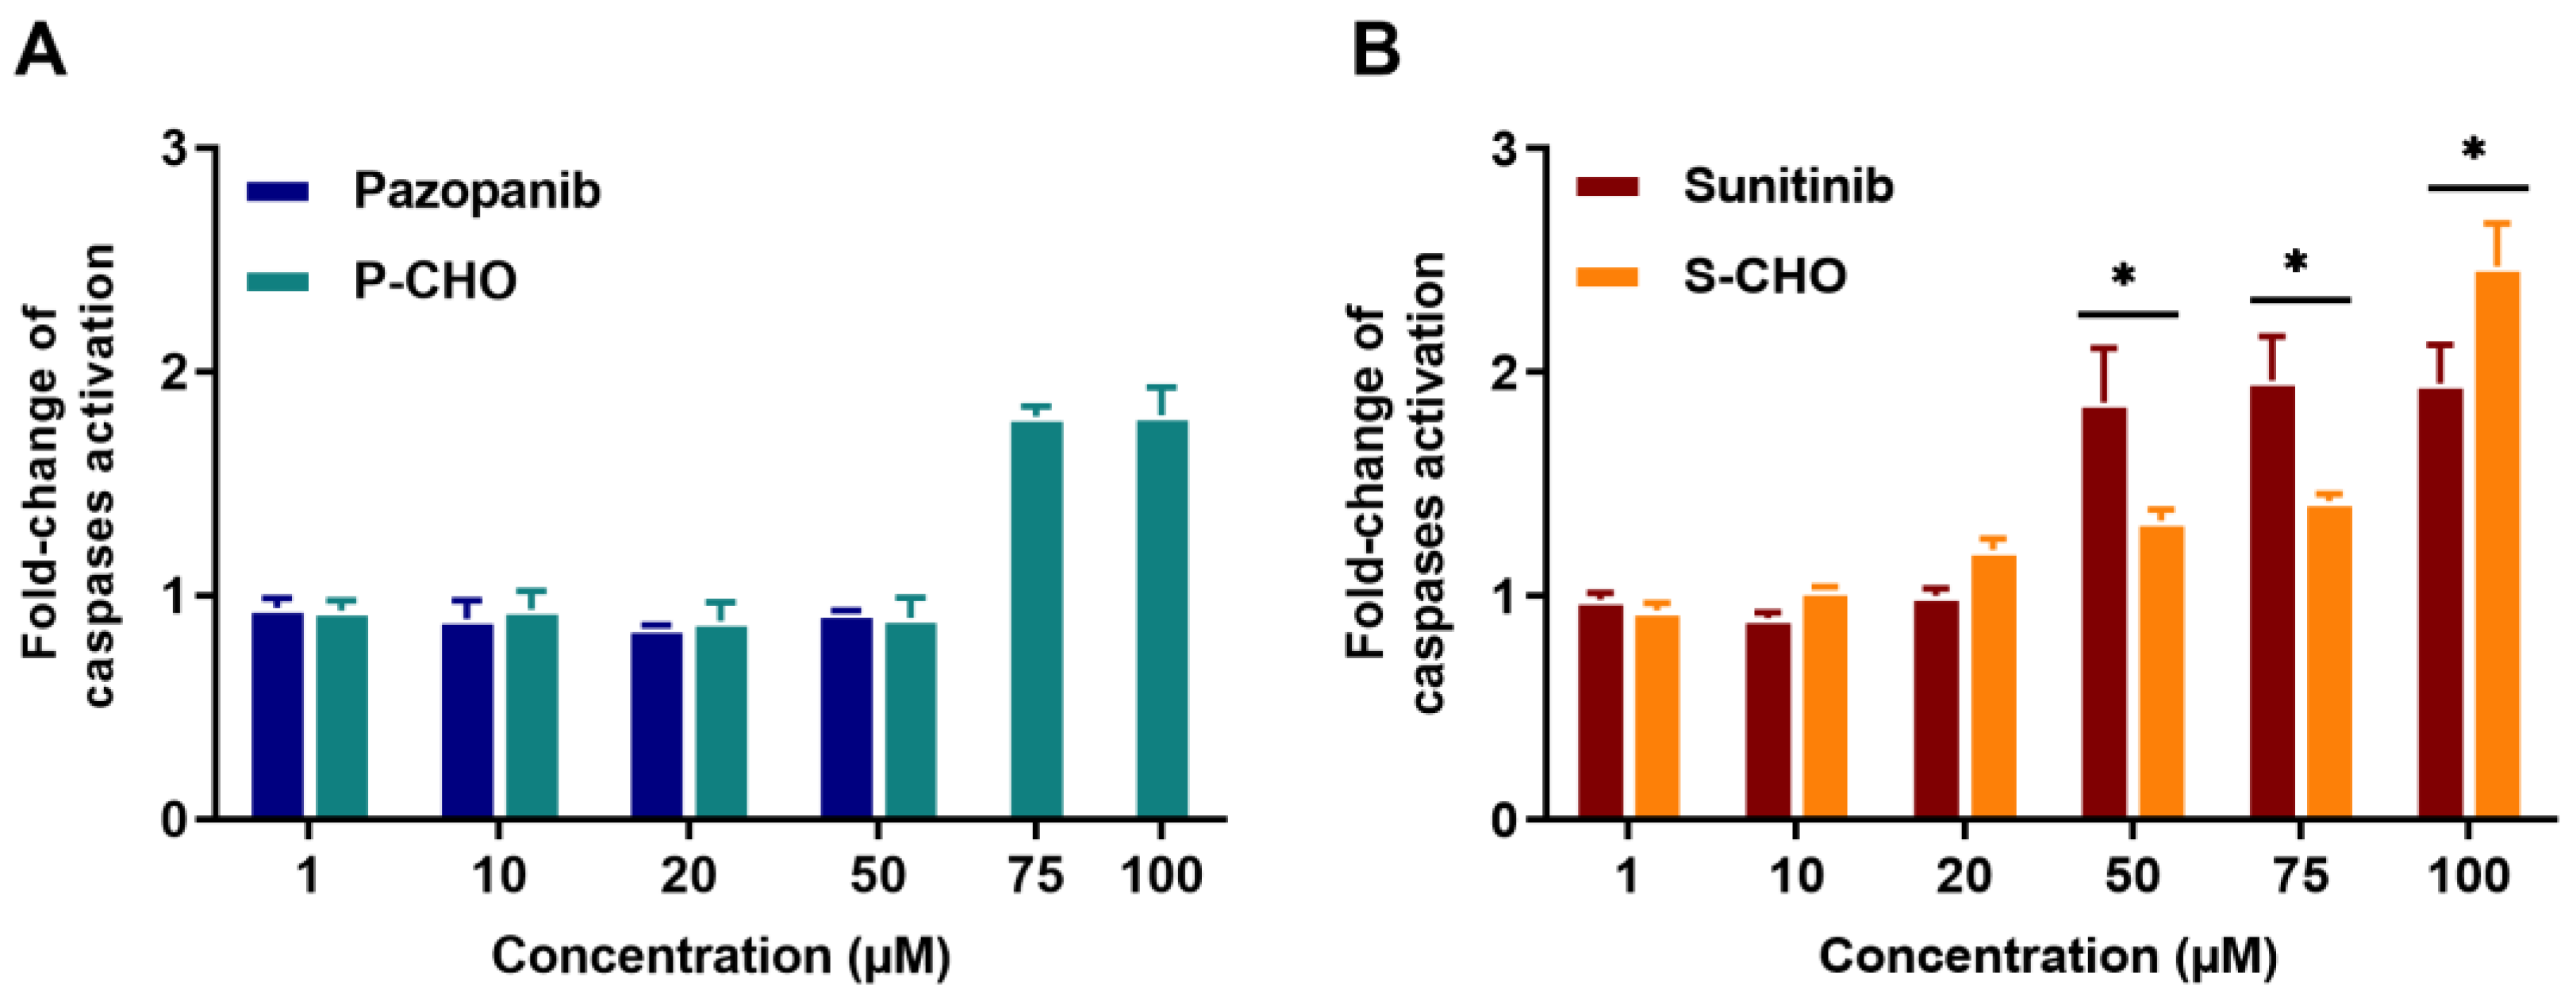
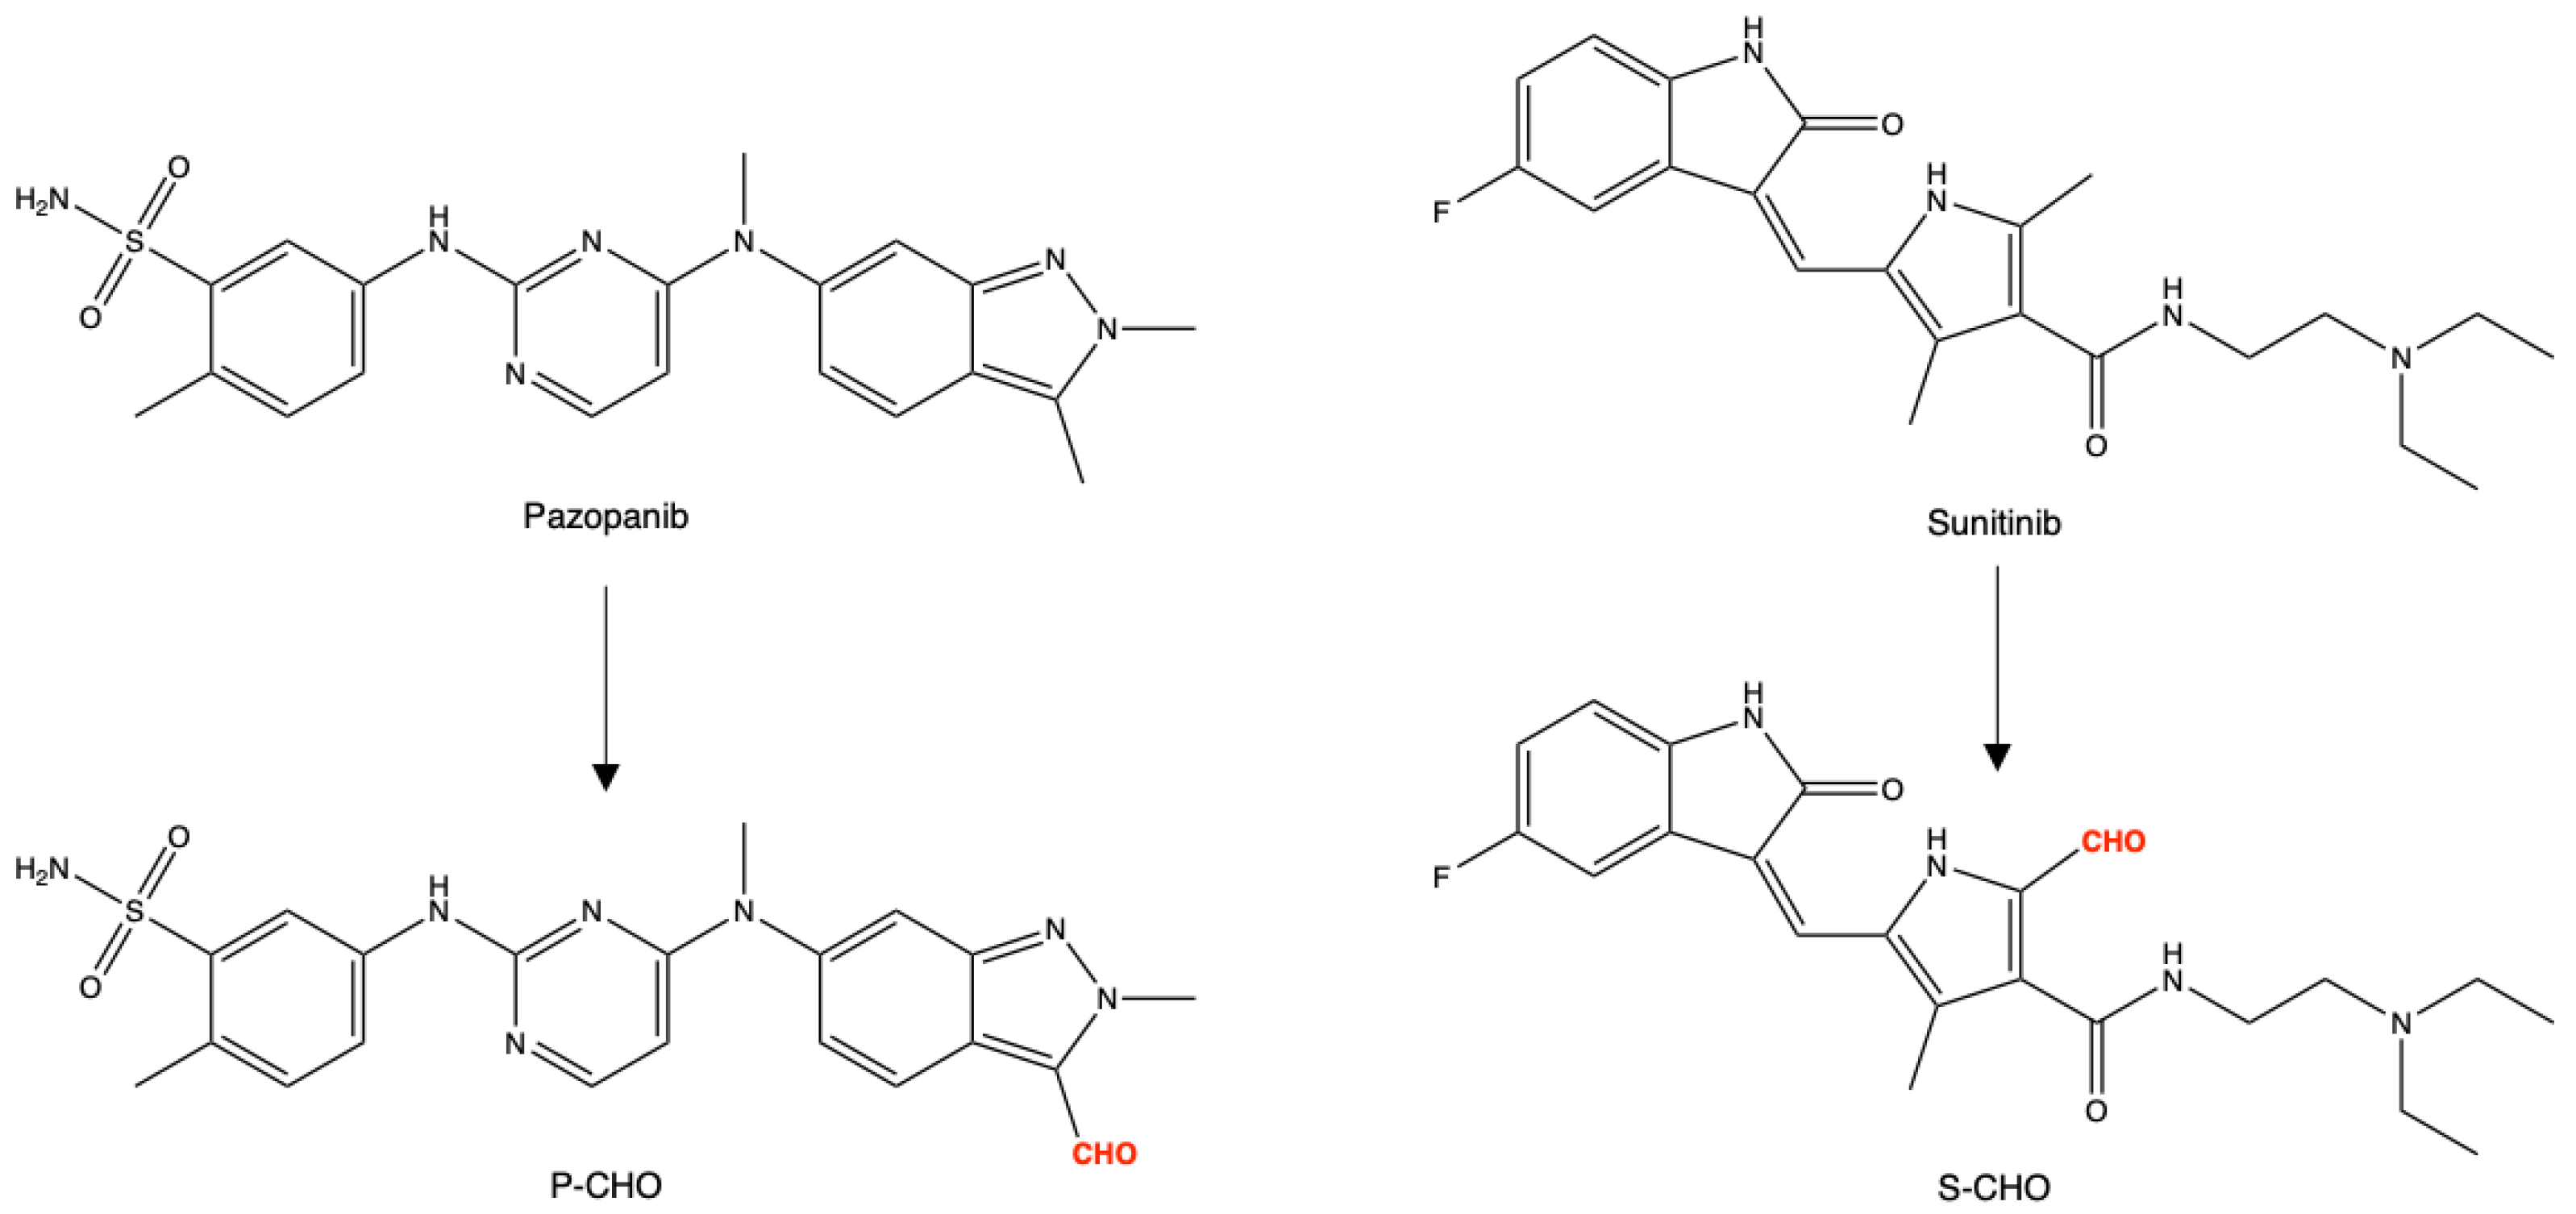
3.1. Evaluation of Pazopanib and Sunitinib Aldehyde Cytotoxicity in Liver Cell Lines
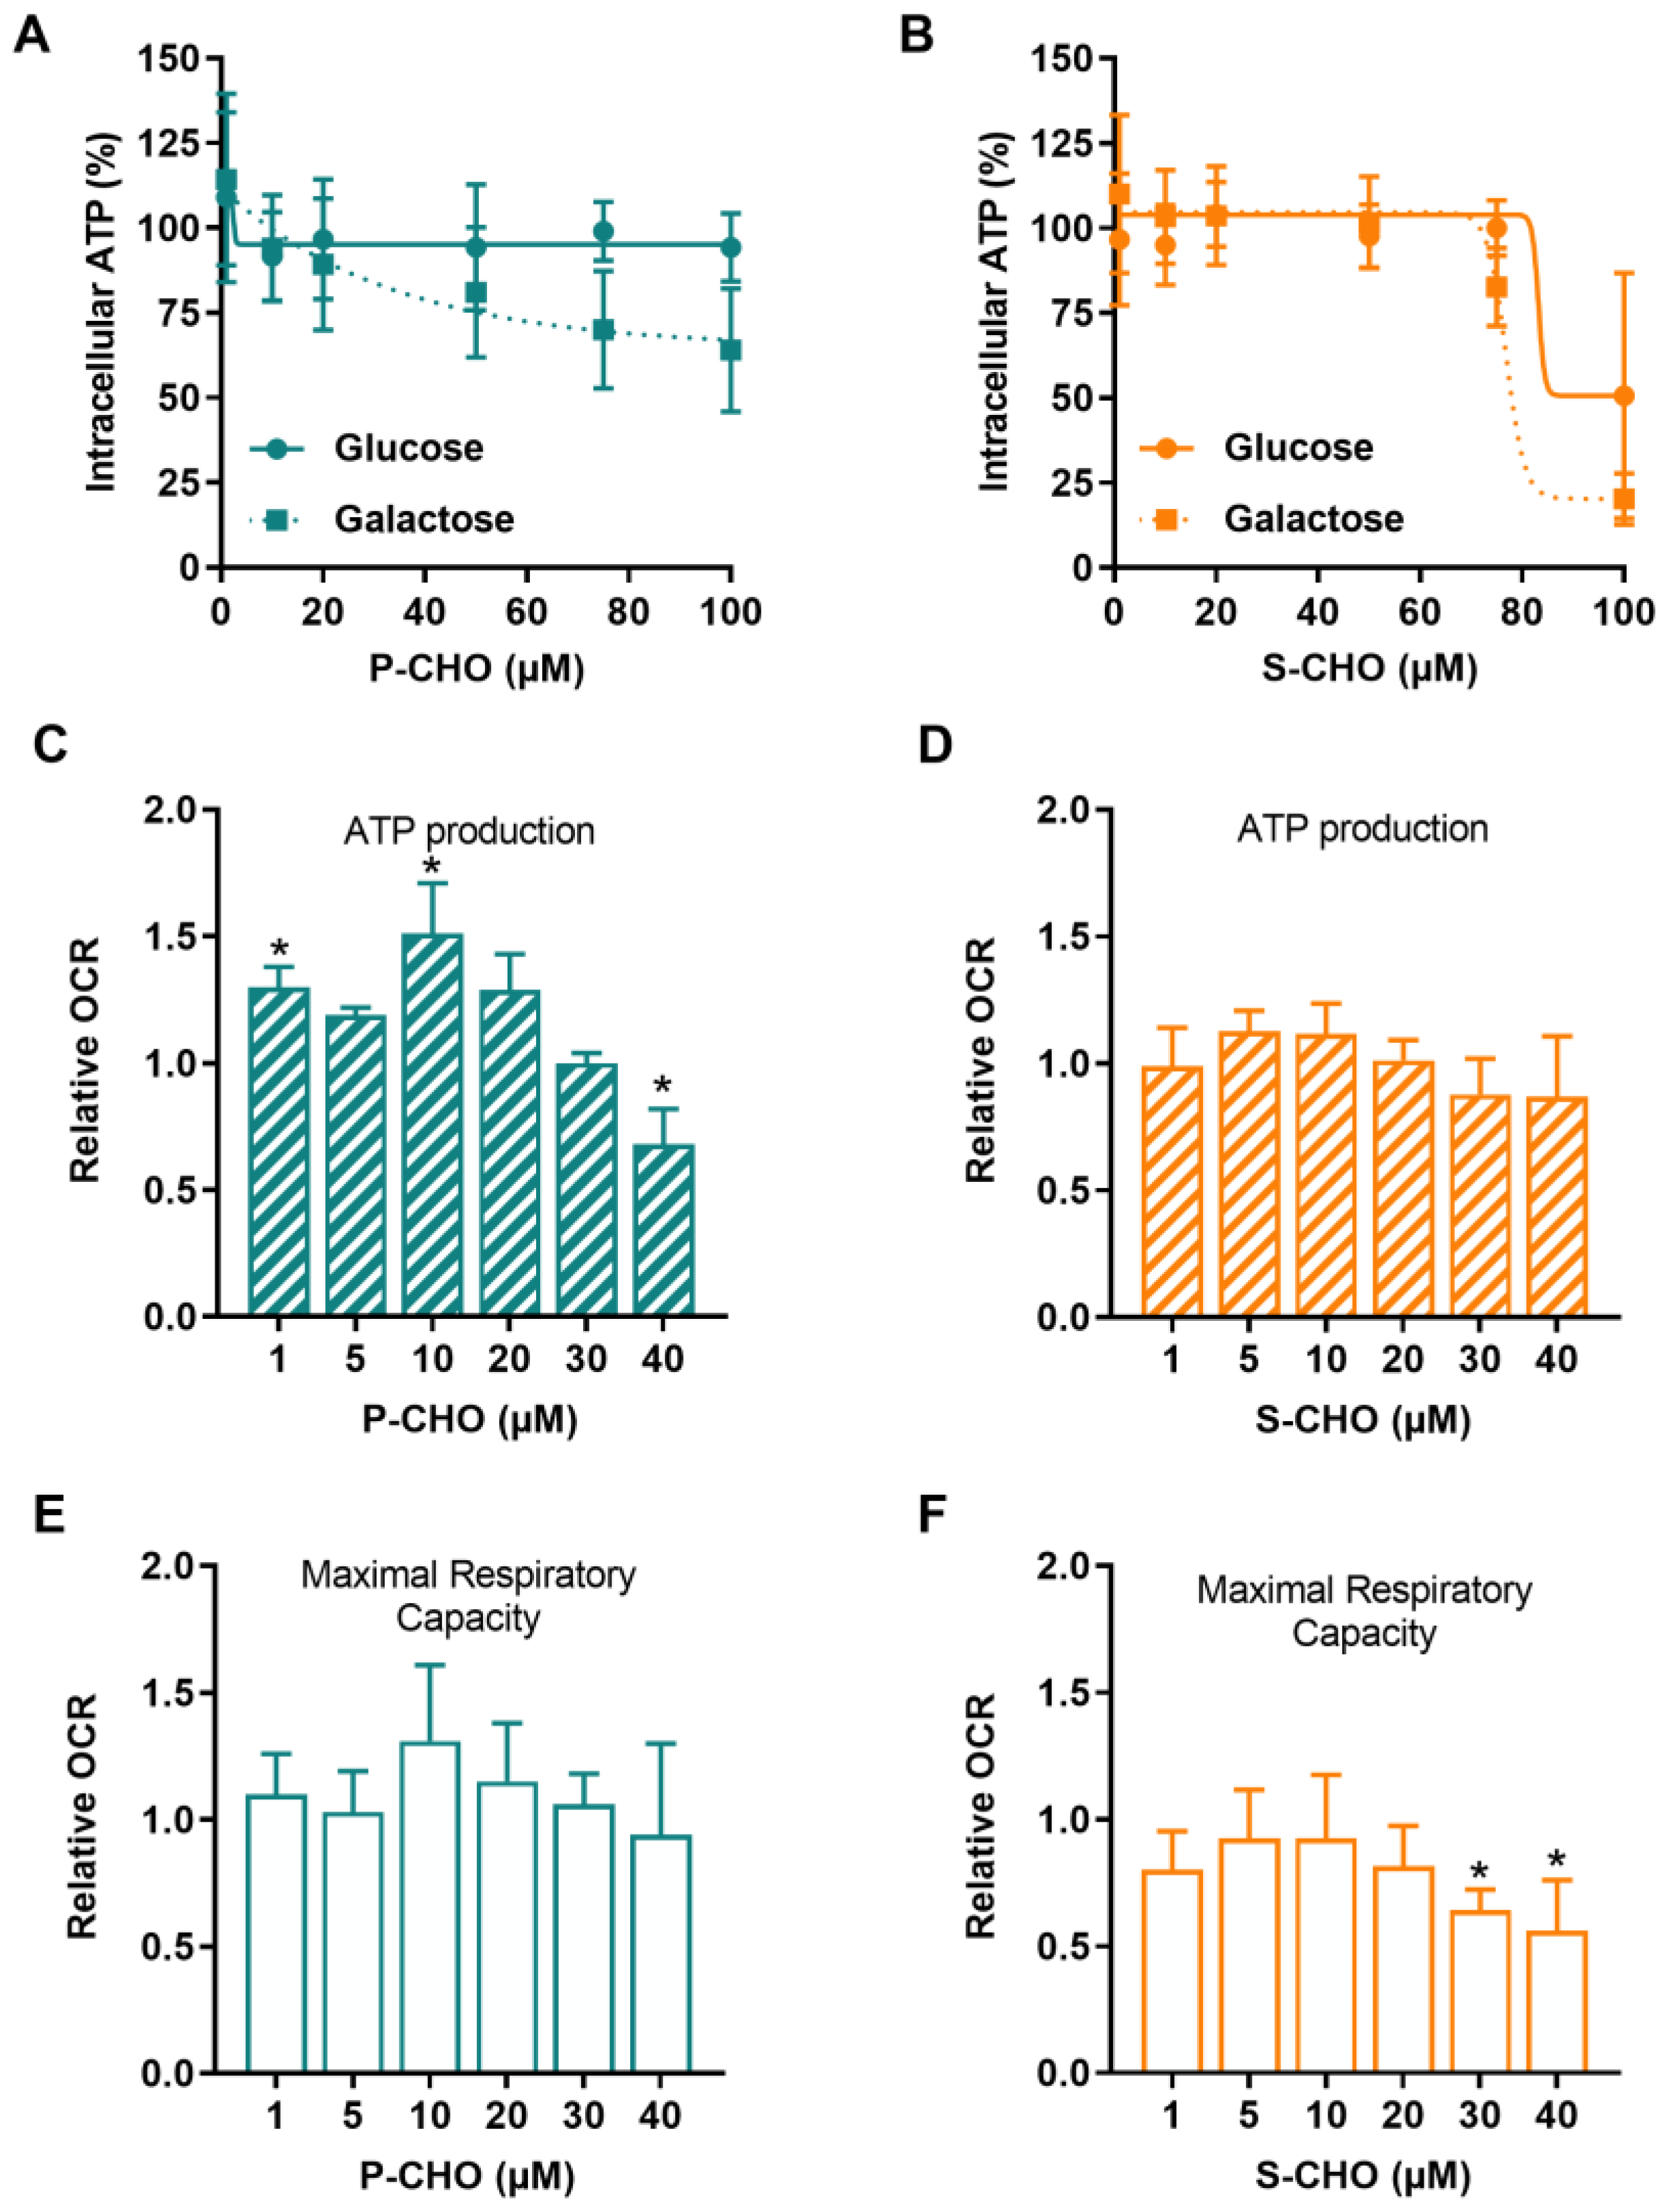
3.2. Evaluation of the Effect of Pazopanib and Sunitinib Aldehydes on Mitochondrial Function in the HepG2 Cell Line
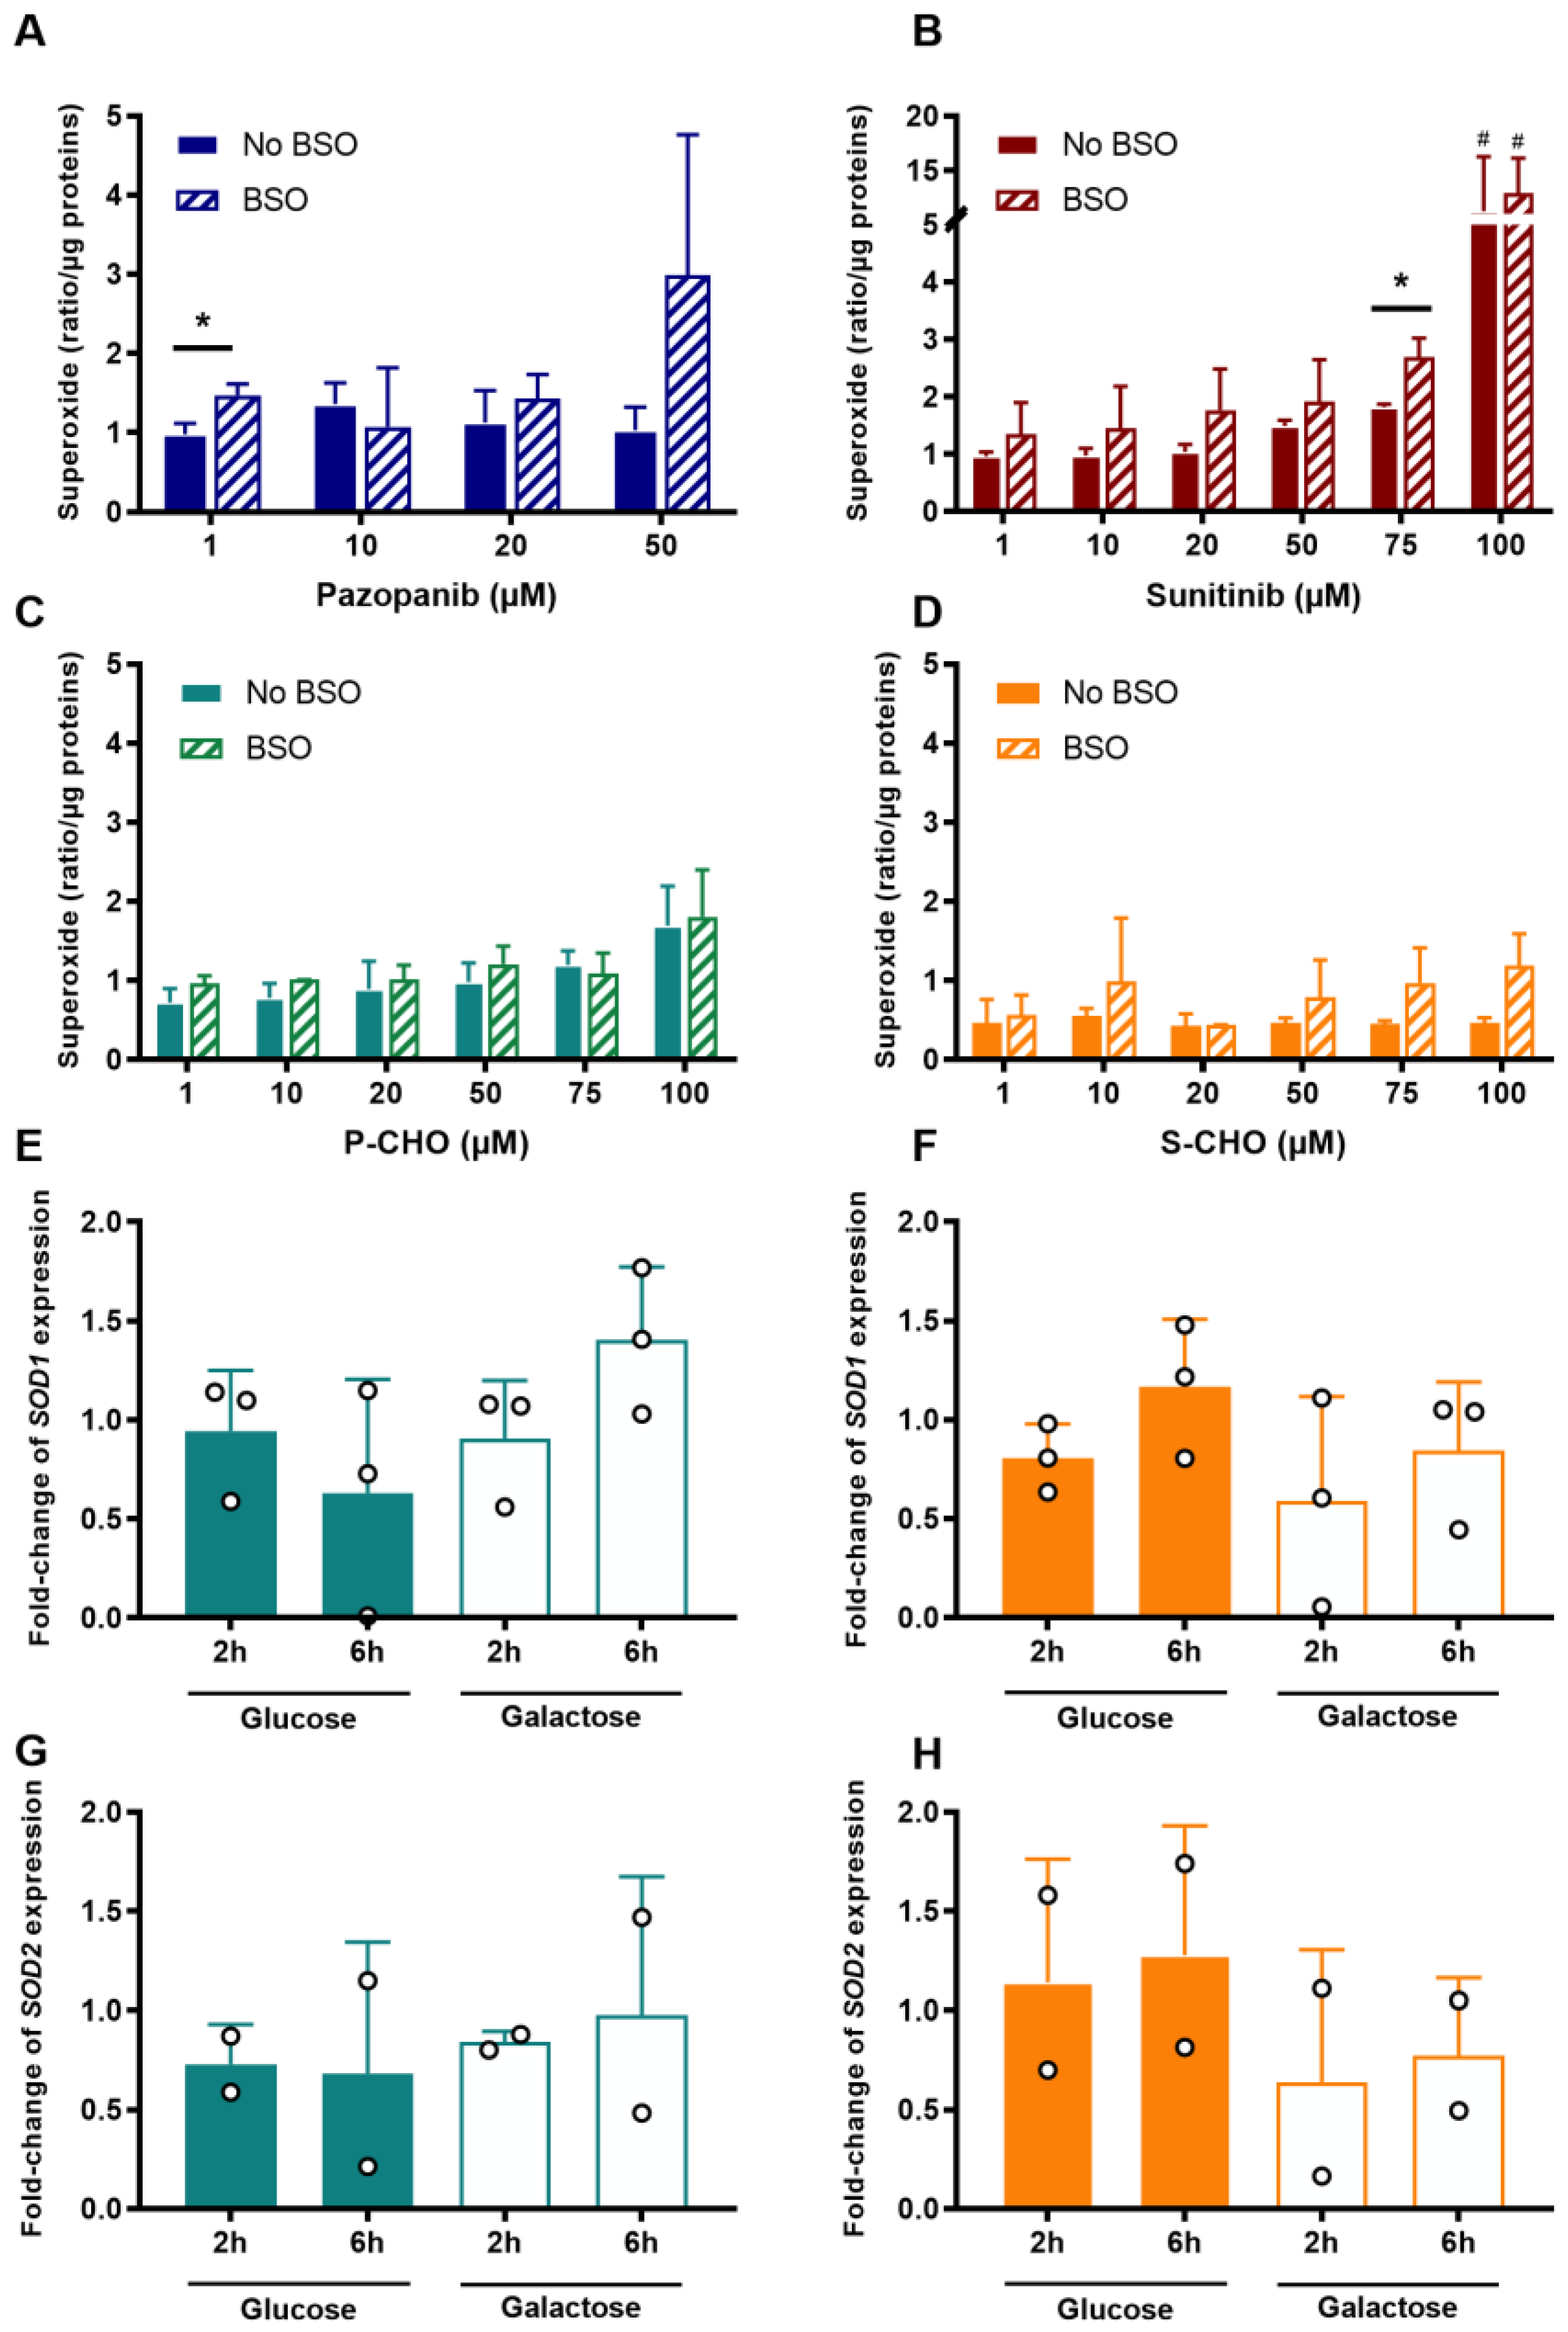
3.3. Evaluation of Oxidative Stress in the Presence of Reactive Metabolites
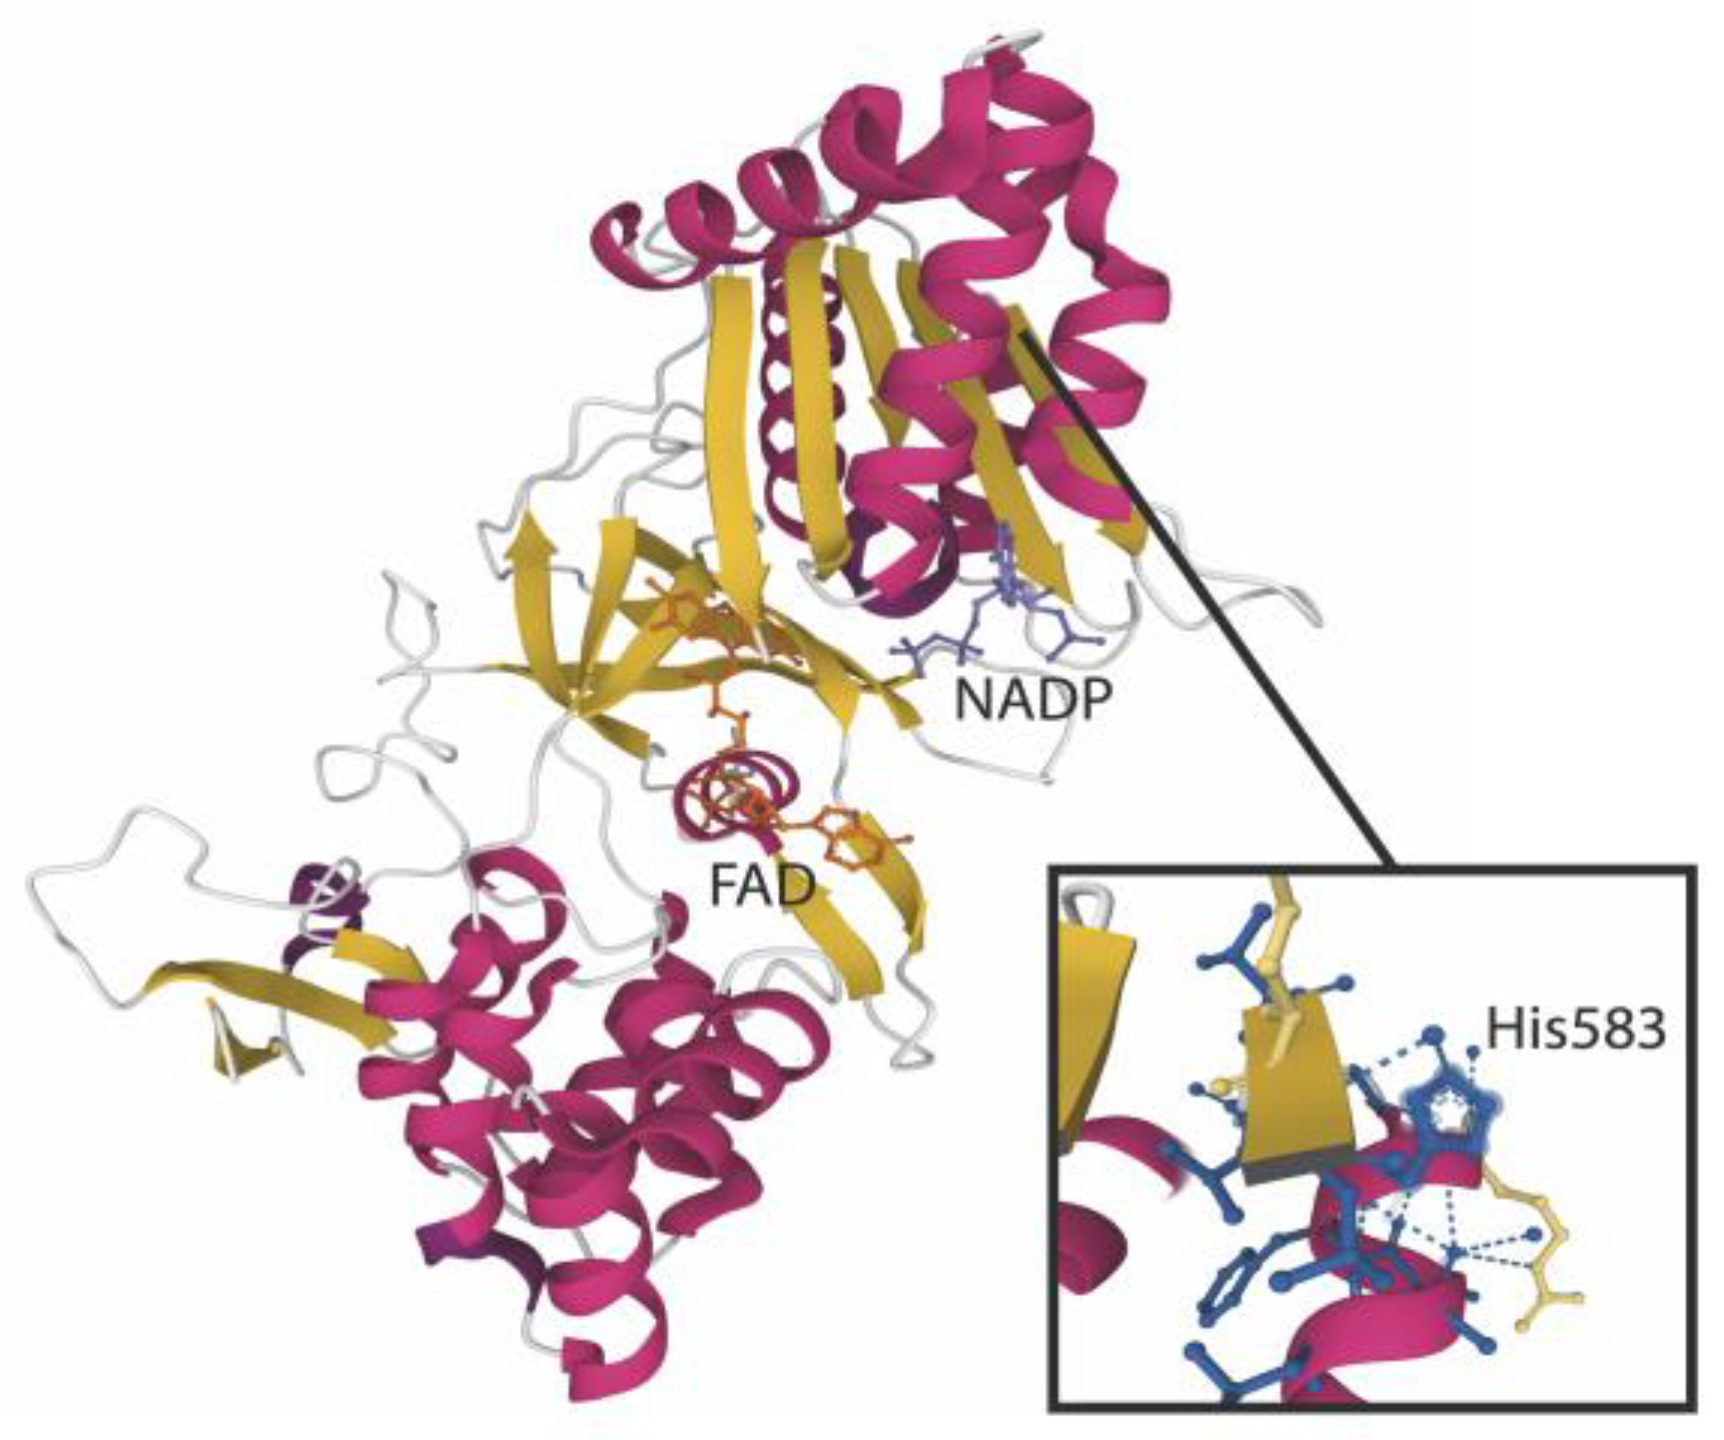
3.4. Proteomic Analysis of Aldehyde Binding to Liver Microsomes Proteins
3.5. Detection and Origin of Aldehyde Metabolites In Vivo
4. Discussion
Supplementary Materials
Author Contributions
Funding
Institutional Review Board Statement
Informed Consent Statement
Data Availability Statement
Acknowledgments
Conflicts of Interest
References
- Björnsson, E.S. Global Epidemiology of Drug-Induced Liver Injury (DILI). Curr. Hepatol. Rep. 2019, 18, 274–279. [Google Scholar] [CrossRef]
- FDA Drug Approval Package: Votrient (Pazopanib). Application Number: 22-465. Available online: https://www.accessdata.fda.gov/drugsatfda_docs/nda/2009/022465s000TOC.cfm (accessed on 10 July 2022).
- FDA Drug Approval Package: Sutent (Sunitinib Malate) NDA #021938 & 021968. Available online: https://www.accessdata.fda.gov/drugsatfda_docs/nda/2006/021938s000_021968s000_Stutent.cfm (accessed on 10 July 2022).
- Eno, M.R.; El-Gendy, B.E.-D.M.; Cameron, M.D. P450 3A-Catalyzed O-Dealkylation of Lapatinib Induces Mitochondrial Stress and Activates Nrf2. Chem. Res. Toxicol. 2016, 29, 784–796. [Google Scholar] [CrossRef] [PubMed]
- Xie, C.; Zhou, J.; Guo, Z.; Diao, X.; Gao, Z.; Zhong, D.; Jiang, H.; Zhang, L.; Chen, X. Metabolism and Bioactivation of Famitinib, a Novel Inhibitor of Receptor Tyrosine Kinase, in Cancer Patients. Br. J. Pharmacol. 2013, 168, 1687–1706. [Google Scholar] [CrossRef] [PubMed]
- Paludetto, M.-N.; Stigliani, J.-L.; Robert, A.; Bernardes-Génisson, V.; Chatelut, E.; Puisset, F.; Arellano, C. Involvement of Pazopanib and Sunitinib Aldehyde Reactive Metabolites in Toxicity and Drug-Drug Interactions in Vitro and in Patient Samples. Chem. Res. Toxicol. 2020, 33, 181–190. [Google Scholar] [CrossRef]
- Attwa, M.W.; Kadi, A.A.; Abdelhameed, A.S. Detection and Characterization of Olmutinib Reactive Metabolites by LC–MS/MS: Elucidation of Bioactivation Pathways. J. Sep. Sci. 2020, 43, 708–718. [Google Scholar] [CrossRef]
- Stepan, A.F.; Walker, D.P.; Bauman, J.; Price, D.A.; Baillie, T.A.; Kalgutkar, A.S.; Aleo, M.D. Structural Alert/Reactive Metabolite Concept as Applied in Medicinal Chemistry to Mitigate the Risk of Idiosyncratic Drug Toxicity: A Perspective Based on the Critical Examination of Trends in the Top 200 Drugs Marketed in the United States. Chem. Res. Toxicol. 2011, 24, 1345–1410. [Google Scholar] [CrossRef]
- Pessayre, D.; Mansouri, A.; Berson, A.; Fromenty, B. Mitochondrial Involvement in Drug-Induced Liver Injury. Handb. Exp. Pharmacol. 2010, 196, 311–365. [Google Scholar] [CrossRef]
- Paech, F.; Mingard, C.; Grünig, D.; Abegg, V.F.; Bouitbir, J.; Krähenbühl, S. Mechanisms of Mitochondrial Toxicity of the Kinase Inhibitors Ponatinib, Regorafenib and Sorafenib in Human Hepatic HepG2 Cells. Toxicology 2018, 395, 34–44. [Google Scholar] [CrossRef]
- Paech, F.; Abegg, V.F.; Duthaler, U.; Terracciano, L.; Bouitbir, J.; Krähenbühl, S. Sunitinib Induces Hepatocyte Mitochondrial Damage and Apoptosis in Mice. Toxicology 2018, 409, 13–23. [Google Scholar] [CrossRef]
- Bouitbir, J.; Alshaikhali, A.; Panajatovic, M.V.; Abegg, V.F.; Paech, F.; Krähenbühl, S. Mitochondrial Oxidative Stress Plays a Critical Role in the Cardiotoxicity of Sunitinib. Toxicology 2019, 426, 152281. [Google Scholar] [CrossRef]
- Mingard, C.; Paech, F.; Bouitbir, J.; Krähenbühl, S. Mechanisms of Toxicity Associated with Six Tyrosine Kinase Inhibitors in Human Hepatocyte Cell Lines. J. Appl. Toxicol. 2018, 38, 418–431. [Google Scholar] [CrossRef] [PubMed]
- Paludetto, M.-N.; Bijani, C.; Puisset, F.; Bernardes-Génisson, V.; Arellano, C.; Robert, A. Metalloporphyrin-Catalyzed Oxidation of Sunitinib and Pazopanib, Two Anticancer Tyrosine Kinase Inhibitors: Evidence for New Potentially Toxic Metabolites. J. Med. Chem. 2018, 61, 7849–7860. [Google Scholar] [CrossRef] [PubMed]
- Gripon, P.; Rumin, S.; Urban, S.; Seyec, J.L.; Glaise, D.; Cannie, I.; Guyomard, C.; Lucas, J.; Trepo, C.; Guguen-Guillouzo, C. Infection of a Human Hepatoma Cell Line by Hepatitis B Virus. Proc. Natl. Acad. Sci. USA 2002, 99, 15655–15660. [Google Scholar] [CrossRef] [PubMed]
- Schmittgen, T.D.; Livak, K.J. Analyzing Real-Time PCR Data by the Comparative CT Method. Nat. Protoc. 2008, 3, 1101–1108. [Google Scholar] [CrossRef] [PubMed]
- Xia, C.; Panda, S.P.; Marohnic, C.C.; Martasek, P.; Masters, B.S.; Kim, J.-J.P. Structural Basis for Human NADPH-Cytochrome P450 Oxidoreductase Deficiency. Proc. Natl. Acad. Sci. USA 2011, 108, 13486–13491. [Google Scholar] [CrossRef]
- Andrade, R.J.; Chalasani, N.; Björnsson, E.S.; Suzuki, A.; Kullak-Ublick, G.A.; Watkins, P.B.; Devarbhavi, H.; Merz, M.; Lucena, M.I.; Kaplowitz, N.; et al. Drug-Induced Liver Injury. Nat. Rev. Dis. Primers 2019, 5, 1–22. [Google Scholar] [CrossRef]
- Gerets, H.H.J.; Tilmant, K.; Gerin, B.; Chanteux, H.; Depelchin, B.O.; Dhalluin, S.; Atienzar, F.A. Characterization of Primary Human Hepatocytes, HepG2 Cells, and HepaRG Cells at the MRNA Level and CYP Activity in Response to Inducers and Their Predictivity for the Detection of Human Hepatotoxins. Cell Biol. Toxicol. 2012, 28, 69–87. [Google Scholar] [CrossRef]
- Paech, F.; Bouitbir, J.; Krähenbühl, S. Hepatocellular Toxicity Associated with Tyrosine Kinase Inhibitors: Mitochondrial Damage and Inhibition of Glycolysis. Front. Pharmacol. 2017, 8, 367. [Google Scholar] [CrossRef]
- Mookerjee, S.A.; Divakaruni, A.S.; Jastroch, M.; Brand, M.D. Mitochondrial Uncoupling and Lifespan. Mech. Ageing Dev. 2010, 131, 463–472. [Google Scholar] [CrossRef]
- Armstrong, J.S.; Steinauer, K.K.; Hornung, B.; Irish, J.M.; Lecane, P.; Birrell, G.W.; Peehl, D.M.; Knox, S.J. Role of Glutathione Depletion and Reactive Oxygen Species Generation in Apoptotic Signaling in a Human B Lymphoma Cell Line. Cell Death Differ. 2002, 9, 252–263. [Google Scholar] [CrossRef] [Green Version]
- Wang, Y.; Branicky, R.; Noë, A.; Hekimi, S. Superoxide Dismutases: Dual Roles in Controlling ROS Damage and Regulating ROS Signaling. J. Cell Biol. 2018, 217, 1915–1928. [Google Scholar] [CrossRef] [PubMed]
- Kandel, S.E.; Lampe, J.N. Role of Protein–Protein Interactions in Cytochrome P450-Mediated Drug Metabolism and Toxicity. Chem. Res. Toxicol. 2014, 27, 1474–1486. [Google Scholar] [CrossRef] [PubMed]
- Mishin, V.; Gray, J.P.; Heck, D.E.; Laskin, D.L.; Laskin, J.D. Application of the Amplex Red/Horseradish Peroxidase Assay to Measure Hydrogen Peroxide Generation by Recombinant Microsomal Enzymes. Free Radic. Biol. Med. 2010, 48, 1485–1491. [Google Scholar] [CrossRef]
- Gray, J.P.; Mishin, V.; Heck, D.E.; Laskin, D.L.; Laskin, J.D. Inhibition of NADPH Cytochrome P450 Reductase by the Model Sulfur Mustard Vesicant 2-Chloroethyl Ethyl Sulfide Is Associated with Increased Production of Reactive Oxygen Species. Toxicol. Appl. Pharmacol. 2010, 247, 76–82. [Google Scholar] [CrossRef] [PubMed]
- Wang, Y.-K.; Yang, X.-N.; Liang, W.-Q.; Xiao, Y.; Zhao, Q.; Xiao, X.-R.; Gonzalez, F.J.; Li, F. A Metabolomic Perspective of Pazopanib-Induced Acute Hepatotoxicity in Mice. Xenobiotica 2019, 49, 655–670. [Google Scholar] [CrossRef]
- Amaya, G.M.; Durandis, R.; Bourgeois, D.S.; Perkins, J.A.; Abouda, A.A.; Wines, K.J.; Mohamud, M.; Starks, S.A.; Daniels, R.N.; Jackson, K.D. Cytochromes P450 1A2 and 3A4 Catalyze the Metabolic Activation of Sunitinib. Chem. Res. Toxicol. 2018, 31, 570–584. [Google Scholar] [CrossRef] [PubMed]
- Speed, B.; Bu, H.-Z.; Pool, W.F.; Peng, G.W.; Wu, E.Y.; Patyna, S.; Bello, C.; Kang, P. Pharmacokinetics, Distribution, and Metabolism of [14C]Sunitinib in Rats, Monkeys, and Humans. Drug Metab. Dispos. 2012, 40, 539–555. [Google Scholar] [CrossRef] [PubMed]
- Mimnaugh, E.G.; Trush, M.A.; Gram, T.E. Stimulation by Adriamycin of Rat Heart and Liver Microsomal NADPH-Dependent Lipid Peroxidation. Biochem. Pharmacol. 1981, 30, 2797–2804. [Google Scholar] [CrossRef]
- Patel, P.N.; Kalariya, P.D.; Sharma, M.; Garg, P.; Talluri, M.V.N.K.; Gananadhamu, S.; Srinivas, R. Characterization of Forced Degradation Products of Pazopanib Hydrochloride by UHPLC-Q-TOF/MS and in Silico Toxicity Prediction. J. Mass Spectrom. 2015, 50, 918–928. [Google Scholar] [CrossRef]
- European Pharmacopoeia Imatinib Mesylate, Monography 2736, 10th ed.; European Medicines Agency: Amsterdam, The Netherlands, 2017.
- Cho, T.; Uetrecht, J. How Reactive Metabolites Induce an Immune Response That Sometimes Leads to an Idiosyncratic Drug Reaction. Chem. Res. Toxicol. 2017, 30, 295–314. [Google Scholar] [CrossRef]
- Kato, R.; Ijiri, Y.; Hayashi, T.; Uetrecht, J. Reactive Metabolite of Gefitinib Activates Inflammasomes: Implications for Gefitinib-Induced Idiosyncratic Reaction. J. Toxicol. Sci. 2020, 45, 673–680. [Google Scholar] [CrossRef] [PubMed]


Publisher’s Note: MDPI stays neutral with regard to jurisdictional claims in published maps and institutional affiliations. |
© 2022 by the authors. Licensee MDPI, Basel, Switzerland. This article is an open access article distributed under the terms and conditions of the Creative Commons Attribution (CC BY) license (https://creativecommons.org/licenses/by/4.0/).
Share and Cite
Maillard, M.; Arellano, C.; Vachoux, C.; Chevreau, C.; Cabaton, N.J.; Pont, F.; Saint-Laurent, N.; Lafont, T.; Chatelut, E.; Thomas, F. Biological Role of Pazopanib and Sunitinib Aldehyde Derivatives in Drug-Induced Liver Injury. Metabolites 2022, 12, 852. https://doi.org/10.3390/metabo12090852
Maillard M, Arellano C, Vachoux C, Chevreau C, Cabaton NJ, Pont F, Saint-Laurent N, Lafont T, Chatelut E, Thomas F. Biological Role of Pazopanib and Sunitinib Aldehyde Derivatives in Drug-Induced Liver Injury. Metabolites. 2022; 12(9):852. https://doi.org/10.3390/metabo12090852
Chicago/Turabian StyleMaillard, Maud, Cécile Arellano, Christelle Vachoux, Christine Chevreau, Nicolas J. Cabaton, Frédéric Pont, Nathalie Saint-Laurent, Thierry Lafont, Etienne Chatelut, and Fabienne Thomas. 2022. "Biological Role of Pazopanib and Sunitinib Aldehyde Derivatives in Drug-Induced Liver Injury" Metabolites 12, no. 9: 852. https://doi.org/10.3390/metabo12090852
APA StyleMaillard, M., Arellano, C., Vachoux, C., Chevreau, C., Cabaton, N. J., Pont, F., Saint-Laurent, N., Lafont, T., Chatelut, E., & Thomas, F. (2022). Biological Role of Pazopanib and Sunitinib Aldehyde Derivatives in Drug-Induced Liver Injury. Metabolites, 12(9), 852. https://doi.org/10.3390/metabo12090852