
Differential Chemical Profile of Metabolite Extracts Produced by the Diaporthe citri (G-01) Endophyte Mediated by Varying the Fermented Broth pH

 , , ,
, , ,  and
and
Abstract
:
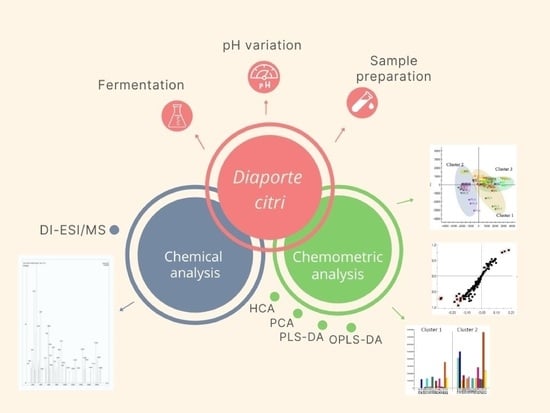
1. Introduction
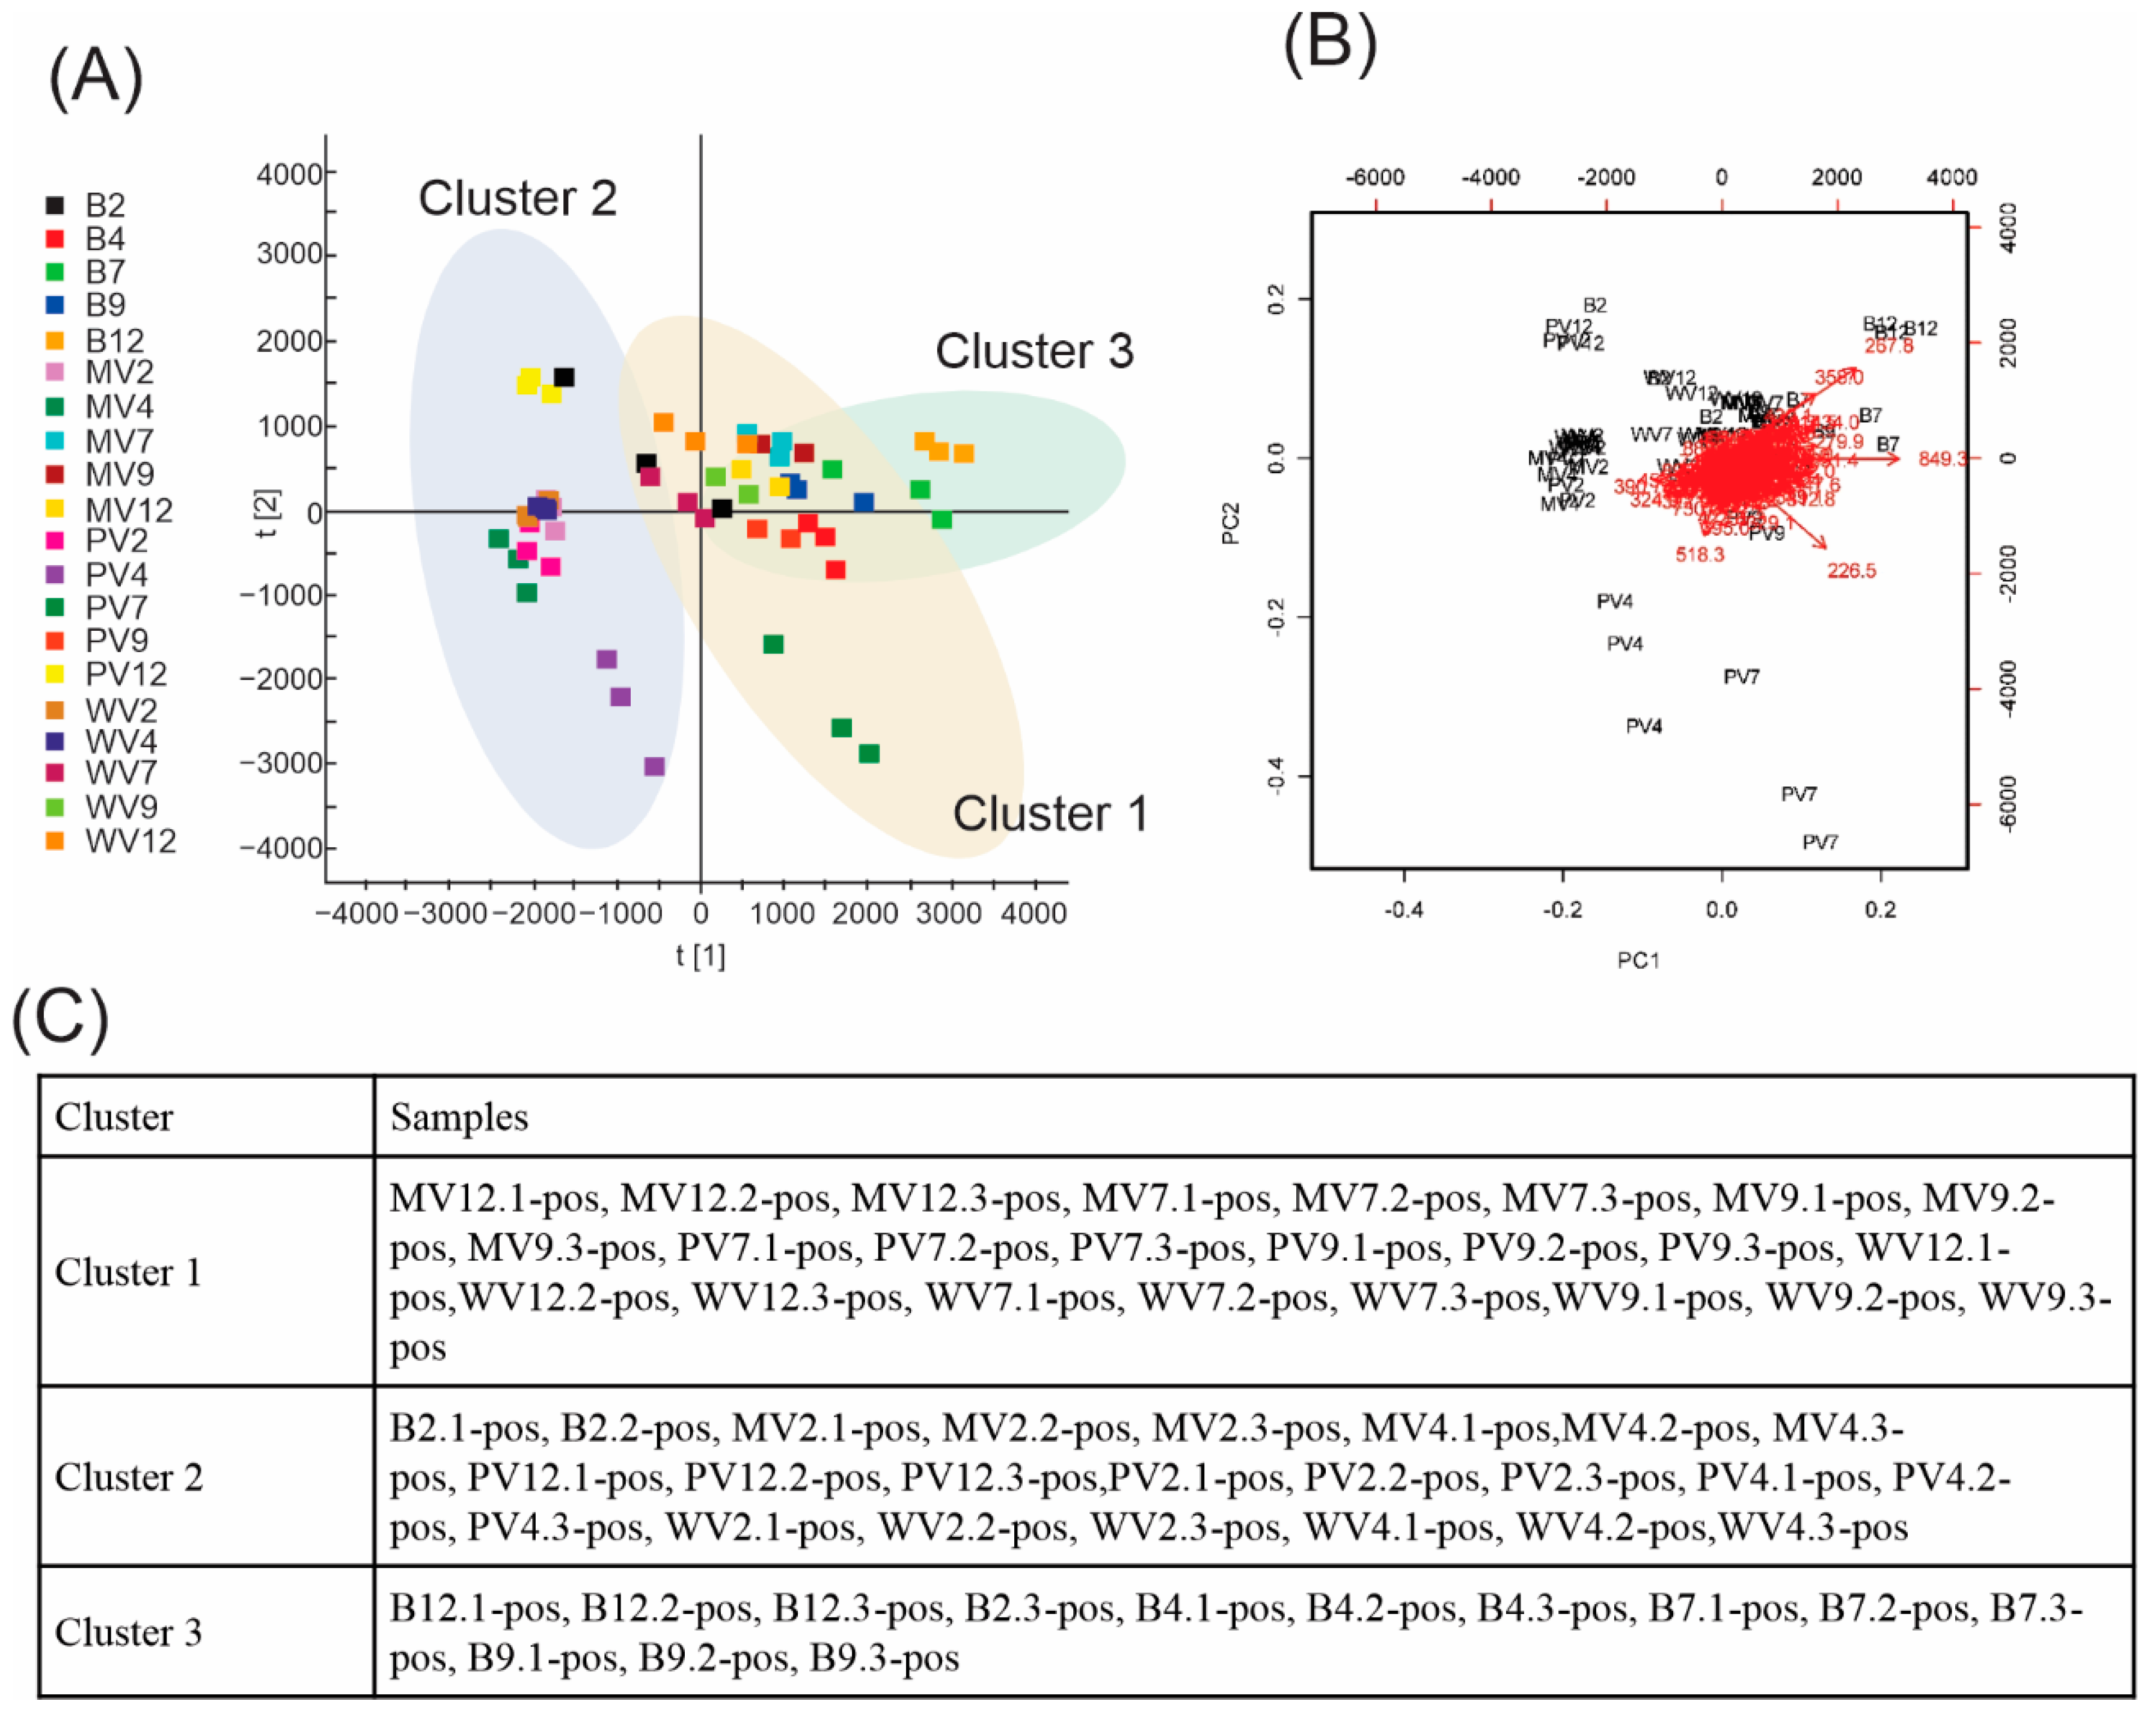
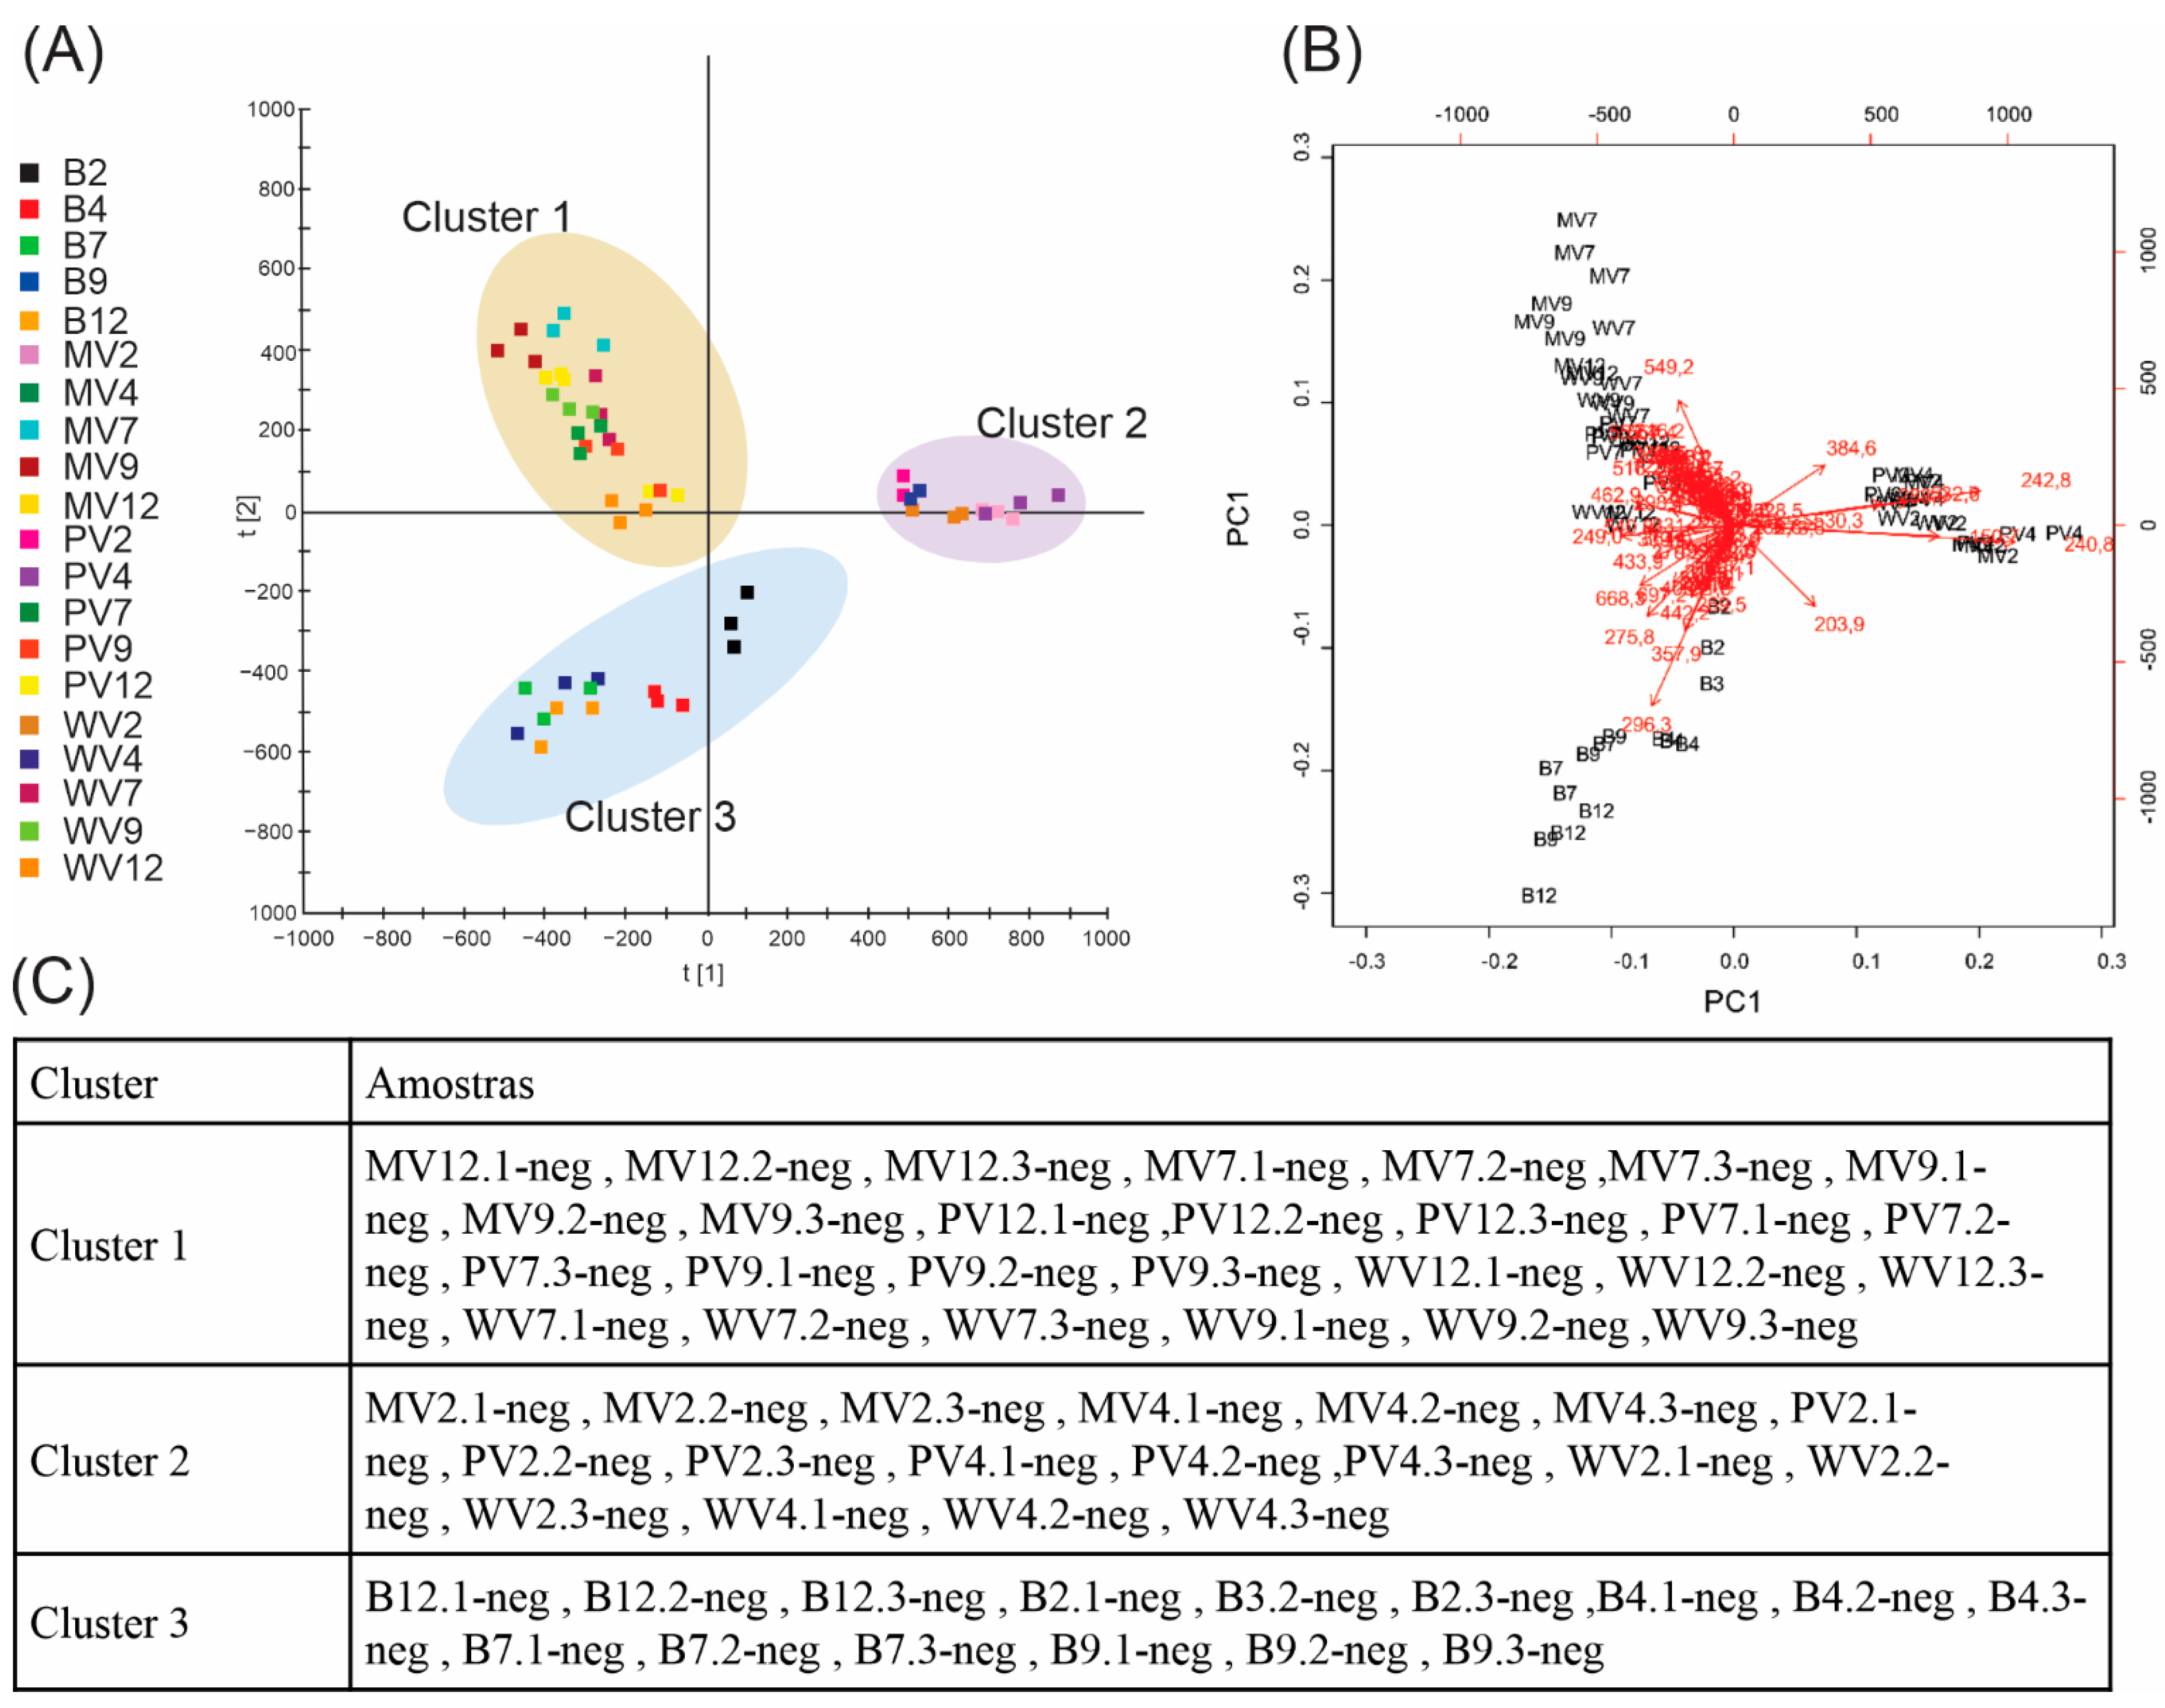
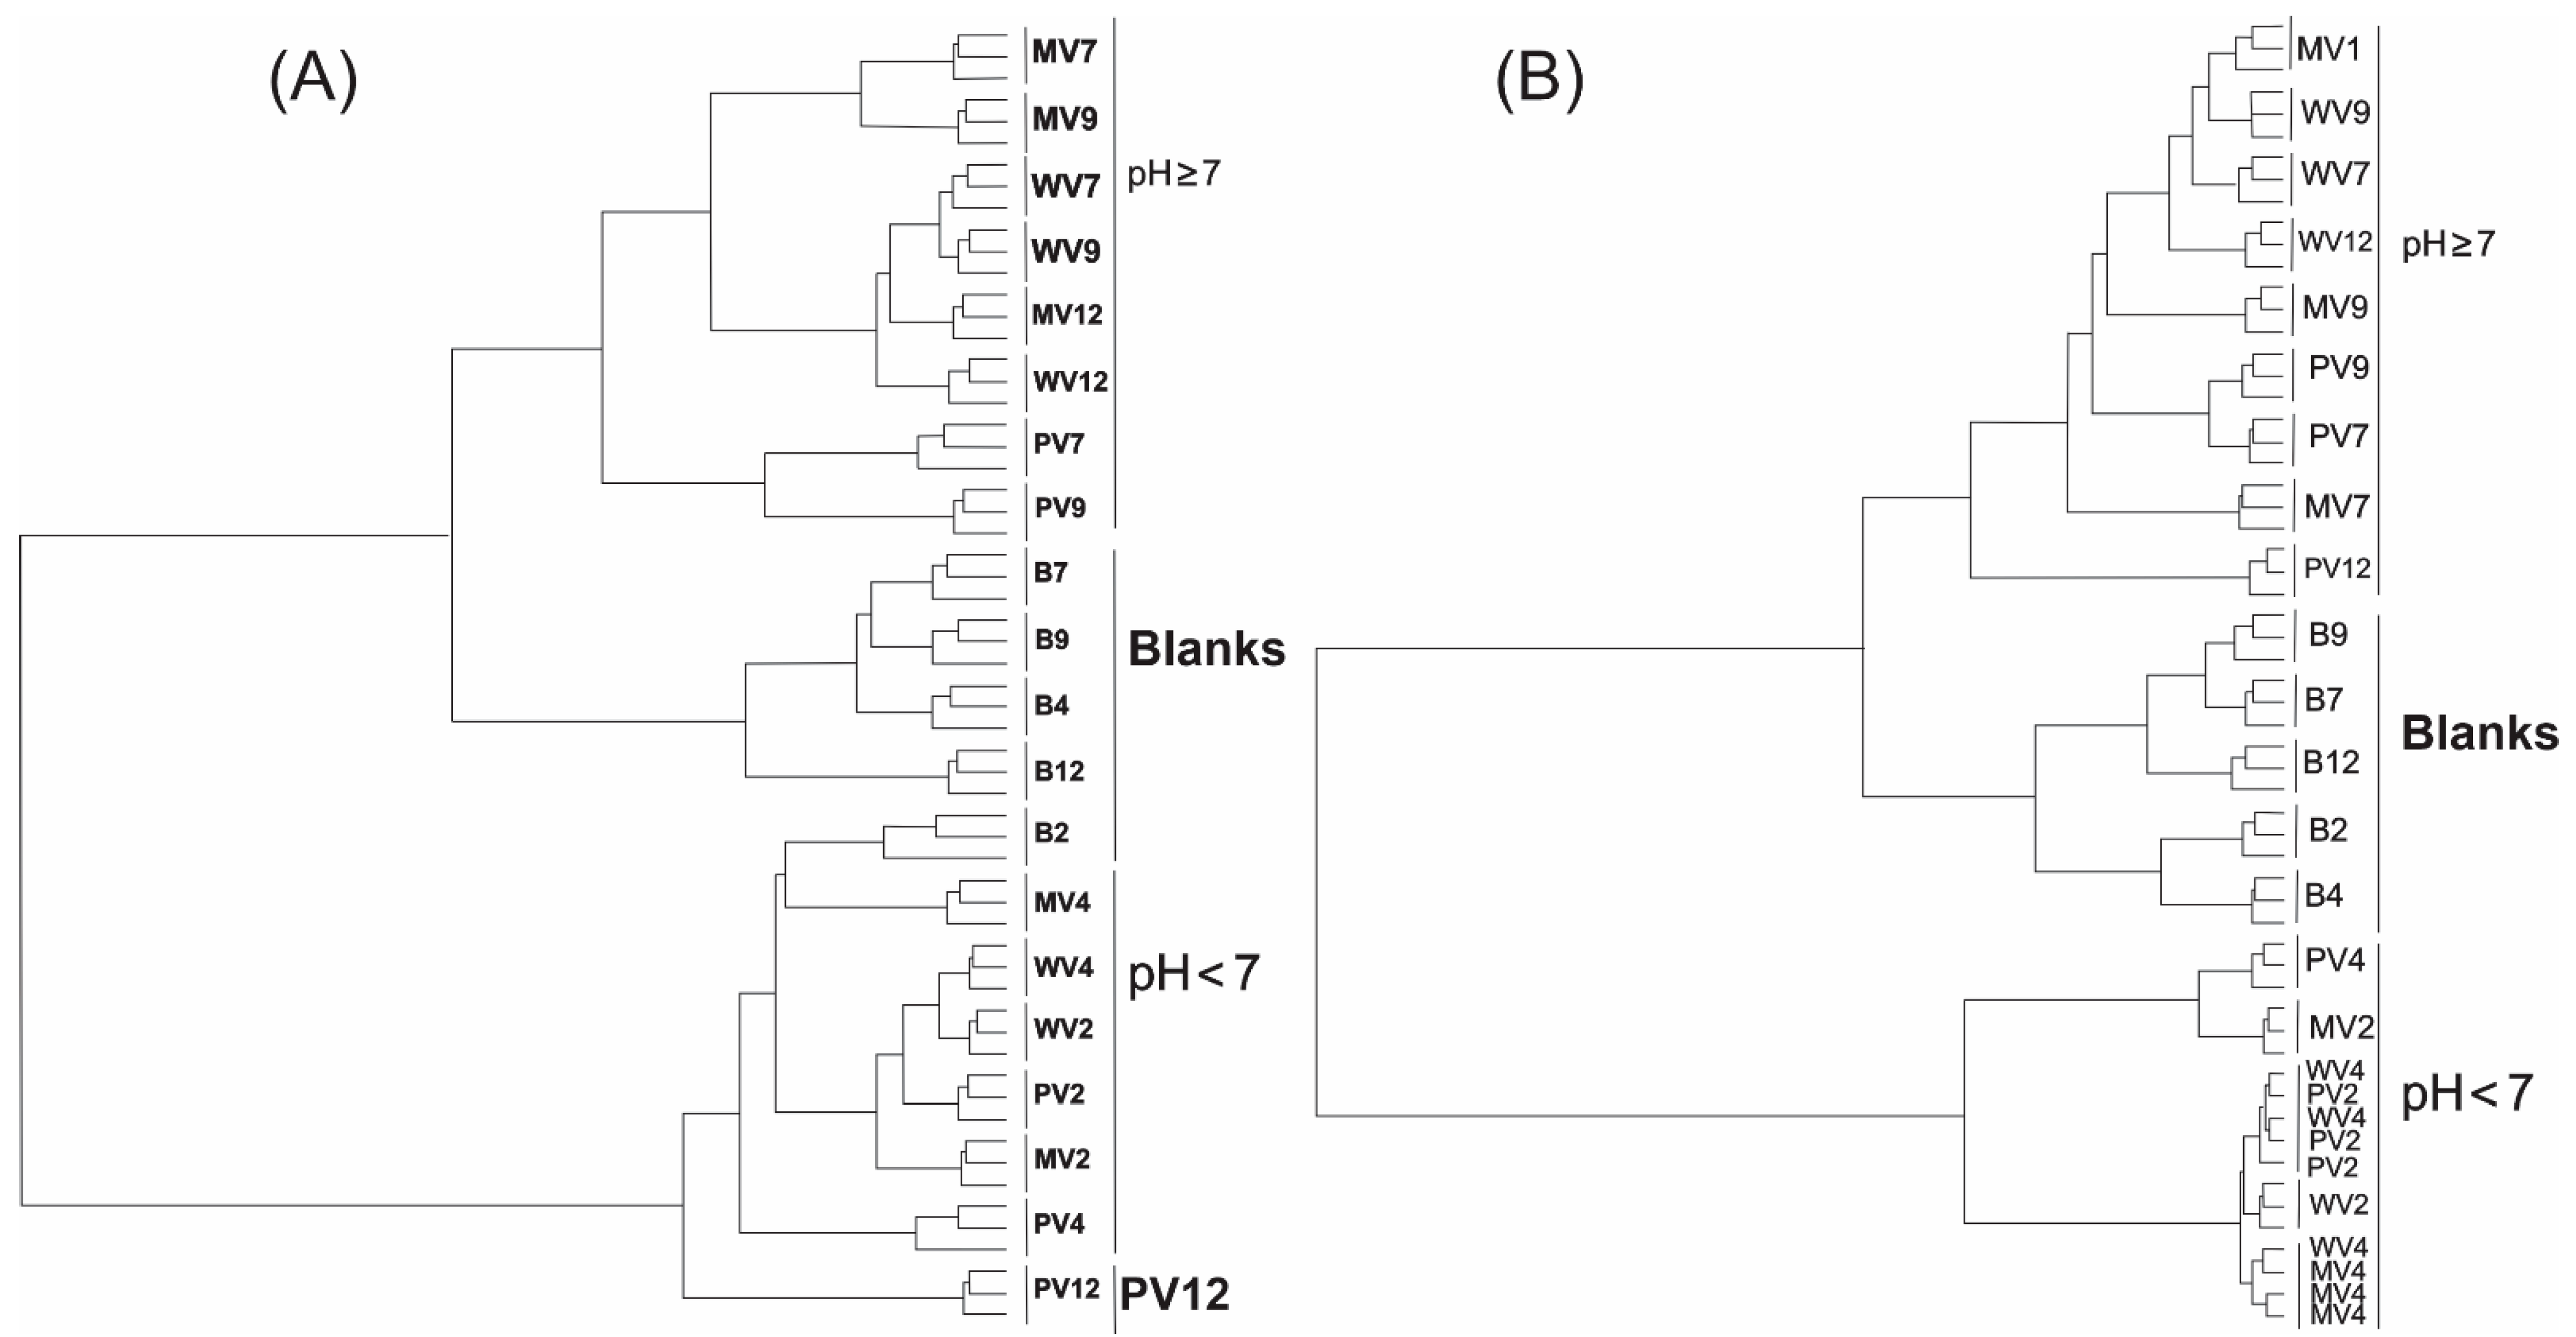
2. Results and Discussion
3. Materials and Methods
3.1. Endophytic Fungus
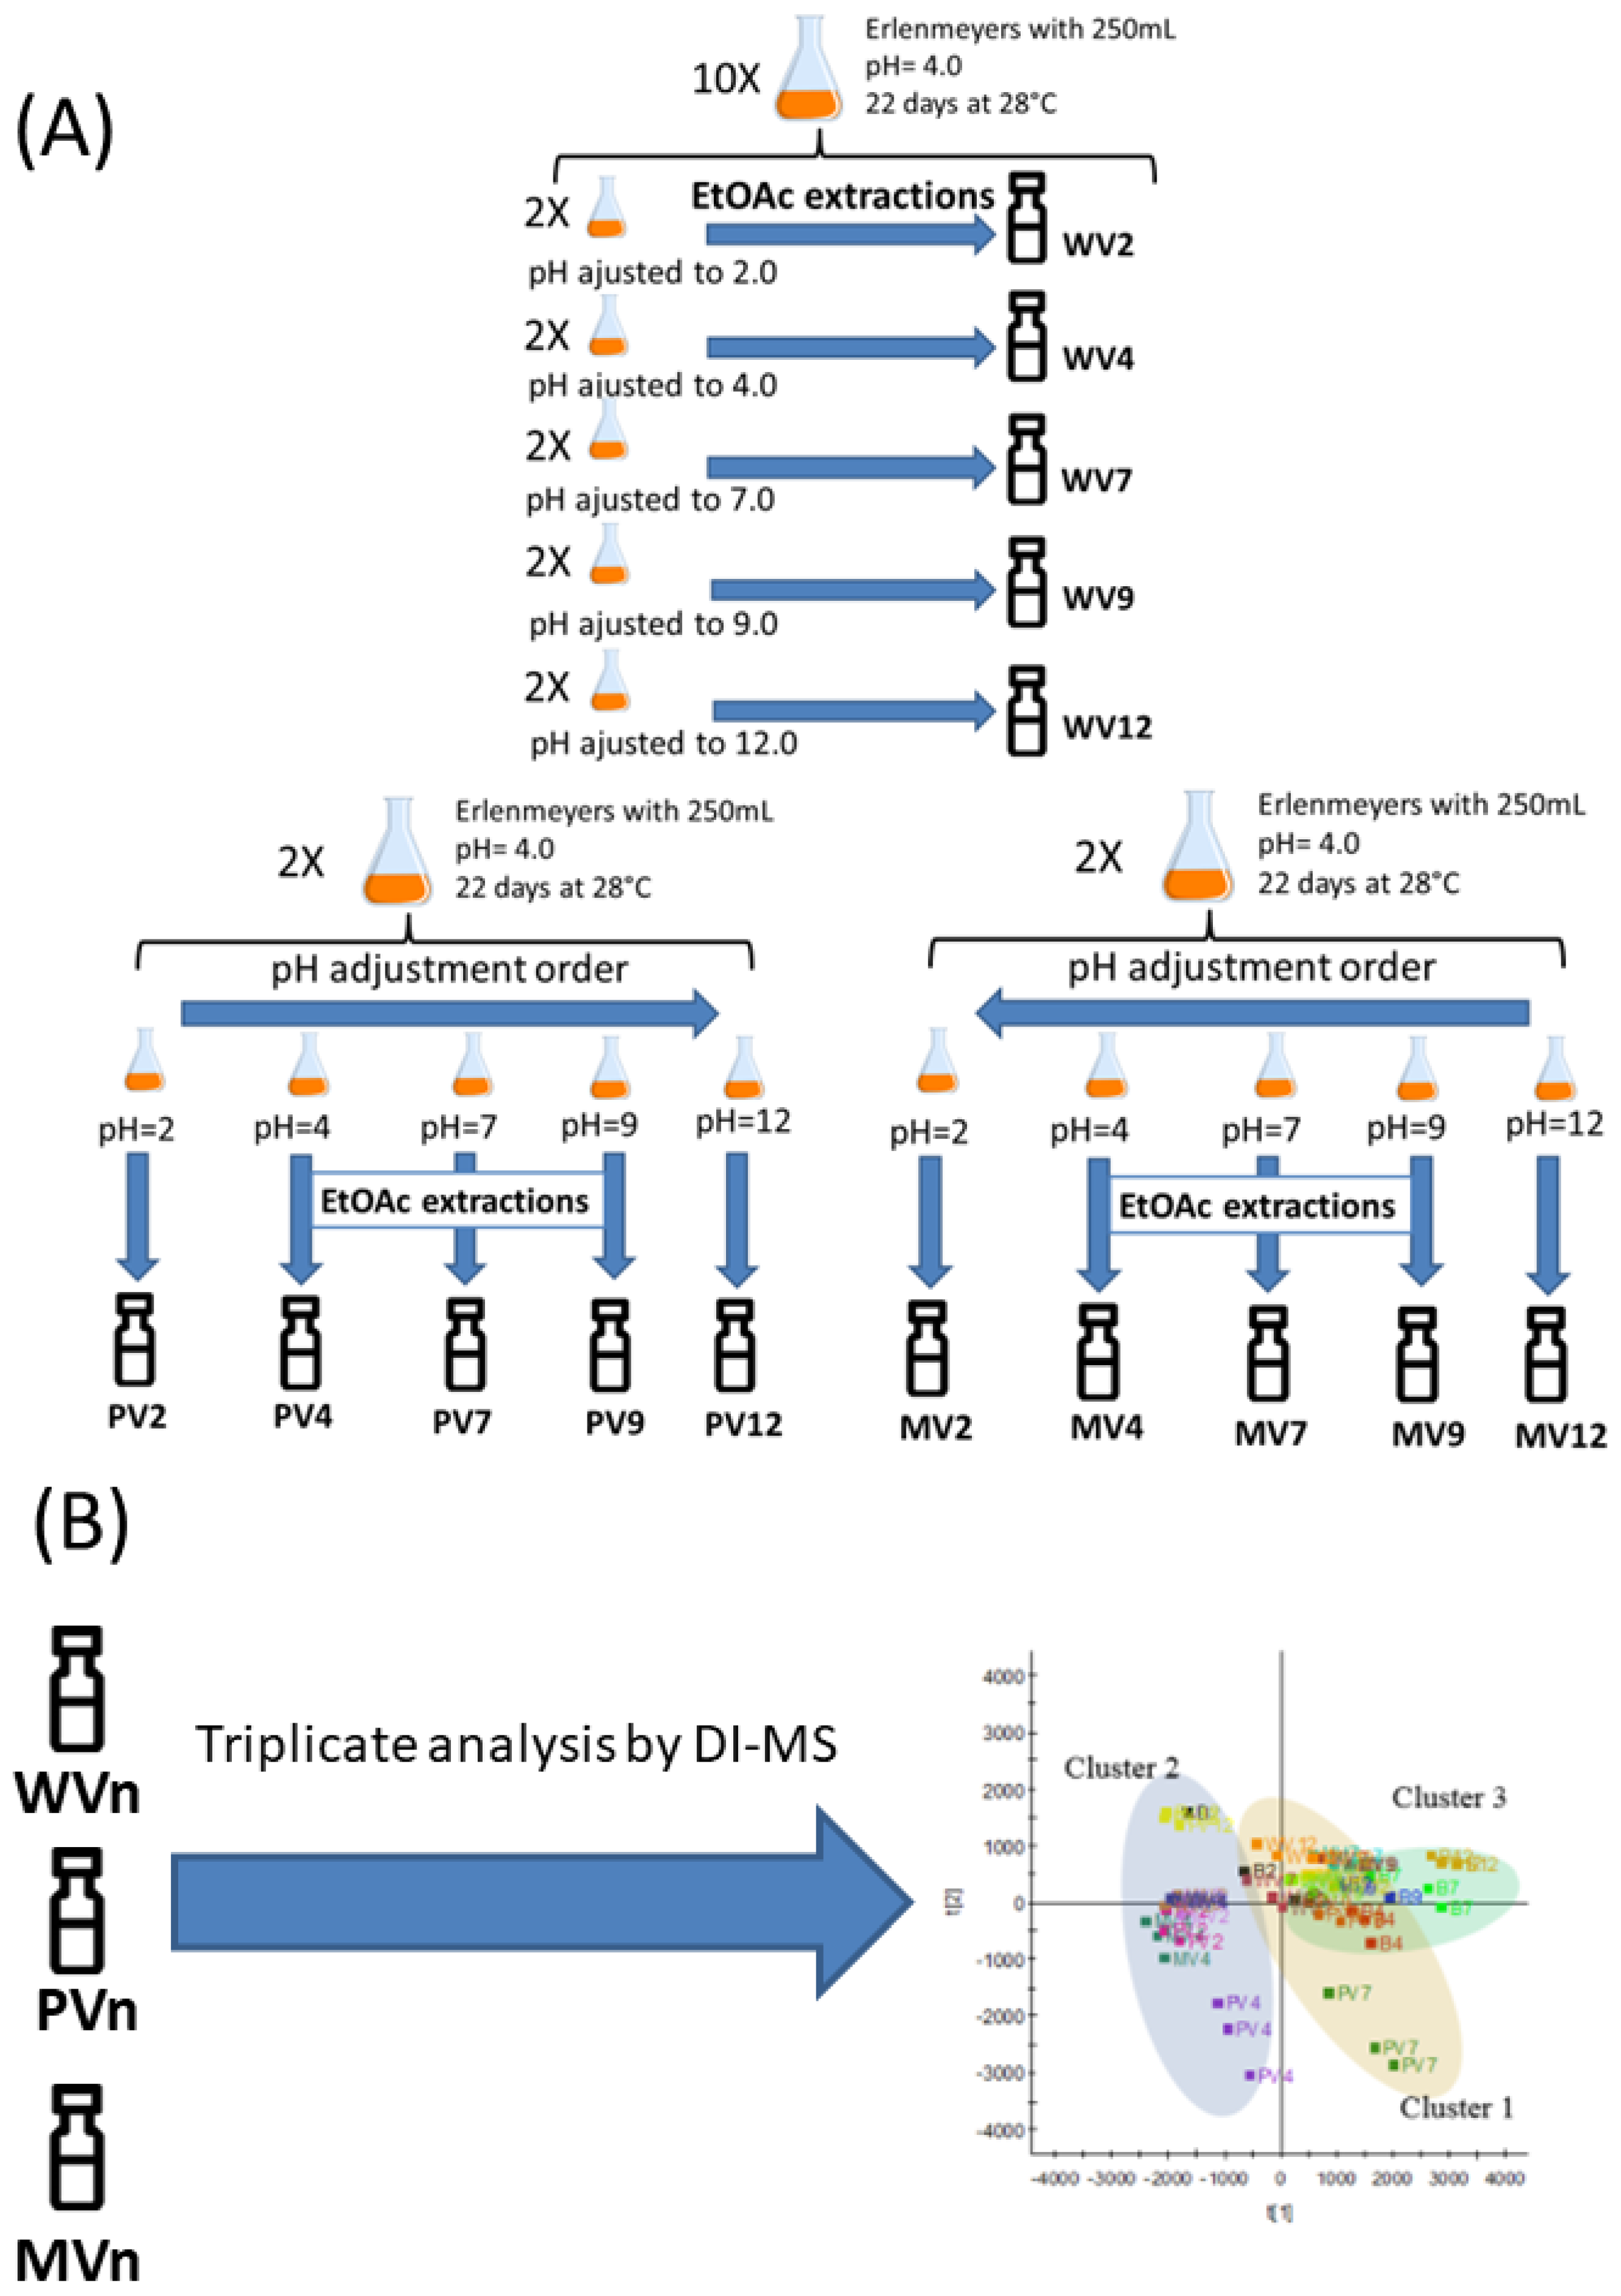
3.2. Fermentation
3.3. Isolating the Crude Extract after Varying the pH
3.4. Sample Preparation
3.5. Instrumentation
3.6. Data Processing and Multivariate Statistical Analysis
4. Conclusions
Supplementary Materials
Author Contributions
Funding
Institutional Review Board Statement
Informed Consent Statement
Data Availability Statement
Acknowledgments
Conflicts of Interest
References
- Pamphile, J.A.; Ribeiro, M.A.S.; Polonio, J.C. Secondary Metabolites of Endophyte Fungi: Techniques and Biotechnological Approaches. In Diversity and Benefits of Microorganisms from the Tropics, 1st ed.; Azevedo, J.L., Quecine, M.C., Eds.; Springer: Cham, Switzerland, 2017; pp. 185–206. [Google Scholar] [CrossRef]
- Schulz, B.; Boyle, C. The endophytic continuum. Mycol. Res. 2015, 109, 661–686. [Google Scholar] [CrossRef] [Green Version]
- Kusari, S.; Hertweck, C.; Spiteller, M. Chemical ecology of endophytic fungi: Origins of secondary metabolites. Chem. Biol. 2012, 19, 792–798. [Google Scholar] [CrossRef] [Green Version]
- Ludwig-Müller, J. Plants and endophytes: Equal partners in secondary metabolite production? Biotechnol. Lett. 2015, 37, 1325–1334. [Google Scholar] [CrossRef]
- Stierle, A.; Strobel, G.; Stierle, D. Taxol and taxane production by Taxomyces andreanae, an endophytic fungus of Pacific yew. Science 1993, 260, 214–221. [Google Scholar] [CrossRef]
- Schulz, B.; Boyle, C.; Draeger, S.; Römmert, A.K.; Krohn, K. Endophytic fungi: A source of novel biologically active secondary metabolites. Mycol. Res. 2002, 106, 996–1004. [Google Scholar] [CrossRef]
- Chagas, F.O.; Caraballo-Rodriguez, A.M.; Pupo, M.T. Endophytic Fungi as a Source of Novel Metabolites. In Endophytic Fungi as a Source of Novel Metabolites in Biosynthesis and Molecular Genetics of Fungal Secondary Metabolites; Martin, J.-F., Garcia-Estrada, C., Zeilinger, S., Eds.; Springer: New York, NY, USA, 2015; pp. 123–176. [Google Scholar]
- Dzoyem, J.P.; Melong, R.; Tsamo, A.T.; Maffo, T.; Kapche, D.G.; Ngadjui, B.T.; McGaw, L.J.; Eloff, J.N. Cytotoxicity, antioxidant and antibacterial activity of four compounds produced by an endophytic fungus Epicoccum nigrum associated with Entada abyssinica. Rev. Bras. Farmacogn. 2017, 27, 251–253. [Google Scholar] [CrossRef]
- Li, C.; Sarotti, A.M.; Yoshida, W.; Cao, S. Two new polyketides from Hawaiian endophytic fungus Pestalotiopsis sp. FT172. Tetrahedron Lett. 2018, 59, 42–45. [Google Scholar] [CrossRef]
- Rajivgandhi, G.; Muneeswaran, T.; Maruthupandy, M.; Ramakritinan, C.M.; Saravanan, K.; Ravikumar, V.; Manoharan, N. Antibacterial and anticancer potential of marine endophytic actinomycetes Streptomyces coeruleorubidus GRG 4 (KY457708) compound against colistin resistant uropathogens and A549 lung cancer cells. Microb. Pathog. 2018, 125, 325–335. [Google Scholar] [CrossRef]
- Rojas-Solís, D.; Zetter-Salmón, E.; Contreras-Pérez, M.; del Carmen Rocha-Granados, M.; Macías-Rodríguez, L.; Santoyo, G. Pseudomonas stutzeri E25 and Stenotrophomonas maltophilia CR71 endophytes produce antifungal volatile organic compounds and exhibit additive plant growth-promoting effects. Biocatal. Agric. Biotechnol. 2018, 13, 46–52. [Google Scholar] [CrossRef]
- Wang, A.; Li, P.; Zhang, X.; Han, P.; Lai, D.; Zhou, L. Two new anisic acid derivatives from endophytic fungus Rhizopycnis vagum Nitaf22 and their antibacterial activity. Molecules 2018, 23, 591. [Google Scholar] [CrossRef] [Green Version]
- Tan, R.X.; Zou, W.X. Endophytes: A rich source of functional metabolites. Nat. Prod. Rep. 2001, 18, 448–459. [Google Scholar] [CrossRef]
- Meng, X.; Mao, Z.; Lou, J.; Xu, L.; Zhong, L.; Peng, Y.; Zhou, L.; Wang, M. Benzopyranones from the endophytic fungus Hyalodendriella sp. Ponipodef12 and their bioactivities. Molecules 2012, 17, 11303–11314. [Google Scholar] [CrossRef]
- Yang, H.Y.; Gao, Y.H.; Niu, D.Y.; Yang, L.Y.; Gao, X.M.; Du, G.; Hu, Q.-F. Xanthone derivatives from the fermentation products of an endophytic fungus Phomopsis sp. Fitoterapia 2013, 91, 189–193. [Google Scholar] [CrossRef]
- Ye, Y.-Q.; Xia, C.-F.; Yang, J.-X.; Qin, Y.; Zhou, M.; Gao, X.-M.; Yang, H.-Y.; Li, X.-M.; Hu, Q.-F. Isocoumarins from the fermentation products of an endophytic fungus of Aspergillus versicolor. Phytochem. Lett. 2014, 10, 215–218. [Google Scholar] [CrossRef]
- Chagas, F.O.; Dias, L.G.; Pupo, M.T. New perylenequinone derivatives from the endophytic fungus Alternaria tenuissima SS77. Tetrahedron Lett. 2016, 57, 3185–3189. [Google Scholar] [CrossRef]
- Liangsakul, J.; Srisurichan, S.; Pornpakakul, S. Anthraquinone–steroids, evanthrasterol A and B, and a meroterpenoid, emericellic acid, from endophytic fungus, Emericella variecolor. Steroids 2016, 106, 78–85. [Google Scholar] [CrossRef]
- Wang, M.; Sun, Z.-H.; Chen, Y.-C.; Liu, H.-X.; Li, H.-H.; Tan, G.-H.; Li, S.-N.; Guo, X.-L.; Zhang, W.-M. Cytotoxic cochlioquinone derivatives from the endophytic fungus Bipolaris sorokiniana derived from Pogostemon cablin. Fitoterapia 2016, 110, 77–82. [Google Scholar] [CrossRef]
- Kusari, S.; Singh, S.; Jayabaskaran, C. Rethinking production of Taxol® (paclitaxel) using endophyte biotechnology. Trends biotechnol. 2014, 32, 304–311. [Google Scholar] [CrossRef]
- Schulz, B.; Sucker, J.; Aust, H.J.; Krohn, K.; Ludewig, K.; Jones, P.G.; Döring, D. Biologically active secondary metabolites of endophytic Pezicula species. Mycol. Res. 1995, 99, 1007–1015. [Google Scholar] [CrossRef]
- Taechowisan, T.; Lu, C.; Shen, Y.; Lumyong, S. Secondary metabolites from endophytic Streptomyces aureofaciens CMUAc130 and their antifungal activity. Microbiology 2005, 151, 1691–1695. [Google Scholar]
- Kjer, J.; Debbab, A.; Aly, A.H.; Proksch, P. Methods for isolation of marine-derived endophytic fungi and their bioactive secondary products. Nat. Protoc. 2010, 5, 479. [Google Scholar] [CrossRef]
- Mendonca, A.N.; Feliphe, B.H.M.P.; Lemes, R.M.L.; Ruiz, A.L.T.G.; de Carvalho, J.E.; Ikegaki, M. Potential antimicrobial and antiproliferative activity of the crude extract of the endophytic fungus Rhizoctonia sp. from Annona crassiflora. Afr. J. Pharm. Pharmacol. 2015, 9, 327–332. [Google Scholar]
- Kumar, A.; Jha, K.P.; Kumar, R.; Kumar, K.; Sedolkar, V. Antibacterial activity, phytochemical and enzyme analysis of crude extract of endophytic fungus, Alternaria sp. isolated from an ethnobotanical medicinal plant Tridax procumbens. Int. J. Pharma Phytochem. Res. 2015, 7, 1111–1115. [Google Scholar]
- Nasr, H.M.; Abdel-Ghany, R.O.; Mousa, S.A.; Alasmaey, M.; Atalla, A.A. Biological activity of crude extracts of endophytic Fusarium oxysporum and its chemical composition by gas chromatography–mass spectrometry. Elixir Org. Chem. 2018, 117, 50565–50568. [Google Scholar]
- Yu, H.; Zhang, L.; Li, L.; Zheng, C.; Guo, L.; Li, W.; Sun, P.; Qin, L. Recent developments and future prospects of antimicrobial metabolites produced by endophytes. Microbiol. Res. 2010, 165, 437–449. [Google Scholar] [CrossRef]
- Bogner, C.W.; Kamdem, R.S.; Sichtermann, G.; Matthäus, C.; Hölscher, D.; Popp, J.; Proksch, P.; Grundler, F.M.W.; Schouten, A. Bioactive secondary metabolites with multiple activities from a fungal endophyte. Microb. Biotechnol. 2017, 10, 175–188. [Google Scholar] [CrossRef]
- Maciá-Vicente, J.G.; Shi, Y.N.; Cheikh-Ali, Z.; Grün, P.; Glynou, K.; Kia, S.H.; Piepebring, M.; Bode, H.B. Metabolomics-based chemotaxonomy of root endophytic fungi for natural products discovery. Environ. Microbiol. 2018, 20, 1253–1270. [Google Scholar] [CrossRef]
- Brakhage, A.A. Regulation of fungal secondary metabolism. Nat. Rev. Microbiol. 2013, 11, 21–32. [Google Scholar] [CrossRef]
- Sharma, V.; Singamaneni, V.; Sharma, N.; Kumar, A.; Arora, A.; Kushwaha, M.; Bhushan, S.; Jaglan, S.; Gupta, P. Valproic acid induces three novel cytotoxic secondary metabolites in Diaporthe sp., an endophytic fungus from Datura inoxia Mill. Bioorg. Med. Chem. Lett. 2018, 28, 2217–2221. [Google Scholar] [CrossRef]
- Martins, C.R.; Lopes, W.A.; Andrade, J.B.D. Organic compound solubility. Quim. Nova 2013, 36, 1248–1255. [Google Scholar] [CrossRef] [Green Version]
- Nielsen, K.F.; Larsen, T.O. The importance of mass spectrometric dereplication in fungal secondary metabolite analysis. Front. Microbiol. 2015, 6, 71. [Google Scholar] [CrossRef] [Green Version]
- Polonio, J.C.; Ribeiro, M.A.S.; Rhoden, S.A.; Sarragiotto, M.H.; Azevedo, J.L.; Pamphile, J.A. 3-Nitropropionic acid production by the endophytic Diaporthe citri: Molecular taxonomy, chemical characterization, and quantification under pH variation. Fungal Biol. 2016, 120, 1600–1608. [Google Scholar] [CrossRef]
- Chong, J.; Soufan, O.; Li, C.; Caraus, I.; Li, S.; Bourque, G.; Wishart, D.S.; Xia, J. MetaboAnalyst 4.0: Towards more transparent and integrative metabolomics analysis. Nucleic Acids Res. 2018, 46, w486–w494. [Google Scholar] [CrossRef] [Green Version]
- Aksenov, A.A.; da Silva, R.; Knight, R.; Lopes, N.P.; Dorrestein, P.C. Global chemical analysis of biology by mass spectrometry. Nat. Rev. Chem. 2017, 1, 0054. [Google Scholar] [CrossRef]
- Eriksson, L.; Johansson, E.; Kettaneh-Wold, N.; Wikström, C.; Wold, S. Design of Experiments: Principles and Applications; Umetrics: Umeå, Sweden, 2008. [Google Scholar]
- Rundberget, T.; Skaar, I.; O’brien, O.; Flåøyen, A. Penitrem and thomitrem formation by Penicillium crustosum. Mycopathologia 2004, 157, 349–357. [Google Scholar] [CrossRef]
- Månsson, M.; Phipps, R.K.; Gram, L.; Munro, M.H.; Larsen, T.O.; Nielsen, K.F. Explorative solid-phase extraction (E-SPE) for accelerated microbial natural product discovery, dereplication, and purification. J. Nat. Prod. 2010, 73, 1126–1132. [Google Scholar] [CrossRef]
- Li, Q.; Wang, D.; Wu, Y.; Li, W.; Zhang, Y.; Xing, J.; Su, Z. One step recovery of succinic acid from fermentation broths by crystallization. Sep. Purif. Technol. 2010, 72, 294–300. [Google Scholar] [CrossRef]
- Gao, Z.; Shen, P.; Lan, Y.; Cui, L.; Ohm, J.B.; Chen, B.; Rao, J. Effect of alkaline extraction pH on structure properties, solubility, and beany flavor of yellow pea protein isolate. Food Res. Int. 2020, 131, 109045. [Google Scholar] [CrossRef]
- Pelo, S.P.; Adebo, O.A.; Green, E. Chemotaxonomic profiling of fungal endophytes of Solanum mauritianum (alien weed) using gas chromatography high resolution time-of-flight mass spectrometry (GC-HRTOF-MS). Metabolomics 2021, 17, 43. [Google Scholar] [CrossRef]
- Want, E.J.; O’Maille, G.; Smith, C.A.; Brandon, T.R.; Uritboonthai, W.; Qin, C.; Trauger, S.A.; Siuzdak, G. Solvent-dependent metabolite distribution, clustering, and protein extraction for serum profiling with mass spectrometry. Anal. Chem. 2006, 78, 743–752. [Google Scholar] [CrossRef]
- Frisvad, J.C.; Andersen, B.; Thrane, U. The use of secondary metabolite profiling in chemotaxonomy of filamentous fungi. Mycol. Res. 2008, 112, 231–240. [Google Scholar] [CrossRef]
- Aliferis, K.A.; Cubeta, M.A. Chemotaxonomy of fungi in the Rhizoctonia solani species complex performing GC/MS metabolite profiling. Metabolomics 2013, 9, S159–S169. [Google Scholar] [CrossRef]
- El Omari, N.; Guaouguaou, F.E.; Bouyahya, A. Natural Bioactive Compounds from Medicinal Plants as Antibacterial Drugs: Mechanism Insights and Clinical Perspectives. Curr. Top. Med. Chem. 2022, 22, 1093–1103. [Google Scholar] [CrossRef]
- De Simeis, D.; Serra, S. Actinomycetes: A never-ending source of bioactive compounds—An overview on antibiotics production. Antibiotics 2021, 10, 483. [Google Scholar] [CrossRef]
- Rani, A.; Saini, K.C.; Bast, F.; Varjani, S.; Mehariya, S.; Bhatia, S.K.; Sharma, N.; Funk, C. A review on microbial products and their perspective application as antimicrobial agents. Biomolecules 2021, 11, 1860. [Google Scholar] [CrossRef]
- Jude, S.; Gopi, S. Dereplication: HRMS in Phytochemical Analysis. In High-Resolution Mass Spectroscopy for Phytochemical Analysis; Gopi, S., Amalraj, A., Jude, S., Eds.; Apple Academic Press: Waretown, NJ, USA, 2021; pp. 45–66. [Google Scholar]

Publisher’s Note: MDPI stays neutral with regard to jurisdictional claims in published maps and institutional affiliations. |
© 2022 by the authors. Licensee MDPI, Basel, Switzerland. This article is an open access article distributed under the terms and conditions of the Creative Commons Attribution (CC BY) license (https://creativecommons.org/licenses/by/4.0/).
Share and Cite
Polonio, J.C.; Ribeiro, M.A.d.S.; Fávaro-Polonio, C.Z.; Meurer, E.C.; Azevedo, J.L.; Golias, H.C.; Pamphile, J.A. Differential Chemical Profile of Metabolite Extracts Produced by the Diaporthe citri (G-01) Endophyte Mediated by Varying the Fermented Broth pH. Metabolites 2022, 12, 692. https://doi.org/10.3390/metabo12080692
Polonio JC, Ribeiro MAdS, Fávaro-Polonio CZ, Meurer EC, Azevedo JL, Golias HC, Pamphile JA. Differential Chemical Profile of Metabolite Extracts Produced by the Diaporthe citri (G-01) Endophyte Mediated by Varying the Fermented Broth pH. Metabolites. 2022; 12(8):692. https://doi.org/10.3390/metabo12080692
Chicago/Turabian StylePolonio, Julio Cesar, Marcos Alessandro dos Santos Ribeiro, Cintia Zani Fávaro-Polonio, Eduardo Cesar Meurer, João Lúcio Azevedo, Halison Correia Golias, and João Alencar Pamphile. 2022. "Differential Chemical Profile of Metabolite Extracts Produced by the Diaporthe citri (G-01) Endophyte Mediated by Varying the Fermented Broth pH" Metabolites 12, no. 8: 692. https://doi.org/10.3390/metabo12080692
APA StylePolonio, J. C., Ribeiro, M. A. d. S., Fávaro-Polonio, C. Z., Meurer, E. C., Azevedo, J. L., Golias, H. C., & Pamphile, J. A. (2022). Differential Chemical Profile of Metabolite Extracts Produced by the Diaporthe citri (G-01) Endophyte Mediated by Varying the Fermented Broth pH. Metabolites, 12(8), 692. https://doi.org/10.3390/metabo12080692