
A Comprehensive Study to Identify Major Metabolites of an Amoxicillin–Sulbactam Hybrid Molecule in Rats and Its Metabolic Pathway Using UPLC-Q-TOF-MS/MS

Abstract
1. Introduction
2. Materials and Methods
2.1. Materials
2.1.1. Drugs and Reagents
2.1.2. Instruments
2.1.3. Solution Preparation
2.2. Metabolites of AS in Rats
2.2.1. Animal Tests
2.2.2. Sample Pretreatment
2.2.3. Liquid Chromatography Conditions
2.2.4. Mass Spectrometry Conditions
3. Results and Discussion
3.1. Metabolism of Heterozygous Molecules
3.2. UPLC-Q-TOF-MS/MS Analysis of Standards
3.3. Metabolites in Different Tissues
3.4. In Vivo Metabolism Results
4. Discussion
5. Conclusions
Author Contributions
Funding
Institutional Review Board Statement
Informed Consent Statement
Data Availability Statement
Conflicts of Interest
Appendix A


References
- Allen, H.K.; Looft, T.; Bayles, D.O.; Humphrey, S.; Levine, U.Y.; Alt, D.; Stanton, T.B. Antibiotics in feed induce prophages in swine fecal microbiomes. mBio 2011, 2, e00260-11. [Google Scholar] [CrossRef] [PubMed]
- Soliman, A.M.; Abu-Basha, E.A.; Youssef, S.A.; Amer, A.M.; Murphy, P.A.; Hauck, C.C.; Gehring, R.; Hsu, W.H. Effect of chronic lead intoxication on the distribution and elimination of amoxicillin in goats. J. Vet. Sci. 2013, 14, 395–403. [Google Scholar] [CrossRef] [PubMed]
- Papich, M.G. Pharmacokinetic-pharmacodynamic values for amoxicillin in pigs. Am. J. Vet. Res. 2014, 75, 316. [Google Scholar] [CrossRef] [PubMed]
- Scaglione, F.; Lucini, V.; Dugnani, S.; Pani, A. Comparative Emergence of Resistance to Clofoctol, Erythromycin, and Amoxicillin against Community-Acquired Bacterial Respiratory Tract Pathogens in Italy. Chemotherapy 2018, 63, 330–337. [Google Scholar] [CrossRef]
- Mendonça, S.; Ecclissato, C.; Sartori, M.S.; Godoy, A.P.; Guerzoni, R.A.; Degger, M.; Pedrazzoli, J., Jr. Prevalence of Helicobacter pylori resistance to metronidazole, clarithromycin, amoxicillin, tetracycline, and furazolidone in Brazil. Helicobacter 2000, 5, 79–83. [Google Scholar] [CrossRef]
- Chen, M.J.; Wu, M.S.; Chen, C.C.; Chen, C.C.; Fang, Y.J.; Bair, M.J.; Chang, C.Y.; Lee, J.Y.; Hsu, W.F.; Luo, J.C.; et al. Impact of amoxicillin resistance on the efficacy of amoxicillin-containing regimens for Helicobacter pylori eradication: Analysis of five randomized trials. J. Antimicrob. Chemother. 2017, 72, 3481–3489. [Google Scholar] [CrossRef]
- Georgopapadakou, N.H.; Bertasso, A.; Chan, K.K.; Chapman, J.S.; Cleeland, R.; Cummings, L.M.; Dix, B.A.; Keith, D.D. Mode of action of the dual-action cephalosporin Ro 23-9424. Antimicrob. Agents Chemother. 1989, 33, 1067–1071. [Google Scholar] [CrossRef]
- Beskid, G.; Siebelist, J.; McGarry, C.M.; Cleeland, R.; Chan, K.; Keith, D.D. In vivo evaluation of a dual-action antibacterial, Ro 23-9424, compared to cefotaxime and fleroxacin. Chemotherapy 1990, 36, 109–116. [Google Scholar] [CrossRef]
- Cristancho Ortiz, C.J.; de Freitas Silva, M.; Pruccoli, L.; Fonseca Nadur, N.; de Azevedo, L.L.; Kümmerle, A.E.; Guedes, I.A.; Dardenne, L.E.; Leomil Coelho, L.F.; Guimarães, M.J.; et al. Design, synthesis, and biological evaluation of new thalidomide-donepezil hybrids as neuroprotective agents targeting cholinesterases and neuroinflammation. RSC Med. Chem. 2022, 13, 568–584. [Google Scholar] [CrossRef]
- Hara, K.; Kobayashi, H. Sultamicillin experiences in the field of internal medicine. APMIS Suppl. 1989, 5, 51–56. [Google Scholar]
- Lode, H.; Hampel, B.; Bruckner, G.; Koeppe, P. The pharmacokinetics of sultamicillin. APMIS Suppl. 1989, 5, 17–22. [Google Scholar] [PubMed]
- Durkan, K.; Tuncel, A.; Yurt, F. In vitro evaluation of (99m) Tc-sultamicillin for infection imaging. Biopharm. Drug Dispos. 2021, 42, 285–293. [Google Scholar] [CrossRef] [PubMed]
- Jasys, V.J. Process for the Preparation of Penicillanic Acid Esters. DE Invention Patent DE3270720, 28 May 1986. [Google Scholar]
- Bigham, E.C. Bis-Esters of Methanediol with Penicillins and Penicillanic Acid 1,1-Dioxide. US Invention Patent US4377524, 22 March 1983. [Google Scholar]
- Park, K.; Williams, D.P.; Naisbitt, D.J.; Kitteringham, N.R.; Pirmohamed, M. Investigation of toxic metabolites during drug development. Toxicol. Appl. Pharmacol. 2005, 207, 425–434. [Google Scholar] [CrossRef] [PubMed]
- Wen, B.; Fitch, W.L. Analytical strategies for the screening and evaluation of chemically reactive drug metabolites. Expert Opin. Drug Metab. Toxicol. 2009, 5, 39–55. [Google Scholar] [CrossRef] [PubMed]
- Schleiff, M.A.; Dhaware, D.; Sodhi, J.K. Recent advances in computational metabolite structure predictions and altered metabolic pathways assessment to inform drug development processes. Drug Metab. Rev. 2021, 53, 173–187. [Google Scholar] [CrossRef]
- Prakash, C.; Shaffer, C.L.; Nedderman, A. Analytical strategies for identifying drug metabolites. Mass Spectrom. Rev. 2007, 26, 340–369. [Google Scholar] [CrossRef]
- Rincon Nigro, M.E.; Du, T.; Gao, S.; Kaur, M.; Xie, H.; Olaleye, O.A.; Liang, D. Metabolite Identification of a Novel Anti-Leishmanial Agent OJT007 in Rat Liver Microsomes Using LC-MS/MS. Molecules 2022, 27, 2854. [Google Scholar] [CrossRef]
- Manzo, L.; Costa, L.G.; Tonini, M.; Minoia, C.; Sabbioni, E. Metabolic studies as a basis for the interpretation of metal toxicity. Toxicol. Lett. 1992, 64–65, 677–686. [Google Scholar] [CrossRef]
- Martignoni, M.; Groothuis, G.M.; de Kanter, R. Species differences between mouse, rat, dog, monkey and human CYP-mediated drug metabolism, inhibition and induction. Expert Opin. Drug Metab. Toxicol. 2006, 2, 875–894. [Google Scholar] [CrossRef]
- Prueksaritanont, T.; Lin, J.H.; Baillie, T.A. Complicating factors in safety testing of drug metabolites: Kinetic differences between generated and preformed metabolites. Toxicol. Appl. Pharmacol. 2006, 217, 143–152. [Google Scholar] [CrossRef]
- Stout, P.R.; Bynum, N.D.; Mitchell, J.M.; Baylor, M.R.; Ropero-Miller, J.D. A comparison of the validity of gas chromatography- mass spectrometry and liquid chromatography-tandem mass spectrometry analysis of urine samples for morphine, codeine, 6-acetylmorphine, and benzoylecgonine. J. Anal. Toxicol. 2009, 33, 398–408. [Google Scholar] [CrossRef] [PubMed]
- Pozo, O.J.; van Thuyne, W.; Deventer, K.; van Eenoo, P.; Delbeke, F.T. Elucidation of urinary metabolites of fluoxymesterone by liquid chromatography-tandem mass spectrometry and gas chromatography-mass spectrometry. J. Mass Spectrom. 2008, 43, 394–408. [Google Scholar] [CrossRef]
- Farag, M.A.; Khaled, S.E.; El Gingeehy, Z.; Shamma, S.N.; Zayed, A. Comparative Metabolite Profiling and Fingerprinting of Medicinal Cinnamon Bark and Its Commercial Preparations via a Multiplex Approach of GC–MS, UV, and NMR Techniques. Metabolites 2022, 12, 614. [Google Scholar] [CrossRef]
- Hoffmann, N.; Mayer, G.; Has, C.; Kopczynski, D.; Al Machot, F.; Schwudke, D.; Ahrends, R.; Marcus, K.; Eisenacher, M.; Turewicz, M. A Current Encyclopedia of Bioinformatics Tools, Data Formats and Resources for Mass Spectrometry Lipidomics. Metabolites 2022, 12, 584. [Google Scholar] [CrossRef]
- Baillie, T.A. Approaches to the assessment of stable and chemically reactive drug metabolites in early clinical trials. Chem. Res. Toxicol. 2009, 22, 263–266. [Google Scholar] [CrossRef]
- Maekawa, M.; Mano, N. Cutting-edge LC-MS/MS applications in clinical mass spectrometry: Focusing on analysis of drugs and metabolites. Biomed. Chromatogr. 2022, 36, e5347. [Google Scholar] [CrossRef] [PubMed]
- Rousu, T.; Herttuainen, J.; Tolonen, A. Comparison of triple quadrupole, hybrid linear ion trap triple quadrupole, time-of-flight and LTQ-Orbitrap mass spectrometers in drug discovery phase metabolite screening and identification in vitro—Amitriptyline and verapamil as model compounds. Rapid Commun. Mass Spectrom. 2010, 24, 939–957. [Google Scholar] [CrossRef] [PubMed]
- Berger, U.; Langlois, I.; Oehme, M.; Kallenborn, R. Comparison of three types of mass spectrometers for HPLC/MS analysis of perfluoroalkylated substances and fluorotelomer alcohols. Eur. J. Mass Spectrom. 2004, 10, 579–588. [Google Scholar] [CrossRef]
- Tlhapi, D.B.; Ramaite, I.D.I.; Anokwuru, C.P. Metabolomic Profiling and Antioxidant Activities of Breonadia salicina Using (1)H-NMR and UPLC-QTOF-MS Analysis. Molecules 2021, 26, 6707. [Google Scholar] [CrossRef]
- Xie, C.; Zhong, D.; Yu, K.; Chen, X. Recent advances in metabolite identification and quantitative bioanalysis by LC-Q-TOF MS. Bioanalysis 2012, 4, 937–959. [Google Scholar] [CrossRef]
- Balcerzak, M. An overview of analytical applications of time of flight-mass spectrometric (TOF-MS) analyzers and an inductively coupled plasma-TOF-MS technique. Anal. Sci. 2003, 19, 979–989. [Google Scholar] [CrossRef] [PubMed]
- Rogers, H.J.; Bradbrook, I.D.; Morrison, P.J.; Spector, R.G.; Cox, D.A.; Lees, L.J. Pharmacokinetics and bioavailability of sultamicillin estimated by high performance liquid chromatography. J. Antimicrob. Chemother. 1983, 11, 435–445. [Google Scholar] [CrossRef] [PubMed]
- Friedel, H.A.; Campoli-Richards, D.M.; Goa, K.L. Sultamicillin. A review of its antibacterial activity, pharmacokinetic properties and therapeutic use. Drugs 1989, 37, 491–522. [Google Scholar] [CrossRef] [PubMed]
- De, B.S.; Cherlet, M.; Baert, K.; De, B.P. Quantitative analysis of amoxycillin and its major metabolites in animal tissues by liquid chromatography combined with electrospray ionization tandem mass spectrometry. Anal. Chem. 2002, 74, 1393–1401. [Google Scholar] [CrossRef] [PubMed]
- Liu, Y.N.; Pang, M.D.; Xie, X.; Xie, K.Z.; Cui, L.L.; Gao, Q.; Liu, J.Y.; Wang, B.; Zhang, Y.Y.; Wang, R.; et al. Residue depletion of amoxicillin and its major metabolites in eggs. J. Vet. Pharmacol. Ther. 2017, 40, 383–391. [Google Scholar] [CrossRef]
- English, A.R.; Girard, D.; Haskell, S.L. Pharmacokinetics of sultamicillin in mice, rats, and dogs. Antimicrob. Agents Chemother. 1984, 25, 599–602. [Google Scholar] [CrossRef]
- Peng, L.; Wang, X.; Dang, H. Simultaneous determination of meropenem and imipenem in rat plasma by LC-MS/MS and its application to a pharmacokinetic study. Biomed. Chromatogr. 2021, 35, e5185. [Google Scholar] [CrossRef]
- Frański, R.; Czerniel, J.; Kowalska, M.; Frańska, M. Electrospray ionization collision-induced dissociation tandem mass spectrometry of amoxicillin and ampicillin and their degradation products. Rapid Commun. Mass Spectrom. 2014, 28, 713–722. [Google Scholar] [CrossRef]
- Suwanrumpha, S.; Flory, D.A.; Freas, R.B.; Vestal, M.L. Tandem mass spectrometric studies of the fragmentation of penicillins and their metabolites. Biomed. Environ. Mass Spectrom. 1988, 16, 381–386. [Google Scholar] [CrossRef]
- Jung, Y.J.; Kim, W.G.; Yoon, Y.; Kang, J.W.; Hong, Y.M.; Kim, H.W. Removal of amoxicillin by UV and UV/H2O2 processes. Sci. Total Environ. 2012, 420, 160–167. [Google Scholar] [CrossRef]
- Liu, C.; Wang, H.; Jiang, Y.; Du, Z. Rapid and simultaneous determination of amoxicillin, penicillin G, and their major metabolites in bovine milk by ultra-high-performance liquid chromatography-tandem mass spectrometry. J. Chromatogr. B 2011, 879, 533–540. [Google Scholar] [CrossRef] [PubMed]
- Gorissen, B.; Reyns, T.; Devreese, M.; de Backer, P.; van Loco, J.; Croubels, S. Determination of selected veterinary antimicrobials in poultry excreta by UHPLC-MS/MS, for application in Salmonella control programs. Anal. Bioanal. Chem. 2015, 407, 4447–4457. [Google Scholar] [CrossRef] [PubMed]
- Nägele, E.; Moritz, R. Structure elucidation of degradation products of the antibiotic amoxicillin with ion trap MS(n) and accurate mass determination by ESI TOF. J. Am. Soc. Mass Spectrom. 2005, 16, 1670–1676. [Google Scholar] [CrossRef] [PubMed]
- Li, P.; Zhang, Y.D.; Li, S.L.; Wen, F.; Li, H.Y.; Zhao, S.G.; Zheng, N.; Wang, J.Q. Determination of sulbactam in raw bovine milk by isotope dilution-ultra-high-performance liquid chromatography-tandem mass spectrometry. J. Dairy Sci. 2019, 102, 9605–9610. [Google Scholar] [CrossRef]
- Parker, S.L.; Adnan, S.; Ordóñez Meija, J.L.; Paterson, D.L.; Lipman, J.; Roberts, J.A.; Wallis, S.C. An UHPLC-MS/MS method for the simultaneous determination of ampicillin and sulbactam in human plasma and urine. Bioanalysis 2015, 7, 2311–2319. [Google Scholar] [CrossRef]
- Nalbant, D.; Reeder, J.A.; Li, P.; O’Sullivan, C.T.; Rogers, W.K.; An, G. Development and validation of a simple and sensitive LC-MS/MS method for quantification of ampicillin and sulbactam in human plasma and its application to a clinical pharmacokinetic study. J. Pharm. Biomed. Anal. 2021, 196, 113899. [Google Scholar] [CrossRef]


| Time (min) | Rate of Flow (μL/min) | A (%) | B (%) |
|---|---|---|---|
| 0.0 3.0 | 300 300 | 5 10 | 95 90 |
| 16.0 | 300 | 30 | 70 |
| 18.0 | 300 | 75 | 25 |
| 19.0 | 300 | 90 | 10 |
| 21.0 25.0 | 300 300 | 5 5 | 95 95 |
| Compound | Molecular Formula | Retention Time (min) | The Measured Values (Da) | The Quality of Error (ppm) | Distribution (Location) | Fragment Ions |
|---|---|---|---|---|---|---|
| AS | [C25H31N4O10S2+H]+ | 11.7 | 611.1478 | 0.32 | — | 594, 456, 331, 208, 114, |
| AMO | [C16H20N3O5S+H]+ | 2.5 | 366.1117 | 1.97 | P, U, L, K | 349, 321, 234, 208, 160, 114, 70 |
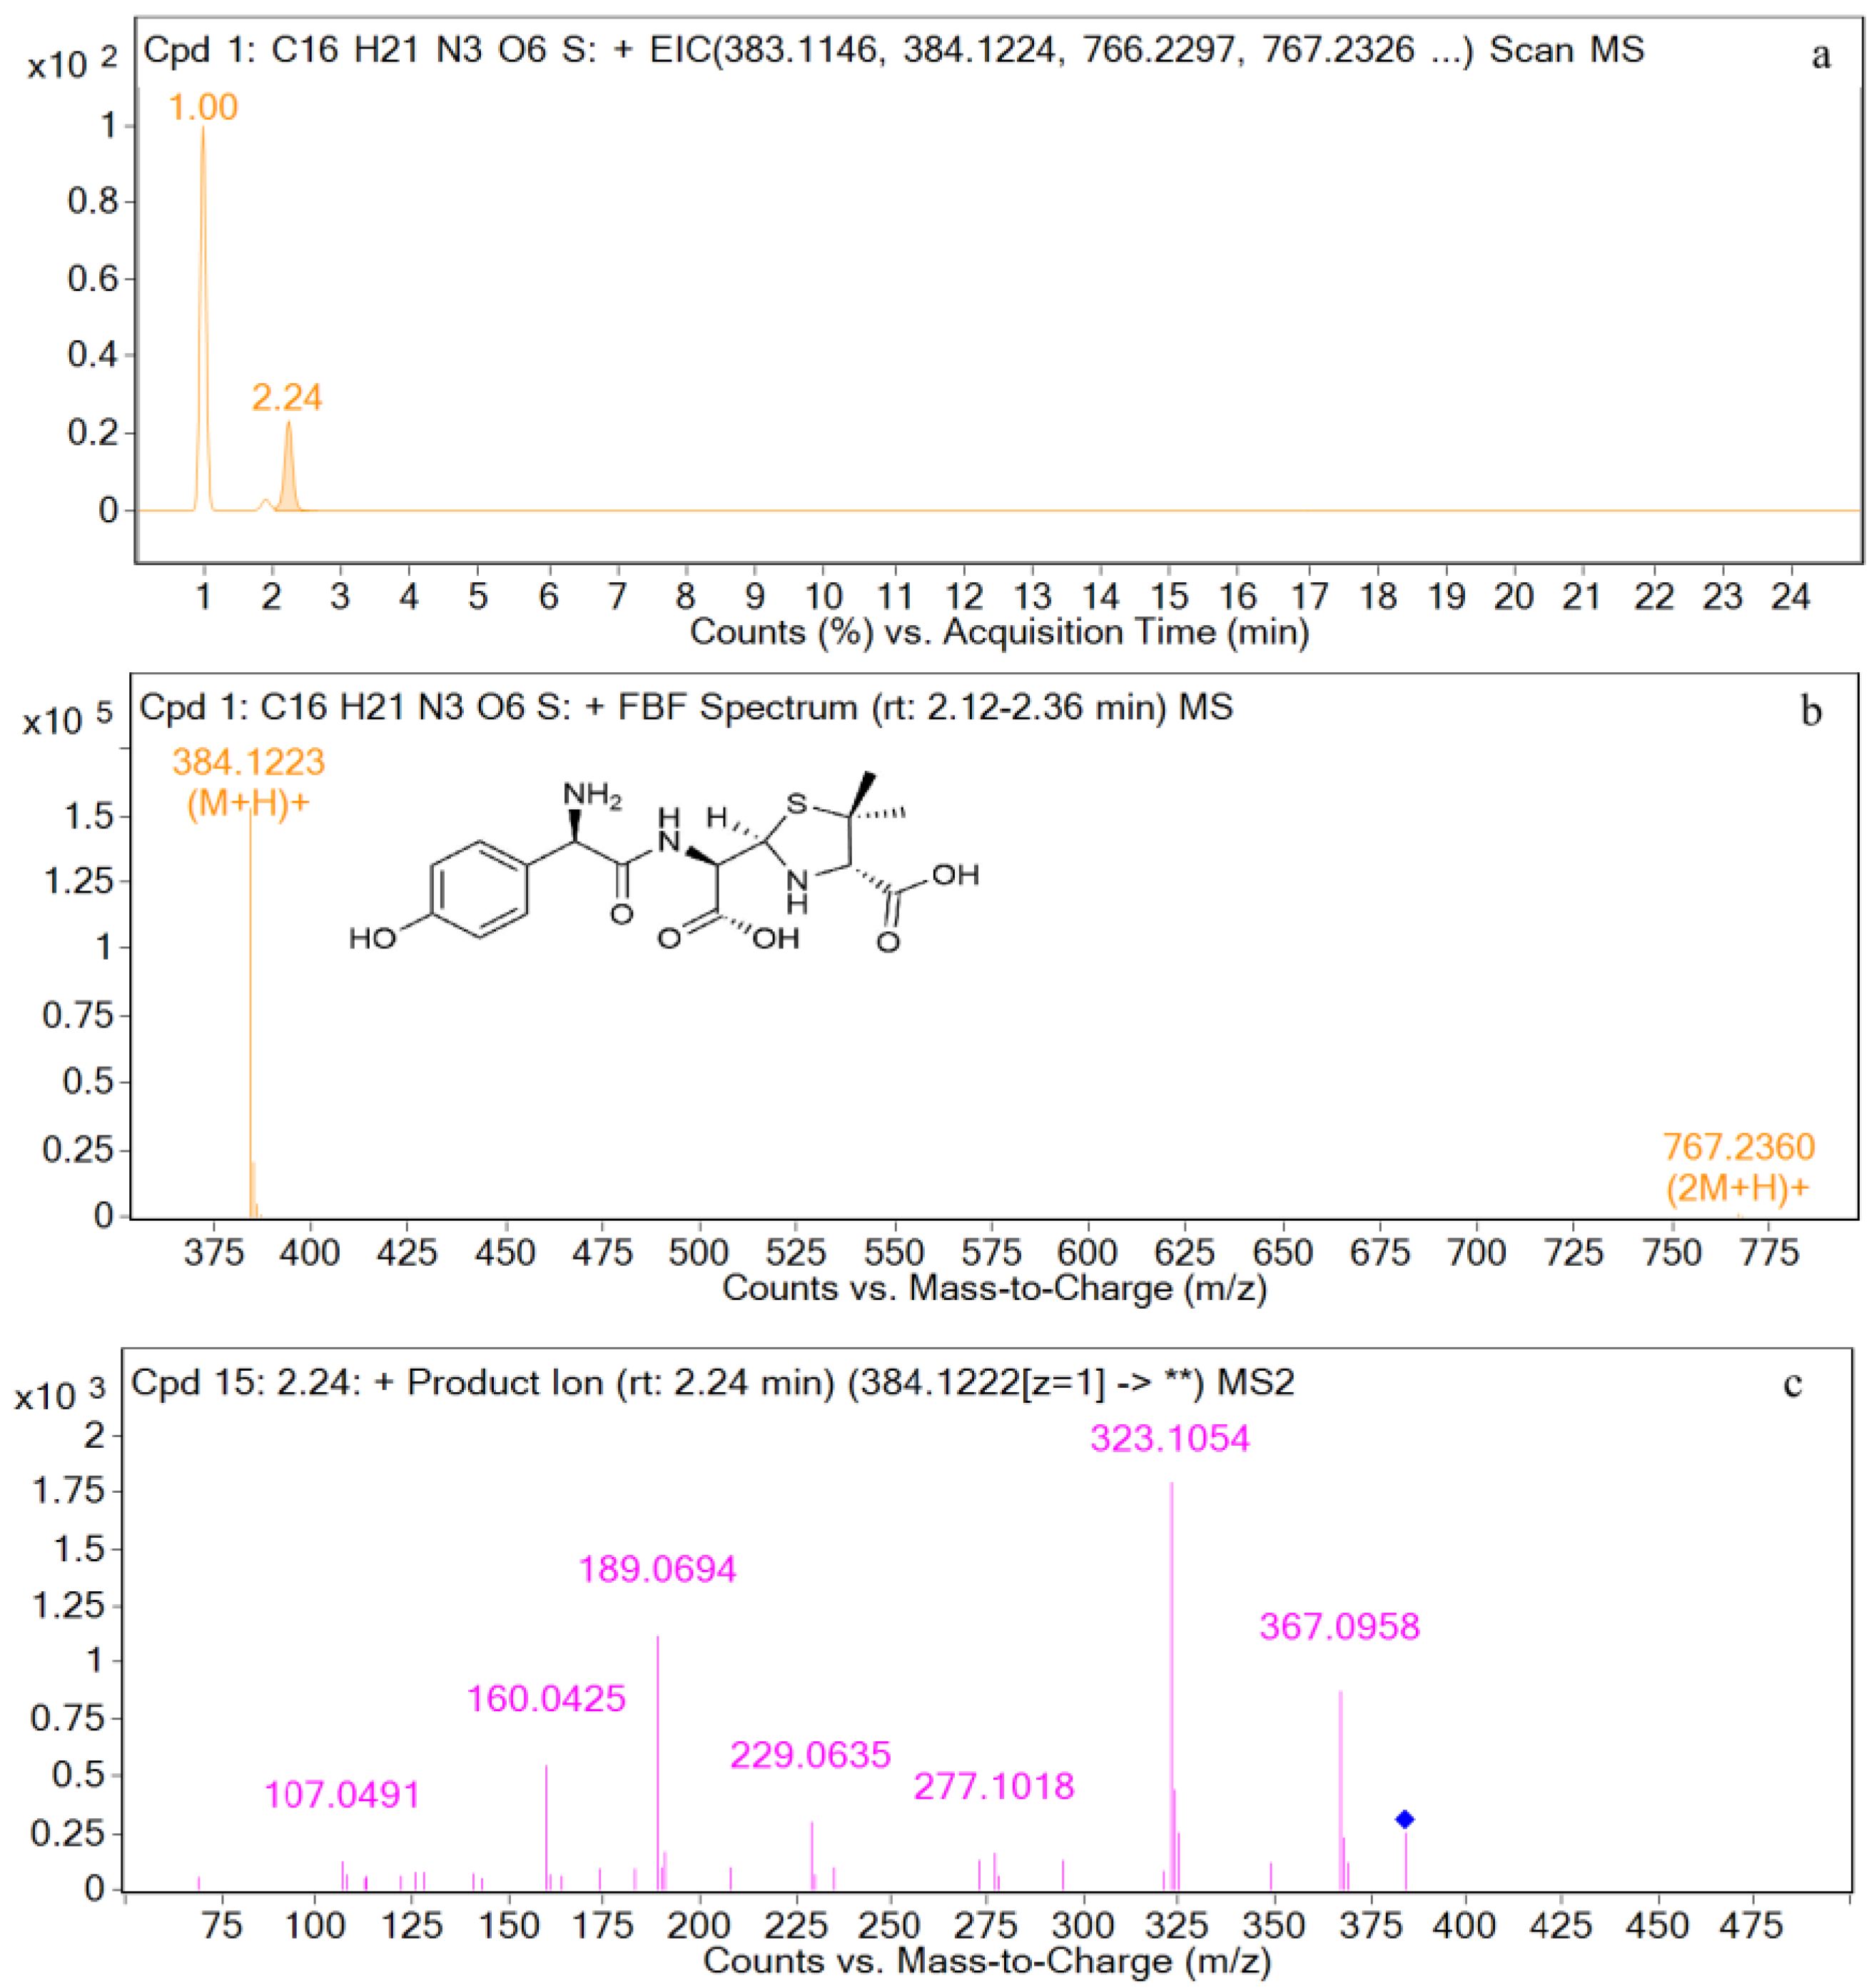
| AMA | [C16H22N3O6S+H]+ | 2.2 | 384.1223 | 1.87 | U | 367, 323, 277, 229, 189, 160, 107 |
| DIKETO | [C16H20N3O5S+H]+ | 6.4 | 366.1118 | 0.20 | P, U, L, K | 207, 160, 114 |
| SBT | [C8H10NO5S−H]− | 3.4 | 232.0292 | 0.28 | P, U, L, K | 232, 188, 140, 91, 64 |
| M1 | [C16H20N3O5S+H]+ | 2.5 | 366.1121 | 0.72 | P, U, L, K | 366, 349, 275, 208, 160, 114, |
| M2 | [C16H22N3O6S+H]+ | 2.2 | 384.1228 | 1.49 | U | 384, 367, 323, 295, 229, 189, 107, |
| M3 | [C16H20N3O5S+H]+ | 6.4 | 366.1125 | 0.19 | P, U, L, K | 366, 207, 160, 114, |
| M4 | [C8H10NO5S−H]− | 3.4 | 232.0287 | 0.60 | P, U, L, K | 232, 188, 140, 91, 64 |
Publisher’s Note: MDPI stays neutral with regard to jurisdictional claims in published maps and institutional affiliations. |
© 2022 by the authors. Licensee MDPI, Basel, Switzerland. This article is an open access article distributed under the terms and conditions of the Creative Commons Attribution (CC BY) license (https://creativecommons.org/licenses/by/4.0/).
Share and Cite
Zhao, F.-K.; Shi, R.-B.; Sun, Y.-B.; Yang, S.-Y.; Chen, L.-Z.; Fang, B.-H. A Comprehensive Study to Identify Major Metabolites of an Amoxicillin–Sulbactam Hybrid Molecule in Rats and Its Metabolic Pathway Using UPLC-Q-TOF-MS/MS. Metabolites 2022, 12, 662. https://doi.org/10.3390/metabo12070662
Zhao F-K, Shi R-B, Sun Y-B, Yang S-Y, Chen L-Z, Fang B-H. A Comprehensive Study to Identify Major Metabolites of an Amoxicillin–Sulbactam Hybrid Molecule in Rats and Its Metabolic Pathway Using UPLC-Q-TOF-MS/MS. Metabolites. 2022; 12(7):662. https://doi.org/10.3390/metabo12070662
Chicago/Turabian StyleZhao, Fei-Ke, Ren-Bin Shi, Yu-Bin Sun, Shuang-Yun Yang, Liang-Zhu Chen, and Bing-Hu Fang. 2022. "A Comprehensive Study to Identify Major Metabolites of an Amoxicillin–Sulbactam Hybrid Molecule in Rats and Its Metabolic Pathway Using UPLC-Q-TOF-MS/MS" Metabolites 12, no. 7: 662. https://doi.org/10.3390/metabo12070662
APA StyleZhao, F.-K., Shi, R.-B., Sun, Y.-B., Yang, S.-Y., Chen, L.-Z., & Fang, B.-H. (2022). A Comprehensive Study to Identify Major Metabolites of an Amoxicillin–Sulbactam Hybrid Molecule in Rats and Its Metabolic Pathway Using UPLC-Q-TOF-MS/MS. Metabolites, 12(7), 662. https://doi.org/10.3390/metabo12070662