Article

Protective Effects of Bee Pollen on Multiple Propionic Acid-Induced Biochemical Autistic Features in a Rat Model

1
Department of Food Science and Nutrition, College of Food and Agriculture Sciences, King Saud University, Riyadh 11495, Saudi Arabia
2
Central Research Laboratory, Female Center for Medical Studies and Scientific Section, King Saud University, Riyadh 11495, Saudi Arabia
3
Department of Physiology, Faculty of Medicine, King Saud University, Riyadh 11461, Saudi Arabia
4
Biochemistry Department, College of Sciences, King Saud University, Riyadh 11495, Saudi Arabia
5
Department of Biomedical Sciences, School of Medicine, University of Missouri Kansas City, Kansas City, MO 64108, USA
*
Author to whom correspondence should be addressed.
Metabolites 2022, 12(7), 571; https://doi.org/10.3390/metabo12070571
Submission received: 6 June 2022 / Revised: 16 June 2022 / Accepted: 19 June 2022 / Published: 21 June 2022

Abstract

:
Autism spectrum disorders (ASDs) are neurodevelopmental disorders that clinically presented as impaired social interaction, repetitive behaviors, and weakened communication. The use of bee pollen as a supplement rich in amino acids amino acids, vitamins, lipids, and countless bioactive substances may lead to the relief of oxidative stress, neuroinflammation, glutamate excitotoxicity, and impaired neurochemistry as etiological mechanisms autism. Thirty young male Western albino rats were randomly divided as: Group I-control; Group II, in which autism was induced by the oral administration of 250 mg propionic acid/kg body weight/day for three days followed by orally administered saline until the end of experiment and Group III, the bee pollen-treated group, in which the rats were treated with 250 mg/kg body weight of bee pollen for four weeks before autism was induced as described for Group II. Markers related to oxidative stress, apoptosis, inflammation, glutamate excitotoxicity, and neurochemistry were measured in the brain tissue. Our results indicated that while glutathione serotonin, dopamine, gamma-aminobutyric acid (GABA), GABA/Glutamate ratio, and vitamin C were significantly reduced in propionic acid-treated group (p < 0.05), glutamate, IFN-γ, IL-1A, IL-6, caspase-3, and lipid peroxide levels were significantly elevated (p < 0.05). Bee pollen supplementation demonstrates protective potency presented as amelioration of most of the measured variables with significance range between (p < 0.05)–(p < 0.001).

Graphical Abstract

1. Introduction

Autism spectrum disorder (ASD) is neurodevelopmental disorders that present clinically as weakened communication ability and social interaction and repetitive behaviors. These disabilities are described as a spectrum because of the significant difference in how individuals clinically present autistic features. Majority of people with ASD fall between two extremes; individuals with minimal verbal and intellectual talent, and those with average to higher intellectual ability [1]. Regardless of their place on this spectrum, each individual has an excellent chance to achieve life success following early detection and intervention of the disorder [2,3].
Although there is no cure for ASD, early diagnosis increases the awareness of ASD-associated pathologic behaviors before they progress and become severe. The amendment of core autistic features as early as possible can minimize the progression of symptoms and maximize the effects of early intervention [4].
Gut microbiota has a central role in the etiological mechanism of autism. Elevated levels of short-chain fatty acids and toxin-generating pathogenic bacteria such as Clostridioides species are often detected in individuals with ASD [5,6,7]. Propionic acid (PPA) is one of the most abundant short-chain fatty acids produced by Clostridioides species after fermentation of indigestible carbohydrates. It has many useful functions, including neuroendocrine regulation, tumor suppression, and anti-inflammation. Also, PPA represents the main mediator between the gut microbiota and the brain through the bidirectional pathway of the gut microbiota-brain axis [8,9]. However, excessive PPA can induce neurotoxic effects, such as mitochondrial oxidative stress, metabolic, and immune dysfunctions, which are all related to autism [8,10]. Choi et al. [11] demonstrate that PPA administration induced autism-like neuro-behaviors such as increased aggressive behavior, reduced probing activity, and impaired social interaction through the induction of abnormal neural cell organization, which support the validity of PPA-induced rodent model of autism [8]. Noticeably, records supports a significant role of PPA in modifying human fetal-derived neural stem cells (NSCs) modeling leading to gliosis, impaired neuro-circuitry, and inflammatory response as seen in individuals with ASD [11].
Moreover, PPA readily crosses the gut-brain barrier and affects functional brain networks, aggravating the changes in neurotransmission, neuroinflammation, and energy metabolism within the brain [12,13,14]. Recently, it was shown that an orally administered neurotoxic dose of PPA in rodents affected social skills and cognitive flexibility, and induced other alterations similar to those observed in autistic individuals [13,14,15].
Natural products, such as bee products, are often recommended by users of complementary and alternative medicine. Among the various products, bee pollen is a natural honeybee product that represents a well-known source of energy and nutrition. The health-promoting potency of bee pollen is anticipated to be due to the presence of large numbers of secondary plant metabolites, such as tocopherol, niacin, thiamine, biotin, folic acid, polyphenols, carotenoid pigments, and phytosterols [16,17,18]. The main difficulty in the application of bee pollen in phytomedicine is related to the wide interspecific variation in its composition.
The chemistry of bee pollen is greatly affected by the vegetal and geographic sources, and environmental factors, such as temperature, water, and light intensity. Different bee pollen grains have almost same nutritional value originates from their content of essential constituents [19]. Bee pollen is a rich source of the amino acids such as aspartic acid, glutamic acid, proline, leucine, lysine, and arginine [19,20]. Carbohydrates, mostly polysaccharides, including starch, pectin, sporopollenin, and cellulose, together with monosaccharides and disaccharides, constitute a considerable percentage of bee pollen [21,22]. Pollen grains contain high levels of minerals; N is the most abundant element, and K, Mg, P, Ca, S, B, Zn, Cu, Mn, and Fe are also present [19]. Pollen contains up to 10% lipids; up to 60% of the fatty acids are unsaturated acids (e.g., oleic, linoleic, and linolenic acids), and palmitic acid is the most common saturated fatty acid [23]. In recent years, pollen has been investigated by many scientists who have considered it as a natural source of healthy food, energy, and functional components for human consumption [24,25]. Pollen was proven to have therapeutic properties, with strong antioxidative, anti-inflammatory, anticarcinogenic, anti-allergenic, anti-radiation, and antitoxic activities [26,27,28]. It was even suggested that pollen has a positive effect on the treatment of neuroinflammation, and may, therefore, be used as a treatment for ASD [29].
In a recent study by Al-Yousef et al. [30], the chemical composition of bee pollen products from Wadi Al-Nahil Company, Saudi Arabia, was analyzed. The major compounds found were ethyl ester of hexadecanoic acid, eicosatrienoic acid, and 1,4-dimethyl-benzene; hexadecanoic acid (palmitic acid) and nonacosane were also found. This study also confirmed the presence of a large number of polyphenols, mainly flavonoids, and proanthocyanidins, both of which have strong antioxidant potential through direct free radical scavenging and antibacterial activities. Most interestingly, they reported that Wadi Al-Nahil bee pollen had an in vitro antibacterial effect against Clostridioides perfringens, a pathogenic bacterium found to be 10-fold higher in patients with autism compared with healthy controls.
This information was the source of our interest in the biochemical protective effects of bee pollen against the neurotoxic effects of propionic acid (PPA) as a metabolic products of Clostridioides species, known to induce persistent biochemical, behavioral and pathological autistic features in rodent model of autism [31,32]. Variables related to oxidative stress, neurotransmission, neuroinflammation, immune dysfunction, and gut microbiota were selected to evaluate the persistent biochemical and neurotoxic effects of PPA that may be ameliorated by the use of bee pollen as a protective intervention strategy.

2. Results

The data from the present study are presented in five tables and two figures. The descriptive changes in the selected measured variables in the three treatment groups are shown in Table 1 and Figure 1.

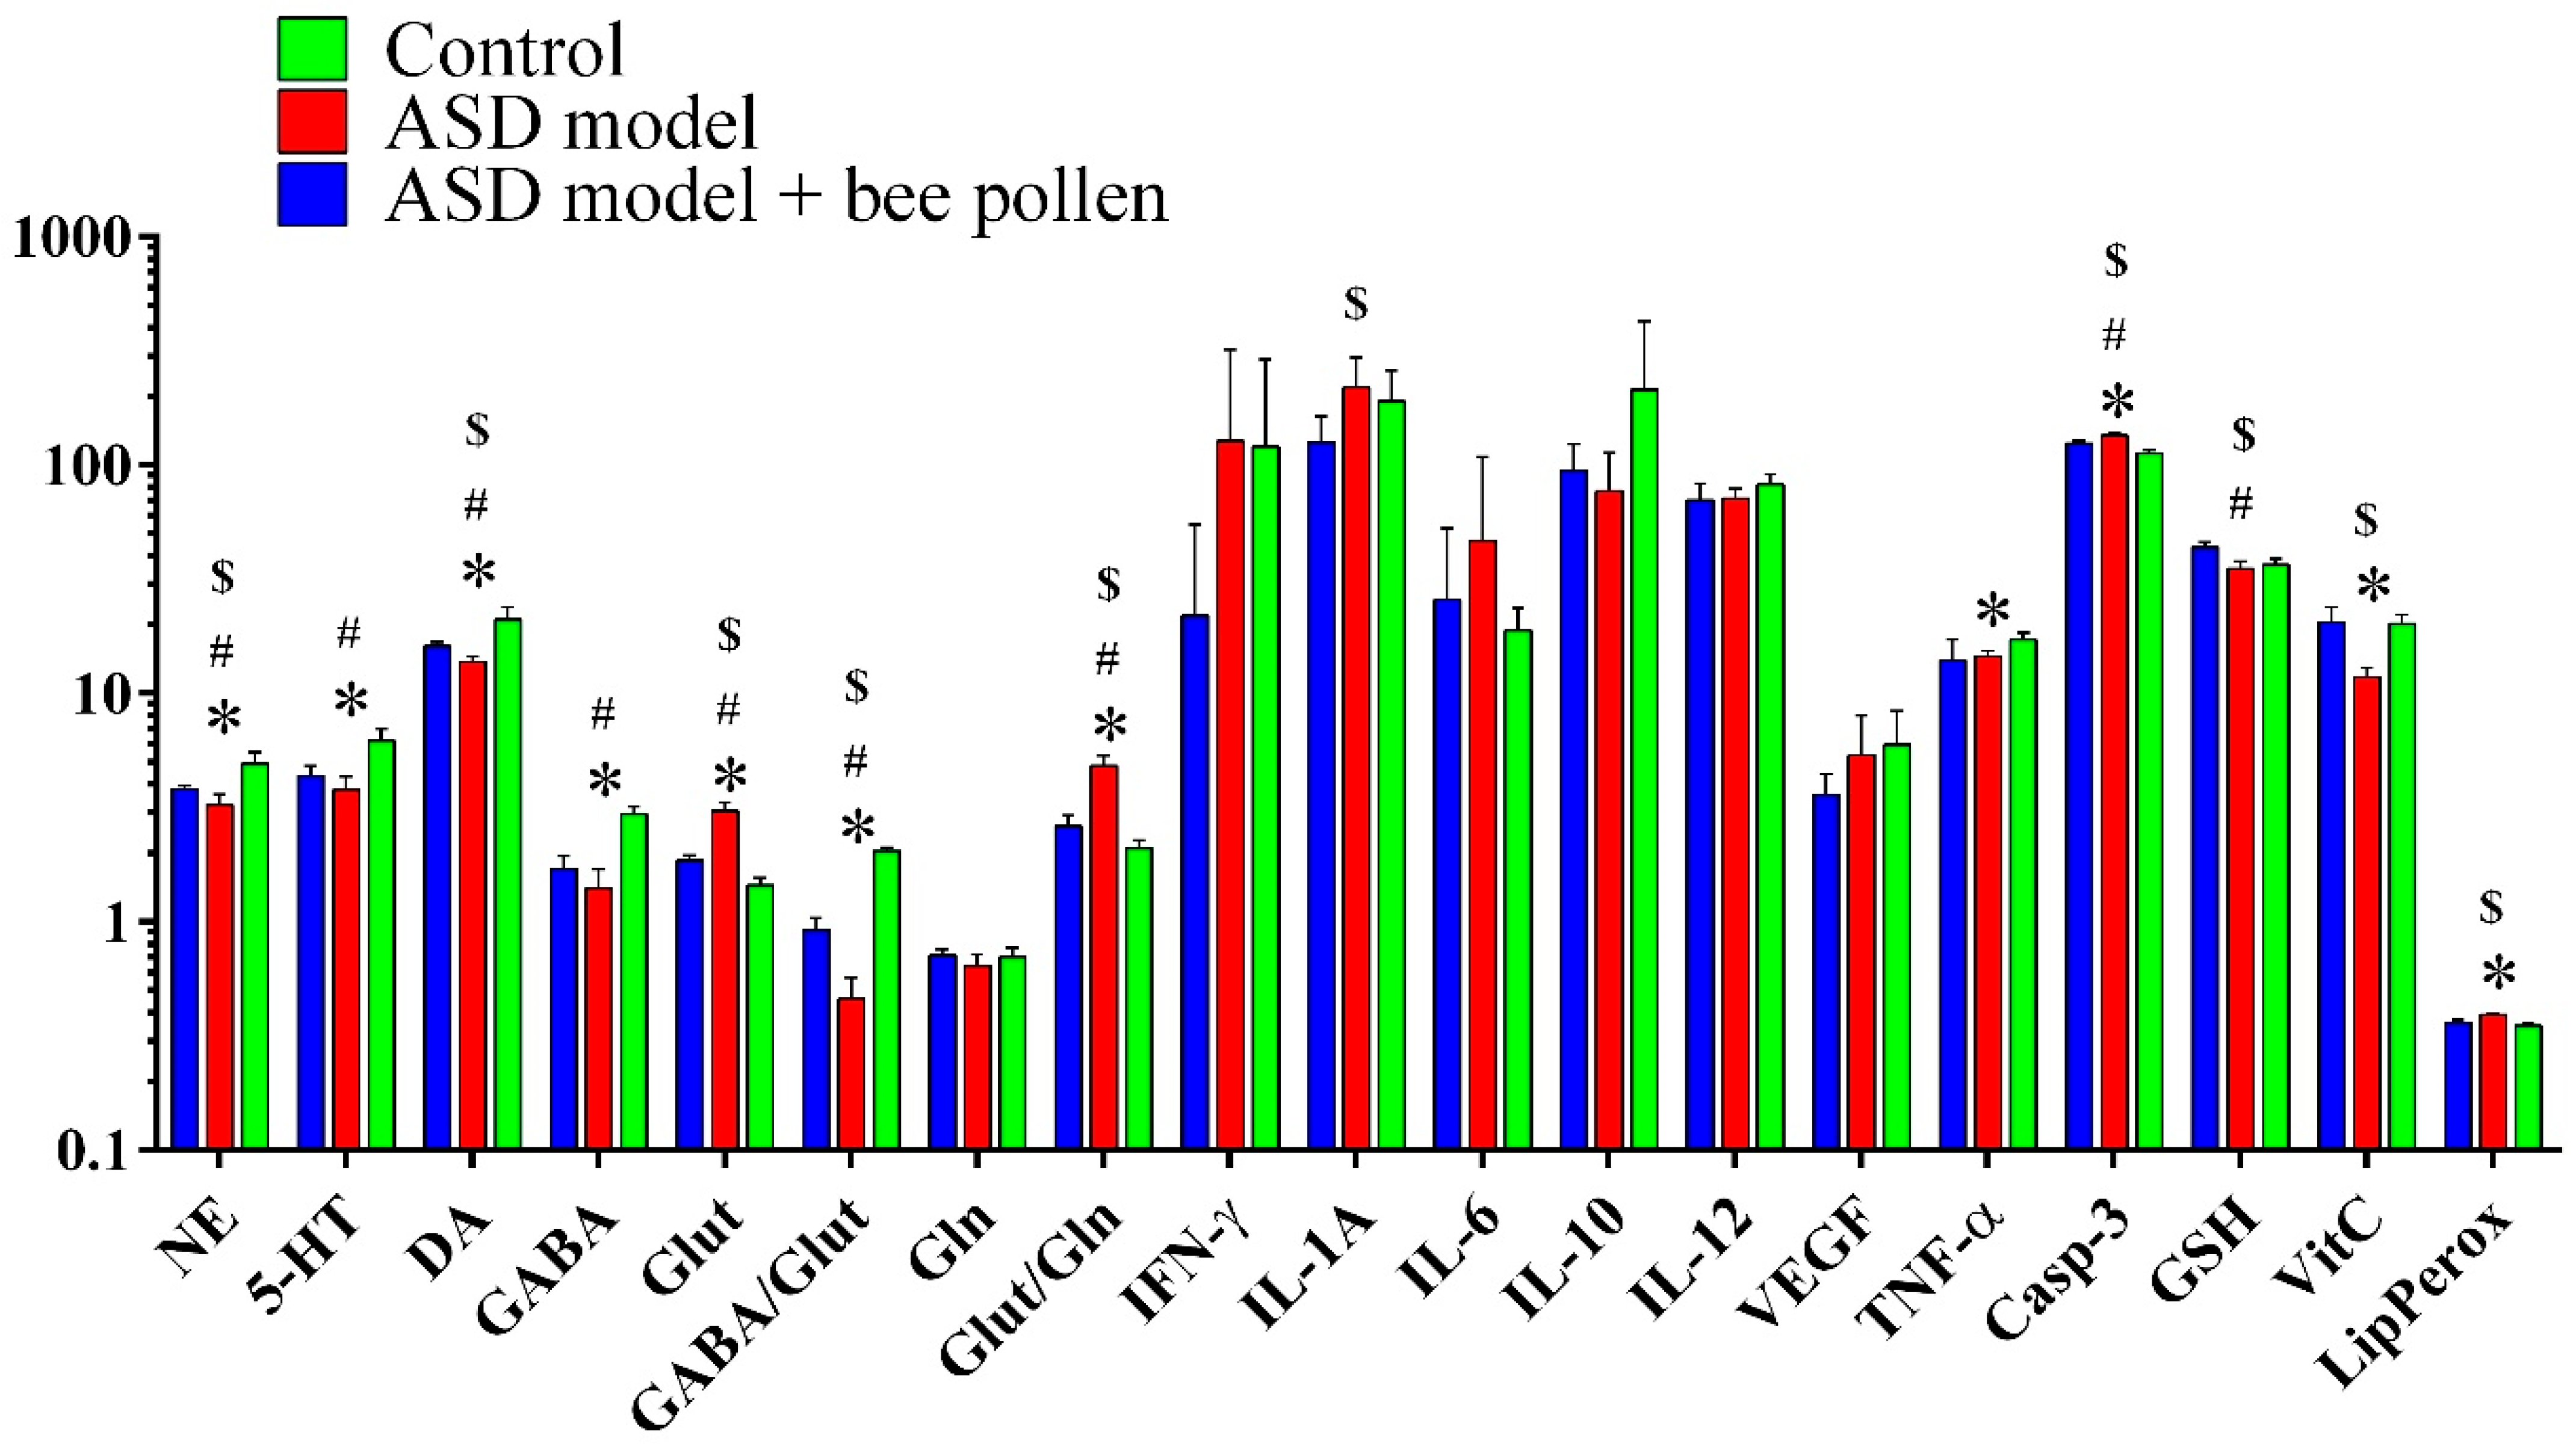
2.1. Neurotransmitters, GABA, Glutamine, Glutamate, and Caspase-3

A decrease in 5-HT, dopamine, GABA, and the GABA/Glutamate ratio was notable in Group II, with a notable restoration in Group III. In contrast, glutamate was significantly increased in Group II but was present at normal levels in Group III.

2.2. Neuroinflammation and Oxidative Stress Related Markers

With regard to the neuroinflammation-related parameters, it was clearly seen that although levels of the inflammatory cytokines IFN-γ, IL-1A, and IL-6, as markers of PPA neurotoxicity, were significantly elevated in Group II, the levels were much lower in Group III. No effect of bee pollen was observed on IL-12, TNF-α, and VEGF (Table 1 & Figure 1). Caspase-3, a pro-apoptotic marker, was significantly higher in Group II and lower in Group III, although still significantly higher than in Group I.
The antioxidant effect of bee pollen was clearly observed through the remarkable increase in vitamin C as antioxidant vitamin and decrease in lipid peroxides, a marker of oxidative stress.
The positive and negative correlations between the measured parameters are presented in Table 2. All measured markers were either positively or negatively correlated. The recorded positive correlations demonstrated the contribution of oxidative stress, neuroinflammation, and impaired neurotransmission, as integrated etiological mechanisms of the neurotoxicity of PPA in the rodent model of autism. The heat map provides a visual representation of the correlation; red colors indicate a more positive correlation, and blue colors indicate a more negative correlation. Significance is denoted by * (p < 0.05), ** (p < 0.01), and *** (p < 0.001).
The stepwise multiple regression using selected markers of apoptosis (caspase-3), glutamate excitotoxicity (Glutamate and GABA), neuroinflammation, and oxidative stress as dependent markers are shown in Table 3. The obtained data confirmed the contribution of the different predictors to the different affected signaling pathways.
The ROC analysis of the measured parameters is presented in Table 4. With a few exceptions, most of the measured markers recorded high AUC, together with high specificity and sensitivity, either as markers of the neurotoxicity of PPA or the protective effects of bee pollen. Spearman correlation matrix was calculated using GraphPad Prism version 6. Regression-relationships plots were produced using IBM SPSS version.
Figure 2 demonstrates average bacterial counts in fecal samples of control, PPA-induced rodent model of autism, and bee pollen-protected autism model. Altered gut microbiota can be easily observed as remarkable increase or decrease of certain bacterial abundance.

3. Discussion

This study describes an application of Spearman’s correlations in the field of toxicology to identify various associations between five neurotransmitters as measure of brain connectivity, seven cytokines as measure of neuroinflammation, one pro-apoptotic marker, and three oxidative stress-related variables in PPA-treated rats and PPA-treated rats that received a 4-week pre-treatment with bee pollen. Spearman’s correlations were displayed by using correlation heat maps, with positive and negative correlations easily identified as blue and red squares, respectively, at the intersection of two biomarkers.
In an attempt to understand the role of glutamate excitotoxicity, neuroinflammation, and oxidative stress, as three possible mechanisms related to autism induced through PPA neurotoxicity, Spearman’s correlations were tested between GABA/glutamate ratio as a marker of excitotoxicity and all the measured parameters. The significant negative correlation between GABA/glutamate ratio and lipid peroxides, an oxidative stress marker, and a positive correlation with vitamin C, an antioxidant marker, demonstrated the involvement of both compounds in the etiopathology of PPA neurotoxicity (Table 2). This was further supported through Spearman’s correlations between the absolute value of GABA as the major inhibitory neurotransmitter. In contrast with glutamate, GABA showed a significant negative correlation with Glut, the Glut/Gln ratio as a component of the glutamate/GABA/Gln cycle and lipid peroxides as a measure of oxidative stress. Moreover, it showed a positive correlation with the impaired GABA/Glut ratio as measure of imbalanced inhibitory/excitatory neurotransmission and vitamin C. This was supported by the previous of Olloquequi et al. [33] in which they prove that during excitotoxicity, the much higher release of glutamate, together with the concomitant excessive activation of glutamate receptors, can lead to the dysregulation of Ca2+ homeostasis, triggering the production of free radicals and oxidative stress, mitochondrial dysfunction, and eventually cell death.
Given that excitotoxicity is considered a hallmark of autism, drugs moderating different aspects of excitotoxic mechanisms may offer benefits in the treatment of individuals with autism. The obtained data have ascertained the role of excitotoxicity and oxidative stress in the neurotoxic effect of PPA and indicate the promising strategy of using bee pollen as a natural product to target the excitotoxic insult. The protective potency of bee pollen can be observed through the suppression of the elevated levels of glutamate and lipid peroxides, and the stimulation of GABA, vitamin C, and GSH (Table 1).
The unexpected negative Spearman’s correlations between glutamate and TNF-α reported in the present study can be easily related to the disruption of BBB in PPA-treated rats. It is known that permeability of the BBB is increased in response to PPA treatment and is correlated with elevated serum TNF-α levels due to the efflux of increased TNF-α from the brain to the blood [34]. This explanation is supported by the study of Mirza and Sharma [35] in which they proved BBB disruption was among the neurotoxic effects of PPA. Dysfunction of the BBB may allow PPA to bypass the barriers and enter the brain. This suggestion may also be related to the neuroprotective effect of TNF-α against glutamate excitotoxic damage in primary cortical neurons via sustained activation of nuclear factor-kappa B (NF-kappa B). The transcription factor NF-kappa B can regulate the expression of small conductance calcium-activated potassium (K (Ca)) channels. These channels reduce neuronal excitability and, as such, may confer neuroprotective effects against neuronal overstimulation. The suggested efflux of TNF-α through the disrupted BBB leads to lower levels of brain TNF-α and decreased (K (Ca)) channel expression, which render neurons more susceptible to glutamate-mediated excitotoxic cell death [36]. This may support the obtained Pearson’s negative correlation.
When in the brain, PPA may modify neural circuitry through the induction of the excitatory glutamatergic transmission and the impedance of GABAergic transmission, which may lead to imbalanced E/I neural circuitry, a repeatedly reported feature of autism [37,38]. Inhibiting GABAergic transmission as an important neurotransmitter for pre-pulse inhibition (PPI) can result in a decrease in PPI upon PPA administration. Also, PPA can lead to intracellular acidification by uncoupling gap junctions between neurons and disrupting synaptic transmission in the prefrontal cortex and sensorimotor cortex [39]. Collectively, these effects of PPA on neural circuitry can explain the deficits in sensorimotor activity and the altered cognitive functioning that manifest as autistic features in the PPA-induced rodent model of autism. Again, this explanation is supported through the positive and negative correlations presented between GABA/Glut ratio and TNF-α, vitamin C, and lipid peroxides (Table 2).
Several associations reported between IFN-γ, as a neuroinflammatory marker, and pro-apoptotic, and neurotransmission/oxidative stress markers were expected based on known physiological processes. The data presented in Table 2 demonstrate that although IFN-γ was negatively correlated with NE, DA, 5-HT, GABA, GABA/Glut, and vitamin C, it was positively correlated with glutamate, Glut/Gln, caspase-3, and VEGF P. Neuroinflammation, a typical neurotoxic effect, can trigger oxidative stress through several mechanisms, such as the production of high levels of ROS by activated astrocytes and microglia and through the activation of cyclooxygenase (COX) and lipoxygenase (LOX) pathways [40,41,42]. The overproduction of ROS activates microglia and promotes further cytokine production [43], leading to a positive correlation between IFN-γ and lipid peroxides. This confirmed both the implication that IFN-γ was involved in stimulating the release of ROS from microglia in PPA-treated rats and the efficacy of bee pollen as an antioxidant and anti-inflammatory product, through the remarkable correction of both signaling related variables [41]. This is supported by the recent work of Erten [44] in which attenuation of postnatal PPA-induced oxidative stress and neuroinflammation in rats was treatable and accompanied an improvement in the autism-like behavioral phenotypes induced.
As reduced levels of neurotransmitters, such as NE, 5-HT, DA, and GABA, are often associated with the pathogenesis of autism. The negative Spearman’s correlations of these four variables and IFN-γ, as a marker of neuroinflammation, can indicate the contribution of neuroinflammation in the anxiety-like behaviors related to these neurotransmitters in the phenotypes of autism [45,46].
Oxidative stress, glutamate excitotoxicity, and neuroinflammation are among the basic events in many neurological disorders. These three etiological mechanisms are related to epilepsy, as co-morbidities of autism that lead to cell death. Caspase-3, a pro-apoptotic marker, was found to be positively correlated with Glut and the Glut/Gln ratio, and negatively correlated with GABA and the GABA/Glut ratio, all of which are glutamate-mediated excitotoxicity markers [47]. The positive Spearman’s correlation between caspase-3 and lipid peroxides, together with the negative correlation between caspase-3 and vitamin C, an antioxidant vitamin, confirmed the association of apoptosis with oxidative stress. This further supported the contribution of this pathogenic triad to the neurotoxicity of PPA and its relationship to neuronal cell death, indicated by the elevation of caspase-3, a marker of apoptosis, a fourth etiological mechanism in autism. The unexpected negative Spearman’s correlations reported in the present study between caspase-3, IL-12, and TNF-α explain the disruption of BBB in PPA-treated rats. Serum studies from ASD patients provide additional proof linking PPA to the disorder, as ASD patients have metabolic dysfunction including oxidative stress, imbalanced GABA/glutamate ratio, neuroinflammation, and mitochondrial dysfunction. Elevated levels of PPA may be a gut-derived factor involved in ASD patients [11,15].
In an attempt to explain the protective mechanism of bee pollen, it should be considered that bee pollen is rich with multiple antioxidant vitamins, such as vitamins C, E, and β-carotene, as pro-vitamin A, together with vitamin B complex and vitamin D [48,49]. Among these vitamins, vitamin E appears to be better preserved during storage compared with vitamin C and β-carotene. The obtained ameliorative effects of bee pollen presented in Figure 1 may be related to the abundance of these antioxidant vitamins in bee pollen. Among the measured variables, vitamin C was significantly elevated in Group III (bee pollen-treated autism model group) compared with Group II (autism model group). The effectiveness of vitamin C as a component of bee pollen that protects against PPA neurotoxicity was clearly observed through the use of Spearman’s correlation as statistical tool (Table 1): although vitamin C was negatively correlated with IFN-γ, caspase-3, lipid peroxides, and glutamate, as markers of pro-inflammation, apoptosis, oxidative stress, and excitotoxicity, respectively, which are neurotoxic effects of PPA, it was positively correlated with GABA, the GABA/Glut ratio, noradrenergic and dopaminergic neurotransmission, and GSH as markers of balanced E/I neurotransmission, normal emotional reactivity, and antioxidant capacity [50]. This is heavily supported by a recent study by Ambrogini et al. [47] in which it was proved that vitamin E, as a major component of bee pollen, was effective in counteracting oxidative stress, glutamate excitotoxicity, neuroinflammation, and apoptosis, four of the molecular events related to autism. Besides its antioxidant effects, vitamin E can modulate enzymes, signal transduction pathways, and transcription factors associated with the inflammatory response, such as the NF-kappa B pathway of activated mononuclear cells, and the LOX-dependent and COX-dependent pathways of arachidonic acid oxidation to generate inflammatory and vasoactive eicosanoids, which are lipid mediators related to the neurotoxicity of PPA and pathology of autism [51].
As Spearman’s correlation is a measure of the strength of association between different variables, multiple regression analysis is used to acquire more quantitative assessments about how the change in one variable (dependent; or responders) relies on the alteration of other variables (independent; or predictors).
It can be easily noticed that the more independents (or predictors) that are variables related to the different etiological mechanism the higher the significance (p-value) and R2 value for a dependent variable. For example, although 79.1% of the change in caspase-3 was affected by the significant elevation of glutamate as marker of excitotoxicity, 99.9% of the change in this apoptotic marker was affected by the panel of independent variables, representing impaired neurochemistry (Glut, Gln, DA) and neuroinflammation (IL-12, IL-10, IFN-γ). The same trend was followed by all the test variables of the current study, as shown in Table 3.
The ROC analysis for all the measured variables is shown in Table 4. With few exceptions, all the measured variables showed high AUC, together with satisfactory specificity and sensitivity as markers of PPA neurotoxicity or the therapeutic potency of bee pollen.
Collectively, the protective effects of bee pollen reported in the current study can find support in a recent study Li et al. [52]. They demonstrated that bee pollen protective effects against intestinal barrier impairment by strengthening epithelial integrity and tight junction losses induced by toxic insults through the up-regulation of anti-oxidants and down-regulation of inflammatory cytokines (TNF-α and IL-6) [52]. This might help to suggest that the protective effects of bee pollen as prebiotic takes place through the gut microbiome-brain axis as contributing factor in the etiology of autistic features in rodent model.
In Figure 2, it is clearly noticed that PPA induced a remarkable alteration at the genus level of gut flora of the treated animals. Increase of unclassified Staphylococcus and/or Bacilli, Enterobacteriaceae genus in the n PPA- rodent model of ASD (Group II) is in good agreement with multiple clinical and experimental findings demonstrating the elevation of the three genus in ASD patients and rodent model [53,54,55]. Additionally, the remarkable increase in Bactericides sp. streptococci and enterococci in PPA-treated rats is in good agreement with the work of Lee et al. [54] in which they reported almost 3 folds higher of these bacteria in ASD patients. The remarkable ameliorating effects of the bee pollen-protected group could be supported by considering the antimicrobial activity of bee pollen extracts on Staphylococcus aureus, Escherichia coli and other bacterial strains [56,57]. This might help to support the increasing interest regarding the effectiveness of the antimicrobial properties of bee pollen, due to the emerging antibiotic resistance developed by different pathogens as a future expected global health hazard.

4. Materials and Methods

Bee pollen was purchased from a branch of Wadi Al-Nahil, in Riyadh, Saudi Arabia in June 2017, under the trade name “bee pollen, 100% natural bee pollen first elite”. It was imported by Wadi Al-Nahil, one of the largest marketing companies in Saudi Arabia (www.wadialnahil.net, accessed on 18 June 2022).

4.1. Animals

Thirty young Western albino male rats weighing 100 ± 20 g; at the age of 4 weeks were obtained from the Experimental and Surgery Animal Laboratory, King Khalid Hospital, King Saud University. Rats were housed individually in stainless steel cages under controlled environmental conditions of 25 °C, 12 h day/night cycle, the humidity of 50% ± 5.

4.2. Experimental Design

A pre-determination of sample size calculation was not performed. The rats were randomly and blindly divided into three groups: Group I, the control group, comprising control healthy rats; Group II, the autism rodent model group, in which rats were orally administered phosphate-buffered saline (PBS) for 25 days then received 250 mg PPA/kg body weight/day for three days from experimental days 26 to 28; Group III, the bee pollen-protected group, in which the rats were treated with orally administered 250 mg/kg body weight of bee pollen from experimental days 1 to 25 before autism was induced as described for Group II (i.e., oral administration of PPA from experimental day 26–28). The duration used was selected up to numerous previous studies showing average duration between three weeks-one month of bee pollen treatment [29,58].

4.3. Ethics Approval

The protocol of this work was approved by and carried out in accordance to the guidelines of Graduate Studies and Scientific Research Ethical Committee of Bioethics in King Saud University Ref Number: 4/67/352670. Our study was carried out in compliance with the ARRIVE guidelines.

4.4. Collection of Brain Samples

The rats were anesthetized with carbon dioxide and decapitated. The brain was removed, washed with distilled water. The whole brain was homogenized in 10 w/v bidistelled water using electric homogenizer.

4.5. Quantification of Neurotransmitters (Norepinephrine, Dopamine, and Serotonin)

The concentrations of norepinephrine (NE) and dopamine (DA) were determined in brain homogenates using a Competitive ELISA kit from MyBioSource. The concentration of serotonin (5-HT) was determined using the Quantitative Sandwich ELISA kit from MyBioSource.

4.6. Quantification of GABA, Glutamine, Glutamate, and Caspase-3

GABA was quantitatively determined by using an ELISA kit from ALPCO Diagnostics (Salem, NH, USA). Rat brain glutamine (Gln), glutamate (Glut), and caspase-3 were measured independently by using ELISA kits from Cusabio (Wuhan, China).

4.7. Quantification of Cytokines

The MILLIPLEX® MAP (Merck KGaA, Darmstadt, Germany) kit for Mouse Cytokine/Chemokine, Magnetic Bead panel, was used following the manufacturer’s instructions for the quantification of the cytokines in the brain homogenate of rats. The panel measured the following cytokines: interferon-γ (IFN-γ), interleukin-1 alpha (IL-1α), IL-6, IL-10, IL-12 p70, vascular endothelial growth factor (VEGF), and tumor necrosis factor α (TNF-α).

4.8. Quantification of Oxidative Stress Markers

Glutathione was assayed by the method of Beutler et al. [59] using 5,5′-dithiobis 2-nitrobenzoic acid (DTNB) with sulfhydryl compounds to produce a relatively stable yellow color. Lipid oxidation was estimated by the formation of thiobarbituric acid reactive substances (TBARS) by the method of Ruiz-Larrea et al. [60] Vitamin C level was estimated using the method described by Jagota and Dani [61].

4.9. Bacterial Counts in Fecal Samples

Animal fecal samples were collected and diluted in phosphate-buffered saline (1:10 w/v) [62]. The mixture was vortexed for 1 min, and then centrifuged at 3000× g rpm for 3 min at 4 °C 100 μL of each sample was spotted on 5 different selective media plates which include: Nutrient agar, Mac Conkey, Blood agar, Cycloserine- Cefoxitine Fructose Agar(CCFA), and Bile Esculin Agar (BBE) [62,63]. Plates were incubated at 37 °C for 18–24 h aerobically except CCFA and BBE which were incubated in anaerobic conditions (5% CO2). Colonies on each media plates were studied macroscopically, numbered, and then microscopically identified by gram staining technique.

4.10. Statistical Analyses

All the measured markers were analyzed by using Spearman correlations and stepwise multiple regressions as statistical tools to help elucidate the relationship between brain connectivity, glutamate excitotoxicity, oxidative stress, and neuroinflammation as neurotoxic signals related to PPA and the use of bee pollen as a protective agent. This can help to elucidate the etiopathological mechanisms of ASD and the success of the protective approach of bee pollen as natural product safe supplement.
The results in the present study were expressed as the mean ± S.D. All statistical comparisons between the three groups were performed by using one-way analysis of variance (ANOVA) tests with Dunnett’s test for multiple comparisons. The statistical analyses were computed by using Statistical Package for the Social Sciences (SPSS, Chicago, IL, USA), and significance was assigned for p values of <0.05. Spearman’s correlation analysis was used to measure the statistical dependence between two variables because the majority of biomarker concentrations were not normally distributed. Spearman’s correlation coefficients (r) and p-values were determined between all the biochemical variable markers. Multiple regression stepwise analysis was performed between the measured parameters. Receiver operating characteristics (ROC) curve analysis was also performed. The area under the curve (AUC), the degrees of sensitivity and specificity, and cutoff values were calculated.

5. Conclusions

This study has ascertained the integration and interaction between apoptosis, inflammation, glutamate toxicity, oxidative stress, and impaired neurochemistry in either the neurotoxic effects of PPA or the protective effects of bee pollen. As all the mechanisms mentioned above are prominently recorded as pathophysiological phenomena in ASD, bee pollen can be suggested as a protective strategy, which should be confirmed by future studies.

Author Contributions

H.A.A.: Data curation; A.E.-A.: suggested the topic and drafted the manuscript; L.A.-A.: Co-drafting the manuscript; R.S.B.: Data acquisition; W.M.H.: Statistical analysis of data. All authors have read and agreed to the published version of the manuscript.

Funding

This research project was supported by a grant from the Researchers Supporting Project number (RSP-2021/341), King Saud University, Riyadh, Saudi Arabia.

Institutional Review Board Statement

The study was conducted in accordance with the Declaration of Helsinki, and approved Graduate Studies and Scientific Research Ethical Committee of Bioethics in King Saud University Ref Number: 4/67/352670. Our study was carried out in compliance with the ARRIVE guidelines.

Informed Consent Statement

Not applicable.

Data Availability Statement

Data is contained within the article.

Conflicts of Interest

The authors declare no conflict of interest. The funders had no role in the design of the study; in the collection, analyses, or interpretation of data; in the writing of the manuscript; or in the decision to publish the results.

References

  1. Volkmar, F.; Wiesner, L. Essential Clinical Guide to Understanding and Treating Autism; John Wiley & Sons, Inc.: Hoboken, NJ, USA, 2017. [Google Scholar]
  2. Bradshaw, J.; Steiner, A.M.; Gengoux, G.; Koegel, L. Feasibility and effectiveness of very early intervention for infants at-risk for autism spectrum disorder: A systematic review. J. Autism Dev. Disord. 2014, 45, 778–794. [Google Scholar] [CrossRef] [PubMed]
  3. Daniels, A.M.; Halladay, A.K.; Shih, A.; Elder, L.M.; Dawson, G. Approaches to enhancing the early detection of autism spectrum disorders: A systematic review of the literature. J. Am. Acad. Child Adolesc. Psychiatry 2014, 53, 141–152. [Google Scholar] [CrossRef] [PubMed]
  4. Pijl, M.K.; Buitelaar, J.K.; de Korte, M.W.; Rommelse, N.N.; Oosterling, I.J. Sustainability of an early detection program for autism spectrum disorder over the course of 8 years. Autism 2018, 22, 1018–1024. [Google Scholar] [CrossRef] [PubMed]
  5. Ding, H.T.; Taur, Y.; Walkup, J.T. Gut microbiota and autism: Key concepts and findings. Autism Dev. Disord. 2017, 47, 480–489. [Google Scholar] [CrossRef] [PubMed]
  6. Vuong, H.E.; Hsiao, E.Y. Emerging Roles for the Gut Microbiome in Autism Spectrum Disorder. Biol. Psychiatry 2017, 81, 411–423. [Google Scholar] [CrossRef] [PubMed] [Green Version]
  7. Kandeel, W.A.; Meguid, N.A.; Bjørklund, G.; Eid, E.M.; Farid, M.; Mohamed, S.K.; Wakeel, K.E.; Chirumbolo, S.; Elsaeid, A.; Hammad, D.Y. Impact of Clostridium Bacteria in Children with Autism Spectrum Disorder and Their Anthropometric Measurements. J. Mol. Neurosci. 2020, 70, 897–907. [Google Scholar] [CrossRef]
  8. Abuaish, S.; Al-Otaibi, N.M.; Abujamel, T.S.; Alzahrani, S.A.; Alotaibi, S.M.; AlShawakir, Y.A.; Aabed, K.; El-Ansary, A. Fecal Transplant and Bifidobacterium Treatments Modulate Gut Clostridium Bacteria and Rescue Social Impairment and Hippocampal BDNF Expression in a Rodent Model of Autism. Brain Sci. 2020, 11, 1038. [Google Scholar] [CrossRef]
  9. Mohammad, F.K.; Palukuri, M.V.; Shivakumar, S.; Rengaswamy, R.; Sahoo, S. A Computational Framework for Studying Gut-Brain Axis in Autism Spectrum Disorder. Front. Physiol. 2022, 13, 760753. [Google Scholar] [CrossRef]
  10. Chapman, N.H.; Nato, A.Q.; Bernier, R.; Ankenman, K.; Sohi, H.; Munson, J.; Patowary, A.; Archer, M.; Blue, E.M.; Webb, S.J.; et al. Whole exome sequencing in extended families with autism spectrum disorder implicates four candidate genes. Hum. Genet. 2015, 134, 1055–1068. [Google Scholar] [CrossRef] [Green Version]
  11. Abdelli, L.S.; Samsam, A.; Naser, S.A. Propionic Acid Induces Gliosis and Neuro-inflammation through Modulation of PTEN/AKT Pathway in Autism Spectrum Disorder. Sci. Rep. 2019, 9, 8824. [Google Scholar] [CrossRef] [Green Version]
  12. Meeking, M.M.; MacFabe, D.F.; Mepham, J.R.; Foley, K.A.; Tichenoff, L.J.; Boon, F.H.; Kavaliers, M.; Ossenkopp, K.P. Propionic acid induced behavioural effects of relevance to autism spectrum disorder evaluated in the hole board test with rats. Prog. Neuropsychopharmacol. Biol. Psychiatry 2020, 97, 109794. [Google Scholar] [CrossRef] [PubMed]
  13. El-Ansary, A.; Bacha, A.B.; Bjørklund, G.; Al-Orf, N.; Bhat, R.S.; Moubayed, N.; Abed, K. Probiotic treatment reduces the autistic-like excitation/inhibition imbalance in juvenile hamsters induced by orally administered propionic acid and clindamycin. Metab. Brain Dis. 2018, 33, 1155–1164. [Google Scholar] [CrossRef] [PubMed]
  14. MacFabe, D. Autism: Metabolism, mitochondria, and the microbiome. Glob. Adv. Health Med. 2013, 2, 52–66. [Google Scholar] [CrossRef] [PubMed] [Green Version]
  15. Shultz, S.R.; Aziz, N.A.; Yang, L.; Sun, M.; MacFabe, D.F.; O’Brien, T.J. Intracerebroventricular injection of propionic acid, an enteric metabolite implicated in autism, induces social abnormalities that do not differ between seizure-prone (FAST) and seizure-resistant (SLOW) rats. Behav. Brain Res. 2015, 278, 542–548. [Google Scholar] [CrossRef] [PubMed]
  16. Kocot, J.; Kiełczykowska, M.; Luchowska-Kocot, D.; Kurzepa, J.; Musik, I. Antioxidant Potential of Propolis, Bee Pollen, and Royal Jelly: Possible Medical Application. Oxidative Med. Cell. Longev. 2018, 2018, 7074209. [Google Scholar] [CrossRef] [PubMed]
  17. Oyarzún, J.E.; Andia, M.E.; Uribe, S.; Núñez Pizarro, P.; Núñez, G.; Montenegro, G.; Bridi, R. Honeybee pollen extracts reduce oxidative stress and steatosis in Hepatic cells. Molecules 2020, 26, 6. [Google Scholar] [CrossRef]
  18. Rzepecka-Stojko, A.; Stojko, J.; Kurek-Górecka, A.; Górecki, M.; Kabała-Dzik, A.; Kubina, R.; Moździerz, A.; Buszman, E. Polyphenols from Bee Pollen: Structure, Absorption, Metabolism and Biological Activity. Molecules 2015, 20, 21732–21749. [Google Scholar] [CrossRef] [Green Version]
  19. Spulber, R.; Doğaroğlu, M.; Băbeanu, N.; Popa, O. Physicochemical characteristics of fresh bee pollen from different botanical origins. Rom. Biotechnol. Lett. 2018, 23, 13357–13365. [Google Scholar]
  20. Taha, E.A.; Al-Kahtani, S. Macro- and trace elements content in honeybee pollen loads in relation to the harvest season. Saudi J. Biol. Sci. 2020, 27, 1797–1800. [Google Scholar] [CrossRef]
  21. Kieliszek, M.; Piwowarek, K.; Kot, A.M.; Błażejak, S.; Chlebowska-Śmigiel, A.; Wolska, I. Pollen and bee bread as new health-oriented products: A review. Trends Food Sci. Technol. 2018, 71, 170–180. [Google Scholar] [CrossRef]
  22. Prđun, S.; Svečnjak, L.; Valentić, M.; Marijanović, Z.; Jerković, I. Characterization of Bee Pollen: Physico-Chemical Properties, Headspace Composition and FTIR Spectral Profiles. Foods 2021, 10, 2103. [Google Scholar] [CrossRef] [PubMed]
  23. Szczesna, T. Long chain fatty acids composition of honeybee-collected pollen. J. Apic. Sci. 2006, 50, 65–79. [Google Scholar]
  24. Khider, M.; Elbanna, K.; Mahmoud, A.; Owayss, A.A. Egyptian honeybee pollen as antimicrobial, antioxidant agents, and dietary food supplements. Food Sci. Biotechnol. 2013, 22, 1–9. [Google Scholar] [CrossRef]
  25. Solgajová, M.; Ivanišová, E.; Nôžkova, J.; Frančáková, H.; Tóth, Ž.; Dráb, Š. Antioxidant activity and polyphenol content of malt beverages enriched with bee pollen. J. Microbiol. Biotechnol. Food Sci. 2014, 3, 281–284. [Google Scholar]
  26. Haro, A.; López-Aliaga, I.; Lisbona, F.; Barrionuevo, M.; Alférez, M.J.; Campos, M.S. Beneficial effect of pollen and/or propolis on the metabolism of iron, calcium, phosphorus, and magnesium in rats with nutritional ferropenic anemia. J. Agric. Food Chem. 2000, 48, 5715–5722. [Google Scholar] [CrossRef]
  27. Denisow, B.; Denisow-Pietrzyk, M. Biological and therapeutic properties of bee pollen: A review. J. Sci. Food Agric. 2016, 96, 4303–4309. [Google Scholar] [CrossRef]
  28. Komosinska-Vassev, K.; Olczyk, P.; Kázmierczak, J.; Mencner, L.; Olczyk, K. Bee pollen chemical composition and therapeutic application. J. Evid. Based Complement. Altern. Med. 2015, 2015, 297425. [Google Scholar] [CrossRef] [Green Version]
  29. Salem, H.; Al-Youssef, H.; Ashour, A.; Ahmed, A.; Amina, M.; Issa, I.; Bhat, R. Antioxidant and hepatorenal protective effects of bee pollen fractions against propionic acid-induced autistic feature in rats. Food Sci. Nutr. 2020, 8, 5114–5127. [Google Scholar] [CrossRef]
  30. Al-Yousef, H.M.; Alkhulaifi, M.M.; Al-Salem, H.S.; Syed, R.A. Clostridium perfringens induced autism disorders counteract by using natural BP in vitro. J. Biol. Med. Res. 2018, 2, 8. [Google Scholar]
  31. El-Ansary, A.K.; Bacha, A.B.; Kotb, M. Etiology of autistic features: The persisting neurotoxic effects of propionic acid. J. Neuroinflamm. 2012, 9, 74. [Google Scholar] [CrossRef] [Green Version]
  32. Daghestani, M.H.; Selim, M.E.; Abd-Elhakim, Y.M.; Said, E.N.; El-Hameed, N.E.A.; Khalil, S.R.; El-Tawil, O.S. The role of apitoxin in alleviating propionic acid-induced neurobehavioral impairments in rat pups: The expression pattern of Reelin gene. Biomed. Pharmacother. 2017, 93, 48–56. [Google Scholar] [CrossRef] [PubMed]
  33. Olloquequi, J.; Cornejo-Córdova, E.; Verdaguer, E.; Soriano, F.X.; Binvignat, O.; Auladell, C.; Camins, A. Excitotoxicity in the pathogenesis of neurological and psychiatric disorders: Therapeutic implications. J. Psychopharmacol. 2018, 32, 265–275. [Google Scholar] [CrossRef] [PubMed]
  34. Lv, S.; Song, H.L.; Zhou, Y.; Li, L.X.; Cui, W.; Wang, W.; Liu, P. Tumour necrosis factor-alpha affects blood-brain barrier permeability and tight junction-associated occludin in acute liver failure. Liver Int. 2010, 30, 1198–1210. [Google Scholar] [CrossRef] [PubMed]
  35. Mirza, R.; Sharma, B. A selective peroxisome proliferator-activated receptor-γ agonist benefited propionic acid induced autism-like behavioral phenotypes in rats by attenuation of neuroinflammation and oxidative stress. Chem. Biol. Interact. 2019, 311, 108758. [Google Scholar] [CrossRef] [PubMed]
  36. Dolga, A.M.; Granic, I.; Blank, T.; Knaus, H.G.; Spiess, J.; Luiten, P.G.; Eisel, U.L.; Nijholt, I.M. TNF-alpha-mediates neuroprotection against glutamate-induced excitotoxicity via NF-kappaB-dependent up-regulation of K2.2 channels. J. Neurochem. 2008, 107, 1158–1167. [Google Scholar]
  37. Macfabe, D.F. Short-chain fatty acid fermentation products of the gut microbiome: Implications in autism spectrum disorders. Microb. Ecol. Health Dis. 2012, 23, 19260. [Google Scholar] [CrossRef]
  38. El-Ansary, A.; Al-Ayadhi, L. GABAergic/glutamatergic imbalance relative to excessive neuroinflammation in autism spectrum disorders. J Neuroinflammation. 2014, 1, 189. [Google Scholar] [CrossRef]
  39. Rörig, B.; Klausa, G.; Sutor, B. Intracellular acidification reduced gap junction coupling between immature rat neocortical pyramidal neurones. J. Physiol. 1996, 490 Pt 1, 31–34. [Google Scholar] [CrossRef] [Green Version]
  40. Dringen, R.; Pawlowski, P.G.; Hirrlinger, J. Peroxide detoxification by brain cells. J. Neurosci. Res. 2005, 79, 157–165. [Google Scholar] [CrossRef]
  41. Pawate, S.; Shen, Q.; Fan, F.; Bhat, N.R. Redox regulation of glial inflammatory response to lipopolysaccharide and interferon gamma. J. Neurosci. Res. 2004, 77, 540–551. [Google Scholar] [CrossRef]
  42. Zhang, B.; Yin, X.-R.; Li, X.; Yang, S.-L.; Ferguson, I.; Chen, K.-S. Lipoxygenase Gene Expression in Ripening Kiwifruit in Relation to Ethylene and Aroma Production. J. Agric. Food Chem. 2009, 57, 2875–2881. [Google Scholar] [CrossRef] [PubMed]
  43. Chopra, K.; Kumar, B.; Kuhad, A. Pathobiological targets of depression. Expert Opin Ther. Targets 2011, 15, 379. [Google Scholar] [CrossRef] [PubMed]
  44. Erten, F. Lycopene ameliorates propionic acid-induced autism spectrum disorders by inhibiting inflammation and oxidative stress in rats. J. Food Biochem. 2021, 45, e13922. [Google Scholar] [CrossRef] [PubMed]
  45. Alabdali, A.; Al-Ayadhi, L.; El-Ansary, A. Association of social and cognitive impairment and biomarkers in autism spectrum disorders. J. Neuroinflam. 2014, 11, 4. [Google Scholar] [CrossRef] [Green Version]
  46. Kalinichenko, L.S.; Kornhuber, J.; Müller, C.P. Individual differences in inflammatory and oxidative mechanisms of stress-related mood disorders. Front. Neuroendocrinol. 2019, 55, 100783. [Google Scholar] [CrossRef]
  47. Ambrogini, P.; Torquato, P.; Bartolini, D.; Albertini, M.C.; Lattanzi, D.; Di Palma, M.; Marinelli, R.; Betti, M.; Minelli, A.; Cuppini, R.; et al. Excitotoxicity, neuroinflammation and oxidant stress as molecular bases of epileptogenesis and epilepsy-derived neurodegeneration: The role of vitamin E. Biochim. Biophys. Acta Mol. Basis Dis. 2019, 1865, 1098–1112. [Google Scholar] [CrossRef]
  48. Kostić, A.Ž.; Milinčić, D.D.; Barać, M.B.; Ali Shariati, M.; Tešić, Ž.L.; Pešić, M.B. The Application of Pollen as a Functional Food and Feed Ingredient-The Present and Perspectives. Biomolecules 2020, 10, 84. [Google Scholar] [CrossRef] [Green Version]
  49. Melo, I.L.P.D.; Almeida-Muradian, L.B.D. Stability of antioxidants vitamins in bee pollen samples. Química Nova 2010, 33, 514–518. [Google Scholar] [CrossRef]
  50. Alfawaz, H.; Al-Onazi, M.; Bukhar.i, S.I.; Binobead, M.; Othman, N.; Algahtani, N.; Bhat, R.S.; Moubayed, N.M.S.; Alzeer, H.S.; El-Ansary, A. The independent and combined effects of omega-3 and vitamin B12 in ameliorating propionic acid induced biochemical features in juvenile rats as rodent model of autism. J. Mol. Neurosci. 2018, 66, 403–413. [Google Scholar] [CrossRef]
  51. Catania, A. Neuroprotective actions of melanocortins: A therapeutic opportunity. Trends Neurosci. 2008, 31, 353–360. [Google Scholar] [CrossRef]
  52. Li, Q.; Liang, X.; Guo, N.; Hu, L.; Prasad, E.M.; Wu, Y.; Xue, X.; Wu, L.; Wang, K. Protective effects of Bee pollen extract on the Caco-2 intestinal barrier dysfunctions induced by dextran sulfate sodium. Biomed. Pharmacother. 2019, 117, 109200. [Google Scholar] [CrossRef] [PubMed]
  53. De Angelis, M.; Piccolo, M.; Vannini, L.; Siragusa, S.; De Giacomo, A.; Serrazzanetti, D.I.; Cristofori, F.; Guerzoni, M.E.; Gobbetti, M.; Francavilla, R. Fecal microbiota and metabolome of children with autism and pervasive developmental disorder not otherwise specified. PLoS ONE 2013, 8, e76993. [Google Scholar] [CrossRef] [PubMed] [Green Version]
  54. Lee, Y.; Park, J.Y.; Lee, E.H.; Yang, J.; Jeong, B.R.; Kim, Y.K.; Seoh, J.Y.; Lee, S.; Han, P.L.; Kim, E.J. Rapid Assessment of Microbiota Changes in Individuals with Autism Spectrum Disorder Using Bacteria-derived Membrane Vesicles in Urine. Exp. Neurobiol. 2017, 26, 307–317. [Google Scholar] [CrossRef] [Green Version]
  55. Abujamel, T.S.; Al-Otaibi, N.M.; Abuaish, S.; AlHarbi, R.H.; Assas, M.B.; Alzahrani, S.A.; Alotaibi, S.M.; El-Ansary, A.; Aabed, K. Different Alterations in Gut Microbiota between Bifidobacterium longum and Fecal Microbiota Transplantation Treatments in Propionic Acid Rat Model of Autism. Nutrients 2022, 14, 608. [Google Scholar] [CrossRef] [PubMed]
  56. Mărgăoan, R.; Mărghitaş, L.A.; Dezmirean, D.S.; Gherman, B.; Chirilă, F.; Zacharias, I.; Bobiș, O. Antimicrobial Activity of Bee Pollen Ethanolic and Methanolic Extracts on Staphylococcus aureus Bacterial Strain. Bulletin of University of Agricultural Sciences and Veterinary Medicine Cluj-Napoca. Anim. Sci. Biotechnol. 2015, 72, 78–80. [Google Scholar] [CrossRef] [Green Version]
  57. Santos, A.C.D.; Biluca, F.C.; Braghini, F.; Gonzaga, L.V.; Costa, A.C.O.; Fett, R. Phenolic composition and biological activities of stingless bee honey: An overview based on its aglycone and glycoside compounds. Food Res. Int. 2021, 147, 110553. [Google Scholar] [CrossRef]
  58. Aabed, K.; Bhat, R.S.; Al-Dbass, A.; Moubayed, N.; Algahtani, N.; Merghani, N.M.; Alanazi, A.; Zayed, N.; El-Ansary, A. Bee Pollen and Propolis Improve Neuroinflammation and Dysbiosis Induced by Propionic Acid, a Short Chain Fatty Acid in a Rodent Model of Autism. Lipids Health Dis. 2019, 18, 200. [Google Scholar] [CrossRef] [Green Version]
  59. Beutler, E.; Duran, O.; Kelly, B.M. Improved method for the determination of blood glutathione. J. Lab. Clin. Med. 1963, 61, 882–888. [Google Scholar]
  60. Ruiz-Larrea, M.B.; Leal, A.M.; Liza, M.; Lacort, M.; de Groot, H. Antioxidant effects of estradiol and 2-hydroxyestradiol on iron-induced lipid peroxidation of rat liver microsomes. Steroids 1994, 59, 383–388. [Google Scholar]
  61. Jagota, S.K.; Dani, H.M. A New colorimetric technique for the estimation of Vitamin C using Folin phenol reagent. Anal. Biochem. 1982, 15, 178. [Google Scholar] [CrossRef]
  62. Zhang, F.M.; Wang, H.G.; Wang, M. Fecal microbiota transplantation for severe enterocolonic fistulizing Crohn’s disease. World J. Gastroenterol. 2013, 19, 7213–7216. [Google Scholar] [CrossRef] [PubMed]
  63. Li, S.S.; Zhu, A.; Benes, V.; Costea, P.I.; Hercog, R.; Hildebrand, F.; Huerta-Cepas, J.; Nieuwdorp, M.; Salojärvi, J.; Voigt, A.Y.; et al. Durable coexistenceof donor and recipient strains after fecal microbiota transplantation. Science 2016, 352, 586–589. [Google Scholar] [CrossRef] [PubMed]
Figure 1. Levels of the biomarkers used in ASD (Group II; APP-treated), ASD/bee pollen-protected (Group III), and control (group I) rats. * denotes a statistically significant difference between groups I and II, # denotes a statistically significant difference between groups I and III, and $ denotes statistically significant difference between groups II and III. NE: norepinephrine, 5-HT: serotonin, DA: dopamine, GABA: gamma-aminobutyric acid, Glut: glutamate, Gln: glutamine, IFN-γ: interferon gamma, IL-x: interleukin x, VEGF: vascular endothelial growth factor, TNF-α: tumor necrosis factor alpha, Casp-3: caspase 3, GSH: glutathione, VitC: vitamin C, LipPerox: lipid peroxidase.
Metabolites 12 00571 g001
Figure 2. Average Bacterial counts in fecal samples of control, PPA-induced rodent model of autism, and bee pollen-protected autism model. NA: nutrient agar, MAC: MacConkey’s agar, BA: blood agar, CCFA: cycloserine cefoxitin fructose agar, BBE: Bacteroides bile esculin agar. Nutrient agar—Gram-positive/Gram-negative rods and cocci; MacConkey—Enterobacteriaceae (Gram-negative rods, lactose fermenters); Blood agar—Gram-positive/Gram-negative rods and cocci; CCFA (Cycloserine Cefoxitin Fructose Agar)—Clostridioides difficile; BBE (Bile Esculin Agar)—Bacteroidetes, streptococci, and enterococci.
Metabolites 12 00571 g002
Table 1. Mean ± S.D. of the measured variables in PPA-treated (Group II) and bee pollen-protected animals (Group III) compared to controls. GABA: gamma-aminobutyric acid, IFN-γ: interferon gamma, IL-x: interleukin x, VEGF: vascular endothelial growth factor, TNF-α: tumor necrosis factor alpha. * denotes significance between ASD model or BP-protected ASD model and control; # denotes significance between BP-protected ASD model and ASD model; $ denotes significance between the three studied groups.
VariablesControlASD ModelBee Pollen-Protected ASD Model
Norepinephrine (ng/100 mg)4.92 ± 0.6183.25 ± 0.36 *,#3.79 ± 0.15 *,#
Serotonin (ng/100 mg)6.20 ± 0.783.78 ± 0.56 *,#4.36 ± 0.42 *,#
Dopamine (ng/100 mg)21.12 ± 2.7213.69 ± 0.80 *,#16.09 ± 0.71 *,#
GABA (ng/100 mg)2.95 ± 0.241.40 ± 0.29 *,#1.70 ± 0.24 *,#
Glutamate (µg/mg)1.44 ± 0.113.05 ± 0.27 *,#1.85 ± 0.10 *,#
GABA/Glutamine2.04 ± 0.060.46 ± 0.11 *,#0.92 ± 0.12 *,#
Glutamine (µg/mg)0.70 ± 0.070.64 ± 0.08 *,#0.71 ± 0.05 *,#
Glutamate/Glutamine2.09 ± 0.194.80 ± 0.52 *,#2.62 ± 0.30 *,#
IFN-γ (pg/mL)120.71 ± 167.85127.09 ± 192.57 $21.86 ± 32.80 $
IL-1A (pg/mL)190.54 ± 68.50217.85 ± 76.89 *,#125.94 ± 37.27 *,#
IL-6 (pg/mL)18.87 ± 4.6946.44 ± 61.93 $25.64 ± 27.15 $
IL-10 (pg/mL)213.86 ± 212.9876.76 ± 36.44 $94.08 ± 28.87 $
IL-12 (pg/mL)82.07 ± 8.6571.03 ± 7.57 $70.11 ± 13.10 $
VEGF (pg/mL)5.95 ± 2.435.36 ± 2.64 $,#3.58 ± 0.85 *,#
TNF-α (pg/mL)17.11 ± 1.3914.50 ± 0.91 $,#13.95 ± 3.27 *,#
Caspase-3 (u/100 mg)112.66 ± 4.20134.79 ± 3.27 *,#124.23 ± 2.89 *,#
Glutathione (µg/mL)36.44 ± 2.4335.07 ± 2.83 *,$43.65 ± 2.09 *,#
Vitamin C (µg/mL)20.16 ± 2.0011.74 ± 1.16 *,#20.42 ± 3.42 $,#
Lipid peroxides0.35 ± 0.010.39 ± 0.01 *,#0.36 ± 0.01 $,#
Table 2. Spearman correlation matrix. Only significant correlations are shown (p value < 0.05). Correlation heatmap depicts perfect positive (darks blue) and negative (dark red) correlations and no correlation (white). Significance heatmap depicts p values ranging from 0.000 (green) to 0.05 (orange). NE: norepinephrine, 5-HT: serotonin, DA: dopamine, GABA: gamma-aminobutyric acid, Glut: glutamate, Gln: glutamine, IL-12: interleukin 12, VEGF: vascular endothelial growth factor, TNF-α: tumor necrosis factor alpha, GSH: glutathione, VitC: vitamin C, MDA: 3,4-methylenedioxyamphetamine.
VariableCorrelated VariablesSpearman Correlation (R)p ValueVariableCorrelated VariablesSpearman Correlation (R)p Value
InterferonϒNE−0.8290.000Norepinephrine5-HT 0.820.000
5-HT −0.690.002DA 0.8880.000
DA−0.8180.000Caspase 3 −0.8650.000
Caspase 3 0.7710.000GABA 0.9190.000
GABA −0.6860.002Glut −0.910.000
Glut 0.7560.000GABA/Glut0.950.000
GABA/Glut−0.7480.000Glut/Gln−0.850.000
Glut/Gln0.7350.001IL-12 0.4730.047
VEGF 0.6520.006TNF-α 0.5570.016
TNF-α 0.6490.007VitC0.6340.005
VitC−0.6460.004MDA−0.7020.001
MDA0.7170.001
Caspase 3GABA −0.8460.000DopamineCaspase 3 −0.9130.000
Glut 0.8560.000GABA 0.8390.000
GABA/Glut−0.8740.000Glut −0.8510.000
Glut/Gln0.8720.000GABA/Glut0.890.000
IL-12 −0.5270.024Glut/Gln−0.860.000
TNF-α −0.4990.035TNF-α 0.5080.031
VitC−0.6330.005VitC0.5960.009
MDA0.710.001MDA−0.7780.000
SerotoninDA0.8270.000GABAGlut−0.7810.000
Caspase 3 −0.8390.000GABA/Glut0.9260.000
GABA 0.8590.000Glut/Gln−0.7780.000
GABA/Glut0.8530.000VitC0.5210.027
Glut/Gln−0.8240.000MDA−0.6050.008
TNF-α 0.5470.019IL-1AGSH−0.750.001
VitC−0.6580.003MDA0.5280.035
GABA/GlutGlut/Gln−0.8620.000TNF-α 0.7460.000
TNF-α 0.4860.041GSHVitC0.5520.018
VitC0.6220.006
Lipid peroxides−0.7750.000VitCMDA−0.5530.017
Table 3. Regression analysis showing the relationships between five dependent variables and all other biomarkers. NE: norepinephrine, 5-HT: serotonin, DA: dopamine, GABA: gamma-aminobutyric acid, Glut: glutamate, Gln: glutamine, IFN-γ: interferon gamma, IFN-γ: interferon upsilon, IL-x: interleukin x, VEGF: vascular endothelial growth factor, TNF-α: tumor necrosis factor alpha, GSH: glutathione.
Dependent VariablePredictor VariableCoefficientS.E.p ValueAdjusted R295% CIDependent VariablePredictor VariableCoefficientS.E.p ValueAdjusted R295% CI
LowerUpperLowerUpper
Caspase 3Glut 10.0441.6120.0000.7916.39813.690VEGFIL-10 0.0110.0010.0000.8530.0080.014
Glut 8.6411.3970.0000.8685.41911.862IL-10 0.0110.0010.2140.9120.0090.014
IL-12 −0.3090.1230.000 −0.594−0.025IL-1A 0.0120.0050.0000.0020.023
Glut 6.9860.7120.0000.9725.3038.668IL-10 0.0110.0010.0000.9460.0090.013
IL-12 −0.4080.0600.000 −0.549−0.266IL-1A 0.0120.0040.0140.0030.020
Gln 64.78111.7330.001 37.03892.524IL-6 −0.0190.0080.045−0.0380.000
Glut 3.6951.2190.0230.9870.7126.678NEGABA 1.2050.1580.0000.8510.8481.563
IL-12 −0.4410.0430.000 −0.545−0.336GABA 0.6790.2510.5570.9040.0991.259
Gln 63.7968.1050.000 43.96583.627DA0.1380.0570.0270.0070.269
IFN-ϒ 0.1430.0490.026 0.0240.262IFN-γGlut 22.0352.9230.0000.84815.42328.646
Glut 2.7850.8970.0270.9940.4795.092IL-1AIL-12 2.8321.2280.0470.3010.0535.611
IL-12 −0.4700.0310.000 −0.550−0.390IL-12 4.1730.9670.0280.6501.9436.404
Gln 67.8685.7450.000 53.10182.635Glut/Gln24.7667.8400.0036.68842.844
IFN-ϒ 0.1880.0370.004 0.0930.283IL-10VEGF 80.79810.5350.0000.85356.965104.631
IL-10 0.0040.0020.039 0.0000.008VEGF 83.0268.1060.3530.91464.333101.719
Glut 2.7970.3560.0010.9991.8093.784IL-1A −1.0520.3880.000−1.946−0.158
IL-12 −0.5160.0150.000 −0.558−0.474GSHTNF-α −1.1340.4800.0420.314−2.220−0.048
Gln 74.8892.6370.000 67.56882.211TNF-α −1.2880.3670.0000.609−2.133−0.443
IFN-ϒ 0.2210.0160.000 0.1760.265IFN-ϒ −0.1300.0470.008−0.238−0.023
IL-10 0.0050.0010.001 0.0030.007Vitamin CGlut/Gln−3.2720.8640.0040.571−5.227−1.317
DA0.3370.0640.006 0.1600.514Glut/Gln−4.5710.8980.0000.714−6.641−2.501
GlutGlut/Gln0.7060.0400.0000.9690.6160.7965-HTGABA/Glut1.3850.2200.0000.7940.8871.883
Glut/Gln0.6850.0140.0000.9960.6530.717DANE3.1490.4360.0000.8362.1624.136
Gln 2.8690.3480.0002.0673.670GABAGABA/Glut0.9230.0690.0000.9470.7671.080
Glut/Gln0.7130.0090.0000.9990.6920.735IL-12TNF-α 2.9200.7860.0050.5611.1424.698
Gln 2.5810.1880.0002.1373.025TNF-αIL-12 0.2070.0560.0050.5610.0810.334
IFN-γ 0.0000.0000.0020.0000.000MDAGlut0.0180.0040.0020.6270.0090.028
Table 4. ROC-Curve of all variables in the PPA-treated and Bee pollen-protected groups. GABA: gamma-aminobutyric acid, Glut: glutamate, Gln: glutamine, IFN-γ: interferon gamma, IFN-γ: interferon upsilon, IL-x: interleukin x, VEGF: vascular endothelial growth factor, TNF-α: tumor necrosis factor alpha, GSH: glutathione.
ParametersGroupsAUCCut-off ValueSensitivitySpecificityp-Value95% CI
IFN-ϒ (pg/100 mg)PPA-acute1103.755100.0%100.0%0.0041.000–1.000
Pollen0.69482.67100.0%50.0%0.2620.369–1.020
Noradrenaline (ng/100 mg)PPA-acute13.955100.0%100.0%0.0041.000–1.000
Pollen14.135100.0%100.0%0.0041.000–1.000
Serotonin (ng/100 mg)PPA-acute14.795100.0%100.0%0.0041.000–1.000
Pollen15.105100.0%100.0%0.0041.000–1.000
Dopamine (ng/100 mg)PPA-acute116.52100.0%100.0%0.0041.000–1.000
Pollen117.62100.0%100.0%0.0041.000–1.000
Caspase-3 (u/100 mg)PPA-acute1124.76100.0%100.0%0.0041.000–1.000
Pollen1119.845100.0%100.0%0.0041.000–1.000
GABA (ng/100 mg)PPA-acute12.275100.0%100.0%0.0041.000–1.000
Pollen12.4100.0%100.0%0.0041.000–1.000
Glut (µg/mg)PPA-acute12.19100.0%100.0%0.0041.000–1.000
Pollen11.67100.0%100.0%0.0041.000–1.000
GABA/GlutPPA-acute11.29100.0%100.0%0.0041.000–1.000
Pollen11.52100.0%100.0%0.0041.000–1.000
Gln (µg/mg)PPA-acute0.7220.65566.7%66.7%0.20.421–1.023
Pollen0.5690.66583.3%50.0%0.6890.221–0.918
Glut/GlnPPA-acute13.295100.0%100.0%0.0041.000–1.000
Pollen0.9312.14100.0%66.7%0.0130.787–1.074
IFN-γ (pg/mL)PPA-acute0.525.3850.0%66.7%10.153–0.847
Pollen0.8338.44575.0%100.0%0.0880.524–1.143
IL-1A (pg/mL)PPA-acute0.633207.3550.0%80.0%0.4650.288–0.979
Pollen0.88146.23580.0%80.0%0.0470.662–1.098
IL-6 (pg/mL)PPA-acute0.52123.19550.0%83.3%0.9150.070–0.972
Pollen0.616.8860.0%83.3%0.5840.205–0.995
IL-10 (pg/mL)PPA-acute0.812122.27100.0%75.0%0.1490.465–1.160
Pollen0.875119.215100.0%75.0%0.0830.608–1.142
IL-12 (pg/mL)PPA-acute0.83372.83566.7%100.0%0.0550.593–1.073
Pollen0.86172.1383.3%100.0%0.0370.604–1.119
VEGF (pg/mL)PPA-acute0.5974.566.7%66.7%0.5750.253–0.941
Pollen0.8893.7266.7%100.0%0.0250.697–1.081
TNF-α (pg/mL)PPA-acute0.94415.09583.3%100.0%0.010.814–1.075
Pollen0.83314.84583.3%100.0%0.0550.535–1.132
Pollen0.86154.89100.0%66.7%0.0370.645–1.077
GSH (µg/mL)PPA-acute0.66737.4183.3%50.0%0.3370.346–0.987
Pollen139.565100.0%100.0%0.0041.000–1.000
Vitamin C (µg/mL)PPA-acute115.26100.0%100.0%0.0041.000–1.000
Pollen0.58320.48566.7%66.7%0.6310.234–0.933
Pollen0.6390.35566.7%66.7%0.4230.301–0.977
Publisher’s Note: MDPI stays neutral with regard to jurisdictional claims in published maps and institutional affiliations.

