Article

Rifampicin-Mediated Metabolic Changes in Mycobacterium tuberculosis

by
Soujanya D. Yelamanchi
1,
Archita Mishra
2,†,
Santosh Kumar Behra
3,†,
Gayathree Karthikkeyan
3,†,
Thottethodi Subrahmanya Keshava Prasad
3 and
Avadhesha Surolia
1,*
1
Molecular Biophysics Unit, Indian Institute of Science, Bangalore 560012, India
2
Telethon Kids Institute, Perth 6009, Australia
3
Center for Systems Biology and Molecular Medicine, Yenepoya Research Center, Yenepoya University, Mangalore 575018, India
*
Author to whom correspondence should be addressed.
These authors contributed equally to this work.
Metabolites 2022, 12(6), 493; https://doi.org/10.3390/metabo12060493
Submission received: 14 April 2022 / Revised: 13 May 2022 / Accepted: 24 May 2022 / Published: 29 May 2022
(This article belongs to the Section Endocrinology and Clinical Metabolic Research)

Abstract

:
Mycobacterium tuberculosis (Mtb) is considered to be a devastating pathogen worldwide, affecting millions of people globally. Several drugs targeting distinct pathways are utilized for the treatment of tuberculosis. Despite the monumental efforts being directed at the discovery of drugs for Mtb, the pathogen has also developed mechanisms to evade the drug action and host processes. Rifampicin was an early anti-tuberculosis drug, and is still being used as the first line of treatment. This study was carried out in order to characterize the in-depth rifampicin-mediated metabolic changes in Mtb, facilitating a better understanding of the physiological processes based on the metabolic pathways and predicted protein interactors associated with the dysregulated metabolome. Although there are various metabolomic studies that have been carried out on rifampicin mutants, this is the first study that reports a large number of significantly altered metabolites in wild type Mtb upon rifampicin treatment. In this study, a total of 173 metabolites, associated with pyrimidine, purine, arginine, phenylalanine, tyrosine, and tryptophan metabolic pathways, were significantly altered by rifampicin. The predicted host protein interactors of the rifampicin-dysregulated Mtb metabolome were implicated in transcription, inflammation, apoptosis, proteolysis, and DNA replication. Further, tricarboxylic acidcycle metabolites, arginine, and phosphoenolpyruvate were validated by multiple-reaction monitoring. This study provides a comprehensive list of altered metabolites that serves as a basis for understanding the rifampicin-mediated metabolic changes, and associated functional processes, in Mtb, which holds therapeutic potential for the treatment of Mtb.

1. Introduction

Mycobacterium tuberculosis (Mtb) predominantly infects the lungs of immunocompromised individuals, causing tuberculosis (TB) [1]. According to the 2021 World Health Organization (WHO) report, approximately 9.87 million people were infected with TB globally, of which 56% were men, 33% were women, and 11% were children. Moreover, 1.5 million deaths were reported worldwide with 15% of TB fatality ratio. Global estimates have shown that TB is considered to be the second leading cause of death due to a single pathogenic agent. Treatment of resistant strains—multidrug-resistant (MDR) and extremely drug-resistant (XDR) TB—has become a major concern, as the success rate for treating MDR/RR-TB is 59%, and for XDR-TB is 52% [2].
Rifampicin (RIF), a front-line of anti-tubercular agent, has been used in the treatment of TB for over half a century [3]. It is known to inhibit RNA polymerase by interacting with the β subunit of the enzyme, thus inhibiting the process of transcription [4]. It inhibits RNA synthesis by blocking the elongation step, thereby preventing protein synthesis and leading to bacterial killing [5,6]. There is a significant number of growing shreds of evidence on the acquisition of mutations in the Mtb β subunit of the RNA polymerase gene rpoB that lead to pathogenic resistance against RIF [7]. Further, drug tolerance to RIF is also observed in Mtb through mechanisms involving the enhanced activity of efflux pumps, metabolic shifts, and overexpression and mistranslation of the rpoB gene [8,9,10]. Despite the existence of drug tolerance and the emergence of resistance mechanisms in Mtb, the use of RIF in combination with other drugs is cataloged in the WHO model list of essential medicines 2021 [11]. Moreover, the TB treatment regimen includes RIF in the treatment of latent TB infections under Mtb drug susceptible conditions, as per the guidelines mentioned by the National Tuberculosis Controllers Association (NTCA) and Centers for Disease Control (CDC) and Prevention 2020 [12].
A couple of metabolomic studies have been reported in the recent past on RIF mutant strains of Mtb. A study has previously reported 16 differential metabolites by GC–MS analysis in two RIF mutant strains of Mtb [13]. In another study, GC–MS analysis resulted in the identification of 15 metabolites in wild type and S531L and S522L RIF mutant strains of Mtb [14]. Similarly, 87 metabolite features in methanol extraction, and 99 features in chloroform fraction, have been reported to be significant in two rpoB mutant strains, compared to wild-type Mtb [15]. In addition to these studies, metabolomic analysis has also been carried out on RIF-treated Mycobacterial strains. Man D.K et al. have reported a number of differential metabolites in RIF-treated M. smegmatis [16]. Further, LC–MS analysis has shown 122 altered metabolites in Mtb cells treated with RIF at 0.1 to 6.4 µg/mL for a period of 24 h to 72 h [9]. These metabolites were majorly classified as carboxylic acids, amino acids, and tricarboxylic acids and their derivatives. They also included purines nucleosides, pyrimidines, primary aliphatic amines, and carbohydrates and its conjugates.
Metabolites, the reactants of the metabolic pathways, are the vital signaling molecules in the cell. These represent the phenotype of the cell by governing various physiological functions through metabolite–protein interactions [17,18]. Over the past decade, metabolomics has advanced rapidly in areas of biomarker discovery, drug development, and precision medicine [19]. As RIF continues to be the first-line drug for the treatment of TB, it is essential to understand the global metabolic perturbations caused by this drug in Mtb. In this study, we performed a metabolomic analysis of Mtb upon RIF treatment, and, unlike previous studies, here we were able to identify 157 non-redundant metabolites that have not been previously reported. We performed global and targeted metabolomic analyses at the MS2 level using a high-throughput mass spectrometer to identify the dysregulated metabolites by RIF in Mtb.

2. Results

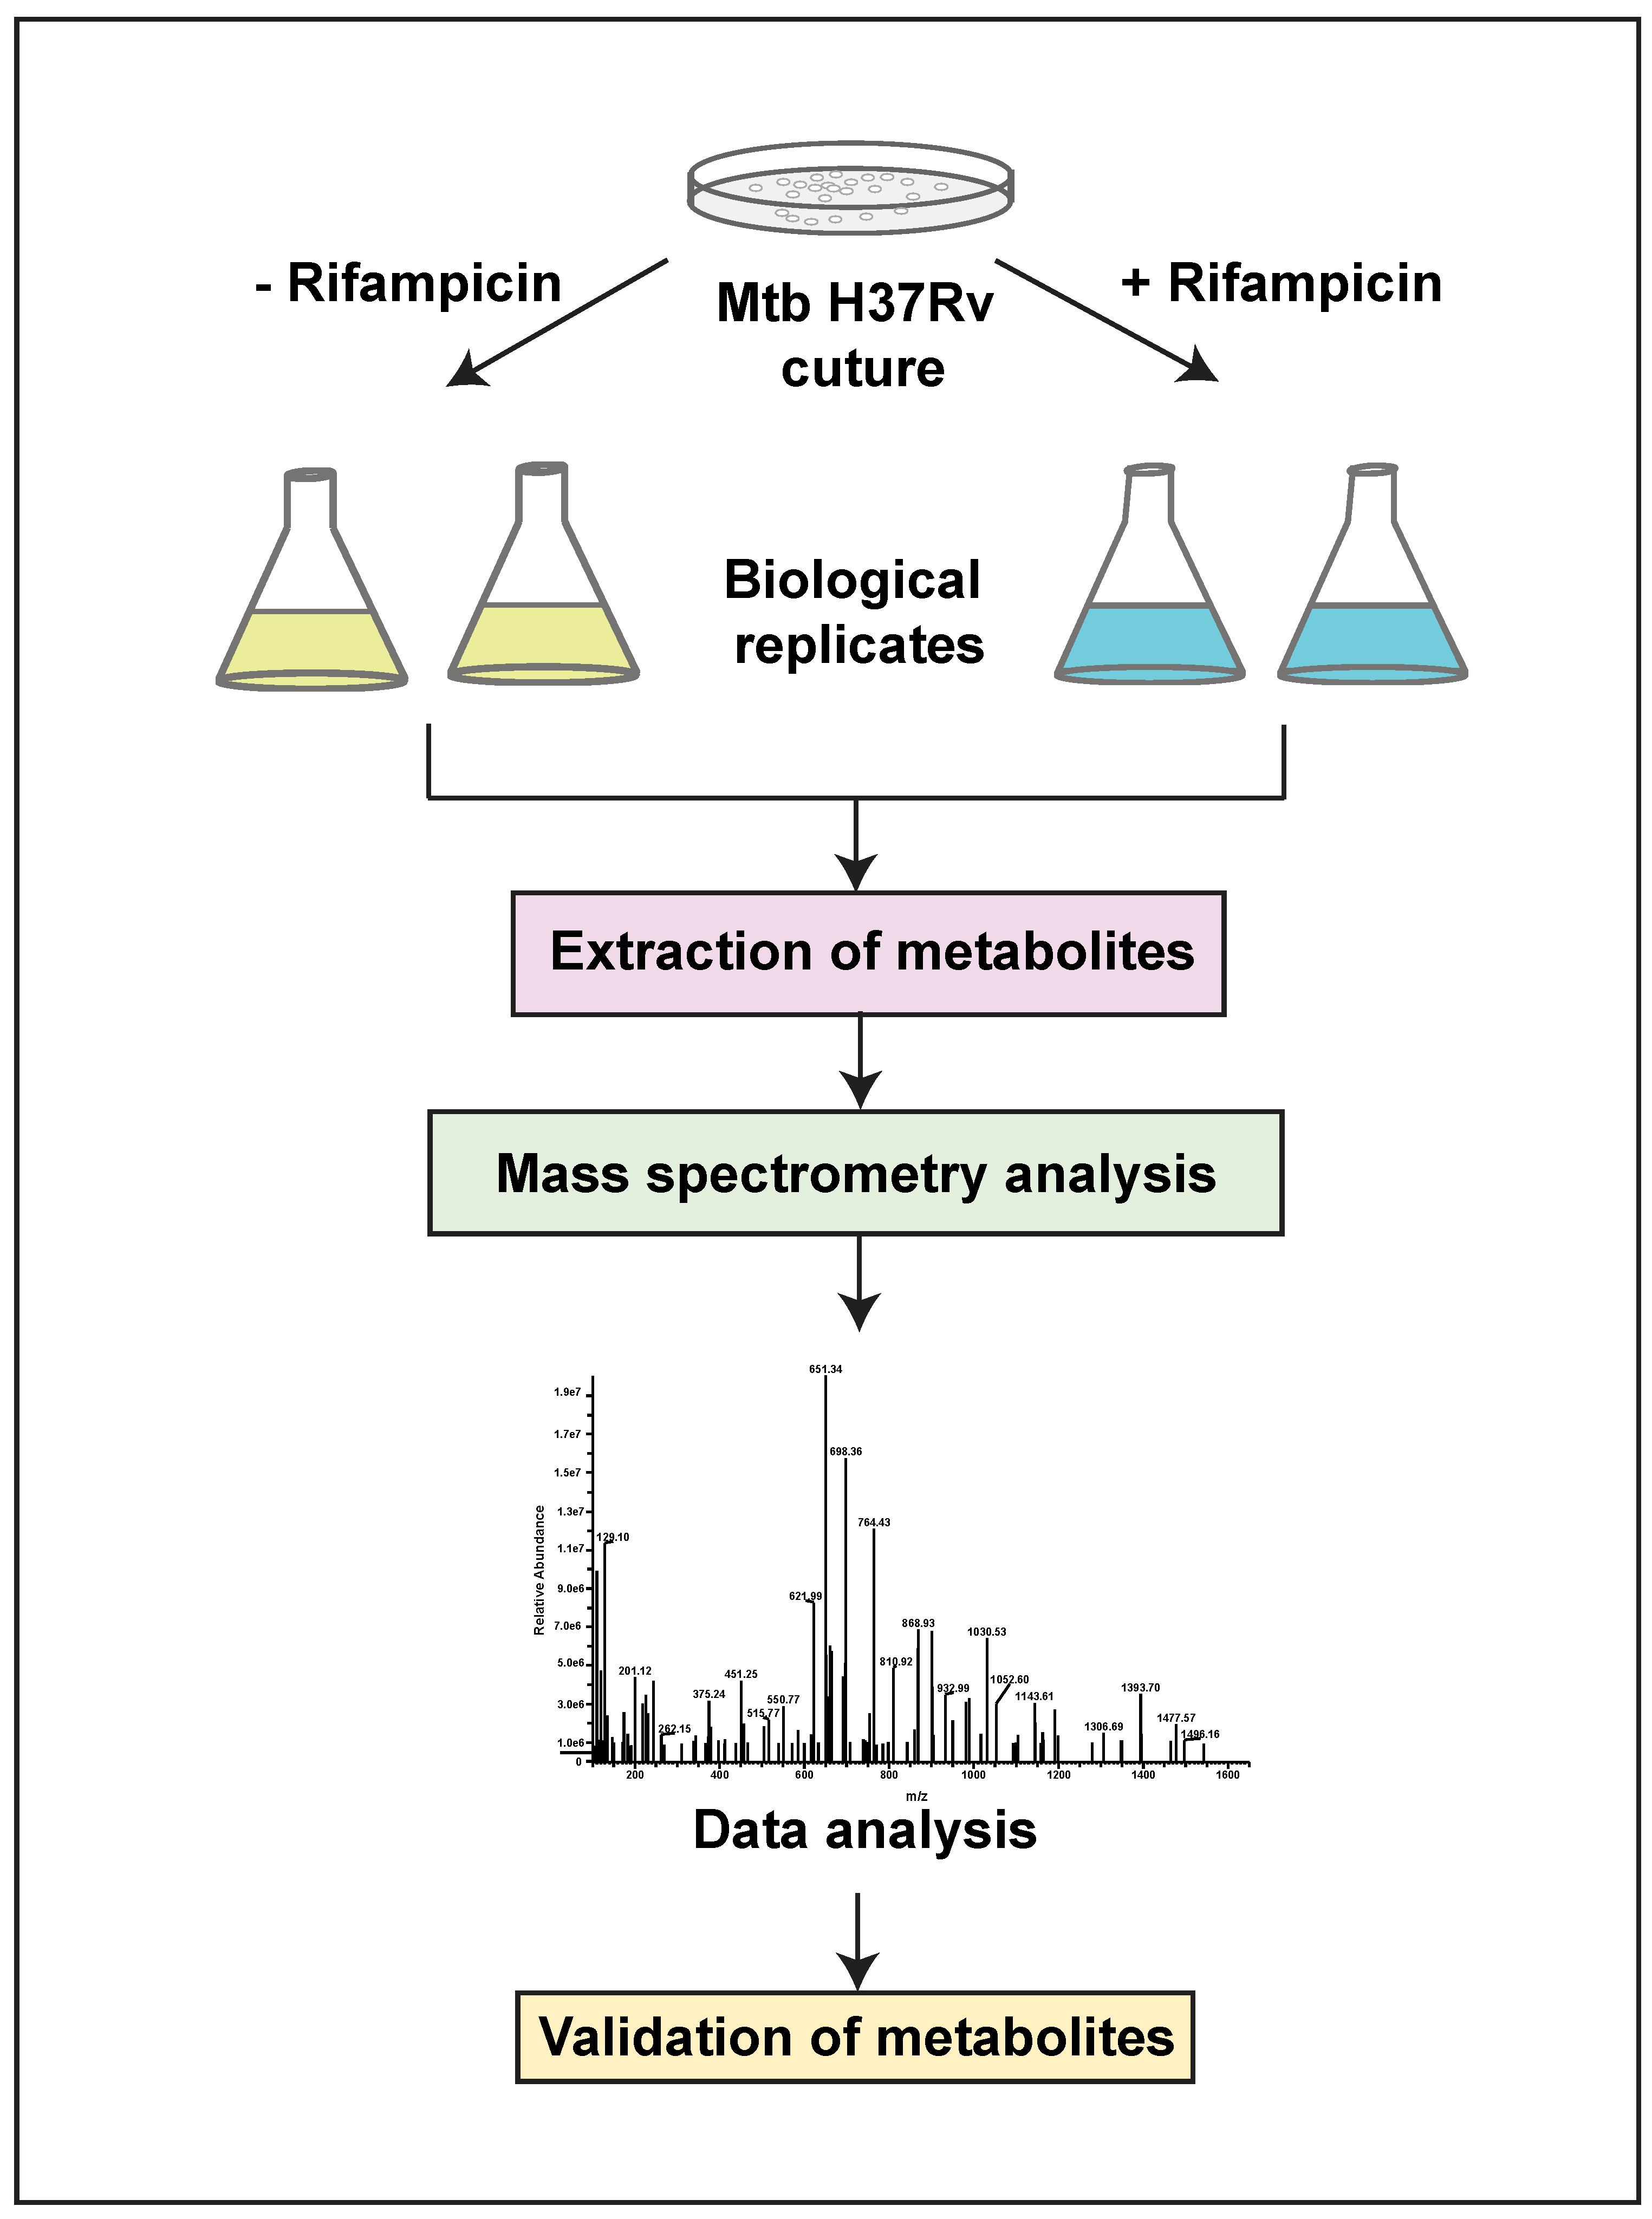
2.1. MS2 Identification of Mtb Metabolites by RIF Treatment

Mass spectrometry analysis of Mtb lysates in the presence and absence of RIF treatment was carried out in triplicate runs for each biological replicate. A schematic illustration of the experimental and analysis pipeline is shown in Figure 1. LC–MS/MS analysis led to the identification of 2290 aligned peaks in positive mode and 2311 aligned peaks in negative mode. The list of aligned peak features in positive and negative modes is tabulated in Supplementary Materials, Tables S1 and S2. Of these, 2224 aligned peak features in positive mode and 2258 aligned peak features in negative mode were observed in two technical replicates for each biological group. Collectively, 461 features in positive mode and 280 features in negative mode were mapped, at the MS2 level, to the Mtb H37Rv strain of KEGG [20] and BioCyc [21] databases, for the first time, in this study. Hierarchical clustering of Mtb and RIF-treated aligned peak features showed significant clustering of replicates and discrete separation between the groups. This analysis was carried out separately for data acquired from positive and negative modes, as shown in Figure 2A,B.
The mass spectrometry-derived data quality was examined by comparing control and RIF-treated sample runs with the intermediate blank runs to rule out the possibility of sample carry over [22]. Hence, PCA analysis was carried out, which showed discrete separation of sample groups from blank runs. Further, PLS discriminant analysis (PLS-DA) of sample groups and blank runs showed variable importance in projection (VIP) scores of important features that were either insignificant or undetected in the blank runs [23]. The schematic illustrations of PCA and PLS-DA analyses are provided in Supplementary Materials, Figure S1.

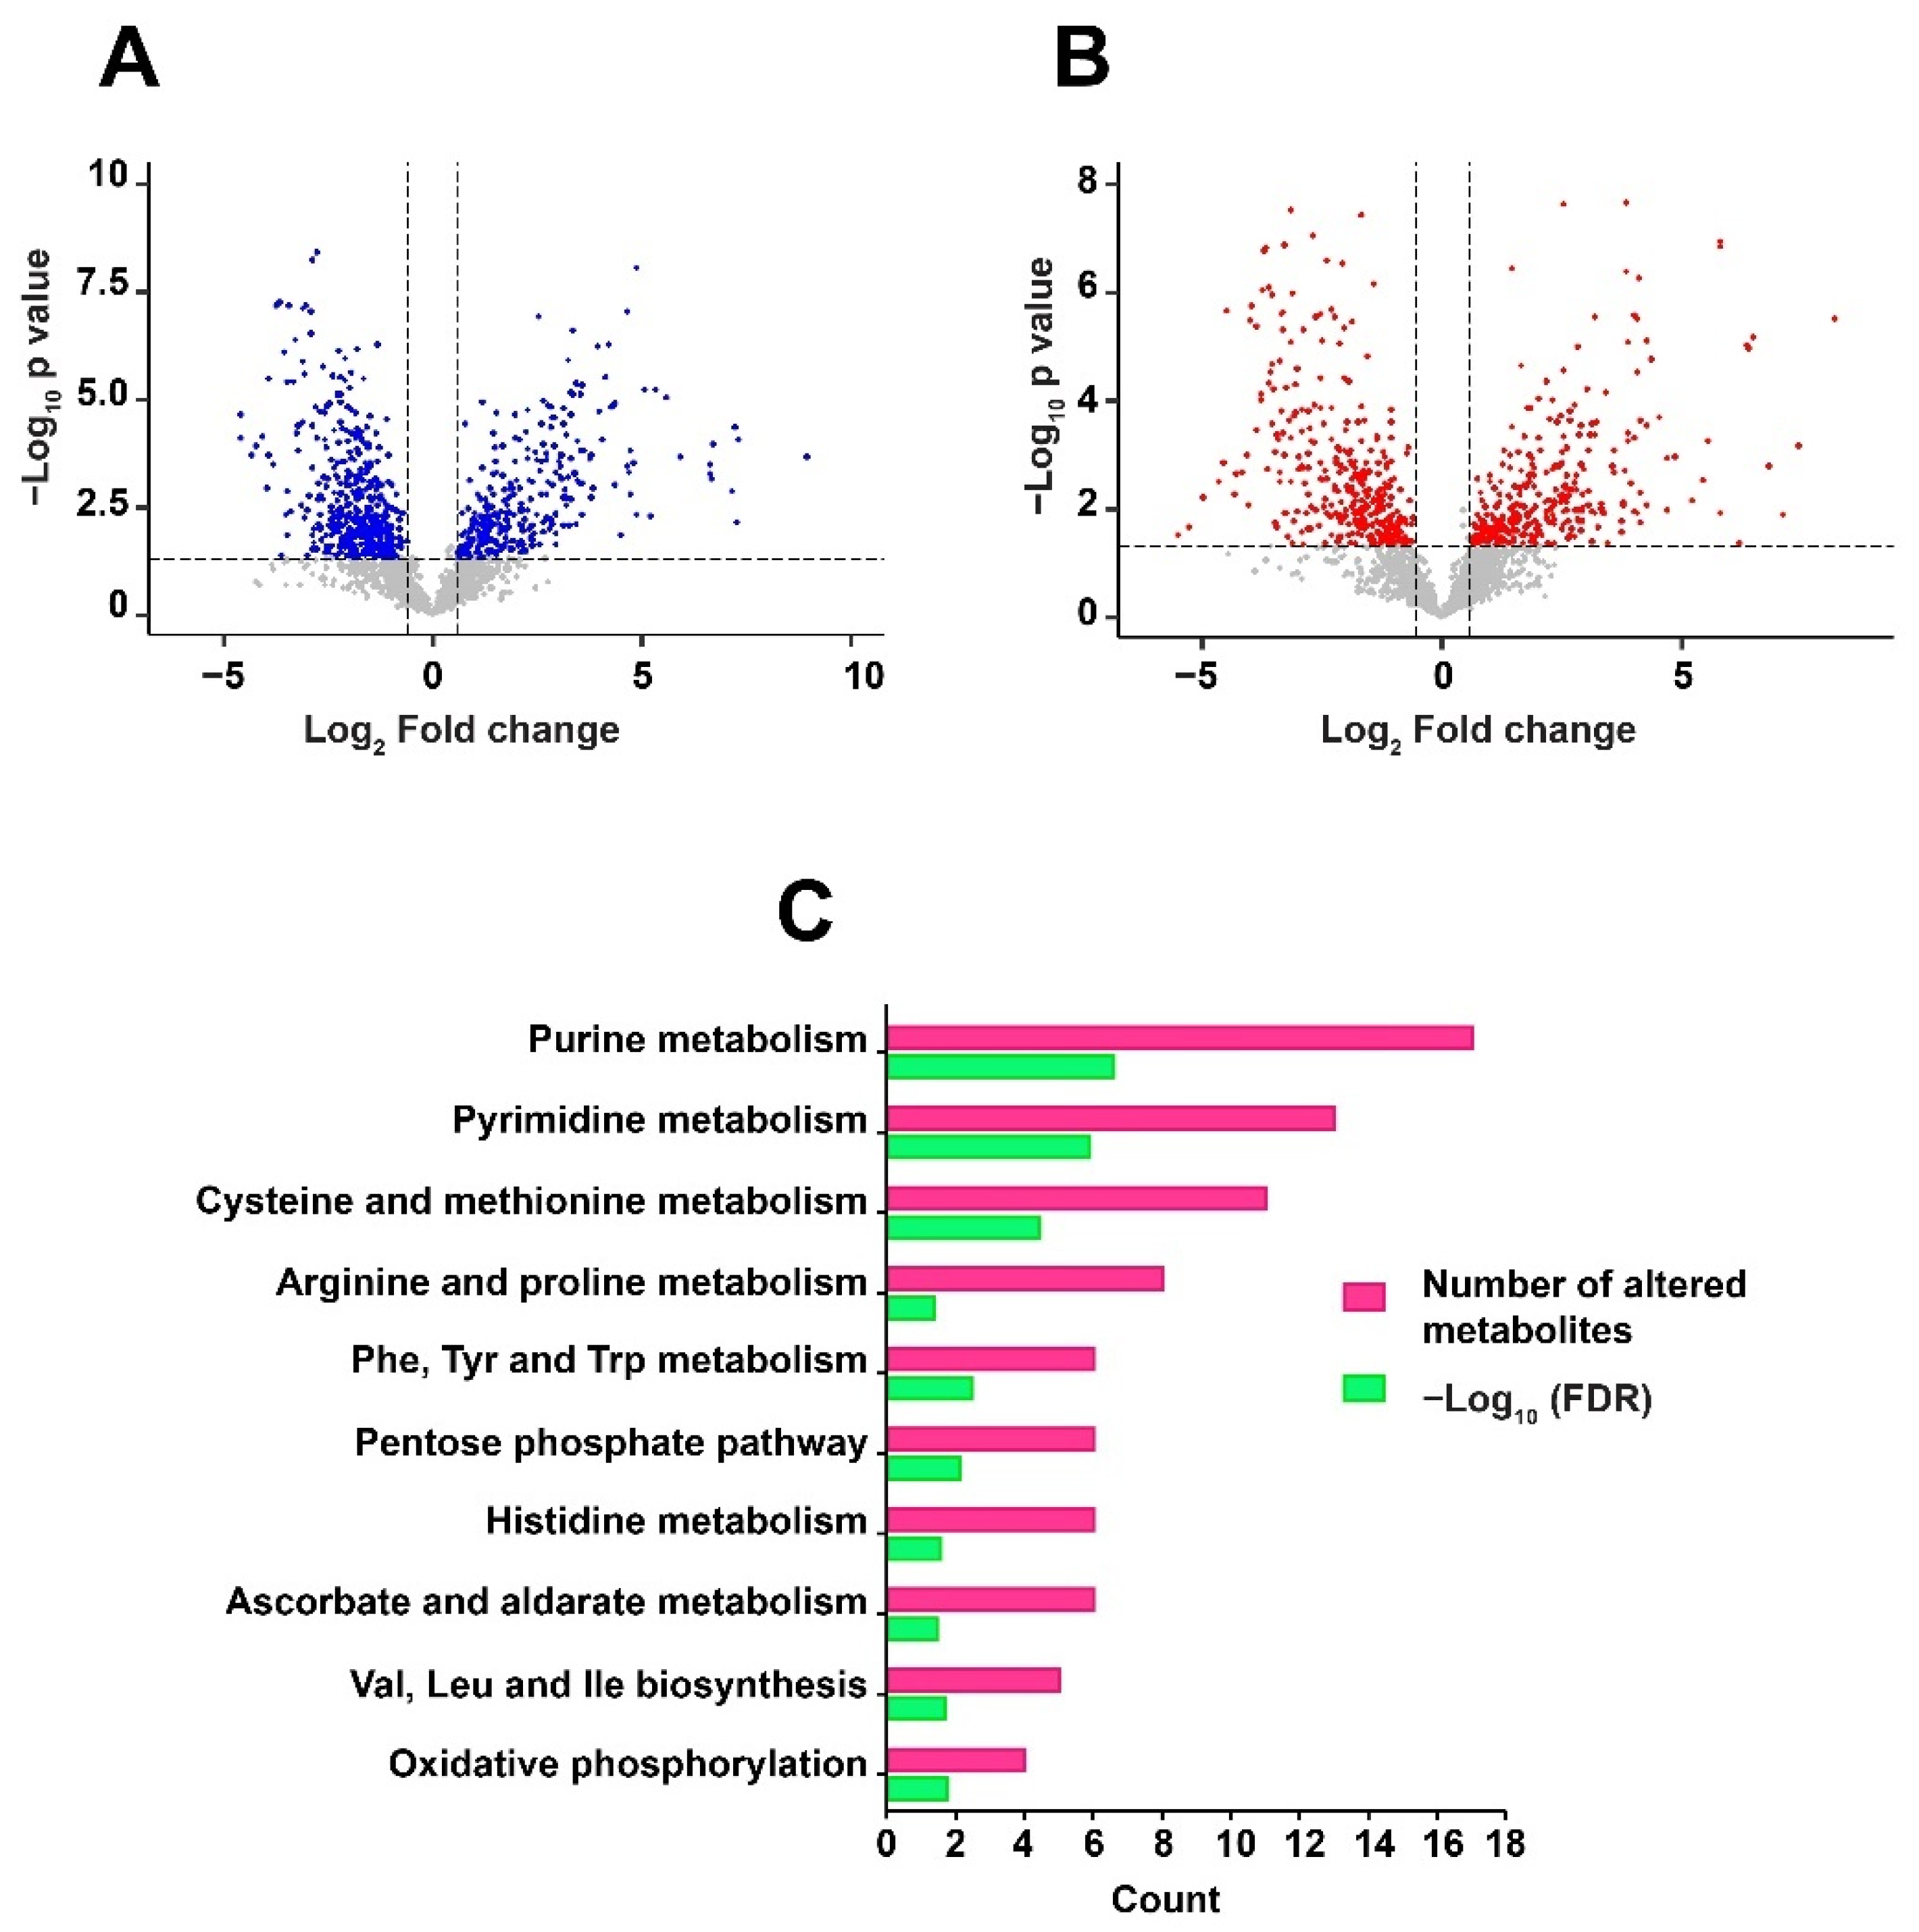
2.2. Metabolic Dysregulation in Mtb by RIF

Differentially regulated metabolites were analyzed using an unpaired t-test to calculate the p-values. Metabolites with a fold change of 1.5 and p-value ≤ 0.05 were considered to be significantly altered. A significant dysregulation of 680 metabolite features in positive mode, and 631 metabolite features in negative mode, was observed in response to RIF in Mtb. Of these, 101 metabolites in positive mode and 75 metabolites in negative mode were non-redundantly assigned to Mtb databases. Drugs, alkaloids, and other mapped exogenous compounds were deleted for downstream analysis [24]. Differential expression of the identified metabolites, including significant and non-significant, are depicted as volcano plots in Figure 3A,B. A partial list of differentially expressed metabolites, with significant raw p-values (≤0.05), is given in Table 1. The entire list of significantly altered metabolites, in both positive mode and negative mode, is provided in Supplementary Materials, Tables S3 and S4, respectively.

2.3. Metabolic Pathway Analysis and Classification of Metabolites

Metabolic pathway analysis plays a significant role in understanding the physiological processes associated with the altered metabolites. Pathway enrichment was carried out against Mtb H37Rv using MBROLE [25]. KEGG identifiers were used as input to perform the analysis. About 10 pathways including purine metabolism, pyrimidine metabolism, phenylalanine, tyrosine and tryptophan biosynthesis, arginine and proline metabolism were enriched with significant False Discovery Rate (FDR) ≤ 0.05. The pathways associated with dysregulated metabolites are shown in Figure 3C. Global metabolomics led to the identification of metabolites classified as nucleotides-deoxyribonucleotides and ribonucleotides; nucleosides, pyrimidines, amino acids-glutamine, threonine, proline and arginine; water-soluble vitamins—riboflavin and biotin; fatty acids and carbohydrates.

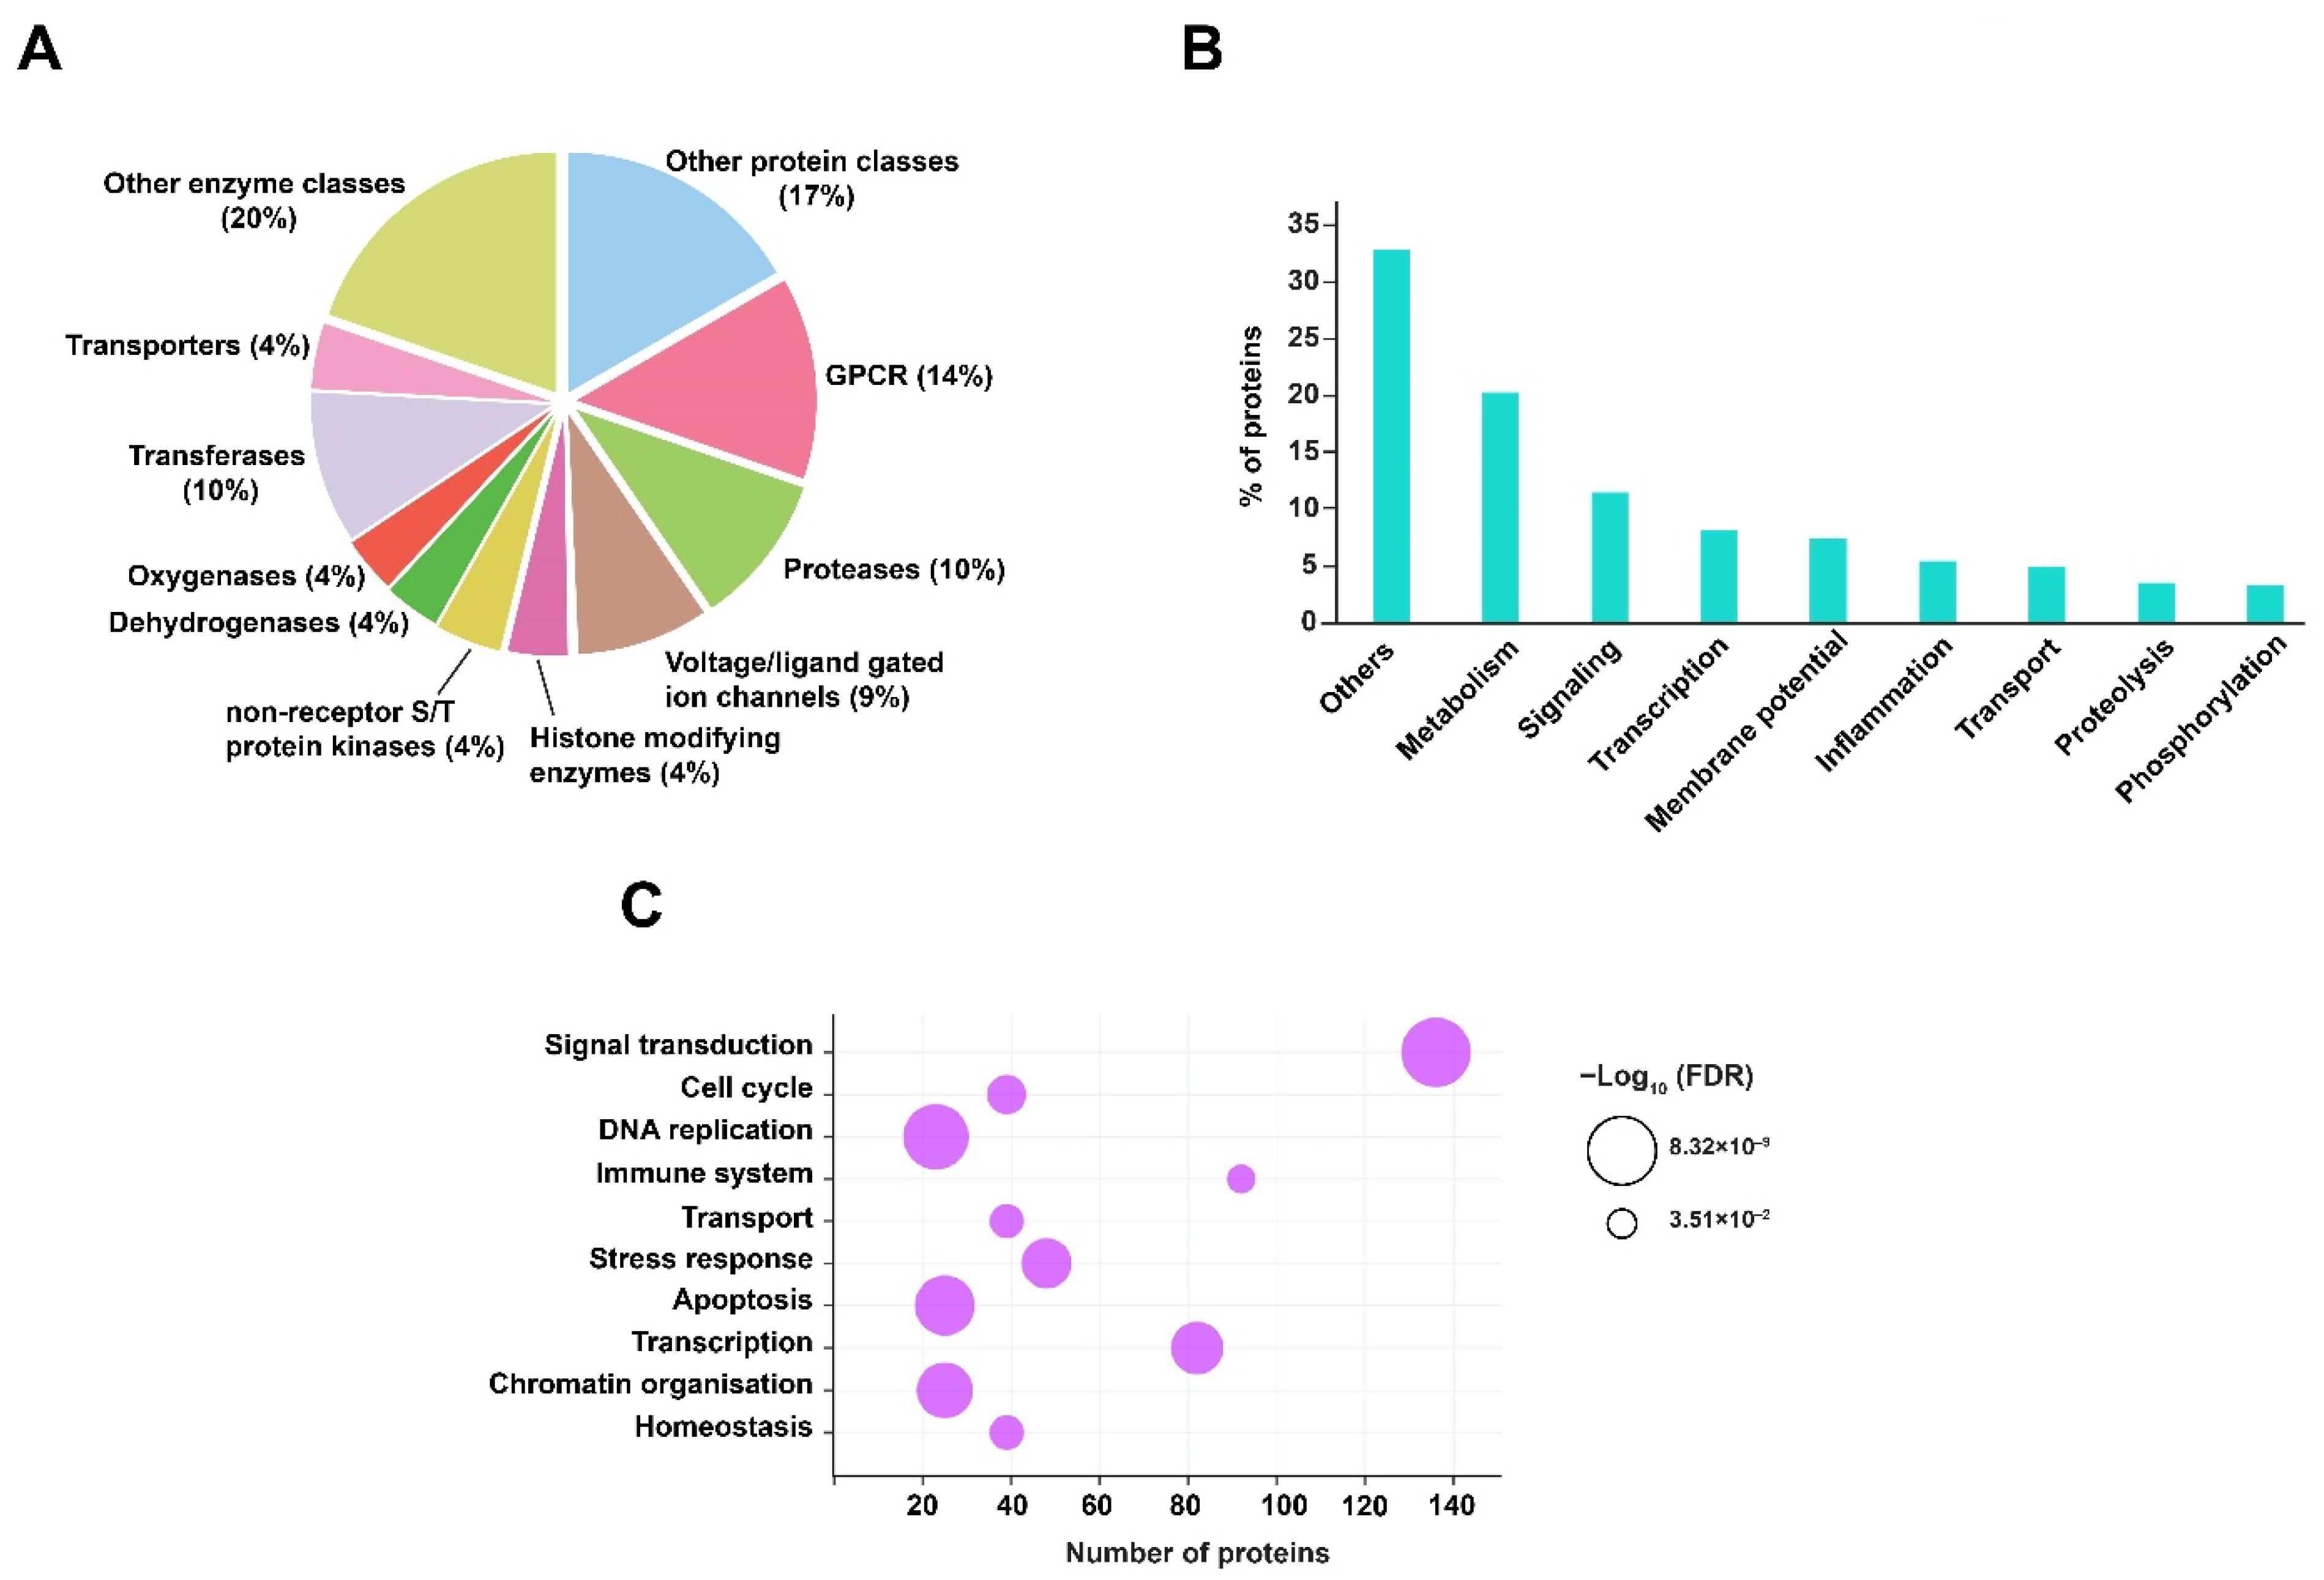
2.4. Prediction of Host Protein Targets against RIF Mediated Mtb Dysregulated Metabolites

Prediction of host protein targets provides a better understanding of the host biological or functional processes that are regulated in response to RIF treatment and Mtb infection. Henceforth, in this study human protein targets were predicted against the dysregulated metabolites, using the tool BindingDB. BindingDB comprises a large number of protein and small molecule interaction datasets, essentially derived from experimental studies [26]. In order to identify the protein targets, SMILES identifiers of the dysregulated metabolites were used as inputs for the tool. A total of 351 human interactors were obtained with a similarity score ≥85% from BindingDB (Supplementary Materials, Table S5). Gene ontology (GO) analysis of these protein targets was performed by acquiring GO terms from the PANTHER database. The majority of the protein targets were classified as G-protein coupled receptors, proteases, transferases, and voltage- or ligand-gated ion channels. In addition to these, protein classes, such as histone modifying enzymes, non-receptor serine/threonine protein kinase, dehydrogenases, oxygenases, and other enzymes and protein classes, were associated with the protein targets. These proteins are majorly involved in signaling, metabolism, membrane potential, transcription, and inflammatory processes. Other biological processes impacted include protein phosphorylation, proteolysis, and transport. The GO analysis, including protein classes and biological processes of the predicted protein targets, is shown in Figure 4A,B.
The predicted proteins were subjected to pathway analysis using the Reactome pathway database. Pathways such as signal transduction, immune system, cellular response to stress, cell cycle, homeostasis, DNA replication, and programmed cell death were identified with significant FDR ≤ 0.05. The pathway enrichment of predicted protein targets in response to RIF and Mtb infection is shown in Figure 4C.

2.5. Multiple Reaction Monitoring (MRM)-Based Validation of Altered Metabolites

In this study, 14 metabolites belonging to the tricarboxylic acid (TCA) cycle, the arginine metabolism, and certain amino acids were validated by using a mass spectrometry-based Multiple Reaction Monitoring (MRM) approach. A total of seven metabolites, including α-ketoglutarate, citrate, malate, fumarate, succinate, phosphoenolpyruvate, and L-arginine were dysregulated with significant p value (≤0.05). The fold change values and p-values, along with the optimization and transition details of the validated metabolites, are shown in Supplementary Materials, Table S6. Box-whisker plots of the significantly dysregulated metabolites are shown in Figure 5.

3. Discussion

Although there was a previously published study on RIF-treated Mtb, 157 metabolites were uniquely identified in this study compared to a previously published study [9]. Unlike the previous study, 461 features in positive mode and 280 features in negative mode were mapped to the Mtb database at the MS2 level, which represents a comprehensive number of metabolites identified in this study for the first time. Moreover, both studies significantly differ in terms of drug concentration, duration of treatment, and culture growth phases. In this study, the MABA assay showed inhibition of Mtb growth with RIF treatment at 5 ng/mL to 320 ng/mL concentration with an IC50 value of 10.17 ng/mL and MIC90 of 40 ng/mL (Supplementary Materials, Figure S2). Hence, Mtb cells were treated with RIF at a concentration of 40 ng/mL, which was used to study the metabolic changes in Mtb. RIF is known to mediate Mtb killing through hydroxy radical formation within the pathogen [27]. As expected, monodehydroascorbate radicals (2.4-fold, ≤0.05 p-value) and isonicotinoyl radicals (7.5-fold, ≤0.05 p-value) were upregulated by RIF treatment in Mtb. In contrast, anti-oxidants, such as ergothioneine and mycothiol-bimane conjugate, an intermediate of mycothiol biosynthesis, were downregulated in this study. Ergothioneine and mycothiol, as low molecular weight antioxidants, confer protection to Mtb against oxidative species [28,29,30].
The TCA cycle is vital for the maintenance of cell homeostasis, as the intermediates of the TCA cycle are involved in the synthesis of proteins, fatty acids, and nucleotides, in addition to distinct signaling mechanisms [31]. Metabolites of the TCA cycle—citrate, malate, α-ketoglutarate, succinate, and fumarate, validated by LC-MS/MS-MRM approach—were found to be upregulated in this study. Glutamine, the connecting link between the TCA cycle, purine, and pyrimidine metabolism, was also upregulated by RIF. Purines such as GTP, XTP, dATP, and dADP, and pyrimidines, including CDP, dCDP, dCTP, and dTMP, were downregulated by RIF. In contrast ADP, cAMP, UTP, UDP, dUMP, TDP nucleotides were upregulated by RIF. RIF exposure led to dysregulation of the balance of nucleotide synthesis and mRNA degradation, whereby cytosine, guanosine, thymine, and thymidine were also found to be altered [14].
Previous reports have shown aggregation of cholesterol on the cell wall of mycobacteria, which is known to decrease its permeability to the standard of care anti-TB drugs, such as RIF. In addition to cell permeability, cholesterol accumulation on the cell wall shields the recognition of mycobacterial antigens, as previously reported with a 20% decrease in antibody binding, thus protecting the bacteria from host immunity. Mutational studies have shown that the 3-ketosteroid Δ1-dehydrogenase (KstD) enzyme, which converts androst-4-ene-3,17-dione (AD) to androsta-1,4-diene-3,17-dione (ADD), is an essential step for cholesterol utilization or degradation in Mtb. Further, the growth of H37Rv and the kstD mutant was inhibited when grown in cholesterol-depleted media [32]. FadD3, an 3aα-H-4α(3′-propanoate)-7aβ-methylhexahydro-1,5-indanedione (HIP)-CoA synthetase, converts HIP to HIP-CoA in the cholesterol degradation pathway. A Rhodococcus jostii FadD3 mutant showed reduced growth when compared to a FadD3 mutant complemented with Mtb enzyme in 1 mM of cholesterol-supplemented media [33]. ADD and HIP, associated with the cholesterol degradation pathway, were upregulated by RIF.
Menaquinones play a key role in the electron transport chain that transfers electrons to terminal oxidases and reductases, mediating ATP synthesis [34]. Decreased expression of menaquinone-9 in Mtb has been shown to result in reduced oxygen consumption, ATP production, and bacterial survival in the presence of inhibitors. Previous reports have shown that inhibitors targeting menaquinone-9 biosynthetic enzymes—MenA and MenG—serve as potential anti-bacterial agents in controlling Mtb growth [35,36]. Menaquinone synthesis begins with chorismite, the product of the shikimate pathway [37]. In addition to menaquinone-9, aromatic amino acids such as phenylalanine, tyrosine, and tryptophan are also synthesized through the downstream reactions of chorismite [38]. In this study, menaquinone-9 and chorismite are downregulated by RIF. These dysregulated metabolites also correlate with perturbation of metabolites related to the electron transport chain; NADH, ADP, diphosphoric acid, and triphosphoric acid were upregulated, while ATP was downregulated, in this study.
MEP pathway metabolites, including D-Glyceraldehyde 3-phosphate, 2C-Methyl-D-erythritol 2,4-cyclodiphosphate, 4-CDP-2-C-methyl-D-erythritol 2-phosphate, and farnesyl diphosphate, were found to be upregulated in Mtb in response to RIF. Mutational studies have shown that the idsA gene, involved in the synthesis of geranyl pyrophosphate from farnesyl pyrophosphate, is vital for the growth of Mtb [39].
Prediction of host protein targets against Mtb infection and RIF treatment resulted in the observation of interesting host biological processes. Previous reports indicate that RIF prevents the augmented expression of apoptosis-associated proteins in Mtb infected macrophages. Moreover, previous experiments have shown RIF-mediated inhibition of apoptosis and nitic oxide production [40]. Further, cytokine levels, including IL-10, IFNγ, and TNFα, have been reported to decrease by isoniazid and RIF in Mtb infected macrophages [41].
In this study, global and targeted analyses were performed on data acquired at the MS2 level. MRM validation was performed on some of the key metabolites associated with the TCA cycle and arginine metabolism. In the last couple of years, mass spectrometry-based metabolomics has evolved in the employment of quality control methods, which have progressed from the comparison of blank profiles to the currently deployed pooled QC samples [22]. Although the deployment of quality-control sample runs, along with the main sample runs in the mass spectrometer, has become a standard practice, this concept of QC was introduced at the time the data were acquired for this study [42]. Hence, sample runs were compared to the blank runs to avoid carryover of sample features (see Supplementary Materials, Table S1). Here, high confidence data were acquired at the MS2 level for both global and targeted metabolomic approaches, and most of the altered metabolites identified in this study provide insights for understanding the role of RIF in Mtb.

4. Materials and Methods

4.1. Bacterial Culture

Mtb H37Rv cells (kind gift from Dr. Amit Singh, IISc, Bangalore) were grown up to logarithmic phase (0.6 OD) in 100 mL Middlebrook 7H9 media containing 0.05% Tween 80 (Sigma, Burlington, MA, USA) and 10% OADC. Successively, actively growing Mtb cells were treated with 40 ng/mL RIF (Sigma, Burlington, MA, USA) in 0.5% DMSO (Sigma, Burlington, MA, USA), while the non-drug-treated cells were treated with 0.5% of DMSO as a control. The cultures were incubated at 37 °C for 12 h, and the cell density was adjusted to 0.4 OD (~0.6 × 10⁸ cells) following cell harvest. The cultures and treatment were carried out in biological duplicates.

4.2. Bacterial Cell Lysis and Metabolite Separation

Control and RIF-treated Mtb cultures were centrifuged at 5000× g rpm at 4 °C for 10 min to separate the pellets. The extracted pellets were washed thrice with ice-cold PBS and were snap-frozen with liquid nitrogen. Instantaneously, the frozen pellets were resuspended in an ice-cold resuspension buffer comprised of methanol, acetonitrile (ACN), and water at a 2:2:1 ratio. Subsequently, cell lysis was carried out by mechanical disruption with zirconia beads (0.1 mm) using a tissue homogenizer. The cell lysates were subjected to centrifugation at high speed for 20 min and the supernatants were collected and filtered through 0.22 µm (Corning, New York, NY, USA) filters. Further, samples of both conditions were vacuum dried before tandem mass spectrometry analysis.

4.3. Tandem Mass Spectrometry Analysis for Untargeted Metabolomics

The dried metabolite samples were analyzed on quadrupole ion-trap-ABSciex QTRAP 6500) (SCIEX, Framingham, MA, USA) mass spectrometer in technical triplicates for each biological duplicate sample, in positive mode and negative mode, separately. The instrument was connected in line with the liquid chromatography system (Agilent 1290 Infinity II), which contained a C18 column (RRHD Zorbax; 20 × 150 mm, 1.8 μm particle size). A 30 min LC method was set up for the separation of metabolites using solvent A (0.1% formic acid in water) and solvent B (0.1% formic acid, 90% can) at a flow rate of 0.3 mL/min. Solvent B, with a gradient of 2.0% for 1 min, 2.0–30% for 9 min, 30–60% for 7 min, 60–95% for 9 min, and 2% for 4 min, at a flow rate of 0.3 mL/min and sample injection volume of 15 µL, was applied for LC-MS/MS analysis. Data were acquired using the IDA method, comprised of enhanced mass spectra (EMS) and enhanced product ion (EPI) modes, which are inbuilt in the ABSciex QTAP 6500 mass spectrometer. The most intense five MS1 spectra (EMS mode) were subjected to MS/MS analysis (EPI mode) using collisional-induced dissociation (CID). Metabolite raw data were acquired with a probe temperature of 450 °C in both positive (4500 V) and negative polarities (−4500 V). Samples were run with a cycle time of 2.091 sec per cycle. The parameters of collision energy (CE) and de-clustering potential (DP) were set at 45 V and 75 V, respectively. Blank runs were executed on mass spectrometer amidst triplicate sample runs to avoid carryover of metabolite features from adjacent samples.

4.4. Data Analysis and Metabolite Mapping

Mass spectrometry-derived data were analyzed on MZmine (Version 2.53) [43], as described previously [44]. The mzML files, derived from wiff files, were uploaded to MZmine to obtain the RT, m/z, and peak areas of the identified features. Initially, the files including control and RIF-treated were subjected to mass detection at the MS1 and MS2 levels, where the peak intensities were set to a minimum. The precursors, containing fragment details, were selected by the MS/MS peak list builder to build the m/z feature list. The features that passed 0.05 Da m/z tolerance through the Peak Extender algorithm were subjected to chromatogram deconvolution, where the noise peak height was set to 1.5 × 10² while the retention time and m/z tolerance for MS2 pairing were set to 1 min and 0.1 Da, respectively. The deconvoluted features were further processed using an isotopic peaks grouper algorithm, with m/z and RT tolerance set to 0.25 Da and 0.2 min, respectively. These features were aligned using the Join-Aligner algorithm, with parameters set as follows: m/z weight, 70%; m/z tolerance, 50 ppm; RT threshold, 30%; and RT tolerance, 0.5 min. The features were then gap-filled using the Peak finder algorithm, with an intensity tolerance of 30%, RT tolerance of 0.6 min, and m/z tolerance of 0.05 Da. The resulting duplicate peaks were discarded by employing the New Average mode in the duplicate peaks filter algorithm, with m/z and RT tolerance set to 0.1 Da and 0.2 min, respectively. The results comprising of peak areas, RT, m/z, and feature ID were exported at the MS2 level to csv files. Subsequently, precursor masses and their corresponding fragment details were also exported for metabolite assignment. The wiff files of intermediate blank runs in between the sample runs were similarly analyzed, along with the control and RIF-treated sample groups, in MZmine to check for details of sample carry over.
The mgf files derived from MZmine were uploaded to the MS2 Compound tool [45] to attain details of metabolites at the MS2 level. Metabolites specific to Mtb H37Rv were downloaded and annotated from the BioCyc and KEGG databases. The metabolites SMILES ID were submitted to the Competitive Fragmentation Modeling-ID (CFM-ID) tool [46] to retrieve theoretical fragmentation data, which was used to search against experimental MS2 data with precursor tolerance of 0.05 Da and fragment tolerance of 0.5. In addition, at least 2 fragment matches against the theoretical database were set as criteria for metabolite mapping. Further, metabolites with the highest mS-score and rank 1 were chosen to filter the redundant metabolites.

4.5. Bioinformatic Analysis

The statistical analysis for this study was performed using MetaboAnalyst online software (Version 5.0; https://www.metaboanalyst.ca/) [47]. Peak areas of the identified features were normalized using median mode to calculate the fold changes. Heat maps were developed using the Pearson distance measure and average clustering method for log10 transformed and auto-scaled positive and negative mode data. Pathway analysis and metabolite classification were performed in MBROLE (Version 2.0; http://csbg.cnb.csic.es/mbrole2/) [25] by providing Mtb H37Rv as the source organism. Protein classes and biological processes for the predicted protein interactors were analyzed on PANTHER (Version 16.0; http://www.pantherdb.org/), while the pathway analysis for these interactors was performed using REACTOME.

4.6. MRM-Based Validation

Targeted analysis was carried out with 14 standards that were individually optimized for RT, DP, EP, CE, and CXP, in addition to Q1 and Q3 masses. In order to optimize MS/MS parameters, around 1 mg of each of the 14 standards were suspended in either 0.1% formic acid or 50% methanol, depending on solubility of the standards. Subsequently, the resuspended standards, at a concentration of 1 ug/mL, were directly infused into the mass spectrometer for optimization of DP, CE, EP, and CXP. Later, the RT and LC gradients were optimized by pooling each standard at a concentration of 1 ug/mL. Mass spectrometry-based MRM analysis was carried out on an ABSciex triple quadrupole mass spectrometer in technical triplicates, per biological duplicate samples. The metabolite extracts from samples were injected into LC-RHP Zorbax C18 column (2.1 mm × 150 mm, 2.7 μm; Agilent Technologies, Santa Clara, CA, USA) through an instrument-coupled automated autosampler. Metabolite separation was achieved with a 35 min LC gradient, where the flow rate was set to 0.3 mL/min for solvent A (0.1% formic acid) and solvent B (1% formic acid in 90% ACN), and sample injection volume was set to 15 μL. Solvent B was applied with a gradient of 2% for 3 min, 2–10% for 2 min, 10–30% for 2 min, 30–70% for 7 min, 70–98% for 9 min, and 2% for 7 min. The data were obtained using MRM scan mode in both the polarities. Metabolites were ionized using curtain gas at 20 psi, ion source gas 1 at 25 psi, and ion source gas 2 at 5 psi in ESI. Further, ion spray voltage at 5500 V, collision activated dissociation gas at medium, and ESI source temperature at 450 °C were maintained during the analysis. The data, including m/z, RT, and peak areas of the standard metabolites, were extracted from Skyline software [48] by uploading the mass spectrometer-derived wiff files. The MRM data, including RT, Q1 and Q3 masses, and the corresponding DP, CE, and CXP values for the validated metabolites, are given in Supplementary Materials, Table S6. In this study, a total of 14 metabolites were relatively quantified in both the modes. The above-mentioned 14 standards were used as analytical standards, while epicatechin was used as an internal standard.

4.7. Microplate Alamar Blue Assay (MABA)

An MABA assay was used to determine the MIC90 and IC50 of RIF. Mtb H37Rv cells were grown in sterile 96-well plates up to log phase of 0.6 OD600 in Middlebrook 7H9 media supplemented with 10% OADC. A total volume of 200 µL media, containing 105 Mtb cells, was dispensed into each well. The wells containing Mtb cells without inhibitor served as a positive control, while wells containing only inhibitor served as a negative control, for the experiment. Plain media was used as a blank. The concentration of RIF, ranging from 2.5 ng/mL to 320 ng/mL, was aliquoted into respective wells and incubated for 5 days at 37 °C. Subsequently, 20 µL of Alamar Blue dye was added to each well, in the dark, and re-incubated at 37 °C for 24 h to record the fluorescence intensity. The readings were taken with excitation at 530 nm and emission at 590 nm, and the inhibition percentage was calculated simultaneously. The drug efficacies were represented in terms of IC50 and MIC90 values. The experiment was performed in triplicates for each of the duplicate samples.

4.8. Data Availability

RIF-treated and control Mtb metabolomics data were submitted to the publicly accessible MetaboLights database [49]. The MetaboLights database is an archive of metabolite data pertaining to structures, spectra, concentration, biological roles, and localization that were acquired from metabolomic experiments. The metabolite details of this study can be accessed from the database with the identifier MTBLS4243.

5. Conclusions

In this study, global and targeted approaches, performed using high-resolution mass spectrometry, led to the identification of a comprehensive number of significantly altered metabolites. In addition to purine and pyrimidine metabolism, the altered metabolites were also associated with oxidative phosphorylation, phenylalanine, tryptophan, and tyrosine metabolism. Moreover, the metabolic pathways and predicted human interactors identified in this study will provide insights for a deeper understanding of the functional processes regulated by RIF in Mtb. This is the first study that reports a large number of dysregulated metabolites in Mtb by RIF.

Supplementary Materials

The following supporting information can be downloaded at: https://www.mdpi.com/article/10.3390/metabo12060493/s1, Figure S1: PCA analysis showing distinct clustering of blank, control and RIF treated samples in (A) Positive and (B) Negative modes. Important features identified by PLS-DA analysis in (C) Positive and (D) Negative modes are depicted; Figure S2: Representative MABA assay to determine MIC90 and IC50 of RIF in Mtb H37Rv cells. (A) 96-well plate showing the change in colour from pink to blue with increasing RIF concentration. (B) Plot showing cell viability against RIF concentration; Table S1: List of metabolite features identified in positive mode; Table S2: List of metabolite features identified in negative mode; Table S3: A complete list of significantly dysregulated metabolic features identified in positive mode; Table S4: A complete list of significantly dysregulated metabolic features identified in negative mode; Table S5: List of predicted human protein interactors of the altered metabolites; Table S6: Details of MRM validated metabolites. The table provides the list of validated metabolites along with FC, p-values, transitions and optimization parameters.

Author Contributions

A.S. perceived the idea and planned the study. T.S.K.P. designed the untargeted and targeted mass spectrometry data acquisition. A.M. prepared Mtb samples for global metabolomics. S.D.Y. carried out the analysis of global metabolomics data. G.K. assisted in acquiring mass spectrometry data for untargeted metabolomics. S.K.B. created the Mtb database and indexed it in the MS2Compound tool. G.K. provided metabolomic data files for analysis. S.D.Y. prepared samples for targeted metabolomics. S.D.Y. carried out metabolite extraction from the samples and optimized MRM parameters for standards, and carried out MRM analysis on the ABSciex 6500 mass spectrometer. S.D.Y. analyzed the mass spectrometry-derived MRM data. S.D.Y. wrote the manuscript. S.D.Y. prepared the figures and supplementary tables. S.D.Y. uploaded the metabolomics data to MetaboLights. G.K. and S.K.B. participated in the discussions for analysis. A.S. and T.S.K.P. provided critical inputs and reviewed the manuscript. All authors have read and agreed to the published version of the manuscript.

Funding

This work was supported by grants from the Department of Biotechnology (DBT), India (BT/PR24443/MED/29/1220/2017) and BIRAC (BIRAC/BT/AIR0392/PACE-14/18), India to A.S.

Institutional Review Board Statement

Not applicable.

Informed Consent Statement

Not applicable.

Data Availability Statement

Metabolomics data of this study is available at the MetaboLights database with the study identifier MTBLS4243.

Acknowledgments

A.S. is a Science and Engineering Research Board (SERB) Distinguished Fellow. We thank the Yenepoya (Deemed to be University) for access to a ABSciex 6500 mass spectrometer and software. The authors thank Karnataka Biotechnology and Information Technology Services (KBITS), Government of Karnataka, for support to the Center for Systems Biology and Molecular Medicine at Yenepoya (Deemed to be University), Mangalore, under the Biotechnology Skill Enhancement Programme in Multiomics Technology (BiSEP GO ITD 02MDA2017). Soujanya D. Yelamanchi is a Research Associate in DBT grant, as mentioned above in Funding. We thank Sneha M. Pinto and Yashwanth Subbannayya for participating in the discussions. We thank Nidhi Rani for providing us with the data for MABA assays.

Conflicts of Interest

The authors declare no conflict of interest.

Abbreviations

TBTuberculosis
RIFRifampicin
PCAPrincipal Component Analysis
PLS-DAPLS discriminant analysis
FDRFalse Discovery Rate
GOGene Ontology
ACNAcetonitrile
MRMMultiple reaction monitoring
TCATricarboxylic acid
FCFold change
QCQuality control
DPDeclustering Potential
RTRetention time
CECollision Energy
EPEntry Potential
CXPCell exit potential
MABAMicroplate Alamar blue assay

References

  1. Yelamanchi, S.D.; Surolia, A. Targeting amino acid metabolism of Mycobacterium tuberculosis for developing inhibitors to curtail its survival. IUBMB Life 2021, 73, 643–658. [Google Scholar] [CrossRef]
  2. World Health Organisation (WHO). Global Tuberculosis Report 2021; WHO: Geneva, Switzerland, 2021. Available online: https://www.who.int/publications/i/item/9789240037021 (accessed on 7 March 2022).
  3. Xu, G.; Liu, H.; Jia, X.; Wang, X.; Xu, P. Mechanisms and detection methods of Mycobacterium tuberculosis rifampicin resistance: The phenomenon of drug resistance is complex. Tuberculosis 2021, 128, 102083. [Google Scholar] [CrossRef]
  4. Campbell, E.A.; Korzheva, N.; Mustaev, A.; Murakami, K.; Nair, S.; Goldfarb, A.; Darst, S.A. Structural mechanism for rifampicin inhibition of bacterial rna polymerase. Cell 2001, 104, 901–912. [Google Scholar] [CrossRef]
  5. McClure, W.R.; Cech, C.L. On the mechanism of rifampicin inhibition of RNA synthesis. J. Biol. Chem. 1978, 253, 8949–8956. [Google Scholar] [CrossRef]
  6. Kessler, C.; Hartmann, G.R. The two effects of rifampicin on the RNA polymerase reaction. Biochem. Biophys. Res. Commun. 1977, 74, 50–56. [Google Scholar] [CrossRef]
  7. Zaw, M.T.; Emran, N.A.; Lin, Z. Mutations inside rifampicin-resistance determining region of rpoB gene associated with rifampicin-resistance in Mycobacterium tuberculosis. J. Infect. Public Health 2018, 11, 605–610. [Google Scholar] [CrossRef]
  8. Louw, G.E.; Warren, R.M.; Gey van Pittius, N.C.; Leon, R.; Jimenez, A.; Hernandez-Pando, R.; McEvoy, C.R.; Grobbelaar, M.; Murray, M.; van Helden, P.D.; et al. Rifampicin reduces susceptibility to ofloxacin in rifampicin-resistant Mycobacterium tuberculosis through efflux. Am. J. Respir. Crit. Care Med. 2011, 184, 269–276. [Google Scholar] [CrossRef] [Green Version]
  9. Nandakumar, M.; Nathan, C.; Rhee, K.Y. Isocitrate lyase mediates broad antibiotic tolerance in Mycobacterium tuberculosis. Nat. Commun. 2014, 5, 4306. [Google Scholar] [CrossRef]
  10. Zhu, J.H.; Wang, B.W.; Pan, M.; Zeng, Y.N.; Rego, H.; Javid, B. Rifampicin can induce antibiotic tolerance in mycobacteria via paradoxical changes in rpoB transcription. Nat. Commun. 2018, 9, 4218. [Google Scholar] [CrossRef] [Green Version]
  11. Brucoli, F.; McHugh, T.D. Rifamycins: Do not throw the baby out with the bathwater. Is rifampicin still an effective anti-tuberculosis drug? Future Med. Chem. 2021, 13, 2129–2131. [Google Scholar] [CrossRef]
  12. Sterling, T.R.; Njie, G.; Zenner, D.; Cohn, D.L.; Reves, R.; Ahmed, A.; Menzies, D.; Horsburgh, C.R., Jr.; Crane, C.M.; Burgos, M.; et al. Guidelines for the Treatment of Latent Tuberculosis Infection: Recommendations from the National Tuberculosis Controllers Association and CDC, 2020. MMWR Recomm. Rep. 2020, 69, 1–11. [Google Scholar] [CrossRef]
  13. Loots, D.T. New insights into the survival mechanisms of rifampicin-resistant Mycobacterium tuberculosis. J. Antimicrob. Chemother. 2016, 71, 655–660. [Google Scholar] [CrossRef]
  14. du Preez, I.; Loots, D.T. Altered fatty acid metabolism due to rifampicin-resistance conferring mutations in the rpoB Gene of Mycobacterium tuberculosis: Mapping the potential of pharmaco-metabolomics for global health and personalized medicine. OMICS 2012, 16, 596–603. [Google Scholar] [CrossRef]
  15. Bisson, G.P.; Mehaffy, C.; Broeckling, C.; Prenni, J.; Rifat, D.; Lun, D.S.; Burgos, M.; Weissman, D.; Karakousis, P.C.; Dobos, K. Upregulation of the phthiocerol dimycocerosate biosynthetic pathway by rifampin-resistant, rpoB mutant Mycobacterium tuberculosis. J. Bacteriol. 2012, 194, 6441–6452. [Google Scholar] [CrossRef] [Green Version]
  16. Man, D.K.; Kanno, T.; Manzo, G.; Robertson, B.D.; Lam, J.K.W.; Mason, A.J. Rifampin- or Capreomycin-Induced Remodeling of the Mycobacterium smegmatis Mycolic Acid Layer Is Mitigated in Synergistic Combinations with Cationic Antimicrobial Peptides. mSphere 2018, 3, e00218-18. [Google Scholar] [CrossRef] [Green Version]
  17. Wishart, D.S. Metabolomics for Investigating Physiological and Pathophysiological Processes. Physiol. Rev. 2019, 99, 1819–1875. [Google Scholar] [CrossRef]
  18. Marchev, A.S.; Vasileva, L.V.; Amirova, K.M.; Savova, M.S.; Balcheva-Sivenova, Z.P.; Georgiev, M.I. Metabolomics and health: From nutritional crops and plant-based pharmaceuticals to profiling of human biofluids. Cell. Mol. Life Sci. 2021, 78, 6487–6503. [Google Scholar] [CrossRef]
  19. Zhang, X.W.; Li, Q.H.; Xu, Z.D.; Dou, J.J. Mass spectrometry-based metabolomics in health and medical science: A systematic review. RSC Adv. 2020, 10, 3092–3104. [Google Scholar] [CrossRef] [Green Version]
  20. Kanehisa, M.; Furumichi, M.; Tanabe, M.; Sato, Y.; Morishima, K. KEGG: New perspectives on genomes, pathways, diseases and drugs. Nucleic Acids Res. 2017, 45, D353–D361. [Google Scholar] [CrossRef] [Green Version]
  21. Paley, S.; Karp, P.D. The BioCyc Metabolic Network Explorer. BMC Bioinform. 2021, 22, 208. [Google Scholar] [CrossRef]
  22. Martinez-Sena, T.; Luongo, G.; Sanjuan-Herraez, D.; Castell, J.V.; Vento, M.; Quintas, G.; Kuligowski, J. Monitoring of system conditioning after blank injections in untargeted UPLC-MS metabolomic analysis. Sci. Rep. 2019, 9, 9822. [Google Scholar] [CrossRef] [PubMed] [Green Version]
  23. Ashokan, M.; Ramesha, K.P.; Hallur, S.; Karthikkeyan, G.; Rana, E.; Azharuddin, N.; Raj, S.R.; Jeyakumar, S.; Kumaresan, A.; Kataktalware, M.A.; et al. Differences in milk metabolites in Malnad Gidda (Bos indicus) cows reared under pasture-based feeding system. Sci. Rep. 2021, 11, 2831. [Google Scholar] [CrossRef] [PubMed]
  24. Saraf, K.K.; Kumaresan, A.; Dasgupta, M.; Karthikkeyan, G.; Prasad, T.S.K.; Modi, P.K.; Ramesha, K.; Jeyakumar, S.; Manimaran, A. Metabolomic fingerprinting of bull spermatozoa for identification of fertility signature metabolites. Mol. Reprod. Dev. 2020, 87, 692–703. [Google Scholar] [CrossRef] [PubMed]
  25. Lopez-Ibanez, J.; Pazos, F.; Chagoyen, M. MBROLE 2.0-functional enrichment of chemical compounds. Nucleic Acids Res. 2016, 44, W201–W204. [Google Scholar] [CrossRef]
  26. Gilson, M.K.; Liu, T.; Baitaluk, M.; Nicola, G.; Hwang, L.; Chong, J. BindingDB in 2015: A public database for medicinal chemistry, computational chemistry and systems pharmacology. Nucleic Acids Res. 2016, 44, D1045–D1053. [Google Scholar] [CrossRef]
  27. Piccaro, G.; Pietraforte, D.; Giannoni, F.; Mustazzolu, A.; Fattorini, L. Rifampin induces hydroxyl radical formation in Mycobacterium tuberculosis. Antimicrob. Agents Chemother. 2014, 58, 7527–7533. [Google Scholar] [CrossRef] [Green Version]
  28. Cumming, B.M.; Chinta, K.C.; Reddy, V.P.; Steyn, A.J.C. Role of Ergothioneine in Microbial Physiology and Pathogenesis. Antioxid. Redox Signal. 2018, 28, 431–444. [Google Scholar] [CrossRef] [Green Version]
  29. Ung, K.S.; Av-Gay, Y. Mycothiol-dependent mycobacterial response to oxidative stress. FEBS Lett. 2006, 580, 2712–2716. [Google Scholar] [CrossRef] [Green Version]
  30. Van Laer, K.; Buts, L.; Foloppe, N.; Vertommen, D.; Van Belle, K.; Wahni, K.; Roos, G.; Nilsson, L.; Mateos, L.M.; Rawat, M.; et al. Mycoredoxin-1 is one of the missing links in the oxidative stress defence mechanism of Mycobacteria. Mol. Microbiol. 2012, 86, 787–804. [Google Scholar] [CrossRef]
  31. Martinez-Reyes, I.; Chandel, N.S. Mitochondrial TCA cycle metabolites control physiology and disease. Nat. Commun. 2020, 11, 102. [Google Scholar] [CrossRef] [Green Version]
  32. Brzostek, A.; Pawelczyk, J.; Rumijowska-Galewicz, A.; Dziadek, B.; Dziadek, J. Mycobacterium tuberculosis is able to accumulate and utilize cholesterol. J. Bacteriol. 2009, 191, 6584–6591. [Google Scholar] [CrossRef] [PubMed] [Green Version]
  33. Casabon, I.; Crowe, A.M.; Liu, J.; Eltis, L.D. FadD3 is an acyl-CoA synthetase that initiates catabolism of cholesterol rings C and D in actinobacteria. Mol. Microbiol. 2013, 87, 269–283. [Google Scholar] [CrossRef] [PubMed]
  34. Upadhyay, A.; Fontes, F.L.; Gonzalez-Juarrero, M.; McNeil, M.R.; Crans, D.C.; Jackson, M.; Crick, D.C. Partial Saturation of Menaquinone in Mycobacterium tuberculosis: Function and Essentiality of a Novel Reductase, MenJ. ACS Cent. Sci. 2015, 1, 292–302. [Google Scholar] [CrossRef] [PubMed]
  35. Dhiman, R.K.; Mahapatra, S.; Slayden, R.A.; Boyne, M.E.; Lenaerts, A.; Hinshaw, J.C.; Angala, S.K.; Chatterjee, D.; Biswas, K.; Narayanasamy, P.; et al. Menaquinone synthesis is critical for maintaining mycobacterial viability during exponential growth and recovery from non-replicating persistence. Mol. Microbiol. 2009, 72, 85–97. [Google Scholar] [CrossRef] [PubMed] [Green Version]
  36. Sukheja, P.; Kumar, P.; Mittal, N.; Li, S.G.; Singleton, E.; Russo, R.; Perryman, A.L.; Shrestha, R.; Awasthi, D.; Husain, S.; et al. A Novel Small-Molecule Inhibitor of the Mycobacterium tuberculosis Demethylmenaquinone Methyltransferase MenG Is Bactericidal to Both Growing and Nutritionally Deprived Persister Cells. mBio 2017, 8, e02022-16. [Google Scholar] [CrossRef] [PubMed] [Green Version]
  37. Meganathan, R.; Kwon, O. Biosynthesis of Menaquinone (Vitamin K2) and Ubiquinone (Coenzyme Q). EcoSal Plus 2009, 3. [Google Scholar] [CrossRef] [Green Version]
  38. Dosselaere, F.; Vanderleyden, J. A metabolic node in action: Chorismate-utilizing enzymes in microorganisms. Crit. Rev. Microbiol. 2001, 27, 75–131. [Google Scholar] [CrossRef]
  39. Sassetti, C.M.; Boyd, D.H.; Rubin, E.J. Genes required for mycobacterial growth defined by high density mutagenesis. Mol. Microbiol. 2003, 48, 77–84. [Google Scholar] [CrossRef]
  40. Gil, D.; Garcia, L.F.; Rojas, M. Modulation of macrophage apoptosis by antimycobacterial therapy: Physiological role of apoptosis in the control of Mycobacterium tuberculosis. Toxicol. Appl. Pharmacol. 2003, 190, 111–119. [Google Scholar] [CrossRef]
  41. Sharma, R.; Muttil, P.; Yadav, A.B.; Rath, S.K.; Bajpai, V.K.; Mani, U.; Misra, A. Uptake of inhalable microparticles affects defence responses of macrophages infected with Mycobacterium tuberculosis H37Ra. J. Antimicrob. Chemother. 2007, 59, 499–506. [Google Scholar] [CrossRef] [Green Version]
  42. Broadhurst, D.; Goodacre, R.; Reinke, S.N.; Kuligowski, J.; Wilson, I.D.; Lewis, M.R.; Dunn, W.B. Guidelines and considerations for the use of system suitability and quality control samples in mass spectrometry assays applied in untargeted clinical metabolomic studies. Metabolomics 2018, 14, 72. [Google Scholar] [CrossRef] [PubMed] [Green Version]
  43. Du, X.; Smirnov, A.; Pluskal, T.; Jia, W.; Sumner, S. Metabolomics Data Preprocessing Using ADAP and MZmine 2. Methods Mol. Biol. 2020, 2104, 25–48. [Google Scholar] [CrossRef] [PubMed]
  44. Yelamanchi, S.D.; Arun Kumar, S.T.; Mishra, A.; Keshava Prasad, T.S.; Surolia, A. Metabolite Dysregulation by Pranlukast in Mycobacterium tuberculosis. Molecules 2022, 27, 1520. [Google Scholar] [CrossRef] [PubMed]
  45. Behera, S.K.; Kasaragod, S.; Karthikkeyan, G.; Narayana Kotimoole, C.; Raju, R.; Prasad, T.S.K.; Subbannayya, Y. MS2Compound: A User-Friendly Compound Identification Tool for LC-MS/MS-Based Metabolomics Data. OMICS 2021, 25, 389–399. [Google Scholar] [CrossRef]
  46. Djoumbou-Feunang, Y.; Pon, A.; Karu, N.; Zheng, J.; Li, C.; Arndt, D.; Gautam, M.; Allen, F.; Wishart, D.S. CFM-ID 3.0: Significantly Improved ESI-MS/MS Prediction and Compound Identification. Metabolites 2019, 9, 72. [Google Scholar] [CrossRef] [Green Version]
  47. Pang, Z.; Chong, J.; Zhou, G.; de Lima Morais, D.A.; Chang, L.; Barrette, M.; Gauthier, C.; Jacques, P.E.; Li, S.; Xia, J. MetaboAnalyst 5.0: Narrowing the gap between raw spectra and functional insights. Nucleic Acids Res. 2021, 49, W388–W396. [Google Scholar] [CrossRef]
  48. Adams, K.J.; Pratt, B.; Bose, N.; Dubois, L.G.; St John-Williams, L.; Perrott, K.M.; Ky, K.; Kapahi, P.; Sharma, V.; MacCoss, M.J.; et al. Skyline for Small Molecules: A Unifying Software Package for Quantitative Metabolomics. J. Proteome Res. 2020, 19, 1447–1458. [Google Scholar] [CrossRef]
  49. Haug, K.; Cochrane, K.; Nainala, V.C.; Williams, M.; Chang, J.; Jayaseelan, K.V.; O’Donovan, C. MetaboLights: A resource evolving in response to the needs of its scientific community. Nucleic Acids Res. 2020, 48, D440–D444. [Google Scholar] [CrossRef] [Green Version]
Figure 1. A schematic illustration of the metabolomics pipeline, with details of sample conditions and experimental workflow.
Metabolites 12 00493 g001
Figure 2. Hierarchical clustering heat map showing metabolic features identified in untreated and RIF-treated Mtb samples in: (A) Positive mode (B) Negative mode.
Metabolites 12 00493 g002
Figure 3. Volcano plots show the distribution of significantly altered metabolites in: (A) Positive mode and (B) Negative mode. The dotted line on X-axis represents p-value cut off while the dotted line on Y-axis shows the fold change cut off. (C) Metabolic pathways enriched with False Discovery Rate (FDR) ≤ 0.05 against the dysregulated metabolites are shown as a horizontal multi-set bar graph. The length of bars represents the count for both FDR and the number of metabolite entities enriched per pathway.
Metabolites 12 00493 g003
Figure 4. GO and pathway analysis of predicted protein interactors. (A) Classification of protein targets is represented as a pie chart. (B) Biological processes are shown as a vertical bar graph. (C) Pathway analysis is represented as a bubble plot. The size of the bubble signifies the FDR value (≤0.05).
Metabolites 12 00493 g004
Figure 5. Box-whisker plots showing significant dysregulation of MRM validated metabolites in RIF and untreated or control groups. (A) Arginine. (B) Citrate. (C) Fumarate. (D) α-Ketoglutarate (E) Malate. (F) Succinate. (G) Phosphoenolpyruvate.
Metabolites 12 00493 g005
Table 1. A partial list of altered metabolites.
S.NoMetaboliteMode of AcquisitionFold Changep-Value
12C-Methyl-D-erythritol 2,4-cyclodiphosphatePositive3.330.01
2L-GlutaminePositive48.680.00
3ThymidineNegative0.470.02
4Thymidine-5′-phosphateNegative0.100.00
5Uridine-5′-diphosphatePositive5.420.01
6Deoxycytidine diphosphatePositive0.090.00
72-Isopropylmaleic acidPositive1.700.03
83-Deoxy-D-arabino-heptulosonate-7-phosphatePositive14.130.00
94-Guanidinobutyric acidPositive5.930.02
10BiotinNegative2.140.02
11Cyclic AMPNegative9.250.00
12HistidinalPositive1.830.00
13L-CystathionineNegative3.950.03
14Menaquinone-9Negative0.190.00
15S-Adenosyl-L-homocysteineNegative4.090.03
Publisher’s Note: MDPI stays neutral with regard to jurisdictional claims in published maps and institutional affiliations.

