
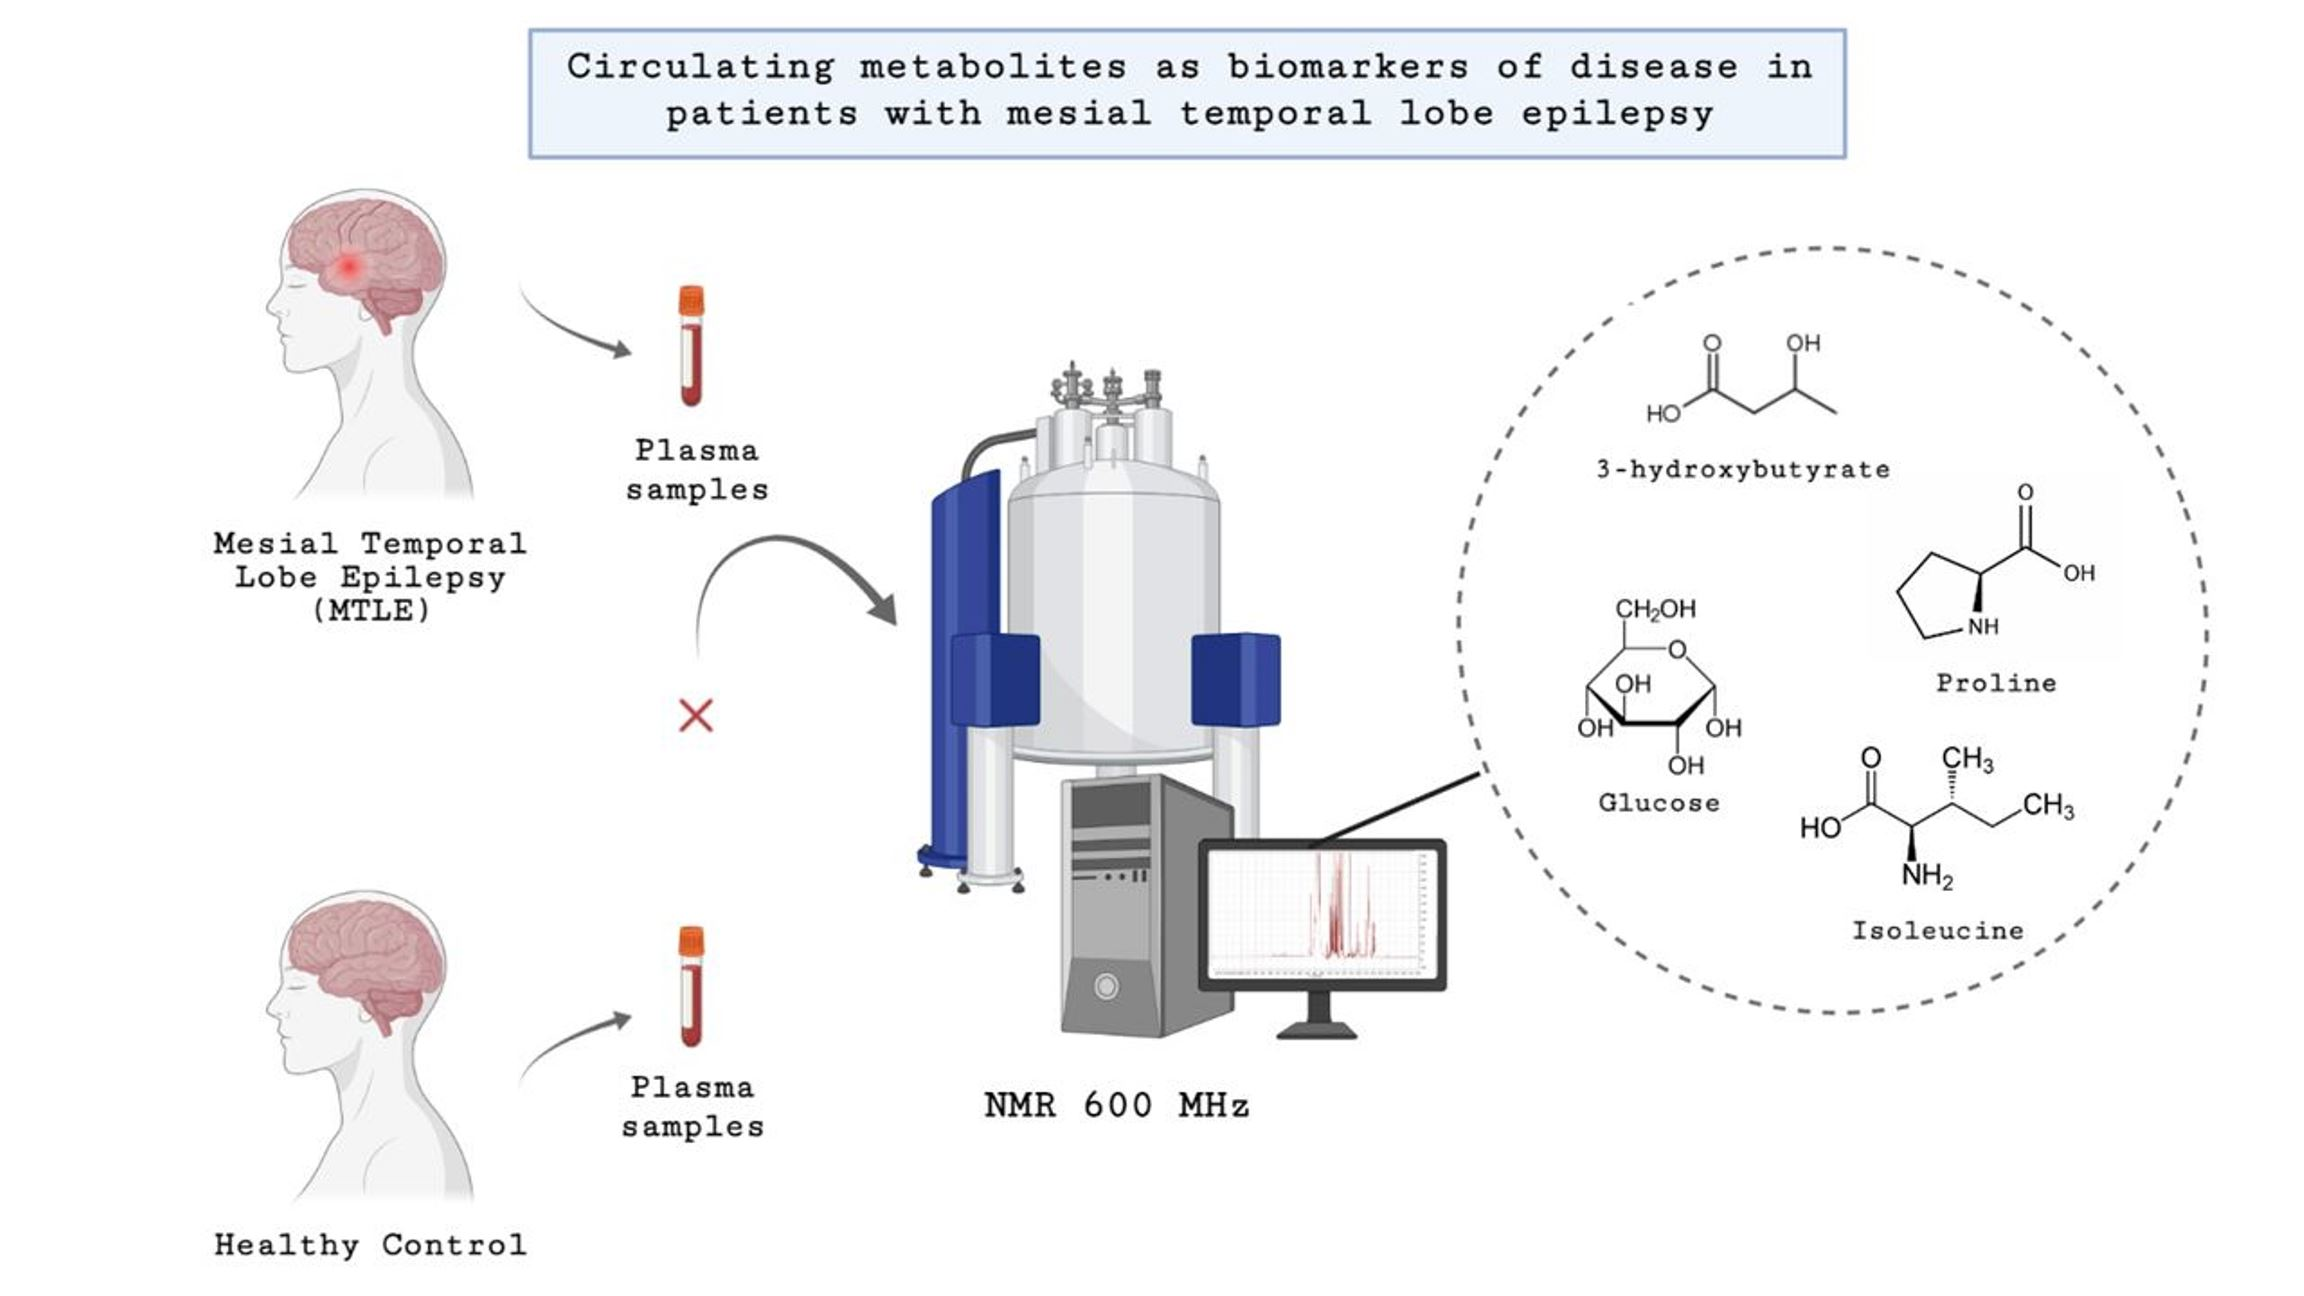
Circulating Metabolites as Biomarkers of Disease in Patients with Mesial Temporal Lobe Epilepsy

 ,
,  ,
,  , , , , , and
Abstract
:
1. Introduction
2. Results
2.1. Characteristics of Study Population
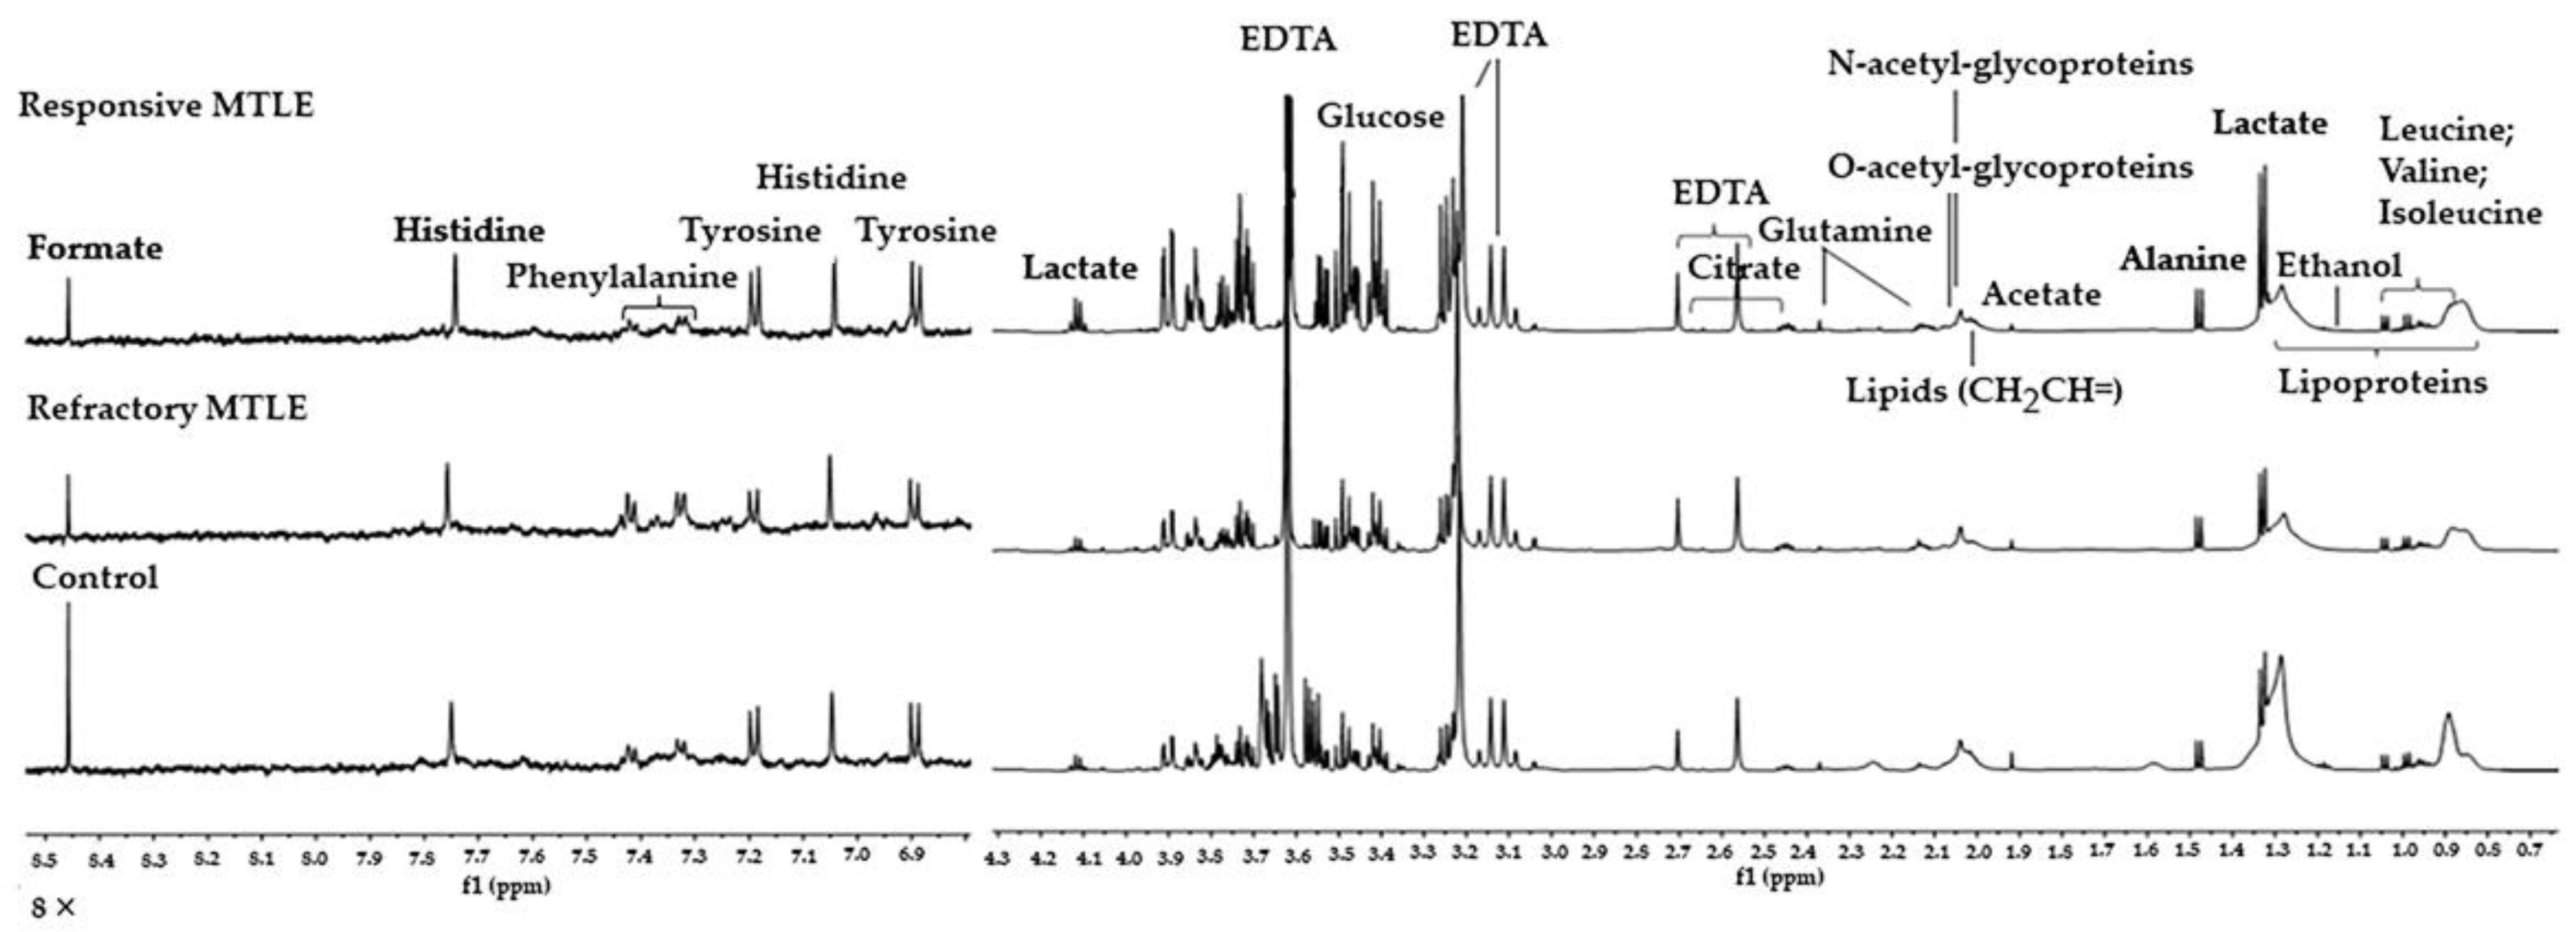
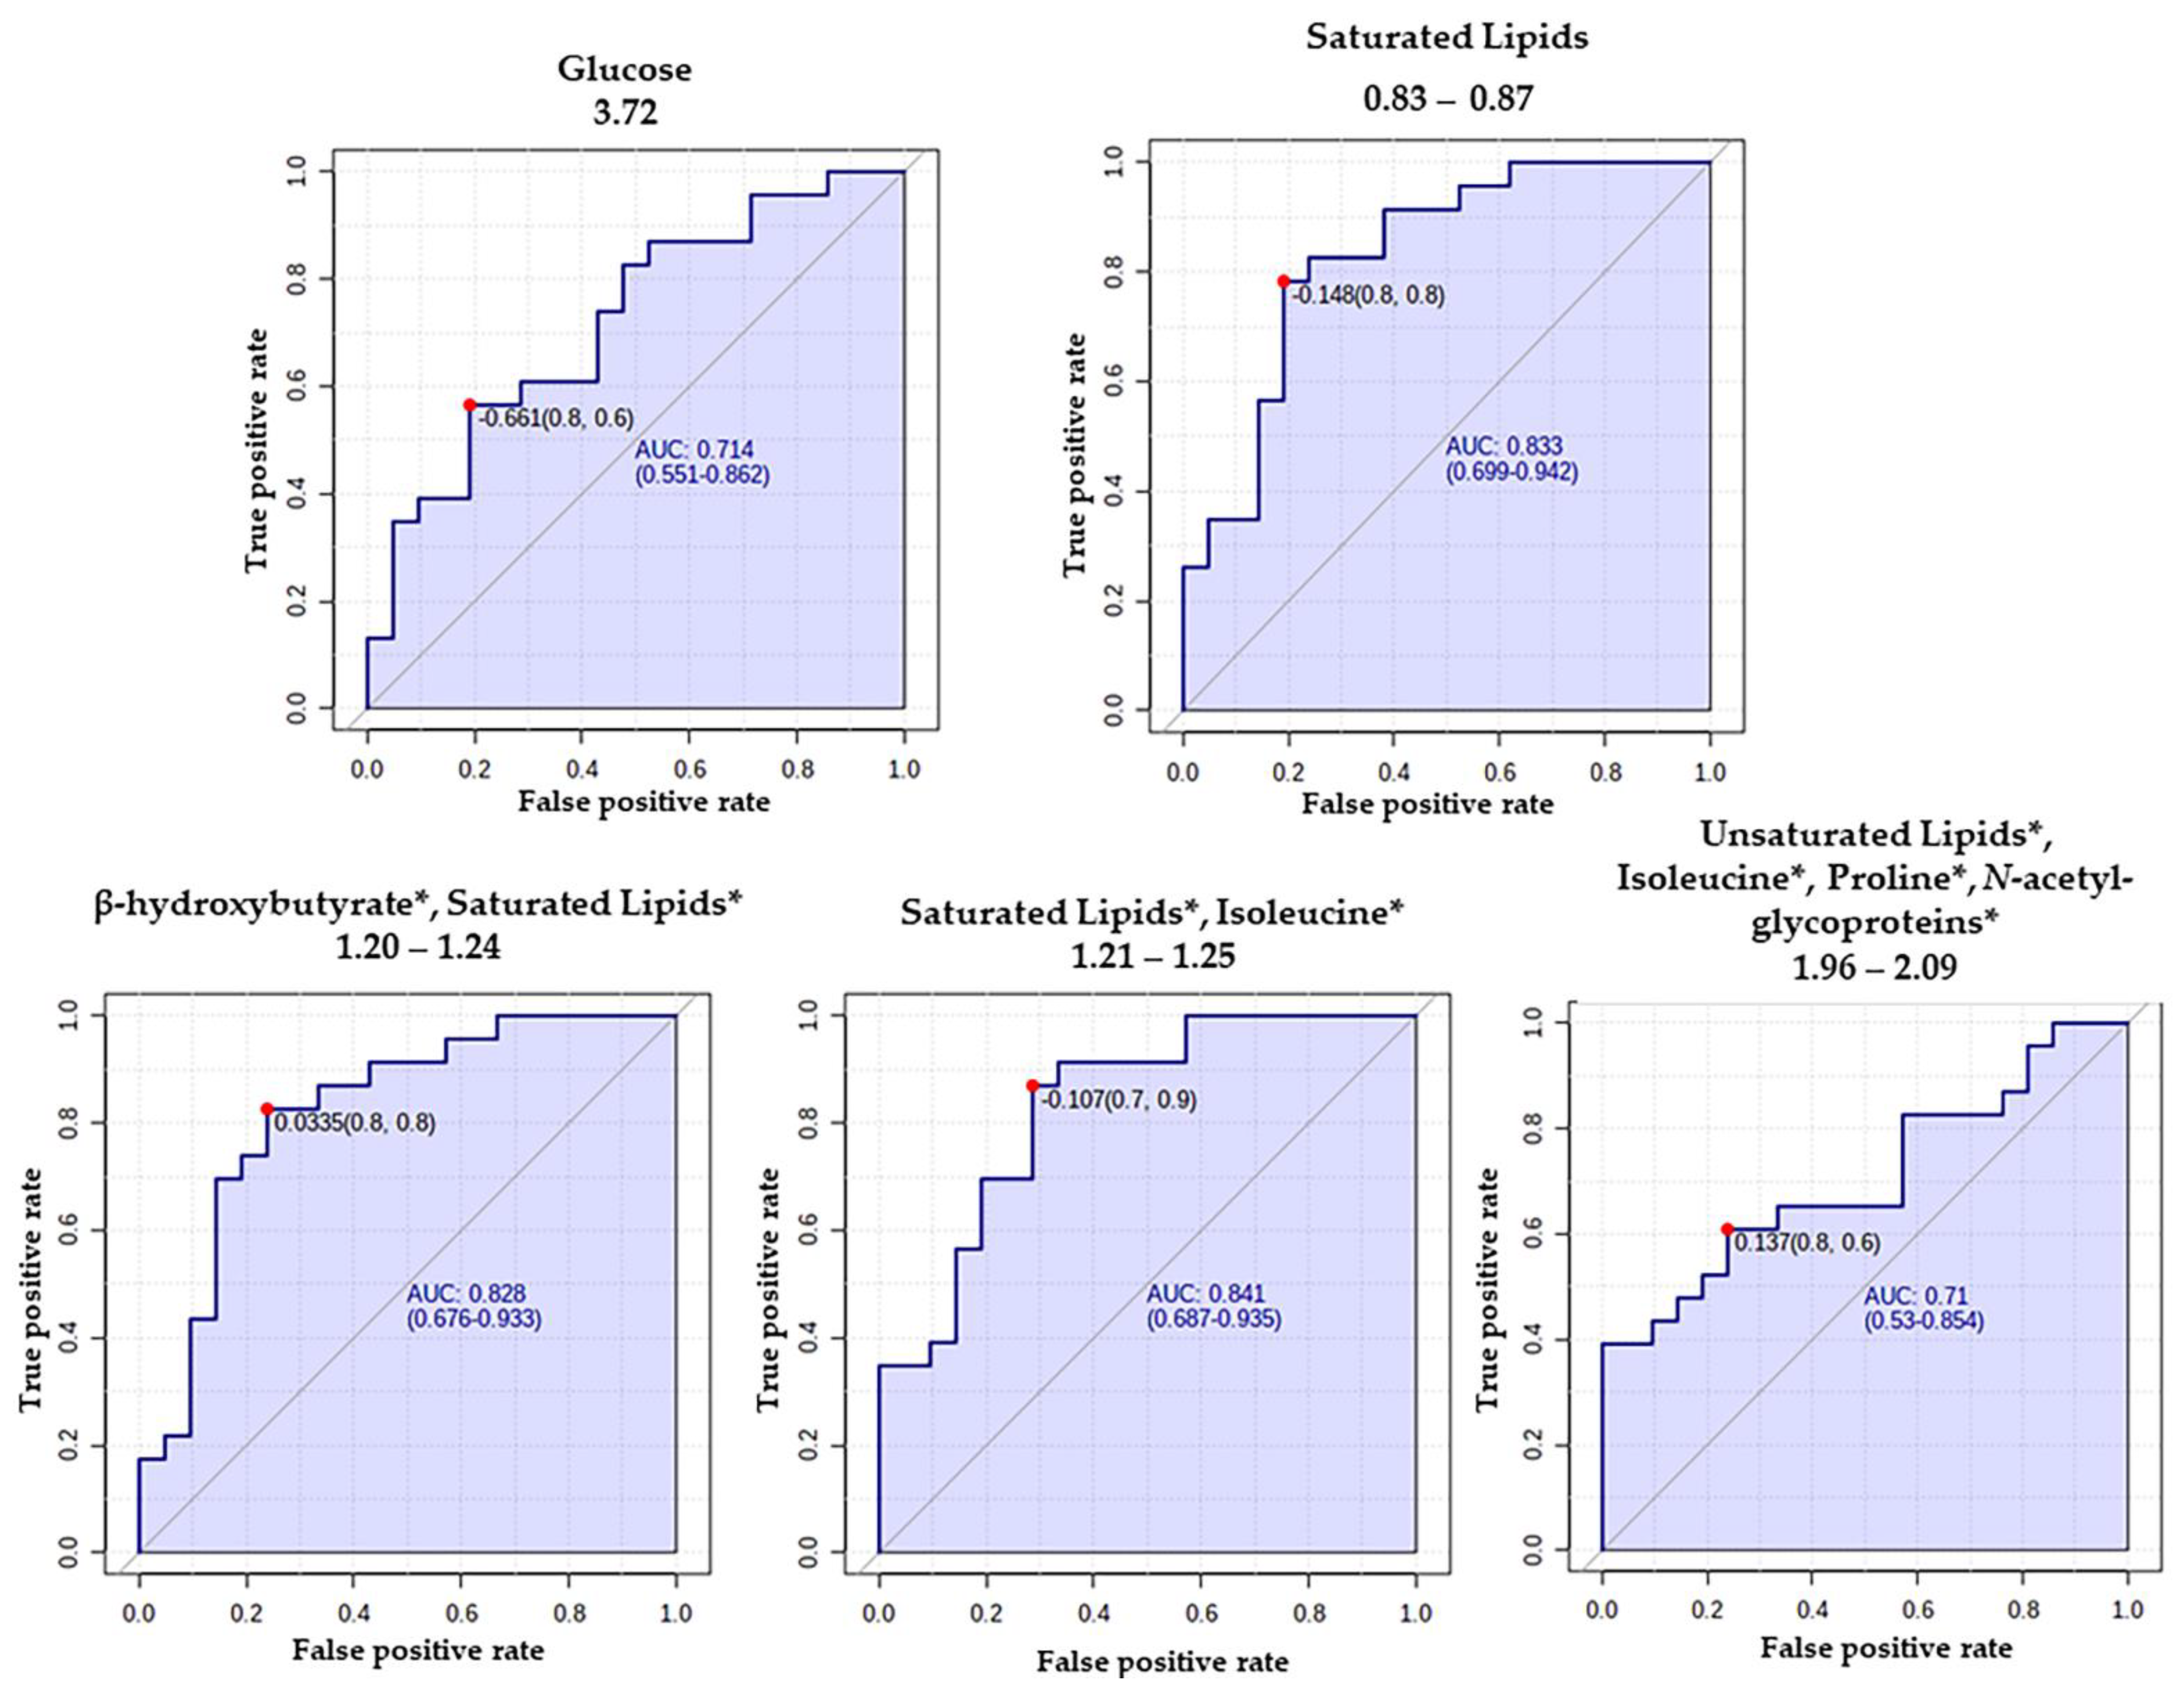
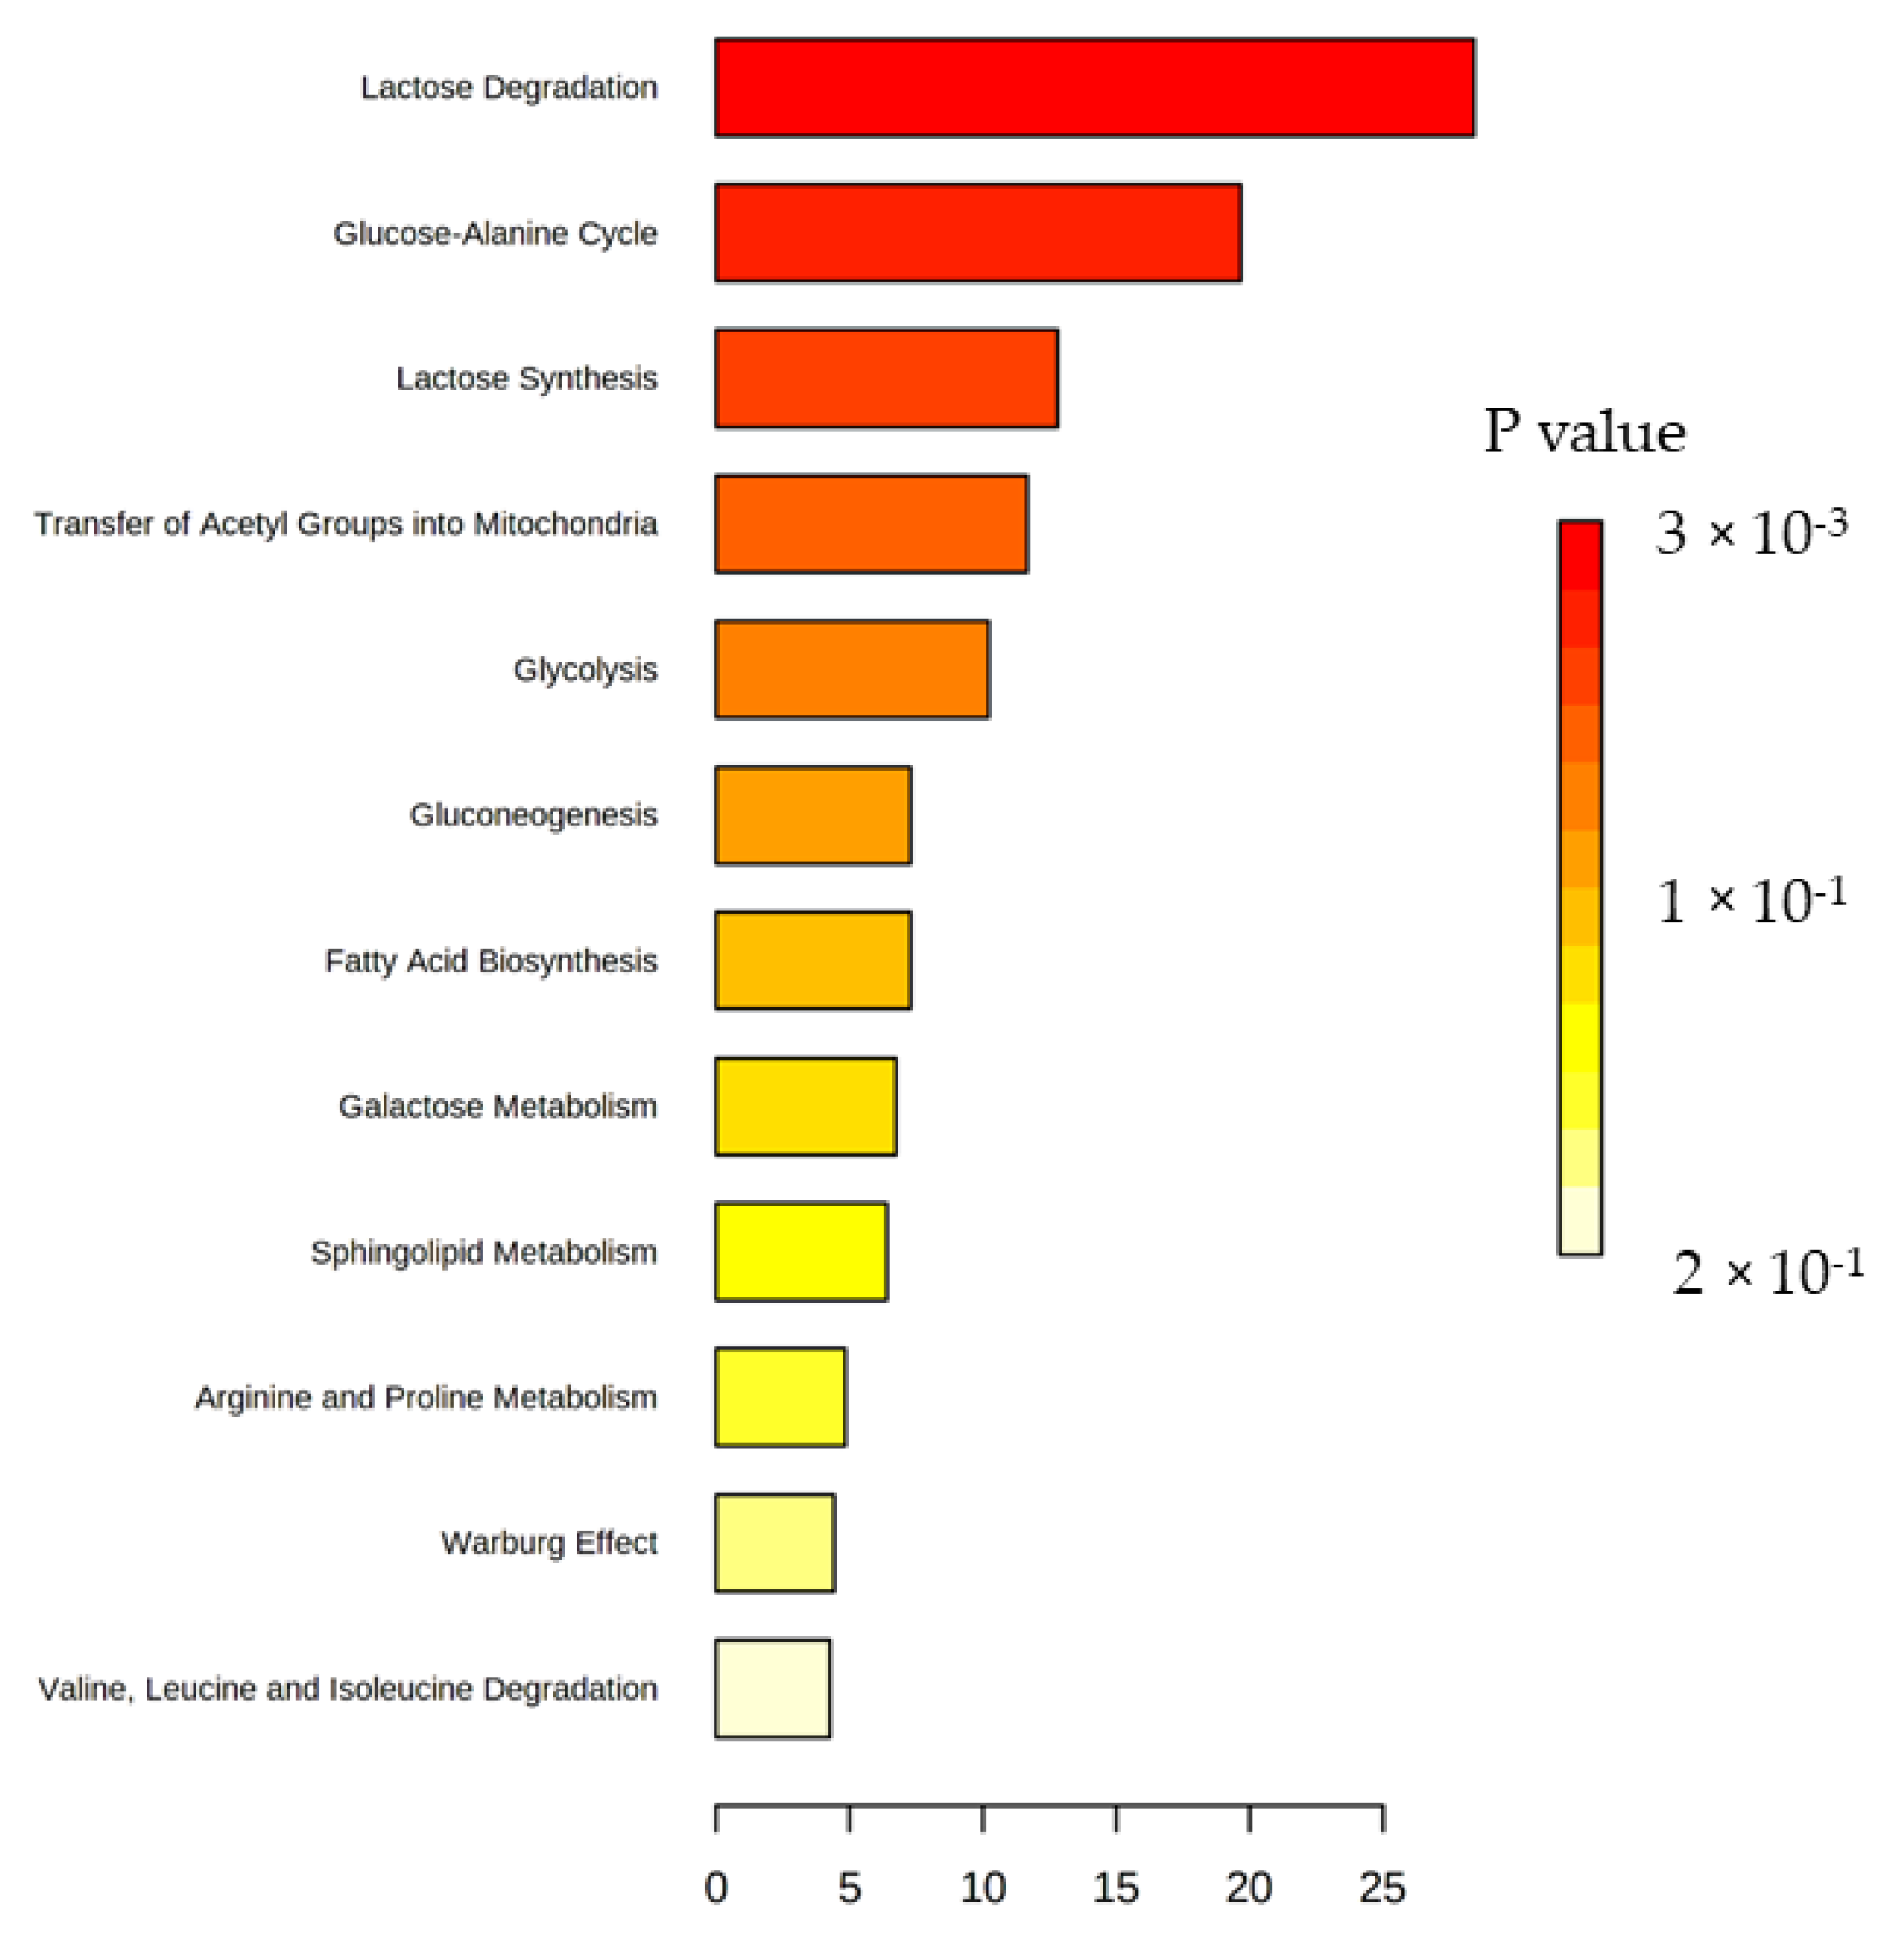
2.2. Metabolomic Analysis
3. Discussion
Strengths and Limitations
4. Conclusions
5. Materials and Methods
5.1. Study Population
5.2. Blood Collection and Plasma Preparation
5.3. 1H-NMR Spectroscopy Analyses
5.4. Data Analysis: NMR Data Processing
Supplementary Materials
Author Contributions
Funding
Institutional Review Board Statement
Informed Consent Statement
Data Availability Statement
Acknowledgments
Conflicts of Interest
Appendix A

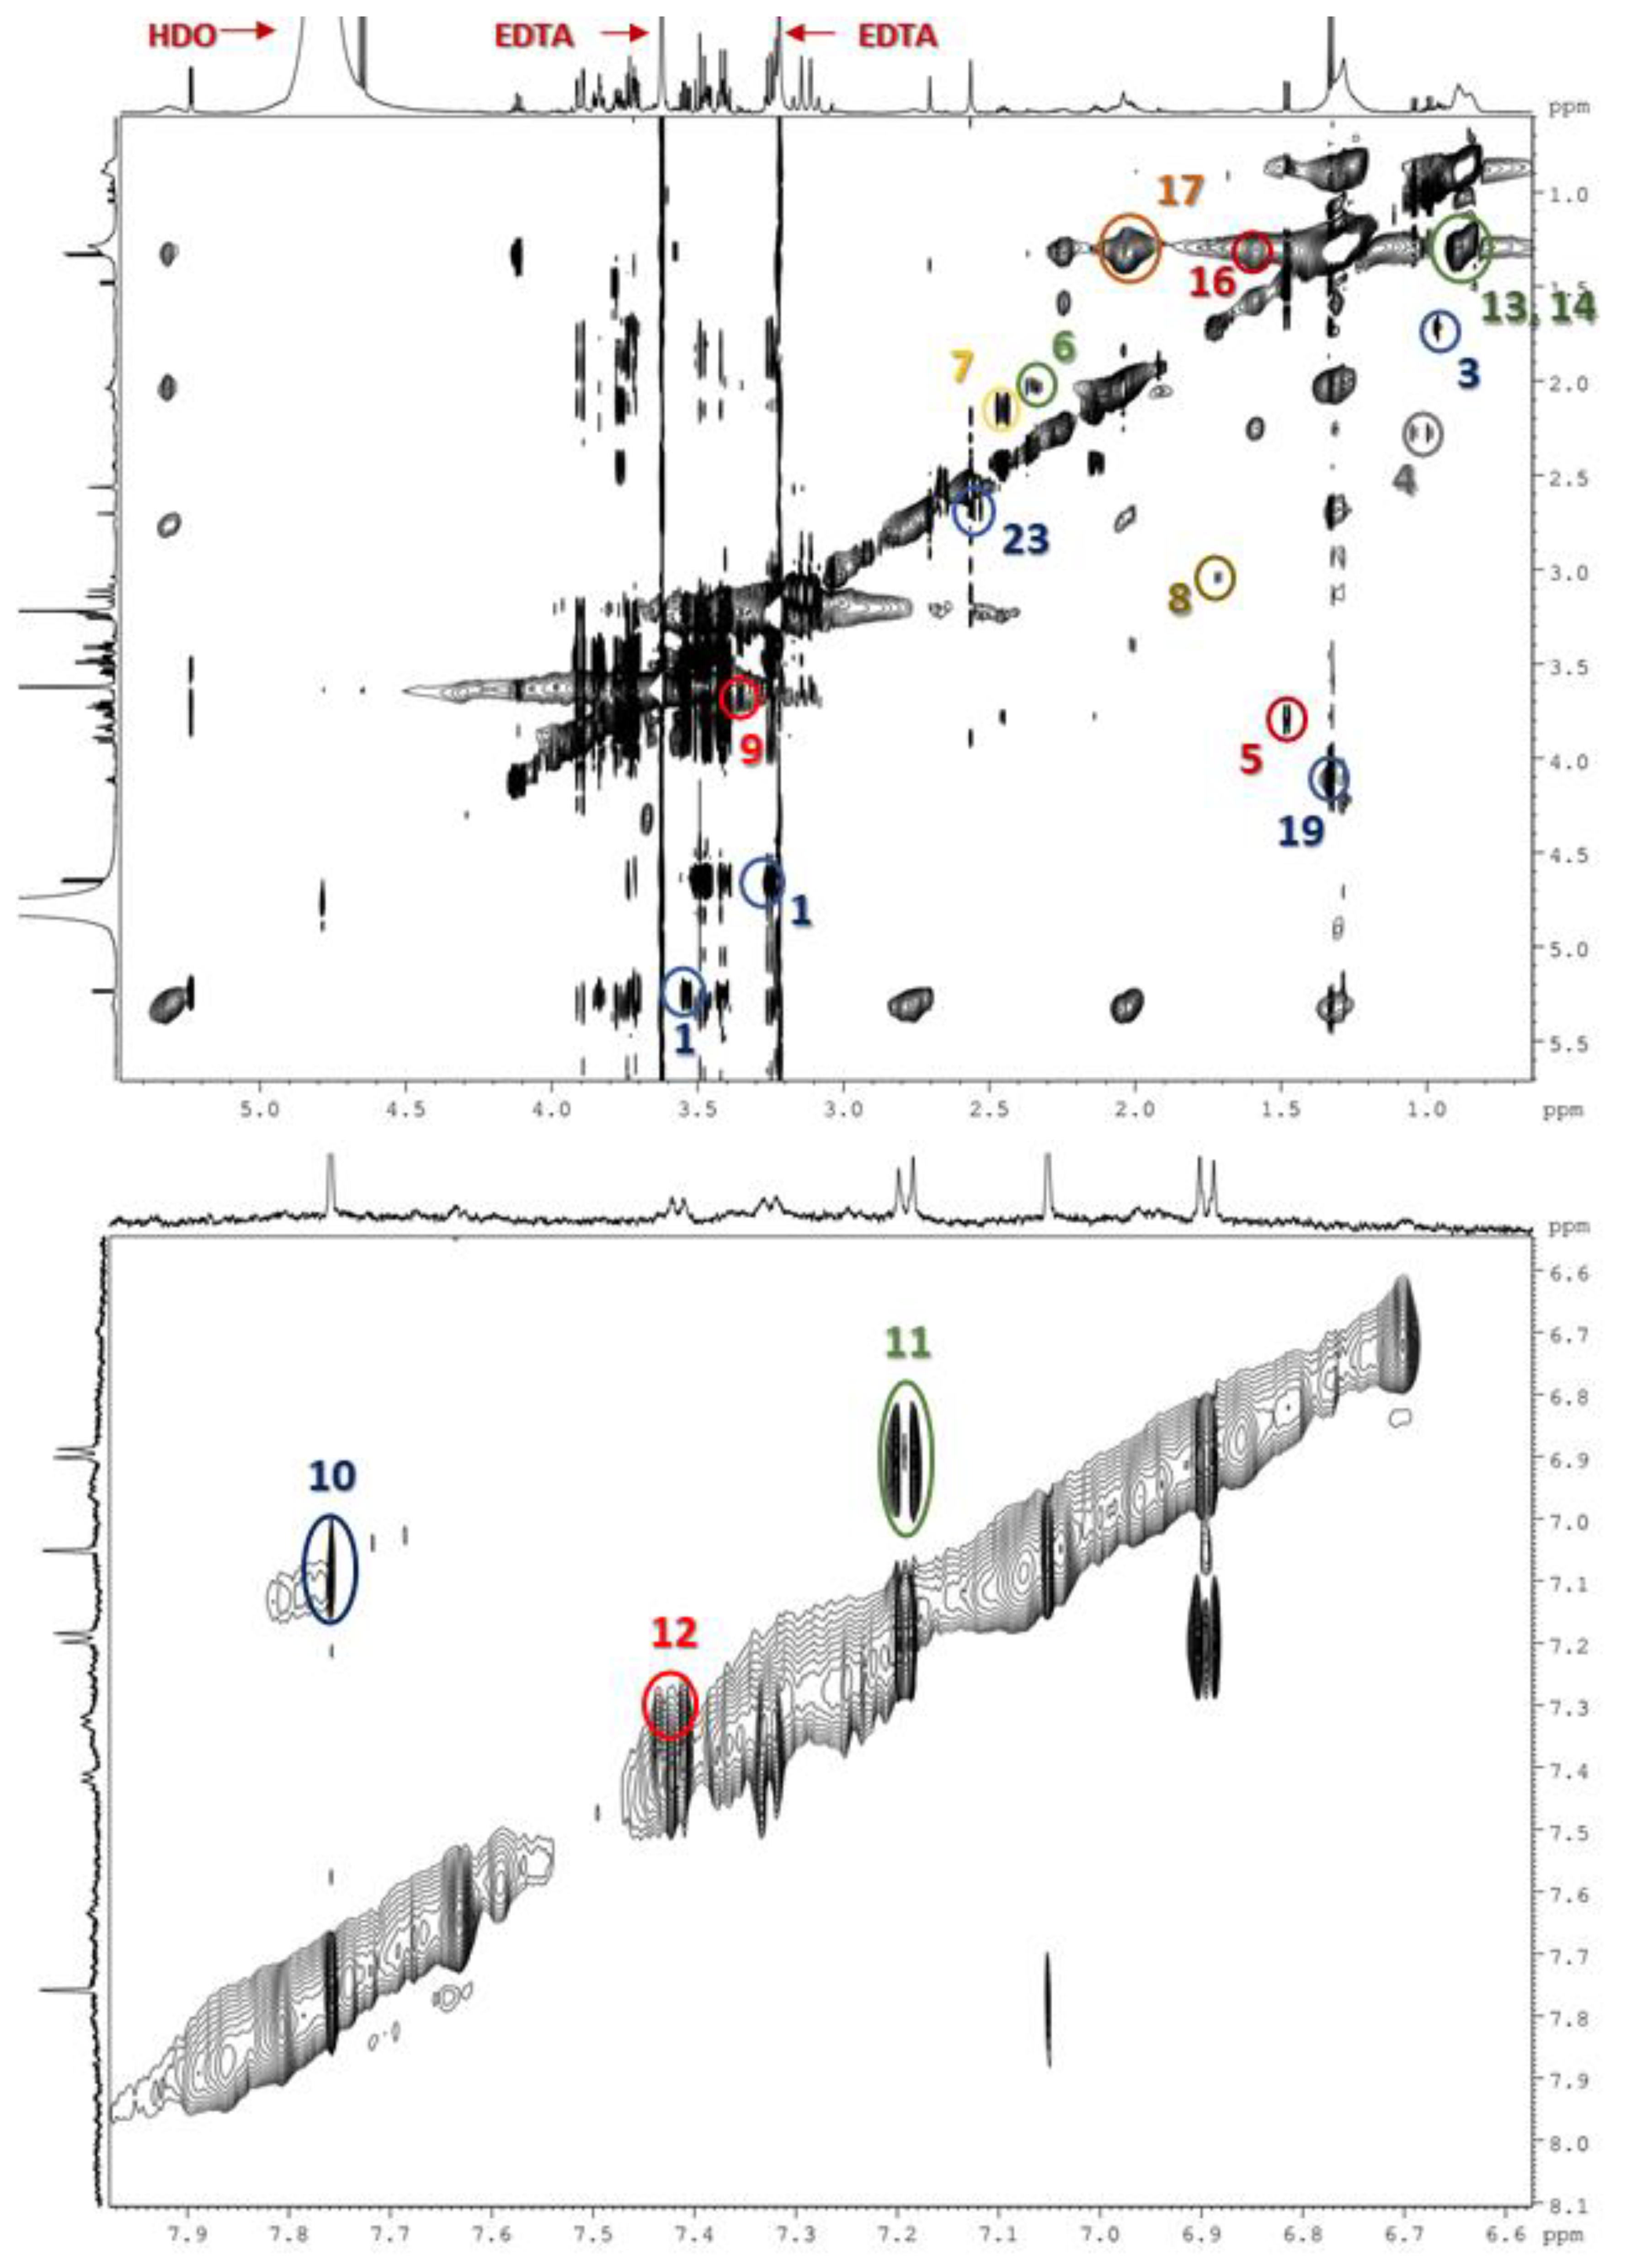
| Sugars | ||
|---|---|---|
| 1 | Glucose | 3.41 (H4′), 3.54 (H2′), 3.72 (H3′), 3.84 (H5′), 5.24 (H1′) 3.25 (H2′), 3.41 (H4′), 3.47 (H5′), 3.72 (H6′), 3.90 (H6′), 4.65 (H1′) |
| Amino acids | ||
| 2 | Isoleucine | 0.94 (δ-CH3), 1.01 (γ-CH2), 1.42 (γ-CH2), 3.67 (α-CH) |
| 3 | Leucine | 0.96 (δ-CH3), 1.71 (β-CH2) |
| 4 | Valine | 0.99 (γ-CH2), 1.04 (γ-CH3), 2.25–2.31 (β-CH), 3.60 (α-CH) |
| 5 | Alanine | 1.48 (β-CH3), 3.78 (α-CH) |
| 6 | Glutamate | 2.04 (β-CH2), 2.36 (γ-CH2), 3.71 (α-CH) |
| 7 | Glutamine | 2.13 (β-CH2), 2.45 (γ-CH2), 3.78 (α-CH) |
| 8 | Arginine | 1.72 (γ-CH2), 1.89 (β-CH2), 3.23 (δ-CH2), 3.73 (α-CH) |
| 9 | Proline | 3.36 (δ′δ′-CH2), 3.41 (δ-CH2), 4.14 (α-CH) |
| 10 | Histidine | 7.06 (H4), 7.77 (H2) |
| 11 | Tyrosine | 6.89 (H3, H5), 7.19 (H2, H6) |
| 12 | Phenylalanine | 3.24 (β′β′-CH), 7.32,7.36 (H2, H6), 7.42 (H3, 5H) |
| Lipids | ||
| 13 | Low-density lipoproteins (LDL) | 0.90 (CH3), 1.30 (CH2)n |
| 14 | Very-low-density lipoproteins (VLDL) | 0.76–0.93 (CH3), 1.24–1.37 (CH2)n |
| 15 | High-density lipoproteins (HDL) | 0.80–0.85 (CH3), 1.21–1.23 (CH2)n |
| 16 | Fatty-acid chain | 1.53–1.65 (-CH2CH2CO) |
| 17 | Unsaturated lipids and N-acetyl glycoproteins | 1.96–2.09 (-CH2-CH=) |
| 18 | Lipids HC=CH | 5.29–5.43 (CH) |
| Organic acids | ||
| 19 | Lactate | 1.33 (CH3), 4.11 (CH) |
| 20 | Acetic acid | 1.92 (CH2) |
| 21 | Acetone | 2.24 (CH2) |
| 22 | Acetoacetic acid | 2.28 (CH2) |
| 23 | Citrate | 2.54 (CH2), 2.68 (CH2) |
| 24 | Formate | 8.47 (CH) |
| Other compounds | ||
| 25 | Ethanol | 1.20 (CH3); 3.67 (CH2) |
| 26 | Creatinine | 3.94 (CH2), 3.04 (CH2) |
| 27 | Creatine | 4.06 (CH2), 3.05 (CH2) |


References
- Beghi, E. The epidemiology of epilepsy. Neuroepidemiology 2020, 54, 185–191. [Google Scholar] [CrossRef] [PubMed]
- Scheffer, I.E.; Berkovic, S.; Capovilla, G.; Connolly, M.B.; French, J.; Guilhoto, L.; Hirsch, E.; Jain, S.; Mathern, G.W.; Moshe, S.L.; et al. ILAE classification of the epilepsies: Position paper of the ILAE Commission for Classification and Terminology. Epilepsia 2017, 58, 512–521. [Google Scholar] [CrossRef] [PubMed] [Green Version]
- Cendes, F.; Sakamoto, A.C.; Spreafico, R.; Bingaman, W.; Becker, A.J. Epilepsies associated with hippocampal sclerosis. Acta Neuropathol. 2014, 128, 21–37. [Google Scholar] [CrossRef]
- Engel, J. Mesial temporal lobe epilepsy: What have we learned? Neuroscientist 2001, 7, 340–352. [Google Scholar] [CrossRef] [PubMed]
- Fisher, R.S.; Acevedo, C.; Arzimanoglou, A.; Bogacz, A.; Cross, J.H.; Elger, C.E.; Engel, J.; Forsgren, L.; French, J.A.; Glynn, M.; et al. ILAE Official Report: A practical clinical definition of epilepsy. Epilepsia 2014, 55, 475–482. [Google Scholar] [CrossRef] [PubMed] [Green Version]
- Semah, F.; Picot, M.C.; Adam, C.; Broglin, D.; Arzimanoglou, A.; Bazin, B.; Cavalcanti, D.; Baulac, M. Is the underlying cause of epilepsy a major prognostic factor for recurrence? Neurology 1998, 51, 1256–1262. [Google Scholar] [CrossRef] [PubMed]
- Chipaux, M.; Szurhaj, W.; Vercueil, L.; Milh, M.; Villeneuve, N.; Cances, C.; Auvin, S.; Chassagnon, S.; Napuri, S.; Allaire, C.; et al. Epilepsy diagnostic and treatment needs identified with a collaborative database involving tertiary centers in France. Epilepsia 2016, 57, 757–769. [Google Scholar] [CrossRef] [Green Version]
- Kwan, P.; Arzimanoglou, A.; Berg, A.T.; Brodie, M.J.; Allen Hauser, W.; Mathern, G.; Moshé, S.L.; Perucca, E.; Wiebe, S.; French, J. Definition of drug resistant epilepsy: Consensus proposal by the ad hoc Task Force of the ILAE Commission on Therapeutic Strategies. Epilepsia 2010, 51, 1069–1077. [Google Scholar] [CrossRef]
- Laxer, K.D.; Trinka, E.; Hirsch, L.J.; Cendes, F.; Langfitt, J.; Delaney, N.; Resnick, T.; Benbadis, S.R. The consequences of refractory epilepsy and its treatment. Epilepsy Behav. 2014, 37, 59–70. [Google Scholar] [CrossRef] [Green Version]
- Lee, A.T.; Burke, J.F.; Chunduru, P.; Molinaro, A.M.; Knowlton, R.; Chang, E.F. A historical cohort of temporal lobe surgery for medically refractory epilepsy: A systematic review and meta-analysis to guide future nonrandomized controlled trial studies. J. Neurosurg. 2019, 133, 71–78. [Google Scholar] [CrossRef]
- De Souza, J.P.S.A.S.; Ayub, G.; Nogueira, M.; Zanao, T.; Lopes, T.M.; Pimentel-Silva, L.R.; Domene, V.; Marquez, G.; Yasuda, C.L.; Ribeiro, L.F.; et al. Temporopolar amygdalohippocampectomy: Seizure control and postoperative outcomes. J. Neurosurg. 2020, 134, 1044–1053. [Google Scholar] [CrossRef]
- Bruxel, E.M.; Canto, A.M.D.; Bruno, D.C.F.; Geraldis, J.C.; Lopes-Cendes, I. Multi-omic strategies applied to the study of pharmacoresistance in mesial temporal lobe epilepsy. Epilepsia Open 2021. [Google Scholar] [CrossRef] [PubMed]
- Stanisic, D.; Martins, L.G.; Tasic, L. Nuclear magnetic resonance spectroscopy in analyses of biological samples. In Tools and Trends in Bioanalytical Chemistry; Springer: Cham, Switzerland, 2022; ISBN 978-3-030-82381-8. [Google Scholar]
- Emwas, A.-H.M.; Salek, R.M.; Griffin, J.L.; Merzaban, J. NMR-based metabolomics in human disease diagnosis: Applications, limitations, and recommendations. Metabolomics 2013, 9, 1048–1072. [Google Scholar] [CrossRef]
- Gebregiworgis, T.; Powers, R. Application of NMR metabolomics to search for human disease biomarkers. Comb. Chem. High Throughput Screen. 2012, 15, 595–610. [Google Scholar] [CrossRef] [PubMed]
- Murgia, F.; Muroni, A.; Puligheddu, M.; Polizzi, L.; Barberini, L.; Orofino, G.; Solla, P.; Poddighe, S.; Del Carratore, F.; Griffin, J.L.; et al. Metabolomics as a tool for the characterization of drug-resistant epilepsy. Front. Neurol. 2017, 8, 459. [Google Scholar] [CrossRef] [PubMed]
- Deutch, A.Y.; Roth, R.H. Pharmacology and biochemistry of synaptic transmission. In From Molecules to Networks; Academic Press: Cambridge, MA, USA, 2014; pp. 207–237. ISBN 978-0-12-397179-1. [Google Scholar]
- Dhar-Chowdhury, P.; Malester, B.; Rajacic, P.; Coetzee, W.A. The regulation of ion channels and transporters by glycolytically derived ATP. Cell. Mol. Life Sci. 2007, 64, 3069–3083. [Google Scholar] [CrossRef]
- Boison, D.; Steinhäuser, C. Epilepsy and astrocyte energy metabolism. Glia 2017, 66, 1235–1243. [Google Scholar] [CrossRef] [PubMed]
- Reid, C.A.; Mullen, S.; Kim, T.H.; Petrou, S. Epilepsy, energy deficiency and new therapeutic approaches including diet. Pharmacol. Ther. 2014, 144, 192–201. [Google Scholar] [CrossRef]
- Boguszewicz, Ł.; Jamroz, E.; Ciszek, M.; Emich-Widera, E.; Kijonka, M.; Banasik, T.; Skorupa, A.; Sokół, M. NMR-based metabolomics in pediatric drug resistant epilepsy—Preliminary results. Sci. Rep. 2019, 9, 15035. [Google Scholar] [CrossRef] [Green Version]
- McGuire, K.; Beerman, K.A. Nutritional Sciences: From Fundamentals to Food; Thomson/Wadsworth: Belmont, CA, USA, 2007; ISBN 049512656X. [Google Scholar]
- Kersten, S.; Wahli, W. Peroxisome proliferator activated receptor agonists. In New Approaches to Drug Development; Jollès, P., Ed.; Experientia Supplementum; Birkhäuser Basel: Basel, Switzerland, 2000; Volume 89, pp. 141–151. ISBN 978-3-0348-9547-7. [Google Scholar]
- Cotter, D.G.; Schugar, R.C.; Crawford, P.A. Ketone body metabolism and cardiovascular disease. Am. J. Physiol. Heart Circ. Physiol. 2013, 304, H1060–H1076. [Google Scholar] [CrossRef] [Green Version]
- Zhang, Y.; Kuang, Y.; LaManna, J.C.; Puchowicz, M.A. Contribution of brain glucose and ketone bodies to oxidative metabolism. In Oxygen Transport to Tissue XXXIV; Welch, W.J., Palm, F., Bruley, D.F., Harrison, D.K., Eds.; Advances in Experimental Medicine and Biology; Springer: New York, NY, USA, 2013; Volume 765, pp. 365–370. ISBN 978-1-4614-4771-9. [Google Scholar]
- Hartman, A.L.; Santos, P.; O’Riordan, K.J.; Stafstrom, C.E.; Hardwick, M. Potent anti-seizure effects of D-leucine. Neurobiol. Dis. 2015, 82, 46–53. [Google Scholar] [CrossRef] [Green Version]
- Evangeliou, A.; Spilioti, M.; Doulioglou, V.; Kalaidopoulou, P.; Ilias, A.; Skarpalezou, A.; Katsanika, I.; Kalamitsou, S.; Vasilaki, K.; Chatziioanidis, I.; et al. Branched chain amino acids as adjunctive therapy to ketogenic diet in epilepsy: Pilot study and hypothesis. J. Child Neurol. 2009, 24, 1268–1272. [Google Scholar] [CrossRef] [PubMed]
- Gruenbaum, S.E.; Dhaher, R.; Rapuano, A.; Zaveri, H.P.; Tang, A.; De Lanerolle, N.; Eid, T. Effects of branched-chain amino acid supplementation on spontaneous seizures and neuronal viability in a model of mesial temporal lobe epilepsy. J. Neurosurg. Anesthesiol. 2019, 31, 247–256. [Google Scholar] [CrossRef] [PubMed]
- Dufour, F.; Nalecz, K.A.; Nalecz, M.J.; Nehlig, A. Modulation of absence seizures by branched-chain amino acids: Correlation with brain amino acid concentrations. Neurosci. Res. 2001, 40, 255–263. [Google Scholar] [CrossRef]
- Skeie, B.; Petersen, A.J.; Manner, T.; Askanazi, J.; Steen, P.A. Effects of valine, leucine, isoleucine, and a balanced amino acid solution on the seizure threshold to picrotoxin in rats. Pharmacol. Biochem. Behav. 1994, 48, 101–103. [Google Scholar] [CrossRef]
- Roussos, P.; Giakoumaki, S.G.; Bitsios, P. A risk PRODH haplotype affects sensorimotor gating, memory, schizotypy, and anxiety in healthy male subjects. Biol. Psychiatry 2009, 65, 1063–1070. [Google Scholar] [CrossRef]
- Nakayama, T.; Al-Maawali, A.; El-Quessny, M.; Rajab, A.; Khalil, S.; Stoler, J.M.; Tan, W.-H.; Nasir, R.; Schmitz-Abe, K.; Hill, R.S.; et al. Mutations in PYCR2, encoding pyrroline-5-carboxylate reductase 2, cause microcephaly and hypomyelination. Am. J. Hum. Genet. 2015, 96, 709–719. [Google Scholar] [CrossRef] [Green Version]
- Yin, X.; Tang, B.; Mao, X.; Peng, J.; Zeng, S.; Wang, Y.; Jiang, H.; Li, N. The genotypic and phenotypic spectrum of PARS2-related infantile-onset encephalopathy. J. Hum. Genet. 2018, 63, 971–980. [Google Scholar] [CrossRef]
- Lu, C.-L.; Chang, Y.-H.; Sun, Y.; Li, C.-Y. A population-based study of epilepsy incidence in association with type 2 diabetes and severe hypoglycaemia. Diabetes Res. Clin. Pract. 2018, 140, 97–106. [Google Scholar] [CrossRef]
- Nair, S.S.; Harikrishnan, S.; Sarma, P.S.; Thomas, S.V. Metabolic syndrome in young adults with epilepsy. Seizure 2016, 37, 61–64. [Google Scholar] [CrossRef] [Green Version]
- Pylvänen, V.; Pakarinen, A.; Knip, M.; Isojärvi, J. Insulin-related metabolic changes during treatment with valproate in patients with epilepsy. Epilepsy Behav. 2006, 8, 643–648. [Google Scholar] [CrossRef]
- McCorry, D.; Nicolson, A.; Smith, D.; Marson, A.; Feltbower, R.G.; Chadwick, D.W. An association between type 1 diabetes and idiopathic generalized epilepsy. Ann. Neurol. 2006, 59, 204–206. [Google Scholar] [CrossRef] [PubMed]
- Canto, A.M.; Vieira, A.S.; Matos, A.H.B.; Carvalho, B.S.; Henning, B.; Norwood, B.A.; Bauer, S.; Rosenow, F.; Gilioli, R.; Cendes, F.; et al. Laser microdissection-based microproteomics of the hippocampus of a rat epilepsy model reveals regional differences in protein abundances. Sci. Rep. 2020, 10, 4412. [Google Scholar] [CrossRef] [Green Version]
- Canto, A.M.; Matos, A.H.B.; Godoi, A.B.; Vieira, A.S.; Aoyama, B.B.; Rocha, C.S.; Henning, B.; Carvalho, B.S.; Pascoal, V.D.B.; Veiga, D.F.T.; et al. Multi-omics analysis suggests enhanced epileptogenesis in the Cornu ammonis 3 of the pilocarpine model of mesial temporal lobe epilepsy. Hippocampus 2020, 31, 122–139. [Google Scholar] [CrossRef] [PubMed]
- Vieira, A.S.; De Matos, A.H.; Canto, A.M.D.; Rocha, C.S.; Carvalho, B.S.; Pascoal, V.D.B.; Norwood, B.; Bauer, S.; Rosenow, F.; Gilioli, R.; et al. RNA sequencing reveals region-specific molecular mechanisms associated with epileptogenesis in a model of classical hippocampal sclerosis. Sci. Rep. 2016, 6, 22416. [Google Scholar] [CrossRef] [Green Version]
- Ribbenstedt, A.; Posselt, M.; Benskin, J.P. Toxicometabolomics and biotransformation product elucidation in single zebrafish embryos exposed to carbamazepine from environmentally-relevant to morphologically altering doses. Chem. Res. Toxicol. 2022, 35, 431–439. [Google Scholar] [CrossRef] [PubMed]
- Dumas, T.; Courant, F.; Almunia, C.; Boccard, J.; Rosain, D.; Duporté, G.; Armengaud, J.; Fenet, H.; Gomez, E. An integrated metabolomics and proteogenomics approach reveals molecular alterations following carbamazepine exposure in the male mussel Mytilus galloprovincialis. Chemosphere 2022, 286, 131793. [Google Scholar] [CrossRef]
- Blümcke, I.; Thom, M.; Aronica, E.; Armstrong, D.D.; Bartolomei, F.; Bernasconi, A.; Bernasconi, N.; Bien, C.G.; Cendes, F.; Coras, R.; et al. International consensus classification of hippocampal sclerosis in temporal lobe epilepsy: A Task Force report from the ILAE Commission on Diagnostic Methods. Epilepsia 2013, 54, 1315–1329. [Google Scholar] [CrossRef]
- Yasuda, C.L.; Morita, M.E.; Alessio, A.; Pereira, A.R.; Balthazar, M.L.F.; Saude, A.V.; Costa, A.L.F.; Cardoso, T.A.; Betting, L.E.; Guerreiro, C.A.M.; et al. Relationship between environmental factors and gray matter atrophy in refractory MTLE. Neurology 2010, 74, 1062–1068. [Google Scholar] [CrossRef]
- Yasuda, C.L.; Tedeschi, H.; Oliveira, E.L.P.; Ribas, G.C.; Costa, A.L.C.; Cardoso, T.A.M.O.; Montenegro, M.A.; Guerreiro, C.A.; Guerreiro, M.M.; Li, L.M.; et al. Comparison of short-term outcome between surgical and clinical treatment in temporal lobe epilepsy: A prospective study. Seizure 2006, 15, 35–40. [Google Scholar] [CrossRef] [Green Version]
- Pang, Z.; Chong, J.; Zhou, G.; de Lima Morais, D.A.; Chang, L.; Barrette, M.; Gauthier, C.; Jacques, P.-É.; Li, S.; Xia, J. MetaboAnalyst 5.0: Narrowing the gap between raw spectra and functional insights. Nucleic Acids Res. 2021, 49, W388–W396. [Google Scholar] [CrossRef]
- Wishart, D.S.; Feunang, Y.D.; Marcu, A.; Guo, A.C.; Liang, K.; Vázquez-Fresno, R.; Sajed, T.; Johnson, D.; Li, C.; Karu, N.; et al. HMDB 4.0: The Human Metabolome Database for 2018. Available online: http://www.hmdb.ca/ (accessed on 15 March 2022).
- Ulrich, E.L.; Akutsu, H.; Doreleijers, J.F.; Harano, Y.; Ioannidis, Y.E.; Lin, J.; Livny, M.; Mading, S.; Maziuk, D.; Miller, Z.; et al. BioMagResBank. Available online: http://www.bmrb.wisc.edu/ (accessed on 25 March 2022).
- Karnovsky, A.; Weymouth, T.; Hull, T.; Tarcea, V.G.; Scardoni, G.; Laudanna, C.; Sartor, M.A.; Stringer, K.A.; Jagadish, H.V.; Burant, C.; et al. Metscape 2 bioinformatics tool for the analysis and visualization of metabolomics and gene expression data. Bioinformatics 2012, 28, 373–380. [Google Scholar] [CrossRef] [PubMed] [Green Version]
- Kanehisa, M.; Goto, S. KEGG: Kyoto encyclopedia of genes and genomes. Nucleic Acids Res. 2000, 28, 27–30. [Google Scholar] [CrossRef] [PubMed]
- Frolkis, A.; Knox, C.; Lim, E.; Jewison, T.; Law, V.; Hau, D.D.; Liu, P.; Gautam, B.; Ly, S.; Guo, A.C.; et al. SMPDB: The small molecule pathway database. Nucleic Acids Res. 2010, 38, D480–D487. [Google Scholar] [CrossRef] [PubMed] [Green Version]


| ID | Sex | Age (Years) | Age at Onset of Epilepsy | Hippocampal Abnormalities | Group | Response to Treatment with ASM Combination, CBZ + CLB |
|---|---|---|---|---|---|---|
| 1 | F | 63 | 15 | LHS | MTLE | Refractory |
| 2 | M | 60 | 26 | Bilateral | MTLE | Refractory |
| 3 | F | 57 | 1 | LHS | MTLE | Refractory |
| 4 | M | 59 | 15 | LHS | MTLE | Refractory |
| 5 | F | 70 | 17 | LHS | MTLE | Refractory |
| 6 | M | 58 | 14 | RHS | MTLE | Refractory |
| 7 | F | 50 | 2 | LHS | MTLE | Refractory |
| 8 | M | 50 | 19 | LHS | MTLE | Refractory |
| 9 | F | 37 | 7 | LHS | MTLE | Refractory |
| 10 | M | 26 | 5 | LHS | MTLE | Refractory |
| 11 | M | 54 | 10 | LHS | MTLE | Refractory |
| 12 | F | 60 | 16 | RHS | MTLE | Refractory |
| 13 | F | 26 | 7 | RHS | MTLE | Refractory |
| 14 | F | 62 | 23 | Bilateral | MTLE | Refractory |
| 15 | M | 60 | 20 | RHS | MTLE | Refractory |
| 16 | M | 62 | 14 | LHS | MTLE | Refractory |
| 17 | F | 61 | 2 | RHS | MTLE | Refractory |
| 18 | M | 46 | 1 | LHS | MTLE | Refractory |
| 19 | F | 54 | 8 | LHS | MTLE | Refractory |
| 20 | F | 51 | 30 | None | MTLE | Refractory |
| 21 | F | 43 | 7 | LHS | MTLE | Responsive |
| 22 | M | 45 | 8 | RHS | MTLE | Responsive |
| 23 | F | 65 | 3 | LHS | MTLE | Responsive |
| 24 | M | 55 | 31 | RHS | MTLE | Responsive |
| 25 | F | 58 | 17 | RHS | MTLE | Responsive |
| 26 | M | 47 | 19 | LHS | MTLE | Responsive |
| 27 | F | 56 | 20 | LHS | MTLE | Responsive |
| 28 | F | 70 | 18 | LHS | MTLE | Responsive |
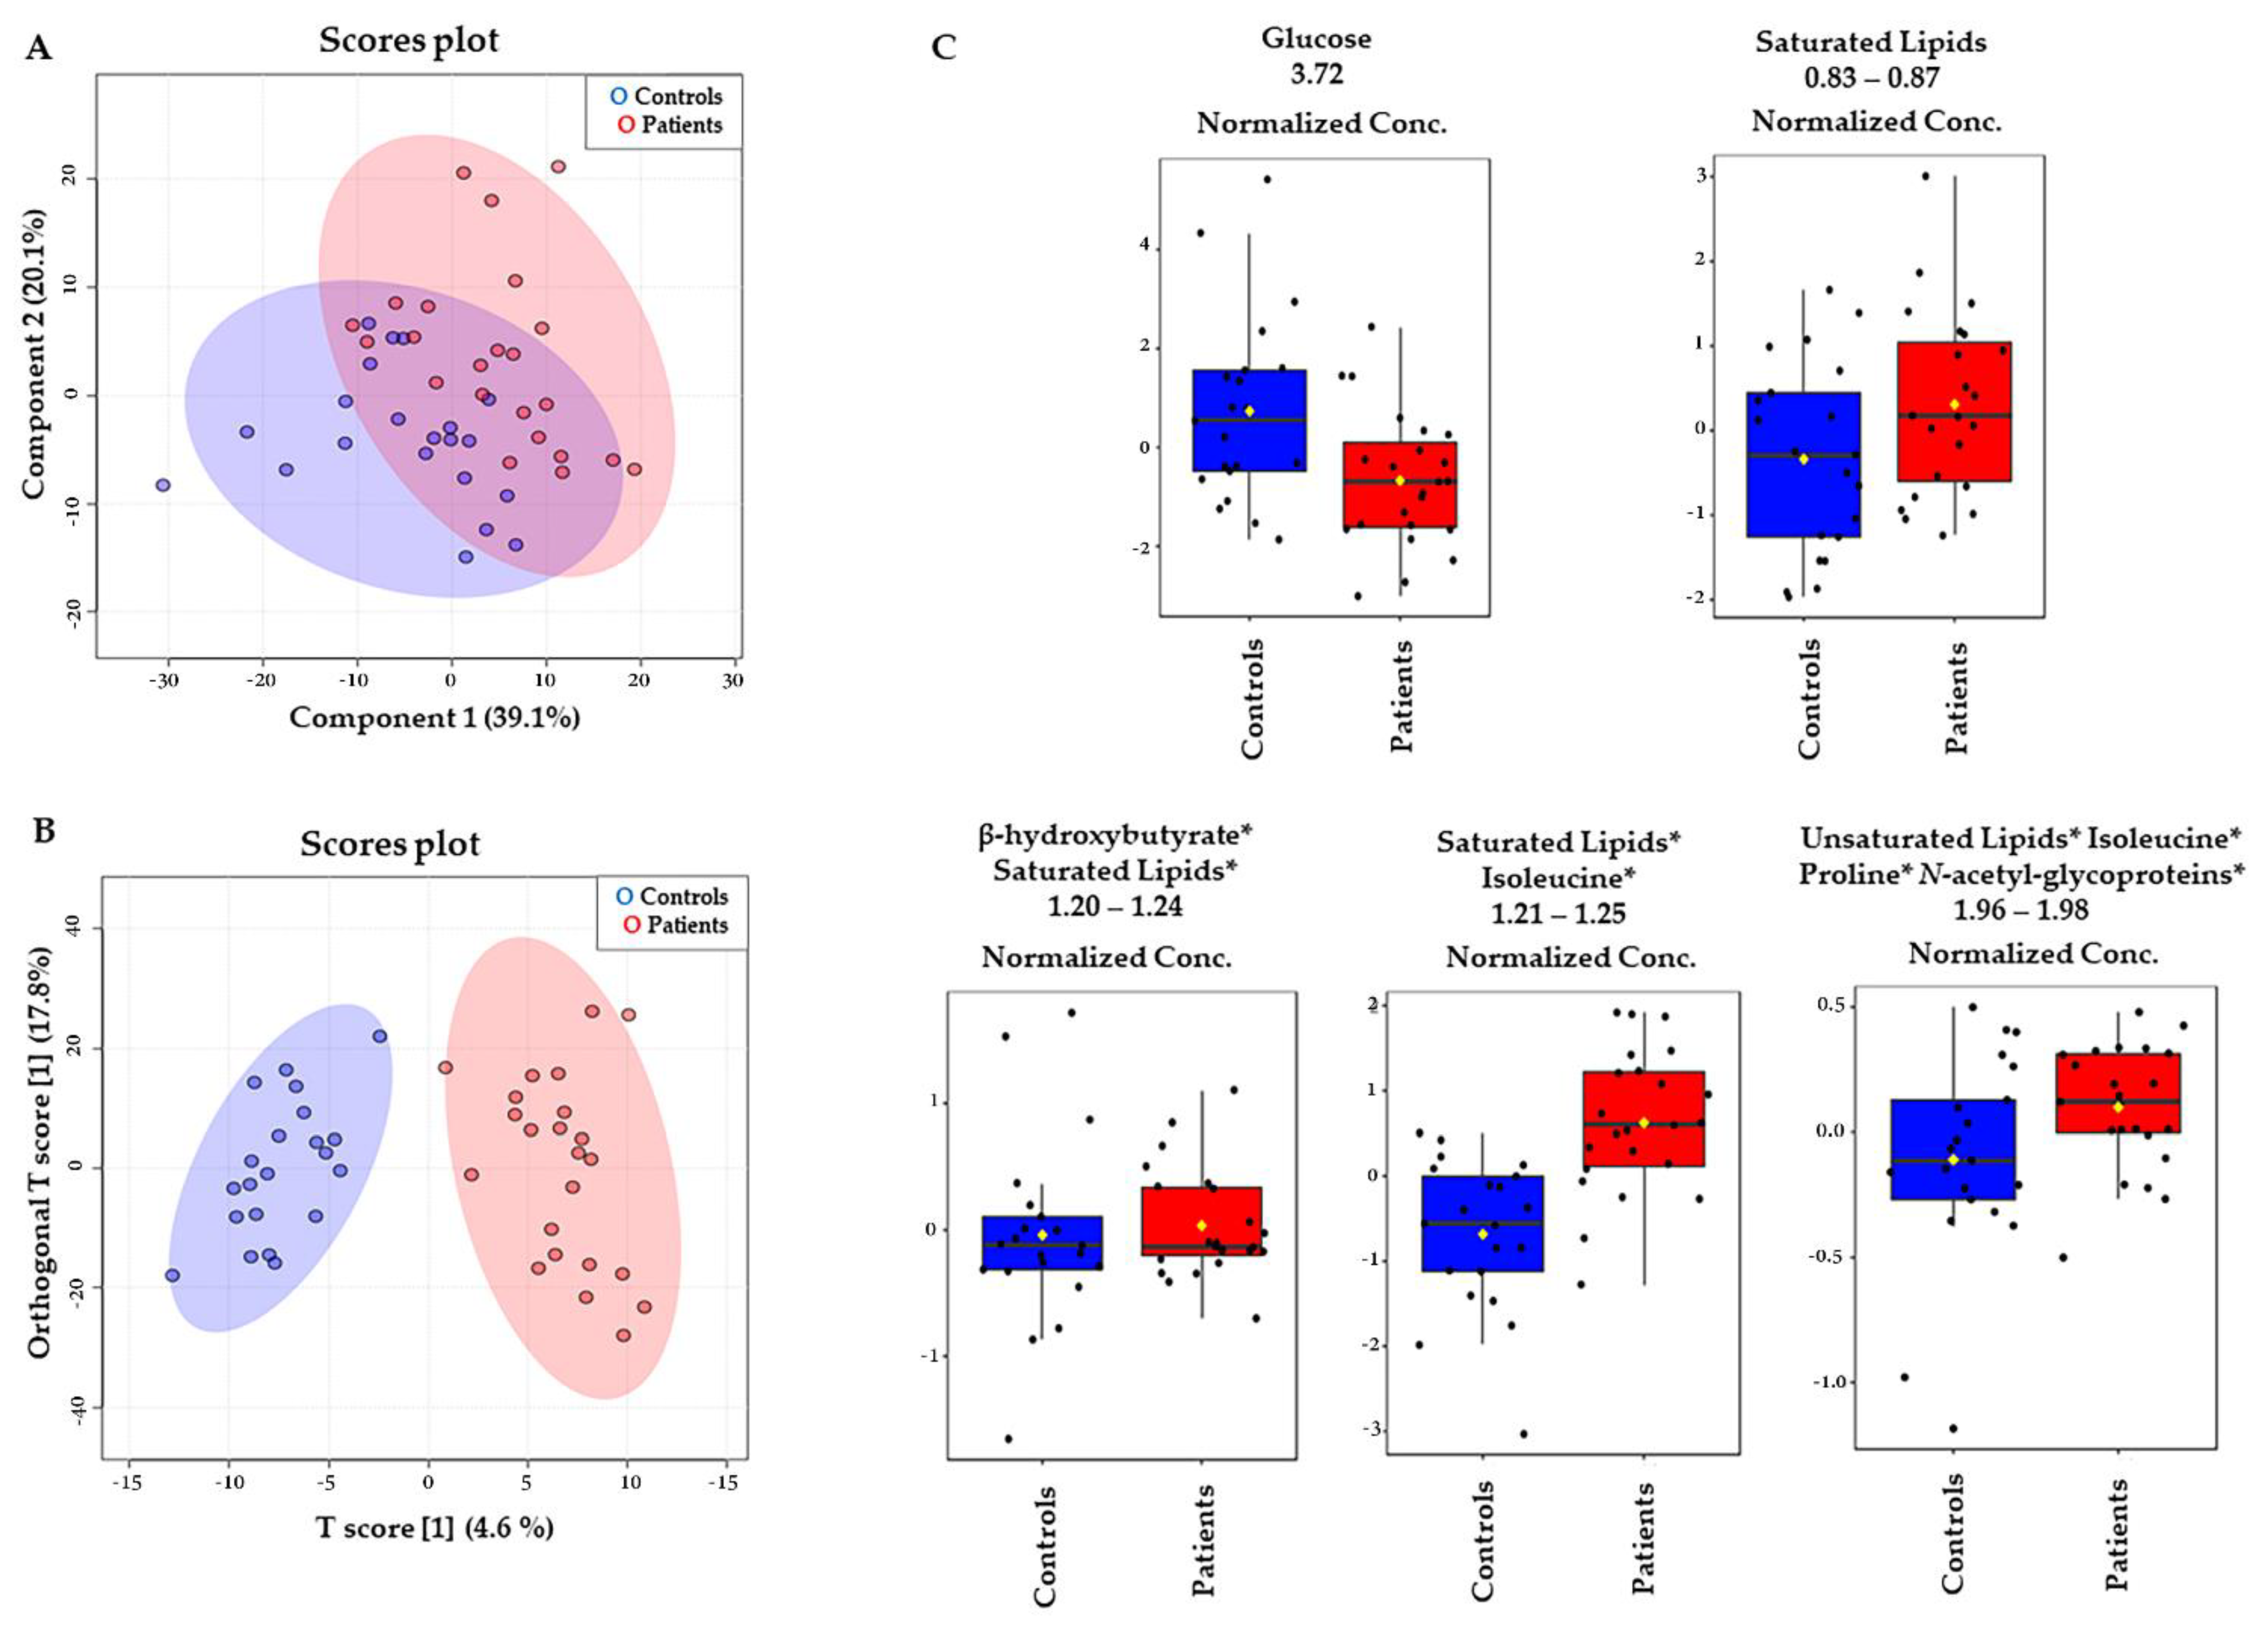
| MTLE versus Control—VIP Score | |||||
|---|---|---|---|---|---|
| Metabolites | Chemical Shift (Multip; Assign.) | Vip Score | p-Value | FC | FDR |
| Glucose | 3.68–3.78 (m, CH) | 5.12 | 6.0000 × 10⁻³ | 1.30 | 0.196 |
| Saturated Lipids | 0.83–0.87 (m, CH3) | 5.02 | 0.0918 × 10⁻³ | 0.76 | 0.023 |
| Saturated Lipids, Isoleucine * | 1.21–1.25 (m, -CH2-) | 3.80 | 0.0817 × 10⁻⁵ | 0.82 | 0.023 |
| β-Hydroxybutyrate, Saturated Lipids * | 1.20–1.24 (m, -CH2- | 3.15 | 0.129 × 10⁻³ | 0.82 | 0.027 |
| Unsaturated lipids, Isoleucine, Proline, and N-Acetyl-glycoproteins * | 1.96–2.09 (m, -CH2-CH=) | 2.16 | 0.0905 × 10⁻³ | 0.85 | 0.198 |
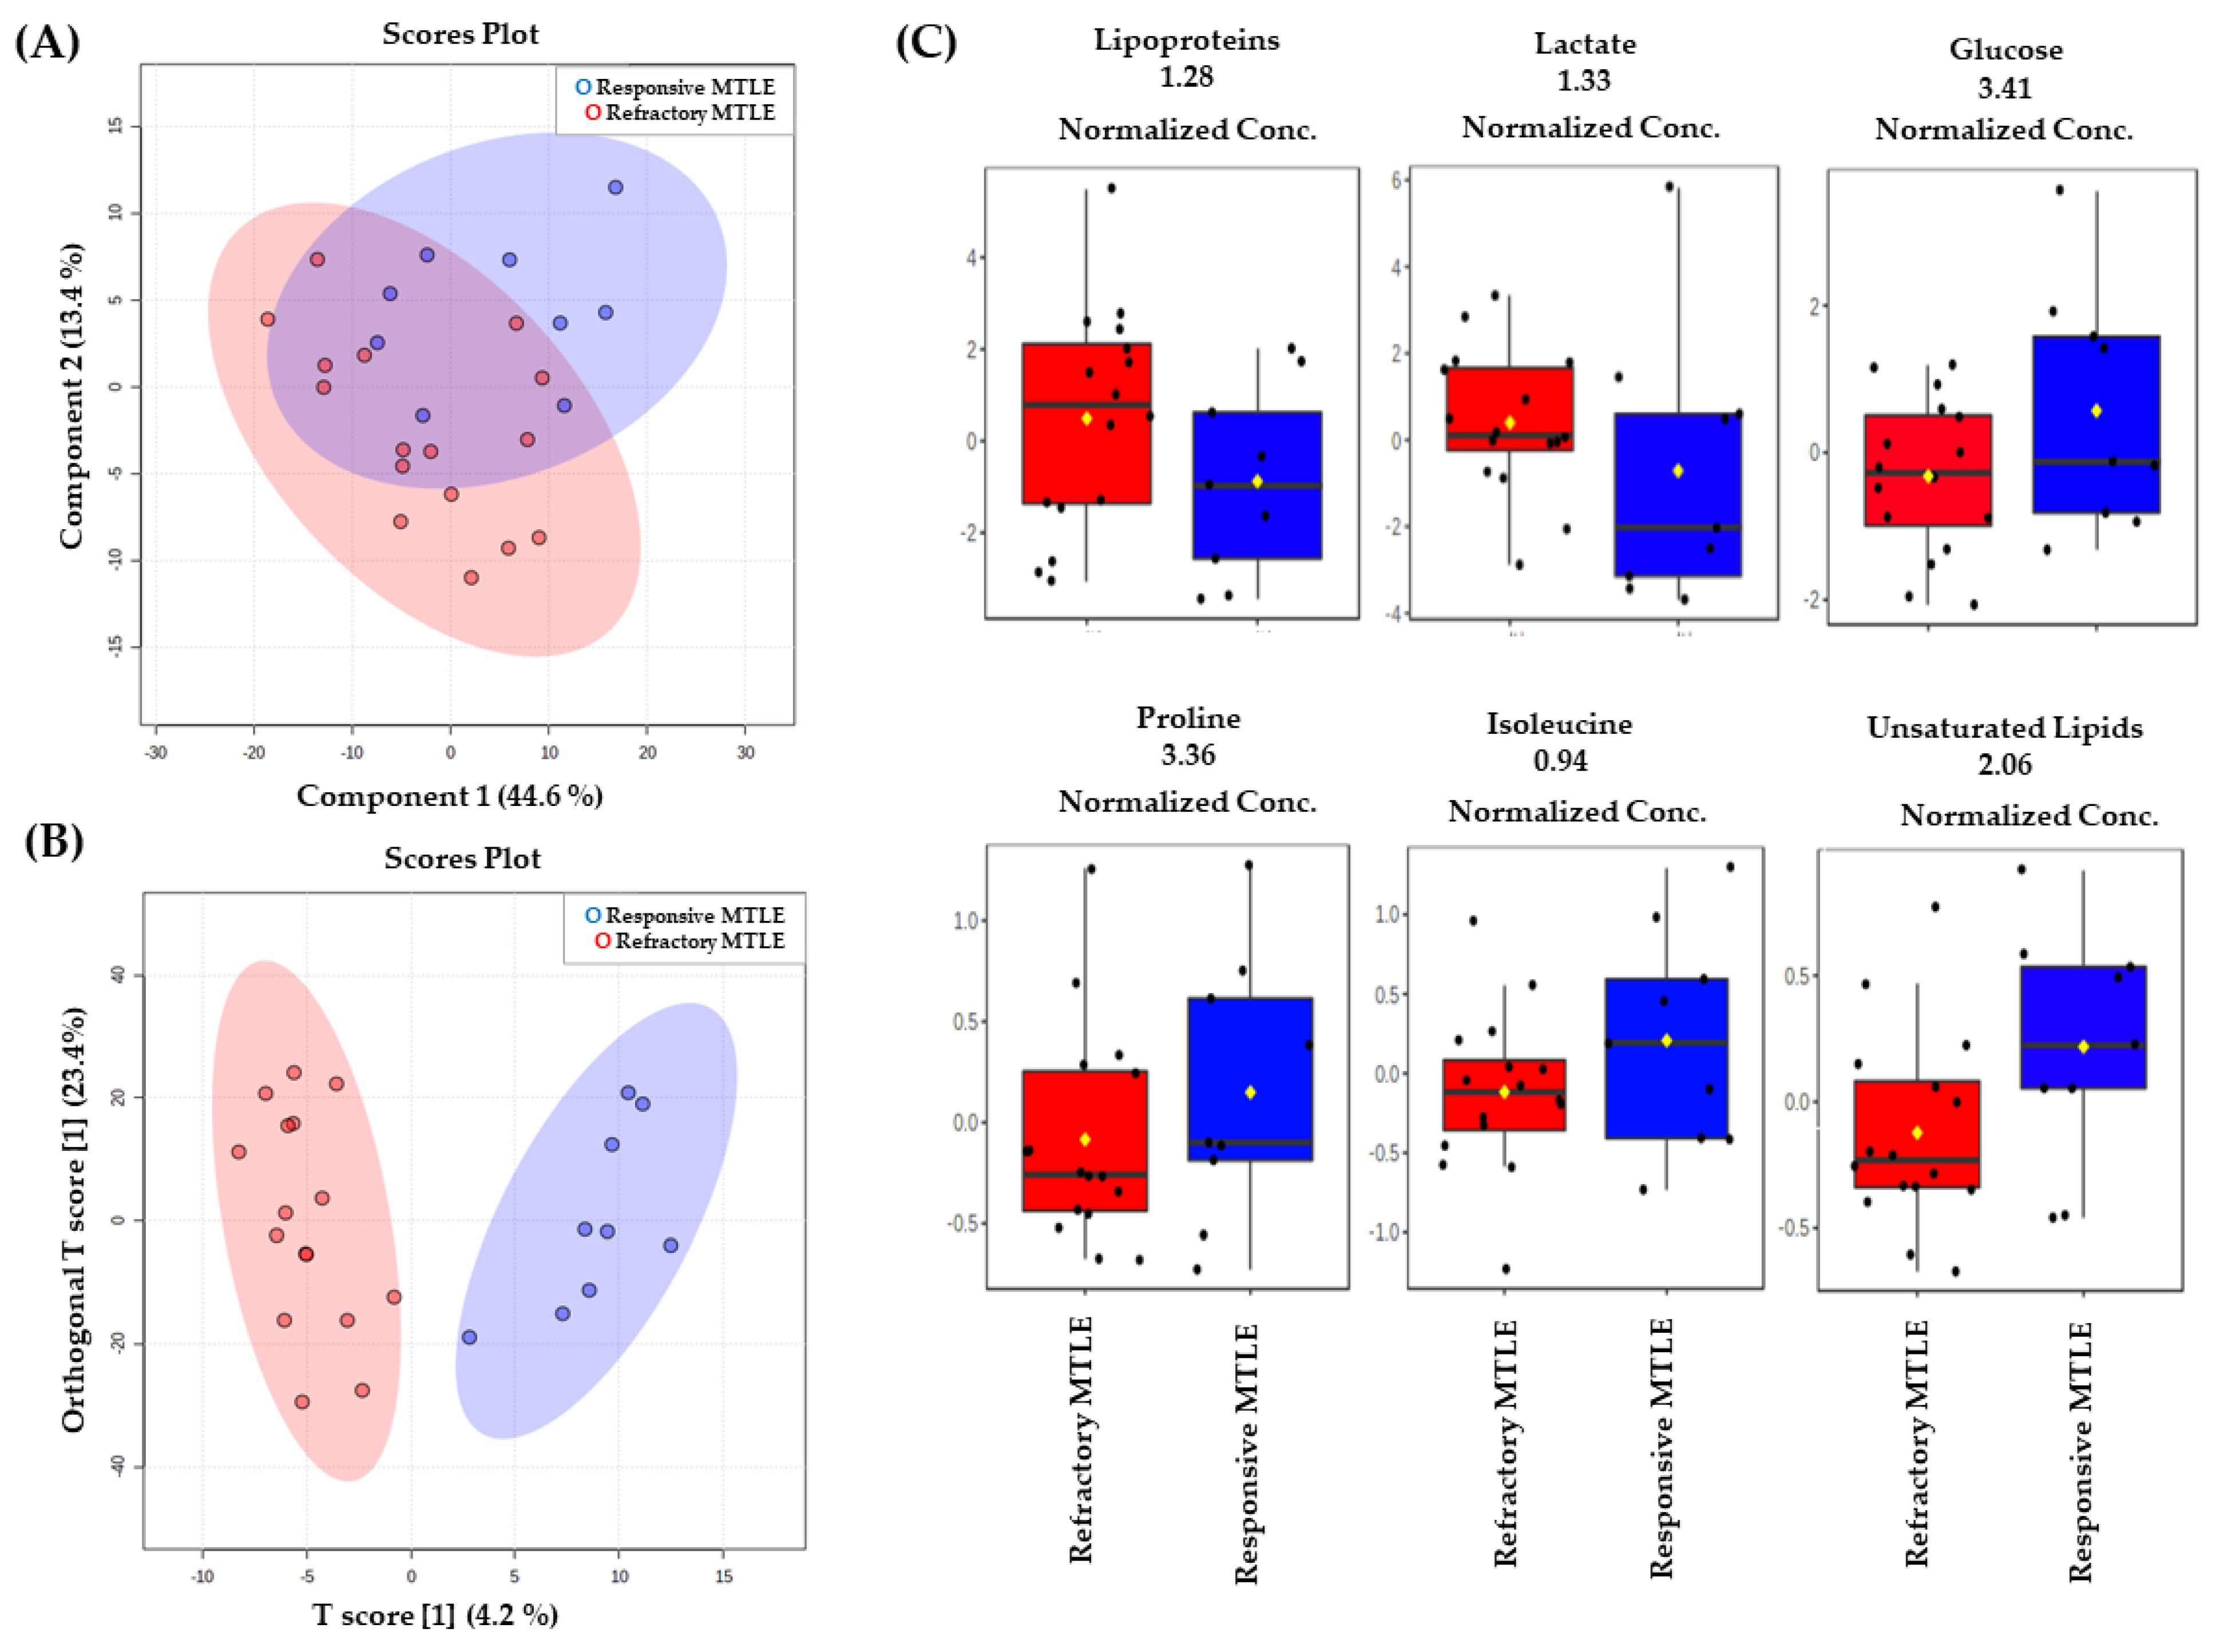
| Refractory MTLE versus Responsive MTLE—VIP Scores | ||||
|---|---|---|---|---|
| Metabolites | Chemical Shift (Multip.; Assign.) | VIP Score | p-Value | FC |
| Lipoproteins | 1.28 (m, CH) | 6.66 | 0.05 | 1.209 |
| Lactate | 1.33 (d, CH3) | 5.41 | 0.05 | 1.159 |
| Glucose | 3.41 (m, CH2) | 4.81 | 0.05 | 0.752 |
| Exclusively unsaturated lipid | 2.06 (l, CH2CH=) | 1.71 | 0.05 | 0.857 |
| Isoleucine | 0.94 (t, CH3) | 1.57 | 0.05 | 0.886 |
| Proline | 3.36 (m, CH) | 1.13 | 0.05 | 0.658 |
Publisher’s Note: MDPI stays neutral with regard to jurisdictional claims in published maps and institutional affiliations. |
© 2022 by the authors. Licensee MDPI, Basel, Switzerland. This article is an open access article distributed under the terms and conditions of the Creative Commons Attribution (CC BY) license (https://creativecommons.org/licenses/by/4.0/).
Share and Cite
Godoi, A.B.; do Canto, A.M.; Donatti, A.; Rosa, D.C.; Bruno, D.C.F.; Alvim, M.K.; Yasuda, C.L.; Martins, L.G.; Quintero, M.; Tasic, L.; et al. Circulating Metabolites as Biomarkers of Disease in Patients with Mesial Temporal Lobe Epilepsy. Metabolites 2022, 12, 446. https://doi.org/10.3390/metabo12050446
Godoi AB, do Canto AM, Donatti A, Rosa DC, Bruno DCF, Alvim MK, Yasuda CL, Martins LG, Quintero M, Tasic L, et al. Circulating Metabolites as Biomarkers of Disease in Patients with Mesial Temporal Lobe Epilepsy. Metabolites. 2022; 12(5):446. https://doi.org/10.3390/metabo12050446
Chicago/Turabian StyleGodoi, Alexandre B., Amanda M. do Canto, Amanda Donatti, Douglas C. Rosa, Danielle C. F. Bruno, Marina K. Alvim, Clarissa L. Yasuda, Lucas G. Martins, Melissa Quintero, Ljubica Tasic, and et al. 2022. "Circulating Metabolites as Biomarkers of Disease in Patients with Mesial Temporal Lobe Epilepsy" Metabolites 12, no. 5: 446. https://doi.org/10.3390/metabo12050446
APA StyleGodoi, A. B., do Canto, A. M., Donatti, A., Rosa, D. C., Bruno, D. C. F., Alvim, M. K., Yasuda, C. L., Martins, L. G., Quintero, M., Tasic, L., Cendes, F., & Lopes-Cendes, I. (2022). Circulating Metabolites as Biomarkers of Disease in Patients with Mesial Temporal Lobe Epilepsy. Metabolites, 12(5), 446. https://doi.org/10.3390/metabo12050446