
Metabolites Alterations and Liver Injury in Hepatic Encephalopathy Models Evaluated by Use of 7T-MRI

 ,
,
Abstract
:1. Introduction
2. Materials and Methods
2.1. Animal Preparation
2.2. Magnetic Resonance Imaging
2.3. Biochemical Analyses of Blood Samples
2.4. Histological Examinations
2.5. Statistical Analysis
3. Results
3.1. Animal Characteristics
3.2. Blood Tests
3.3. MRI Images
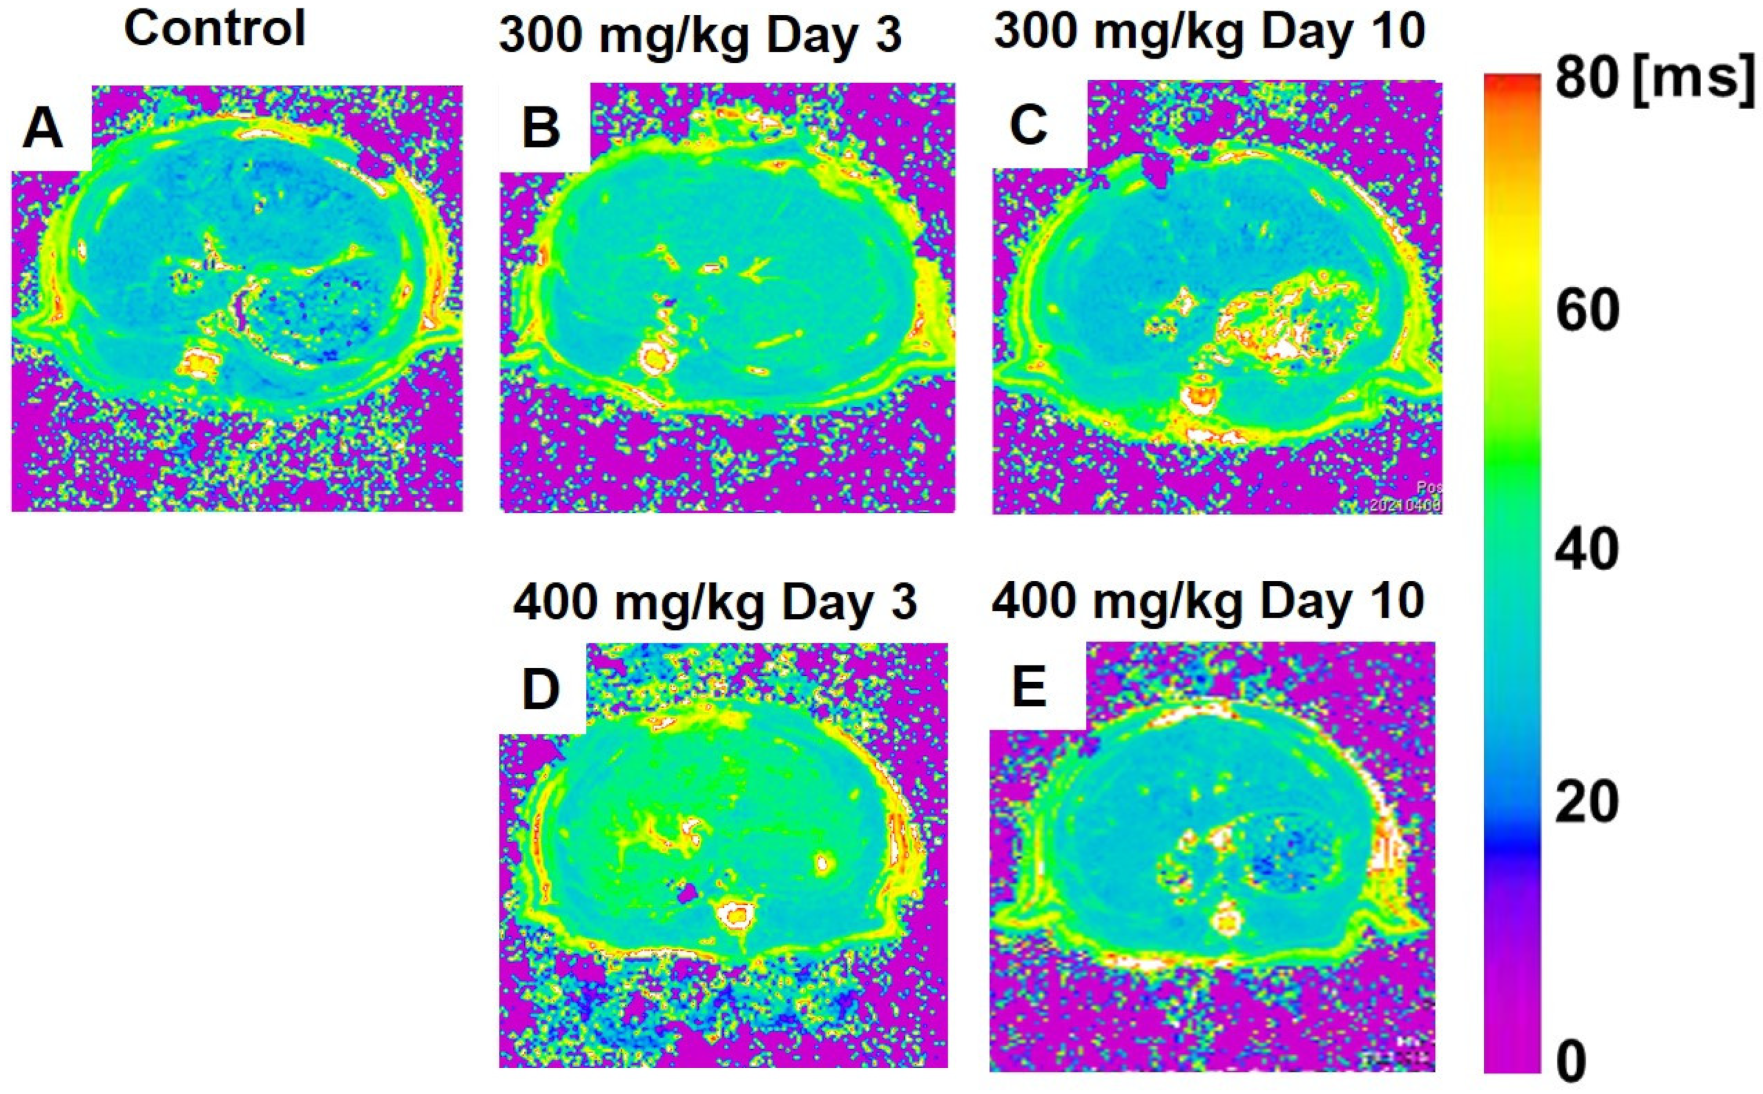
3.3.1. T1ρ Relaxation Time
3.3.2. T2 Relaxation Time
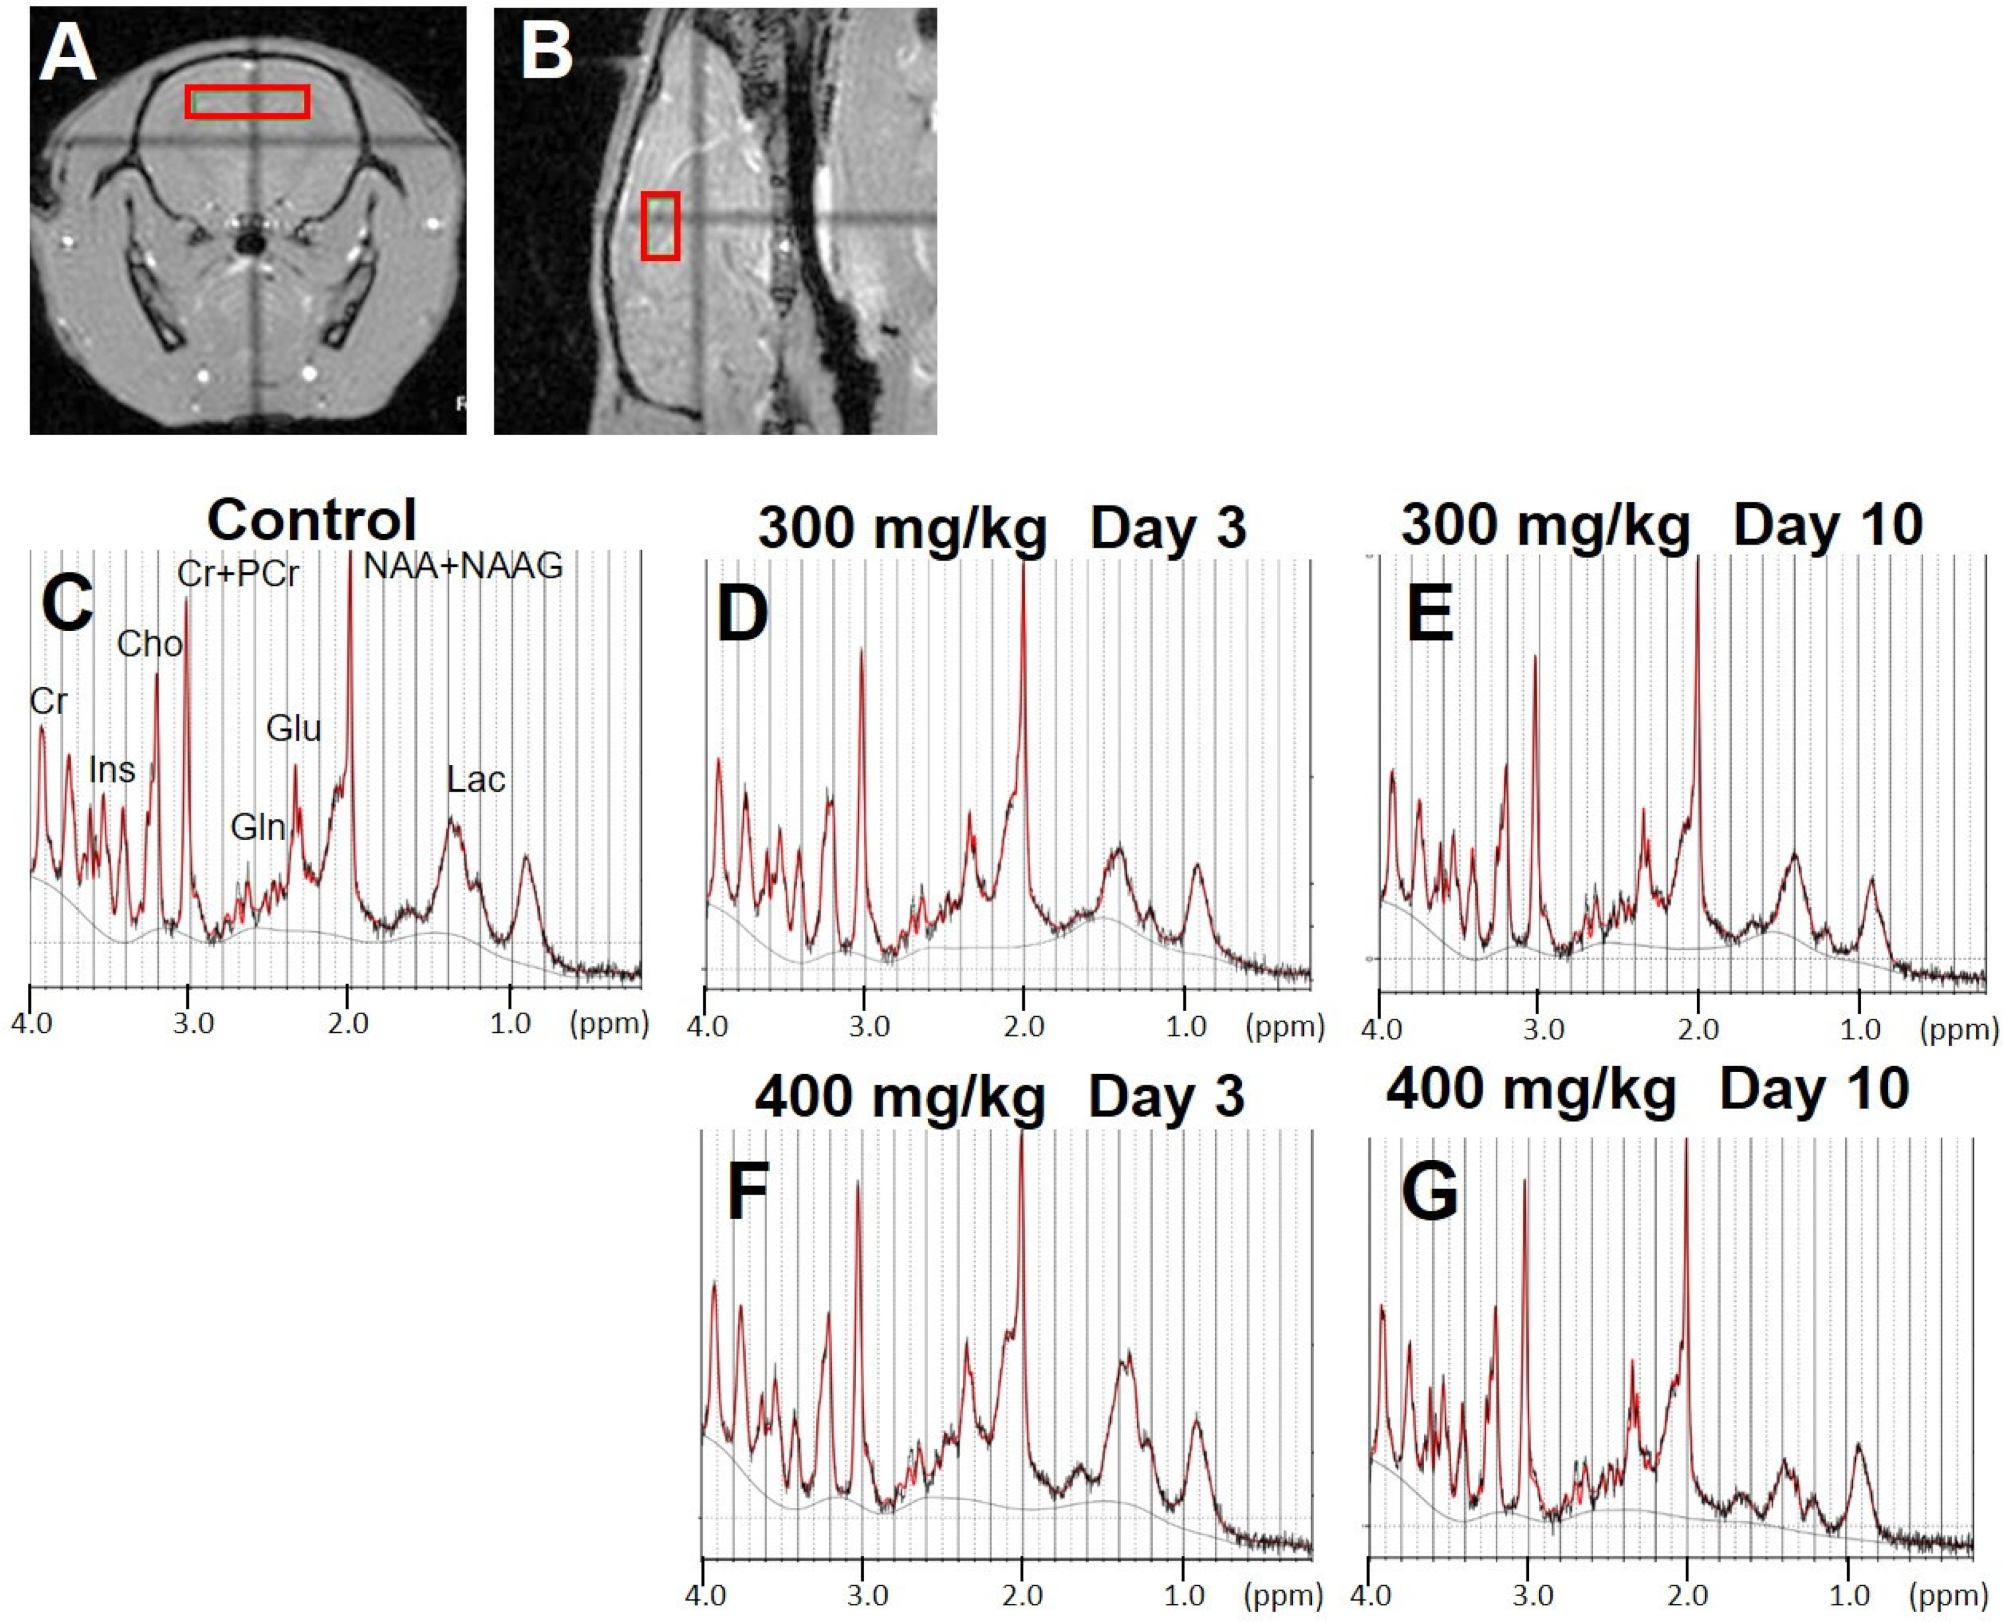
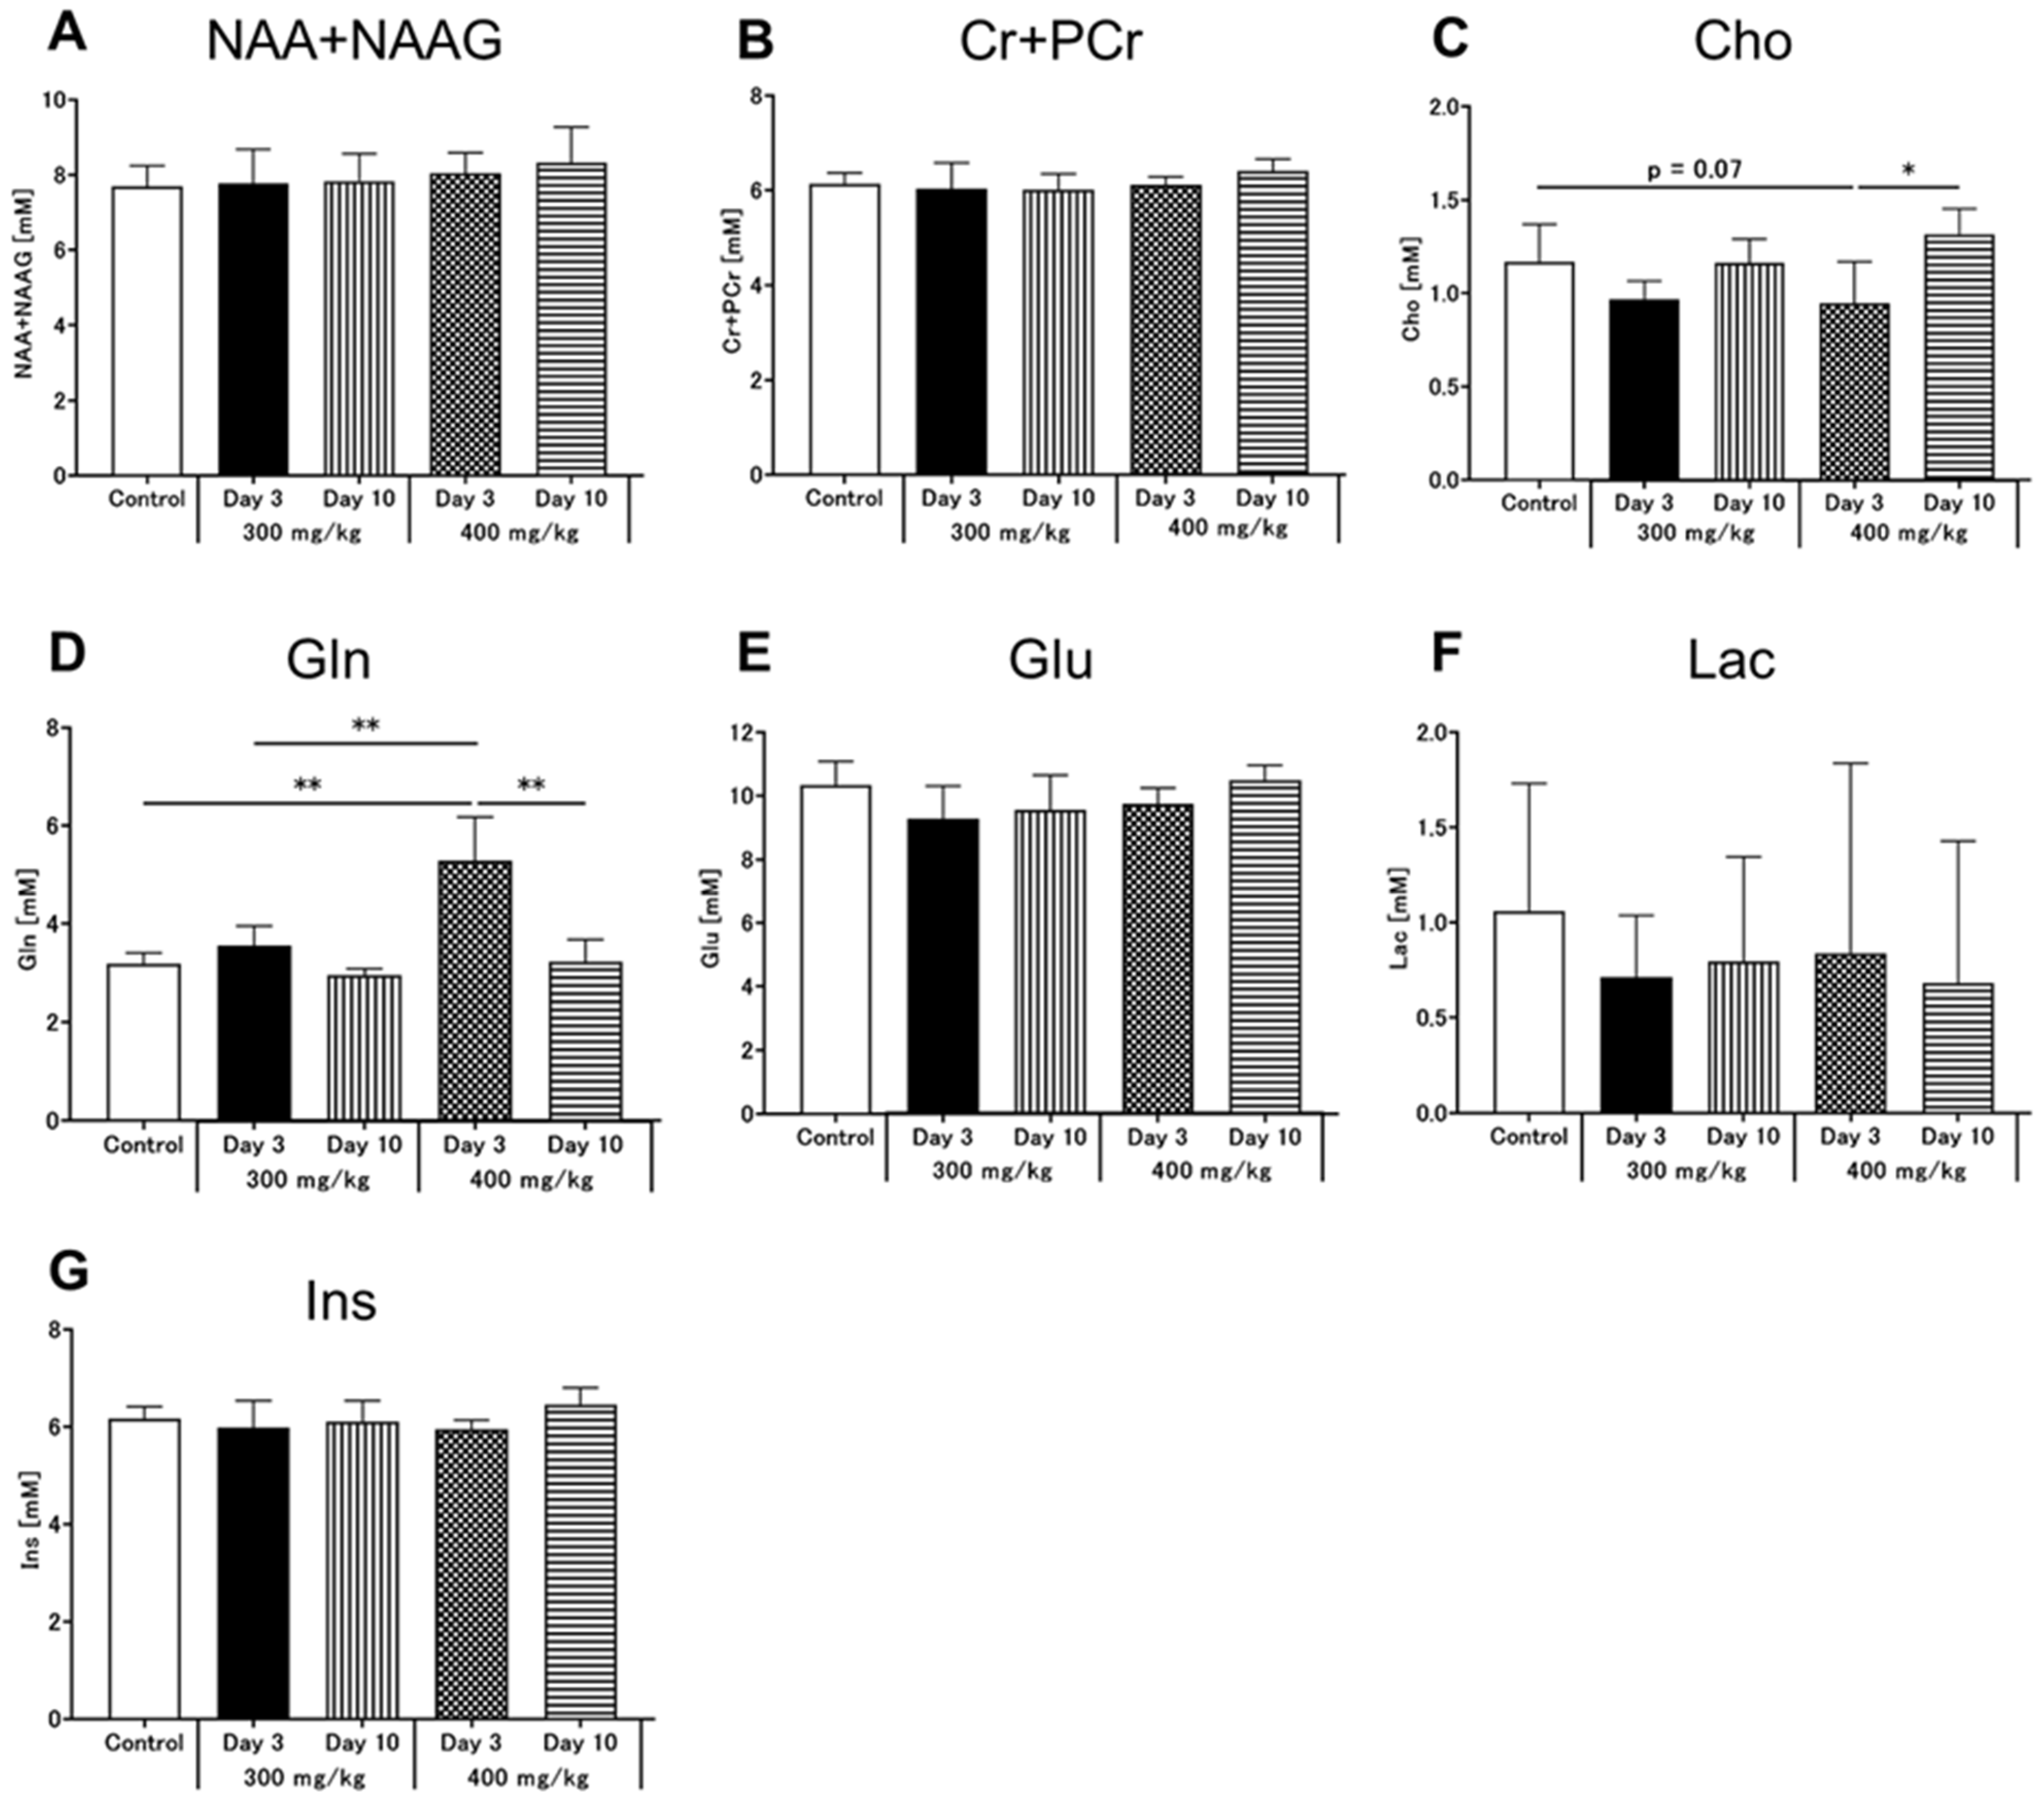
3.4. Brain MRS
3.5. Hepatocyte Stainings
4. Discussion
4.1. Inter-Organ Communication between the Brain and the Liver
4.2. Early Neurometabolic Events in TAA-Induced Acute Liver Injury
4.3. Early Alterations of T1ρ and T2 Relaxation Times in TAA-Induced Acute Liver Injury
4.4. Limitations
5. Conclusions
Author Contributions
Funding
Institutional Review Board Statement
Informed Consent Statement
Data Availability Statement
Conflicts of Interest
References
- Ferenci, P.; Lockwood, A.; Mullen, K.; Tarter, R.; Weissenborn, K.; Blei, A.T. Hepatic Encephalopathy-Definition, Nomenclature, Diagnosis, and Quantification: Final Report of the Working Party at the 11th World Congresses of Gastroenterology, Vienna, 1998. Hepatology 2002, 35, 716–721. [Google Scholar] [CrossRef] [PubMed]
- Rahimi, R.S.; Rockey, D.C. Hepatic Encephalopathy: How to Test and Treat. Curr. Opin. Gastroenterol. 2014, 30, 265–271. [Google Scholar] [CrossRef] [PubMed]
- Williams, S.T. Pathophysiology of Encephalopathy and Delirium. J. Clin. Neurophysiol. 2013, 30, 435–437. [Google Scholar] [CrossRef] [PubMed]
- Haussinger, D.; Kircheis, G.; Fischer, R.; Schliess, F.; vom Dahl, S. Hepatic Encephalopathy in Chronic Liver Disease: A Clinical Manifestation of Astrocyte Swelling and Low-Grade Cerebral Edema? J. Hepatol. 2000, 32, 1035–1038. [Google Scholar] [CrossRef]
- Vaquero, J.; Chung, C.; Blei, A.T. Brain Edema in Acute Liver Failure. A Window to the Pathogenesis of Hepatic Encephalopathy. Ann. Hepatol. 2003, 2, 12–22. [Google Scholar] [CrossRef]
- McPhail, M.J.; Patel, N.R.; Taylor-Robinson, S.D. Brain Imaging and Hepatic Encephalopathy. Clin. Liver Dis. 2012, 16, 57–72. [Google Scholar] [CrossRef] [Green Version]
- Allkemper, T.; Sagmeister, F.; Cicinnati, V.; Beckebaum, S.; Kooijman, H.; Kanthak, C.; Stehling, C.; Heindel, W. Evaluation of Fibrotic Liver Disease with Whole-Liver T1rho Mr Imaging: A Feasibility Study at 1.5 T. Radiology 2014, 271, 408–415. [Google Scholar] [CrossRef]
- Haris, M.; McArdle, E.; Fenty, M.; Singh, A.; Davatzikos, C.; Trojanowski, J.Q.; Melhem, E.R.; Clark, C.M.; Borthakur, A. Early Marker for Alzheimer’s Disease: Hippocampus T1rho (T(1rho)) Estimation. J. Magn. Reson. Imaging 2009, 29, 1008–1012. [Google Scholar] [CrossRef] [Green Version]
- Nguyen, A.M.; Johannessen, W.; Yoder, J.H.; Wheaton, A.J.; Vresilovic, E.J.; Borthakur, A.; Elliott, D.M. Noninvasive Quantification of Human Nucleus Pulposus Pressure with Use of T1rho-Weighted Magnetic Resonance Imaging. J. Bone Jt. Surg. Am. 2008, 90, 796–802. [Google Scholar] [CrossRef] [Green Version]
- Wang, Y.X.; Yuan, J.; Chu, E.S.; Go, M.Y.; Huang, H.; Ahuja, A.T.; Sung, J.J.; Yu, J. T1rho Mr Imaging Is Sensitive to Evaluate Liver Fibrosis: An Experimental Study in a Rat Biliary Duct Ligation Model. Radiology 2011, 259, 712–719. [Google Scholar] [CrossRef] [Green Version]
- Guimaraes, A.R.; Siqueira, L.; Uppal, R.; Alford, J.; Fuchs, B.C.; Yamada, S.; Tanabe, K.; Chung, R.T.; Lauwers, G.; Chew, M.L.; et al. T2 Relaxation Time Is Related to Liver Fibrosis Severity. Quant. Imaging Med. Surg. 2016, 6, 103–114. [Google Scholar] [CrossRef] [Green Version]
- Wallace, M.C.; Hamesch, K.; Lunova, M.; Kim, Y.; Weiskirchen, R.; Strnad, P.; Friedman, S.L. Standard Operating Procedures in Experimental Liver Research: Thioacetamide Model in Mice and Rats. Lab. Anim. 2015, 49, 21–29. [Google Scholar] [CrossRef] [Green Version]
- Lee, Y.H.; Son, J.Y.; Kim, K.S.; Park, Y.J.; Kim, H.R.; Park, J.H.; Kim, K.B.; Lee, K.Y.; Kang, K.W.; Kim, I.S.; et al. Estrogen Deficiency Potentiates Thioacetamide-Induced Hepatic Fibrosis in Sprague-Dawley Rats. Int. J. Mol. Sci. 2019, 20, 3709. [Google Scholar] [CrossRef] [Green Version]
- Butterworth, R.F.; Norenberg, M.D.; Felipo, V.; Ferenci, P.; Albrecht, J.; Blei, A.T. Ishen Commission on Experimental Models of H. E. Members of the. Experimental Models of Hepatic Encephalopathy: Ishen Guidelines. Liver Int. 2009, 29, 783–788. [Google Scholar] [CrossRef]
- Saito, S.; Takahashi, Y.; Ohki, A.; Shintani, Y.; Higuchi, T. Early Detection of Elevated Lactate Levels in a Mitochondrial Disease Model Using Chemical Exchange Saturation Transfer (Cest) and Magnetic Resonance Spectroscopy (Mrs) at 7t-Mri. Radiol. Phys. Technol. 2019, 12, 46–54. [Google Scholar] [CrossRef]
- Provencher, S.W. Automatic Quantitation of Localized In Vivo 1h Spectra with Lcmodel. NMR Biomed. 2001, 14, 260–264. [Google Scholar] [CrossRef]
- Ohki, A.; Saito, S.; Hirayama, E.; Takahashi, Y.; Ogawa, Y.; Tsuji, M.; Higuchi, T.; Fukuchi, K. Comparison of Chemical Exchange Saturation Transfer Imaging with Diffusion-Weighted Imaging and Magnetic Resonance Spectroscopy in a Rat Model of Hypoxic-Ischemic Encephalopathy. Magn. Reson. Med. Sci. 2020, 19, 359–365. [Google Scholar] [CrossRef] [Green Version]
- Arihara, N.; Saito, S.; Sawaya, R.; Onishi, R.; Tsuji, K.; Ohki, A.; Ueda, J.; Morimoto-Ishiwaka, D. Evaluation of Liver T1rho and T2 Values in Acute Liver Inflammation Models Using 7t-Mri. Magn. Reason. Imaging 2022, 88, 20–24. [Google Scholar] [CrossRef]
- Albrecht, J.; Zielinska, M.; Norenberg, M.D. Glutamine as a Mediator of Ammonia Neurotoxicity: A Critical Appraisal. Biochem. Pharmacol. 2010, 80, 1303–1308. [Google Scholar] [CrossRef] [Green Version]
- Katagiri, H.; Yamada, T.; Oka, Y. Adiposity and Cardiovascular Disorders: Disturbance of the Regulatory System Consisting of Humoral and Neuronal Signals. Circ. Res. 2007, 101, 27–39. [Google Scholar] [CrossRef] [Green Version]
- Luetkens, J.A.; Klein, S.; Traber, F.; Schmeel, F.C.; Sprinkart, A.M.; Kuetting, D.L.R.; Block, W.; Uschner, F.E.; Schierwagen, R.; Hittatiya, K.; et al. Quantification of Liver Fibrosis at T1 and T2 Mapping with Extracellular Volume Fraction Mri: Preclinical Results. Radiology 2018, 288, 748–754. [Google Scholar] [CrossRef] [PubMed]
- Braissant, O.; Rackayova, V.; Pierzchala, K.; Grosse, J.; McLin, V.A.; Cudalbu, C. Longitudinal Neurometabolic Changes in the Hippocampus of a Rat Model of Chronic Hepatic Encephalopathy. J. Hepatol. 2019, 71, 505–515. [Google Scholar] [CrossRef] [PubMed] [Green Version]
- Rackayova, V.; Braissant, O.; McLin, V.A.; Berset, C.; Lanz, B.; Cudalbu, C. 1H and 31P Magnetic Resonance Spectroscopy in a Rat Model of Chronic Hepatic Encephalopathy: In Vivo Longitudinal Measurements of Brain Energy Metabolism. Metab. Brain Dis. 2016, 31, 1303–1314. [Google Scholar] [CrossRef] [PubMed]
- Stith, B.J.; Woronoff, K.; Espinoza, R.; Smart, T. Sn-1,2-Diacylglycerol and Choline Increase after Fertilization in Xenopus Laevis. Mol. Biol. Cell 1997, 8, 755–765. [Google Scholar] [CrossRef] [Green Version]
- Lanz, B.; Rackayova, V.; Braissant, O.; Cudalbu, C. Mrs Studies of Neuroenergetics and Glutamate/Glutamine Exchange in Rats: Extensions to Hyperammonemic Models. Anal. Biochem. 2017, 529, 245–269. [Google Scholar] [CrossRef]
- Bliss, T.V.; Collingridge, G.L. A Synaptic Model of Memory: Long-Term Potentiation in the Hippocampus. Nature 1993, 361, 31–39. [Google Scholar] [CrossRef]
- Monfort, P.; Munoz, M.D.; Felipo, V. Chronic Hyperammonemia in Vivo Impairs Long-Term Potentiation in Hippocampus by Altering Activation of Cyclic Gmp-Dependent-Protein Kinase and of Phosphodiesterase 5. J. Neurochem. 2005, 94, 934–942. [Google Scholar] [CrossRef]
- Bajaj, J.S.; Duarte-Rojo, A.; Xie, J.J.; Acharya, C.; Wade, J.B.; Robles, C.; Thacker, L.R.; Flud, C.; Fagan, A.; Garcia-Saenz-de-Sicilia, M.; et al. Minimal Hepatic Encephalopathy and Mild Cognitive Impairment Worsen Quality of Life in Elderly Patients with Cirrhosis. Clin. Gastroenterol. Hepatol. 2020, 18, 3008–3016.e2. [Google Scholar] [CrossRef]
- Cheng, L.; Wang, X.; Ma, X.; Xu, H.; Yang, Y.; Zhang, D. Effect of Dihydromyricetin on Hepatic Encephalopathy Associated with Acute Hepatic Failure in Mice. Pharm. Biol. 2021, 59, 557–564. [Google Scholar] [CrossRef]
- Zhao, F.; Wang, Y.X.; Yuan, J.; Deng, M.; Wong, H.L.; Chu, E.S.; Go, M.Y.; Teng, G.J.; Ahuja, A.T.; Yu, J. Mr T1rho as an Imaging Biomarker for Monitoring Liver Injury Progression and Regression: An Experimental Study in Rats with Carbon Tetrachloride Intoxication. Eur. Radiol. 2012, 22, 1709–1716. [Google Scholar] [CrossRef]
- Wang, Y.X.J.; Chen, W.; Deng, M. How Liver Pathologies Contribute to T1rho Contrast Require More Careful Studies. Quant. Imaging Med. Surg. 2017, 7, 608–613. [Google Scholar] [CrossRef] [Green Version]
- Xie, S.; Li, Q.; Cheng, Y.; Zhang, Y.; Zhuo, Z.; Zhao, G.; Shen, W. Impact of Liver Fibrosis and Fatty Liver on T1rho Measurements: A Prospective Study. Korean J. Radiol. 2017, 18, 898–905. [Google Scholar] [CrossRef]
- Zhang, H.; Yang, Q.; Yu, T.; Chen, X.; Huang, J.; Tan, C.; Liang, B.; Guo, H. Comparison of T2, T1rho, and Diffusion Metrics in Assessment of Liver Fibrosis in Rats. J. Magn. Reason. Imaging 2017, 45, 741–750. [Google Scholar] [CrossRef]
- Farjam, M.; Dehdab, P.; Abbassnia, F.; Mehrabani, D.; Tanideh, N.; Pakbaz, S.; Imanieh, M.H. Thioacetamide-Induced Acute Hepatic Encephalopathy in Rat: Behavioral, Biochemical and Histological Changes. Iran. Red. Crescent Med. J. 2012, 14, 164–170. [Google Scholar]
- Yang, M.C.; Chang, C.P.; Lei, H.Y. Induction of Liver Fibrosis in a Murine Hepatoma Model by Thioacetamide Is Associated with Enhanced Tumor Growth and Suppressed Antitumor Immunity. Lab. Invest. 2010, 90, 1782–1793. [Google Scholar] [CrossRef]
- Mohammadi, H.; Sayad, A.; Mohammadi, M.; Niknahad, H.; Heidari, R. N-Acetyl Cysteine Treatment Preserves Mitochondrial Indices of Functionality in the Brain of Hyperammonemic Mice. Clin. Exp. Hepatol. 2020, 6, 106–115. [Google Scholar] [CrossRef]
- Hajtman, A.; Neuschl, R.; Zucha, J.; Reznak, I. Blood Gas Levels and the Acid-Base Equilibrium in Patients before and after Treatment of Decreased Patency of the Nasal Cavity. Cesk. Otolaryngol. 1987, 36, 281–285. [Google Scholar]


| Treatment | AST (IU/L) | ALT (IU/L) | ALP (IU/L) | T-BIL (mg/dL) |
|---|---|---|---|---|
| Control | 90.2 ± 11.4 | 33.2 ± 7.1 | 1347.8 ± 123.9 | 0.01 ± 0.00 |
| 300 mg/kg TAA Inj Day 3 | 675.8 ± 217.8 *** | 393.5 ± 119.4 *** | 2014.5 ± 191.0 *** | 0.08 ± 0.02 *** |
| 300 mg/kg TAA Inj Day 10 | 96.5 ± 7.5 | 47.0 ± 6.2 | 962.50 ± 46.9 * | 0.02 ± 0.01 |
| 400 mg/kg TAA Inj Day 3 | 550.0 ± 237.8 *** | 191.3 ± 82.4 ** | 1642.0 ± 355.1 | 0.09 ± 0.03 *** |
| 400 mg/kg TAA Inj Day 10 | 112.5 ± 24.8 | 43.2 ± 7.6 | 1149.8 ± 85.5 | 0.02 ± 0.01 |
Publisher’s Note: MDPI stays neutral with regard to jurisdictional claims in published maps and institutional affiliations. |
© 2022 by the authors. Licensee MDPI, Basel, Switzerland. This article is an open access article distributed under the terms and conditions of the Creative Commons Attribution (CC BY) license (https://creativecommons.org/licenses/by/4.0/).
Share and Cite
Saito, S.; Arihara, N.; Sawaya, R.; Morimoto-Ishikawa, D.; Ueda, J. Metabolites Alterations and Liver Injury in Hepatic Encephalopathy Models Evaluated by Use of 7T-MRI. Metabolites 2022, 12, 396. https://doi.org/10.3390/metabo12050396
Saito S, Arihara N, Sawaya R, Morimoto-Ishikawa D, Ueda J. Metabolites Alterations and Liver Injury in Hepatic Encephalopathy Models Evaluated by Use of 7T-MRI. Metabolites. 2022; 12(5):396. https://doi.org/10.3390/metabo12050396
Chicago/Turabian StyleSaito, Shigeyoshi, Narumi Arihara, Reika Sawaya, Daisuke Morimoto-Ishikawa, and Junpei Ueda. 2022. "Metabolites Alterations and Liver Injury in Hepatic Encephalopathy Models Evaluated by Use of 7T-MRI" Metabolites 12, no. 5: 396. https://doi.org/10.3390/metabo12050396
APA StyleSaito, S., Arihara, N., Sawaya, R., Morimoto-Ishikawa, D., & Ueda, J. (2022). Metabolites Alterations and Liver Injury in Hepatic Encephalopathy Models Evaluated by Use of 7T-MRI. Metabolites, 12(5), 396. https://doi.org/10.3390/metabo12050396