
Hordatines and Associated Precursors Dominate Metabolite Profiles of Barley (Hordeum vulgare L.) Seedlings: A Metabolomics Study of Five Cultivars

 , ,
, ,  and
and 
Abstract
1. Introduction
2. Results and Discussion
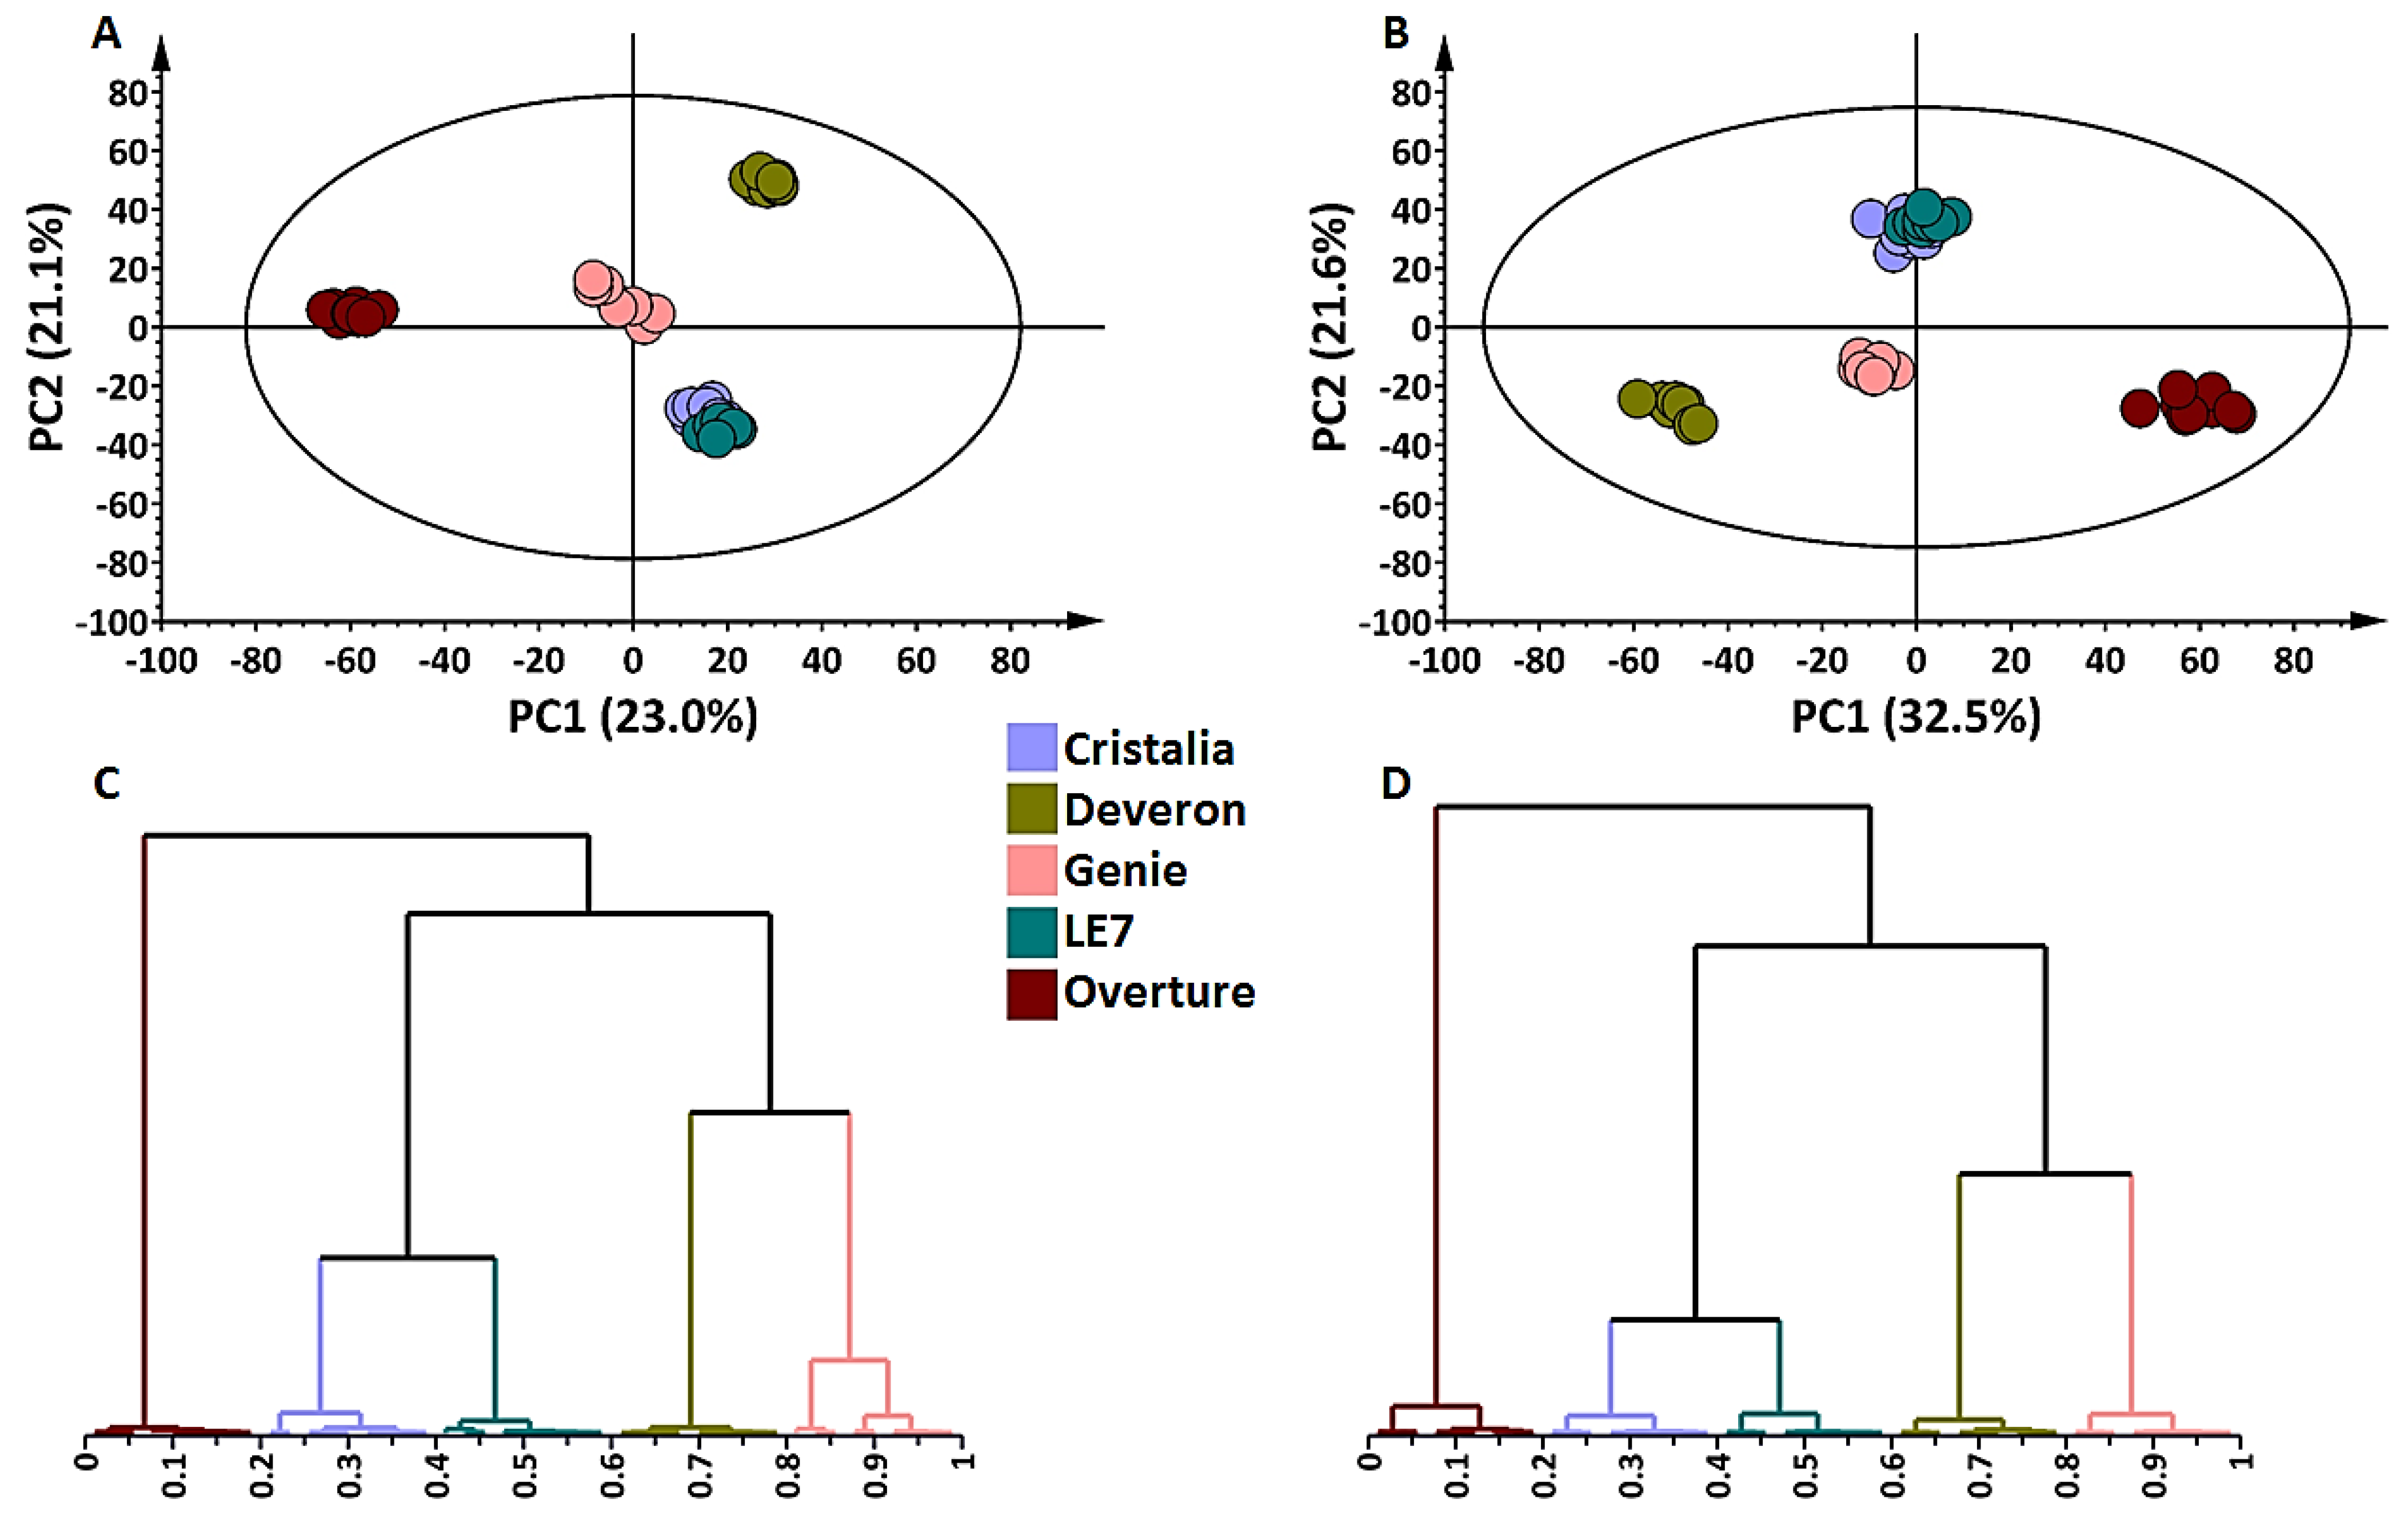
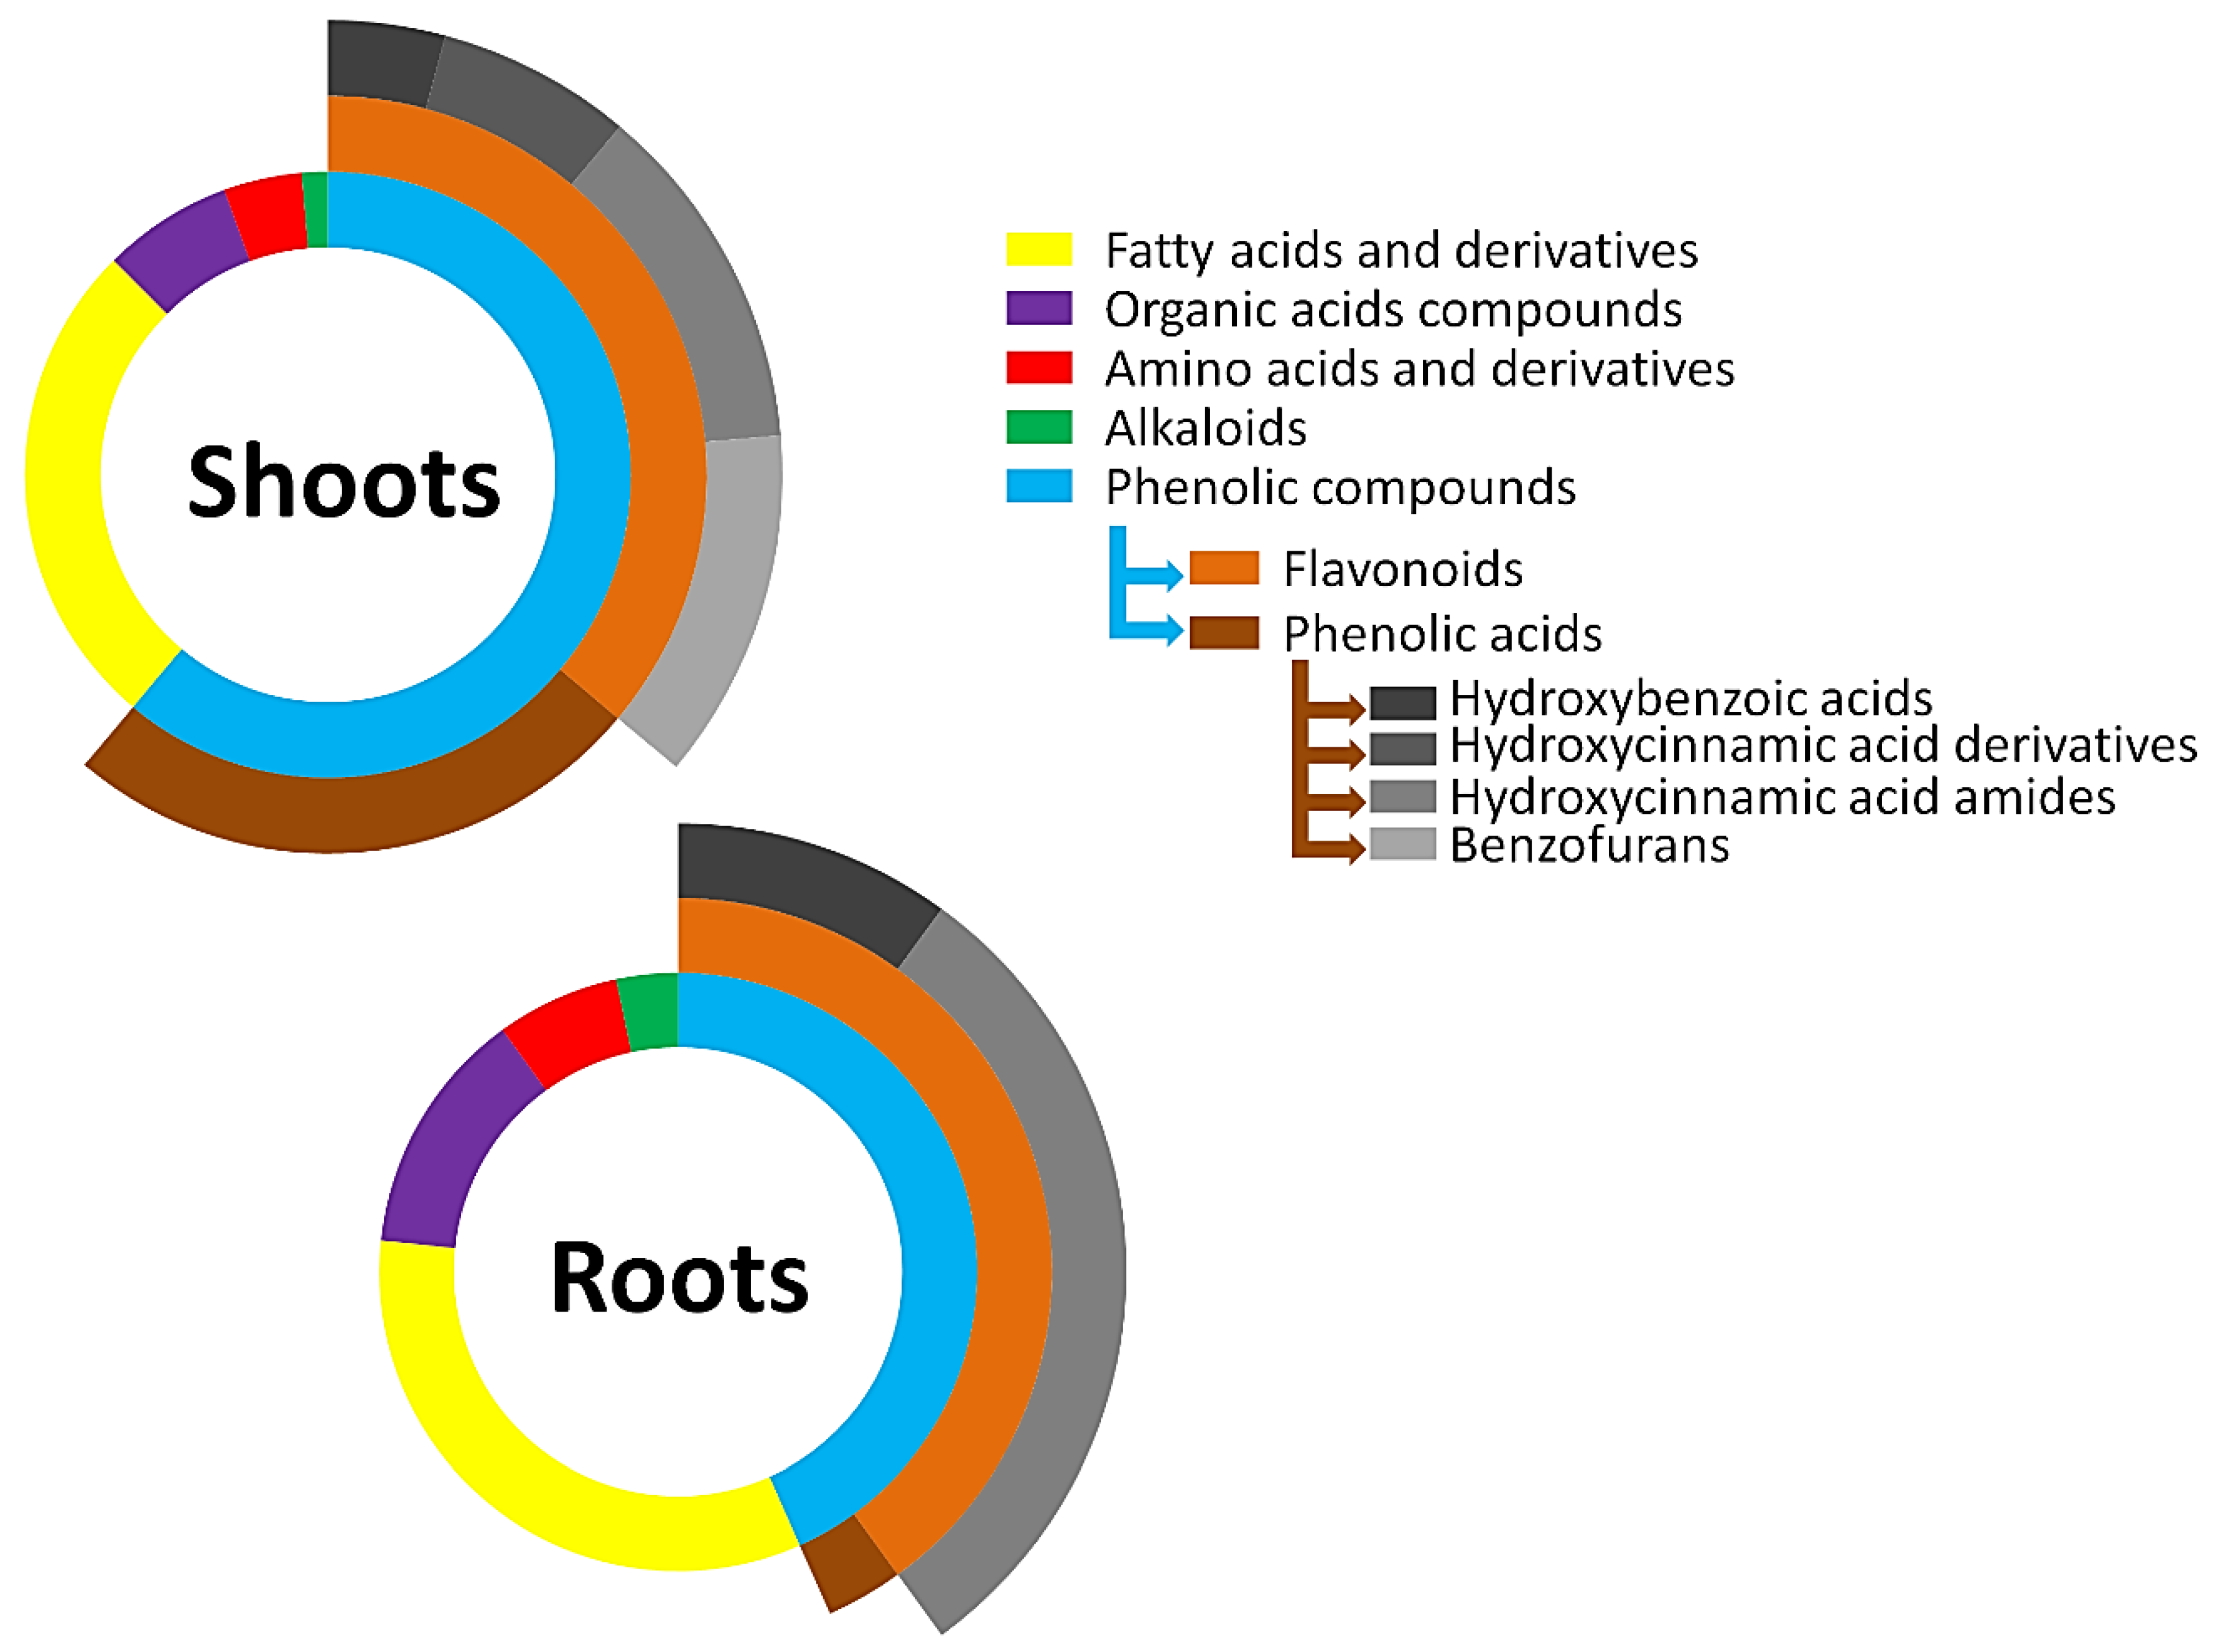
2.1. Metabolite Profiling of Barley Shoot and Root Tissues
2.1.1. Phenolic Compounds: Phenolic Acids and Derivatives and Flavonoids
2.1.2. Fatty Acids and Derivatives
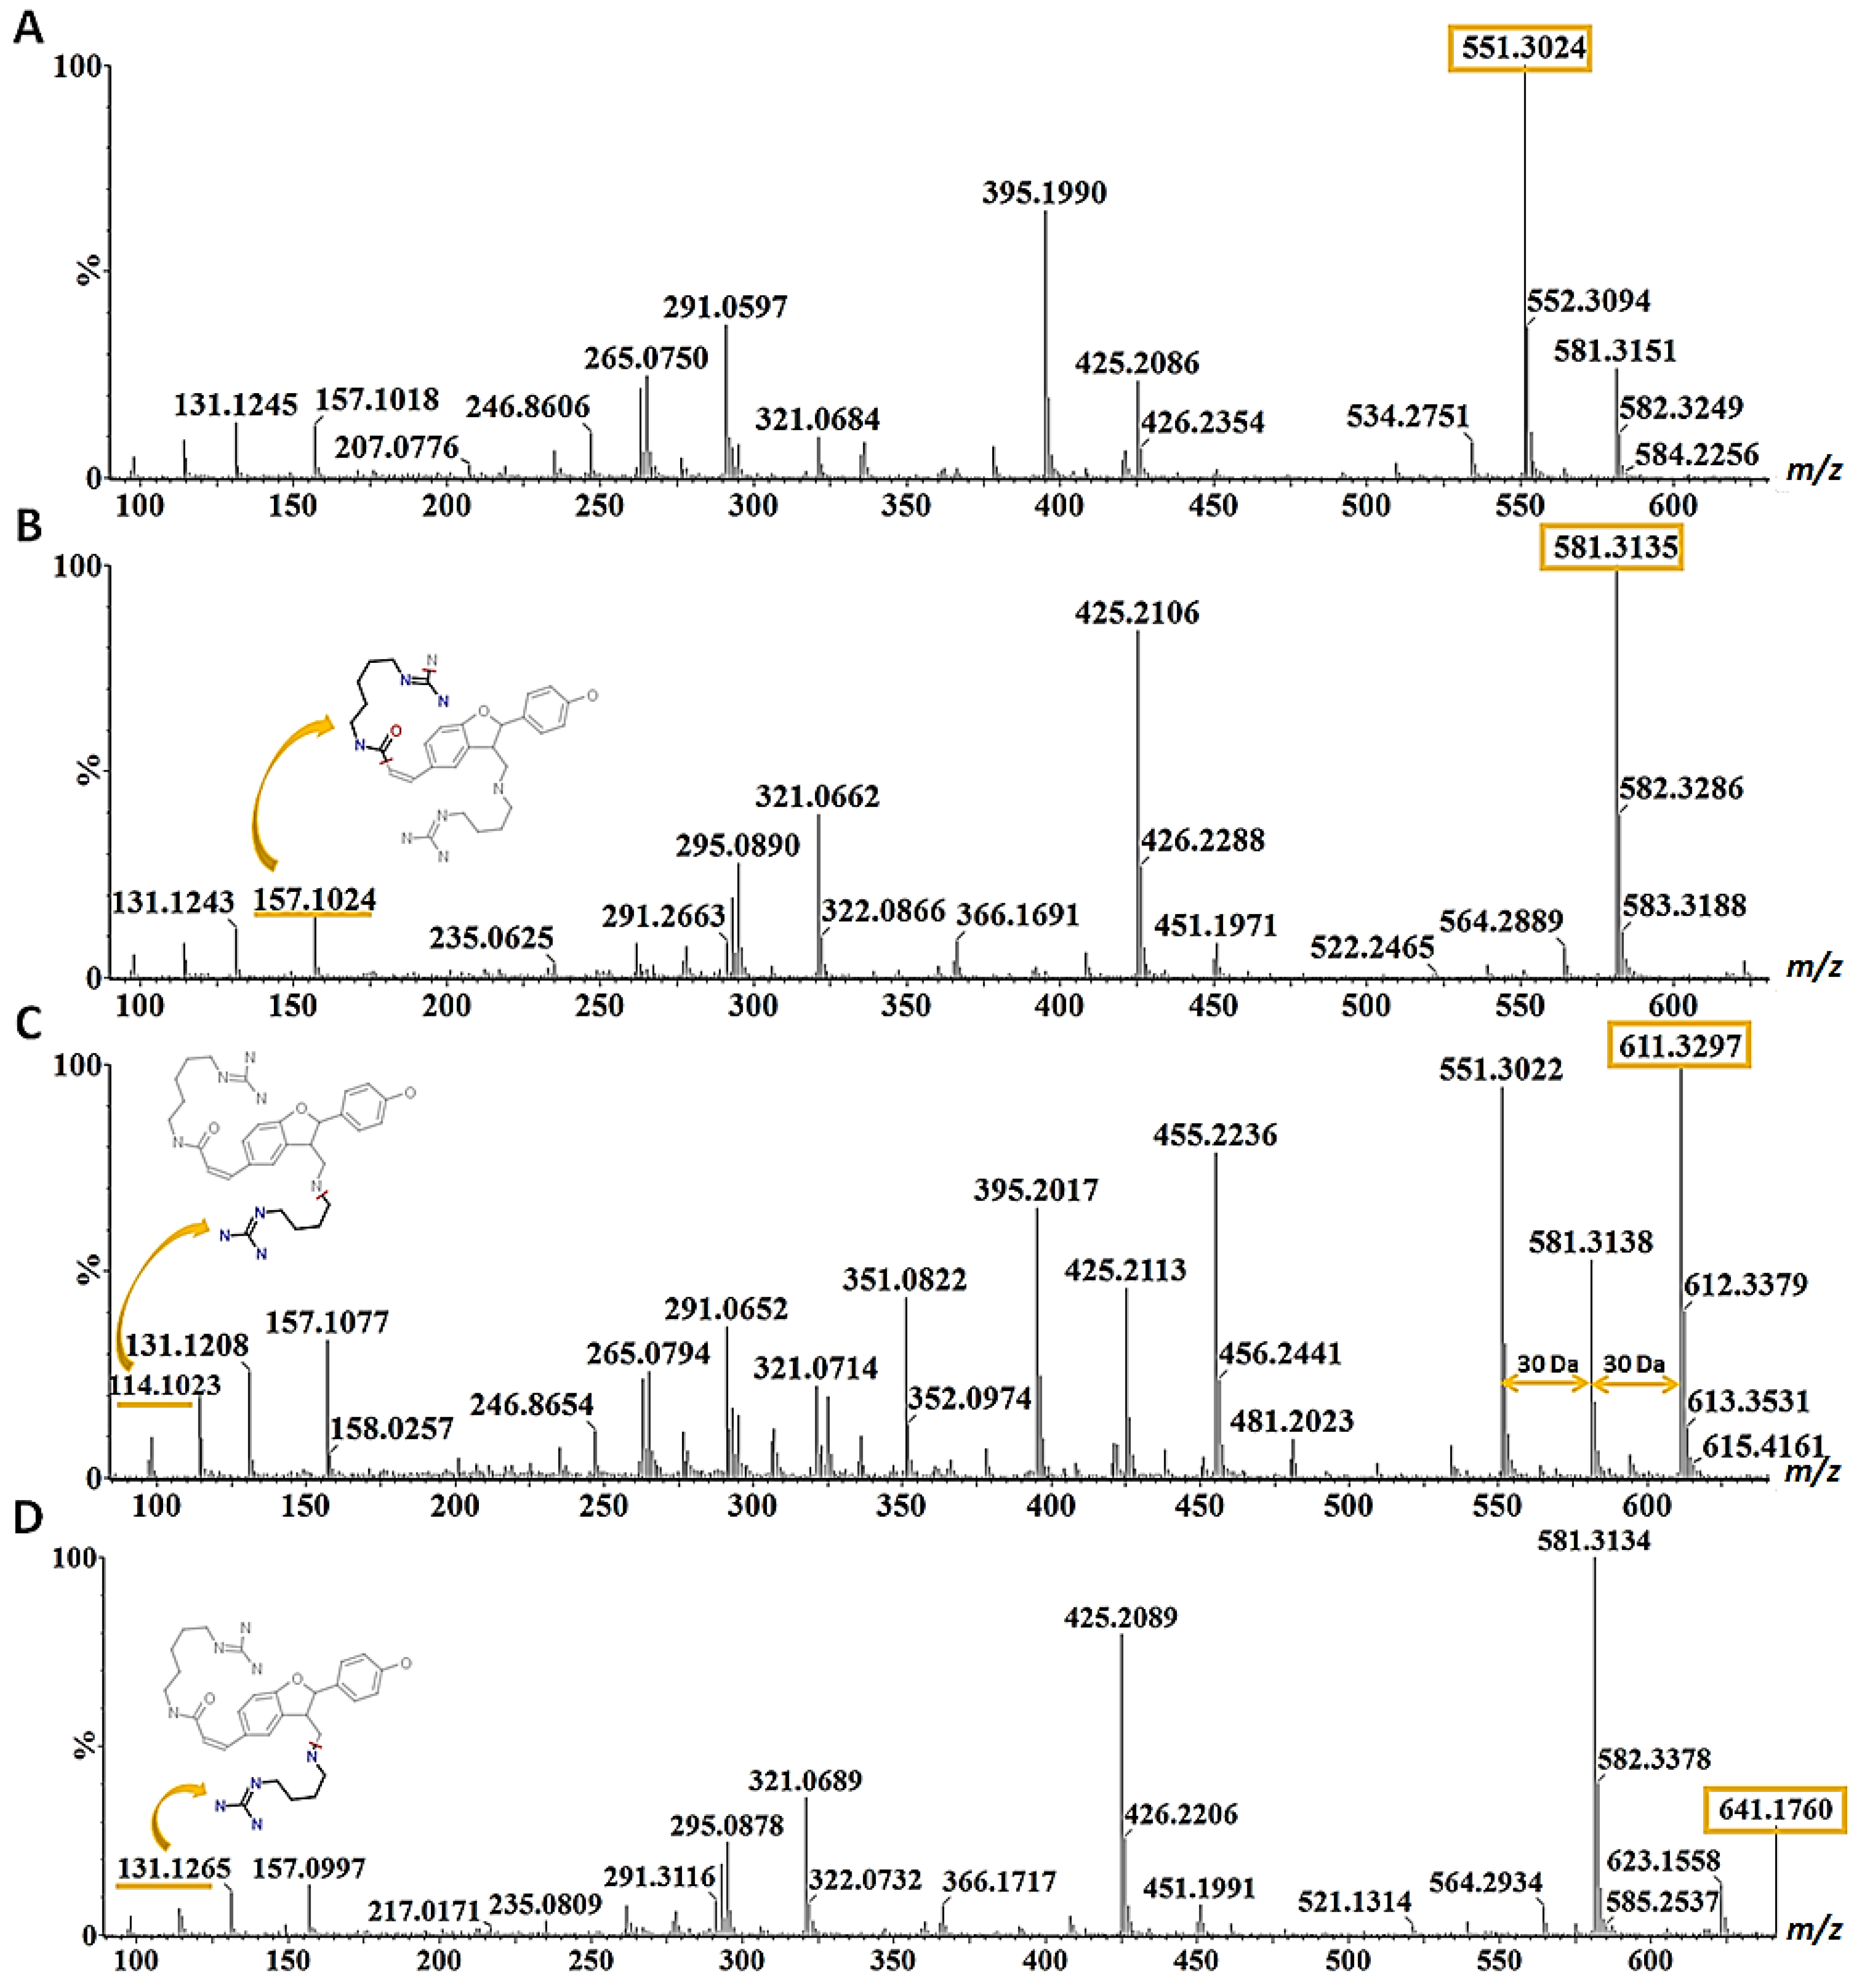
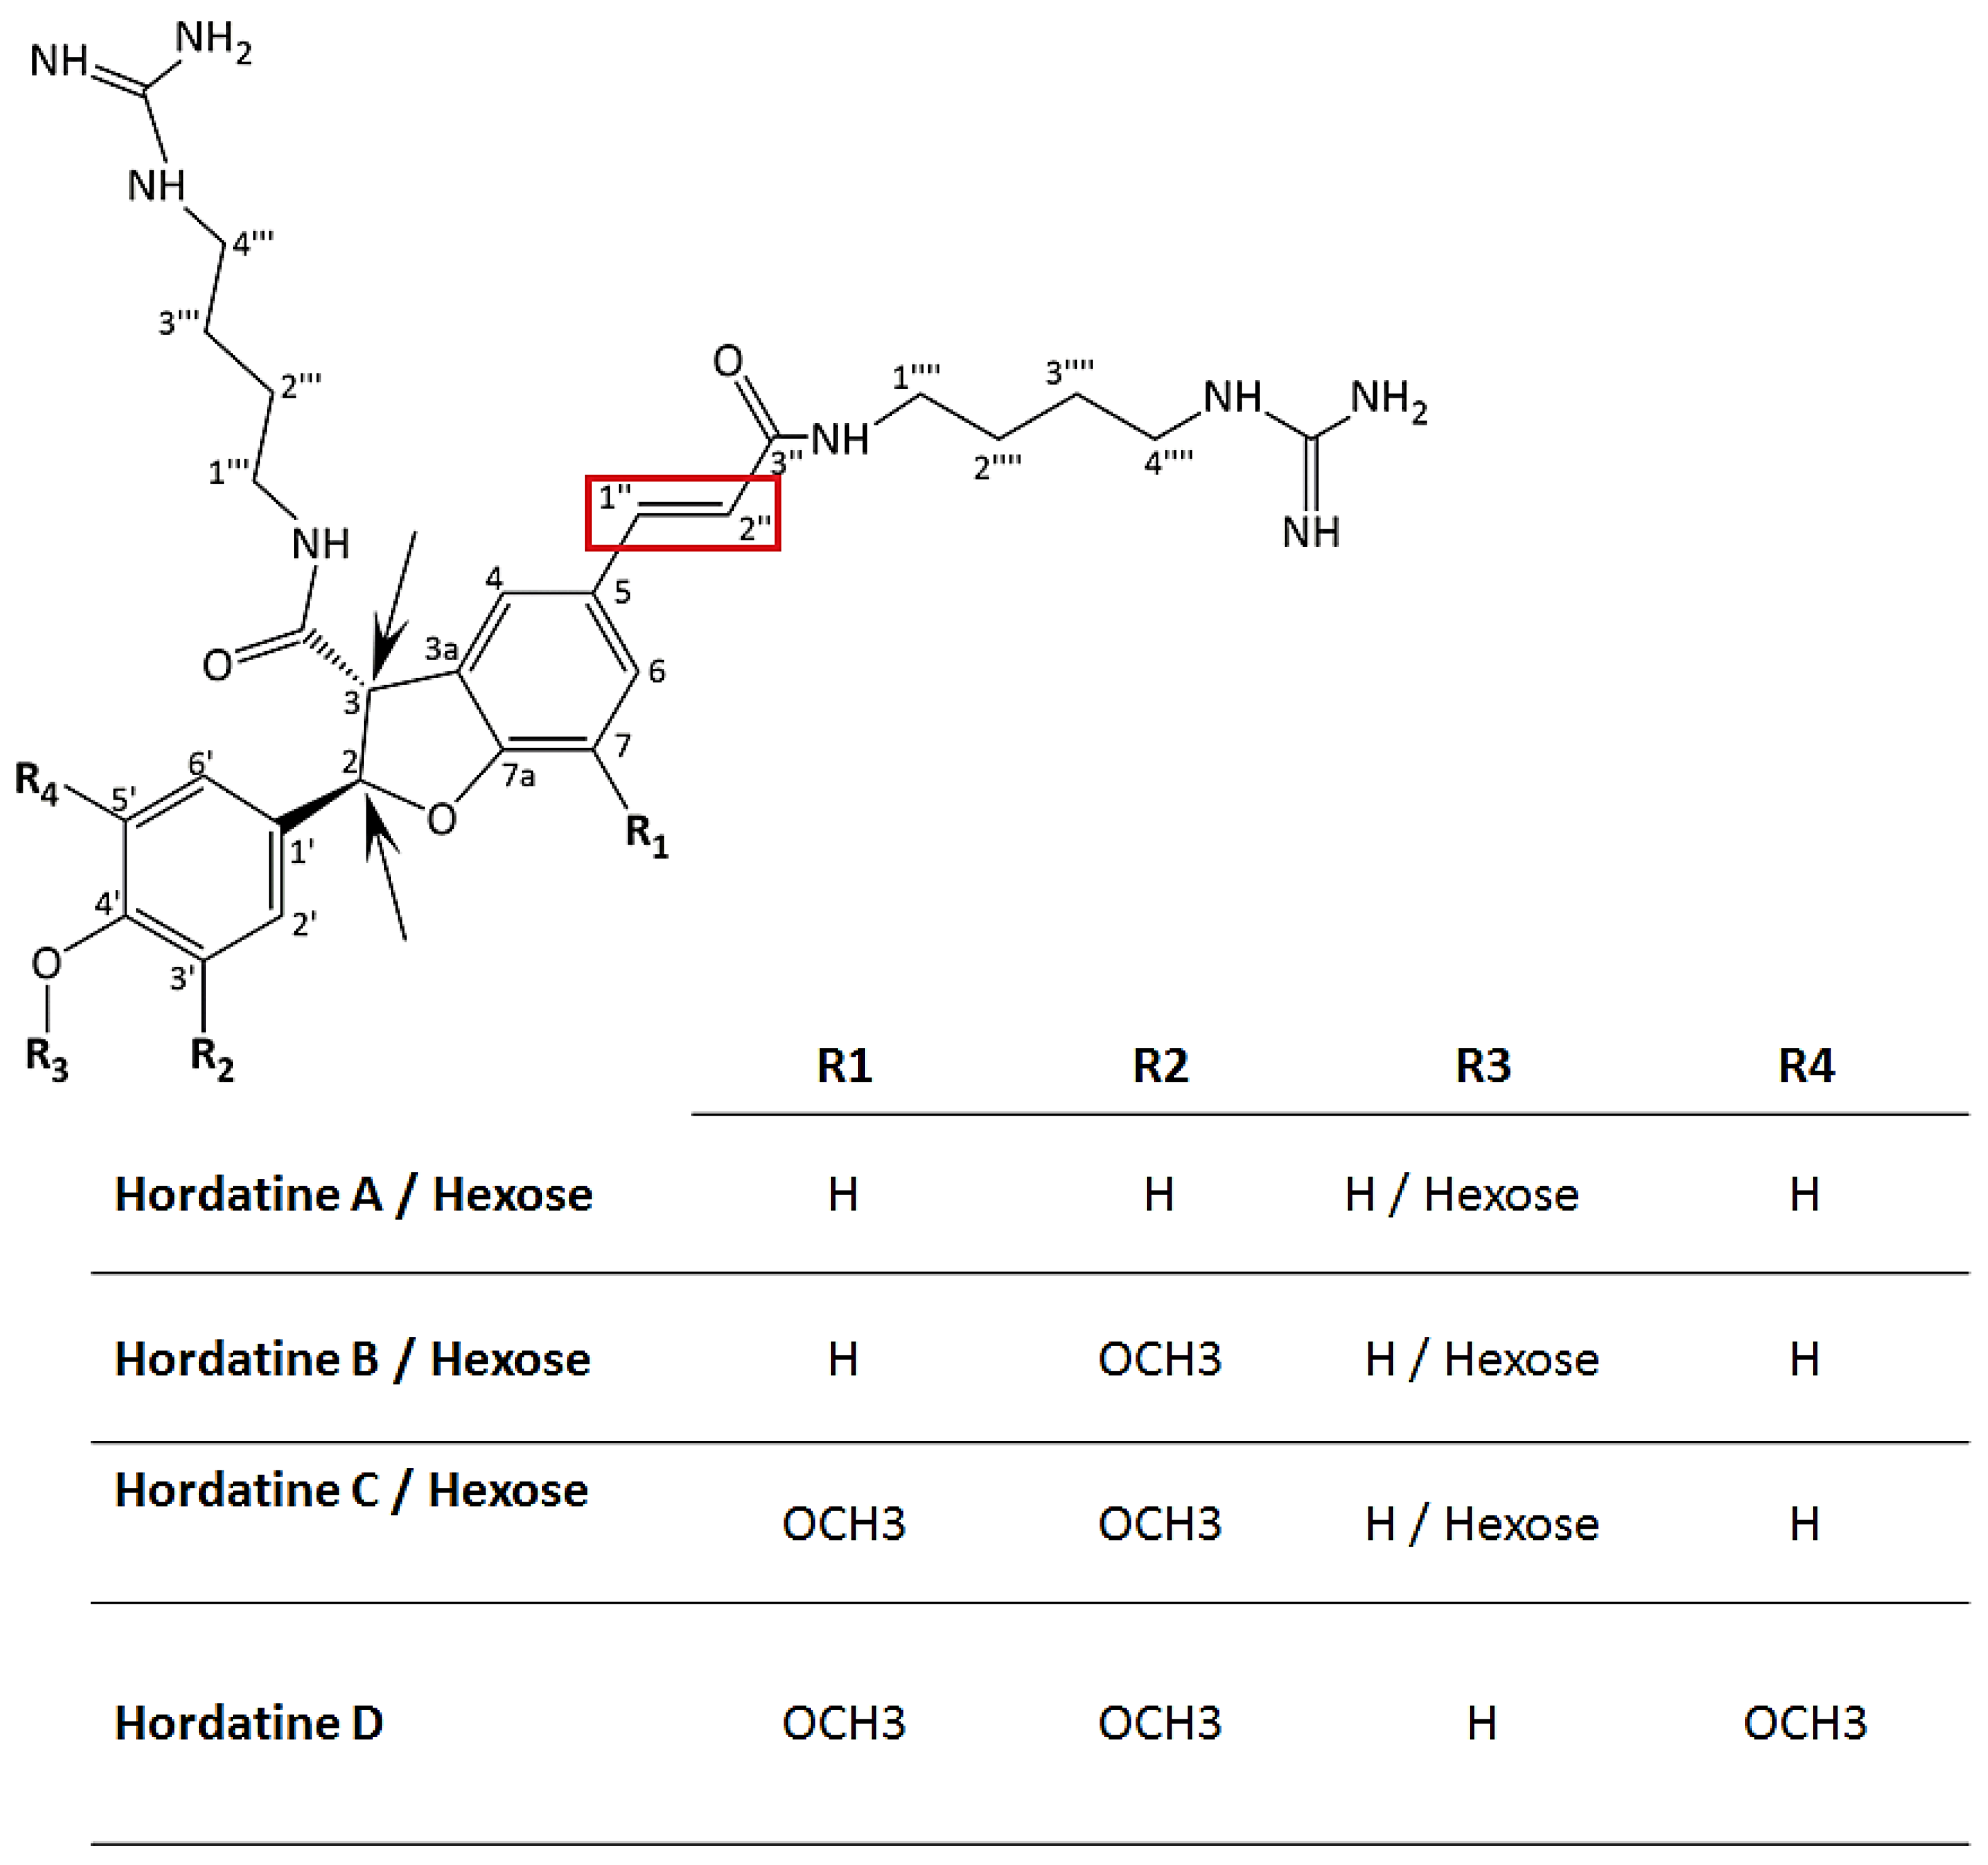
2.1.3. Organic Acids, Amino Acids and Alkaloids
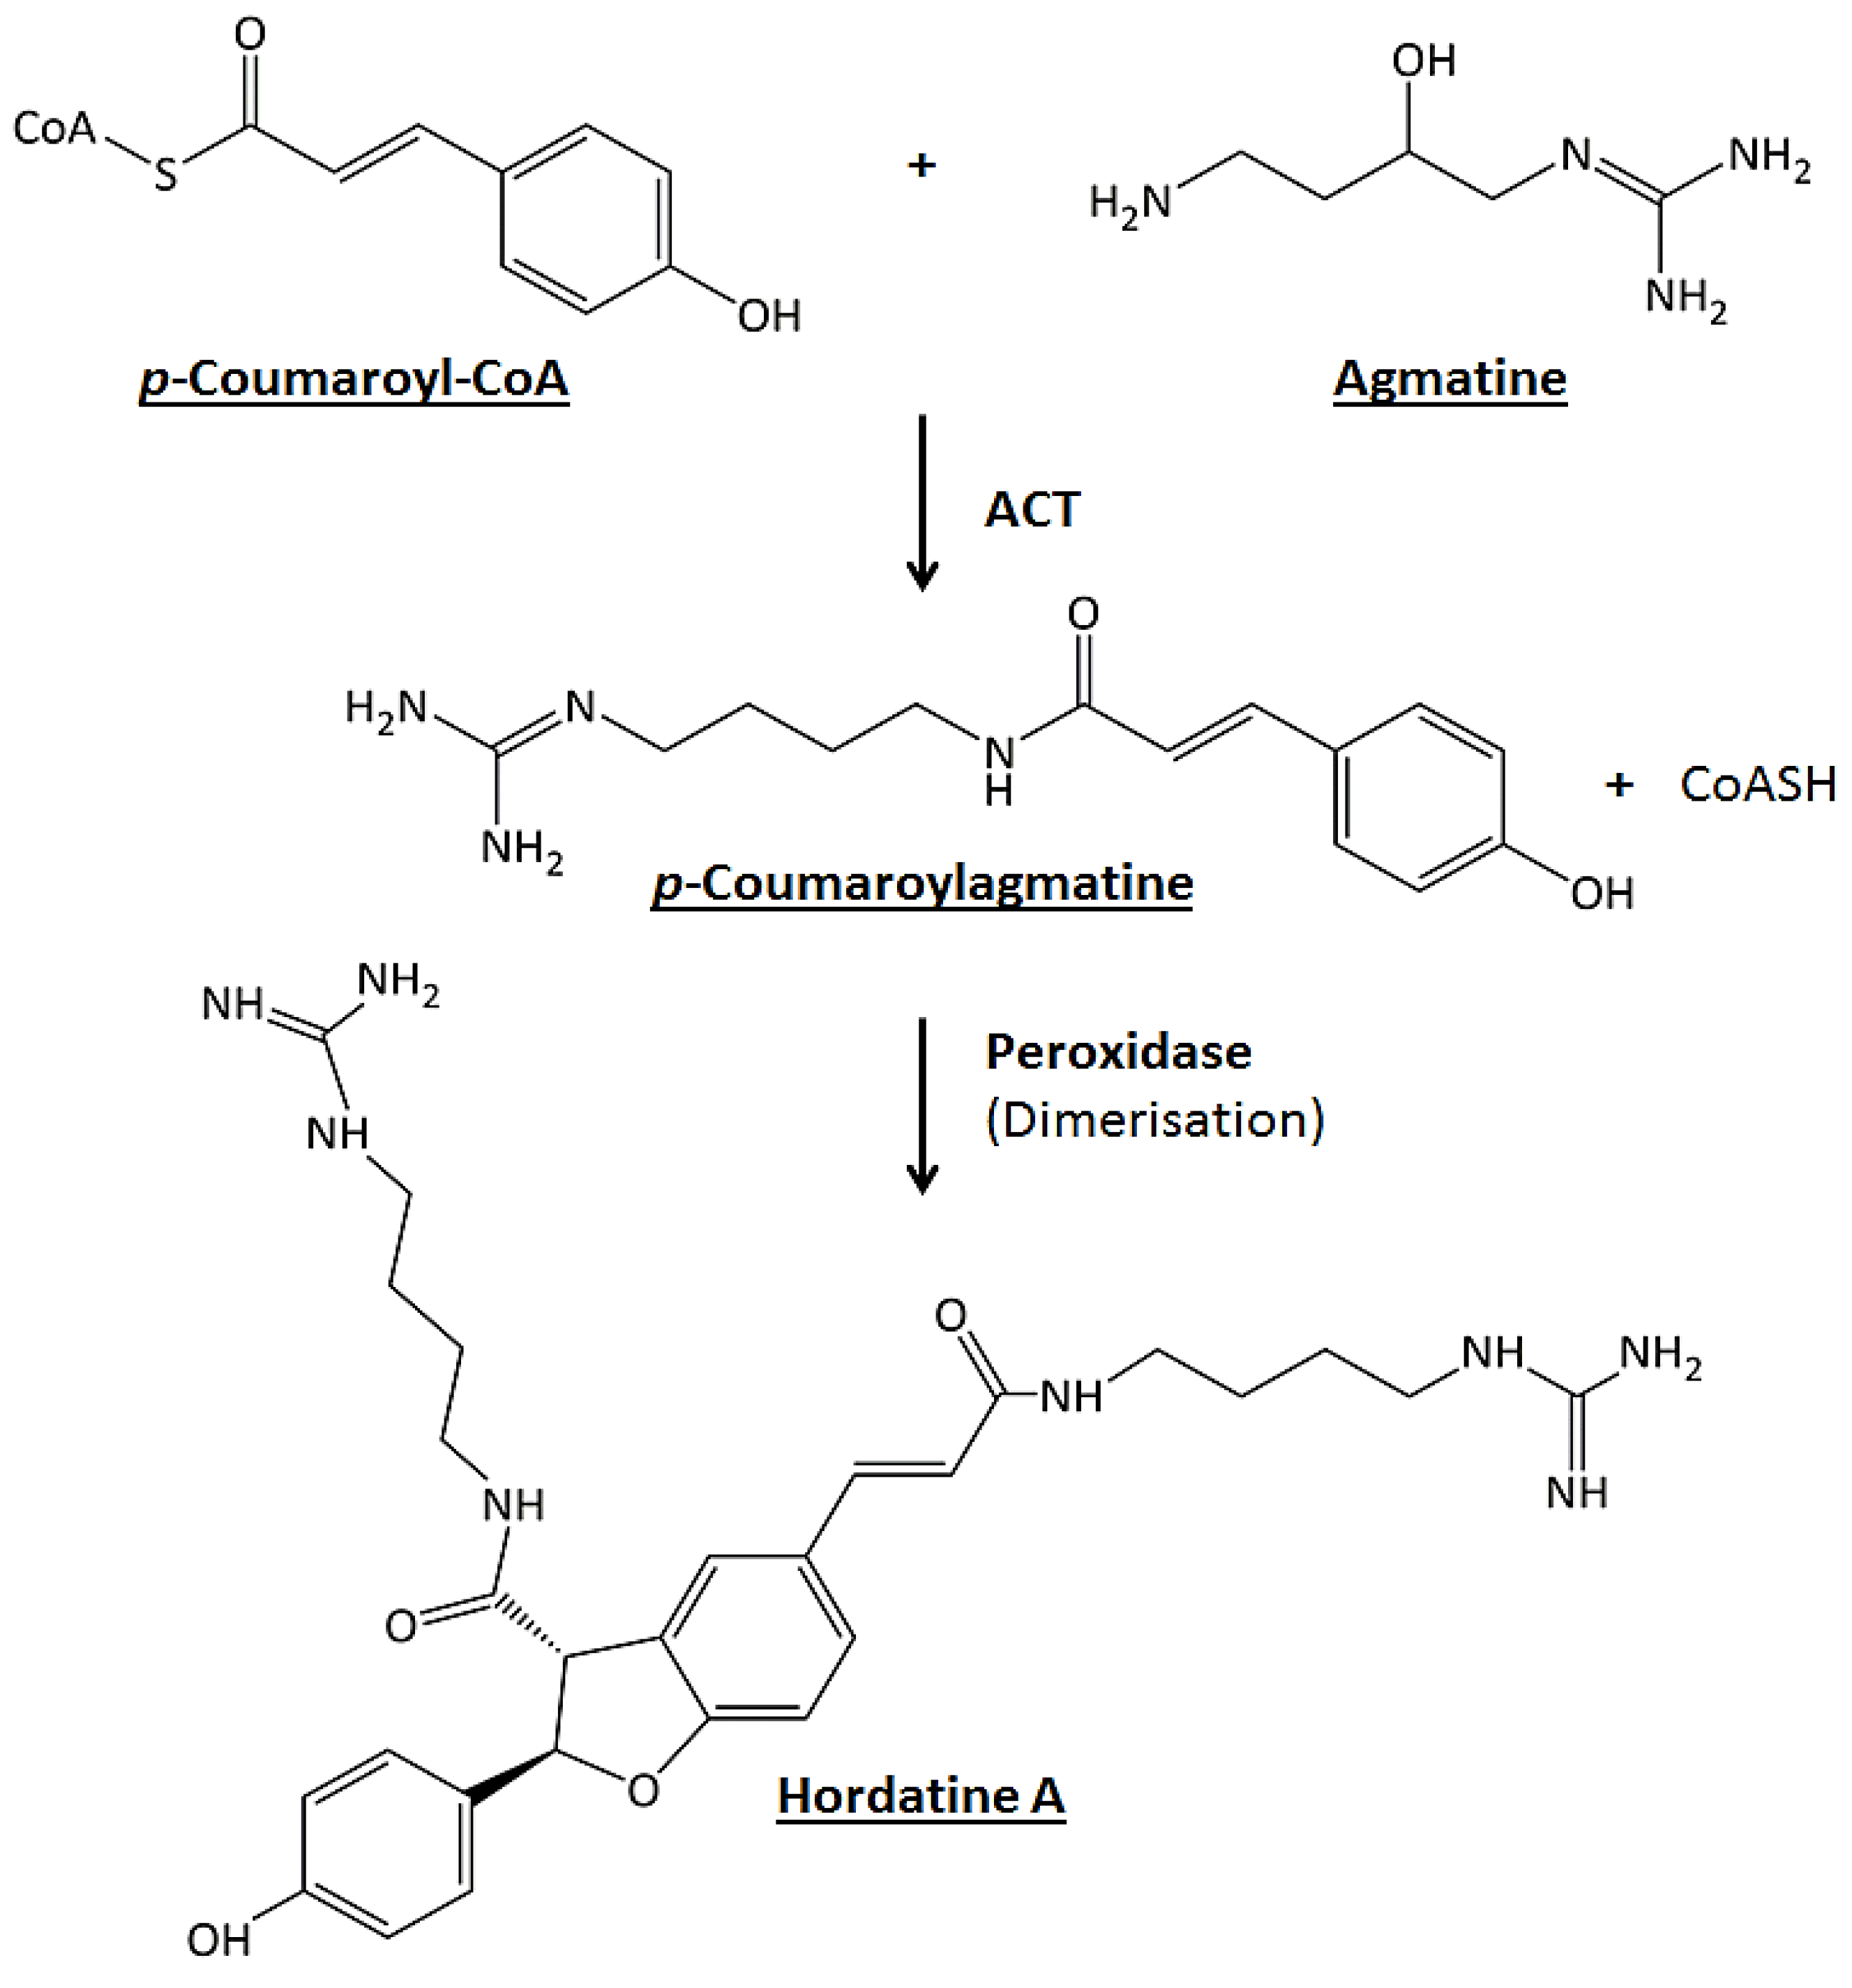
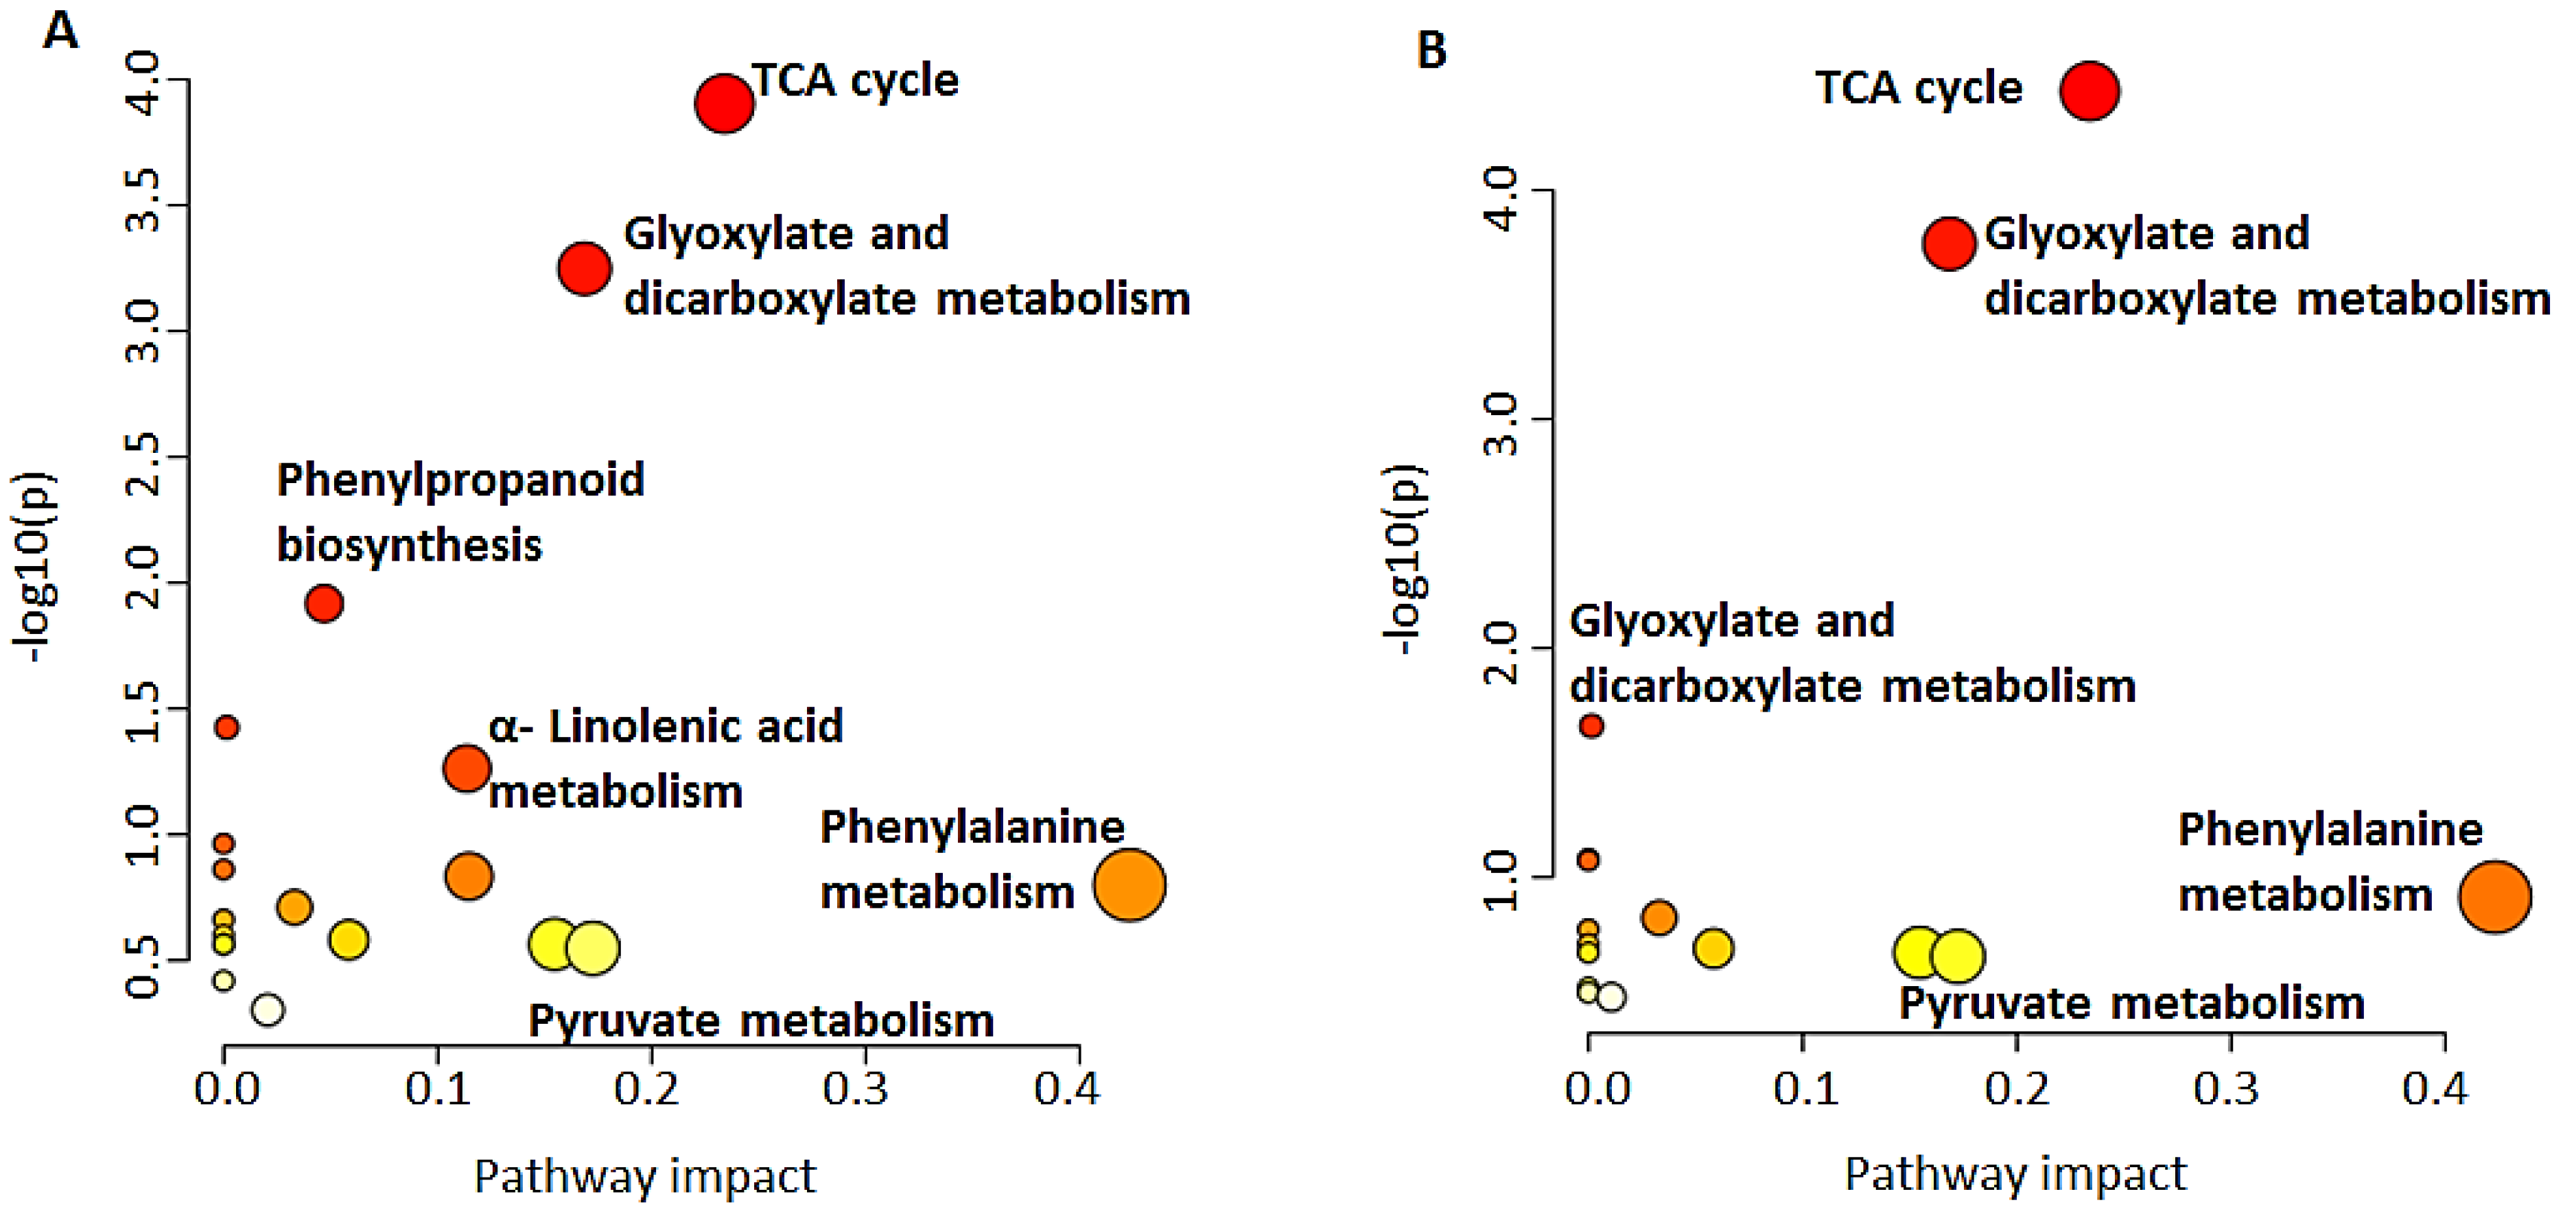
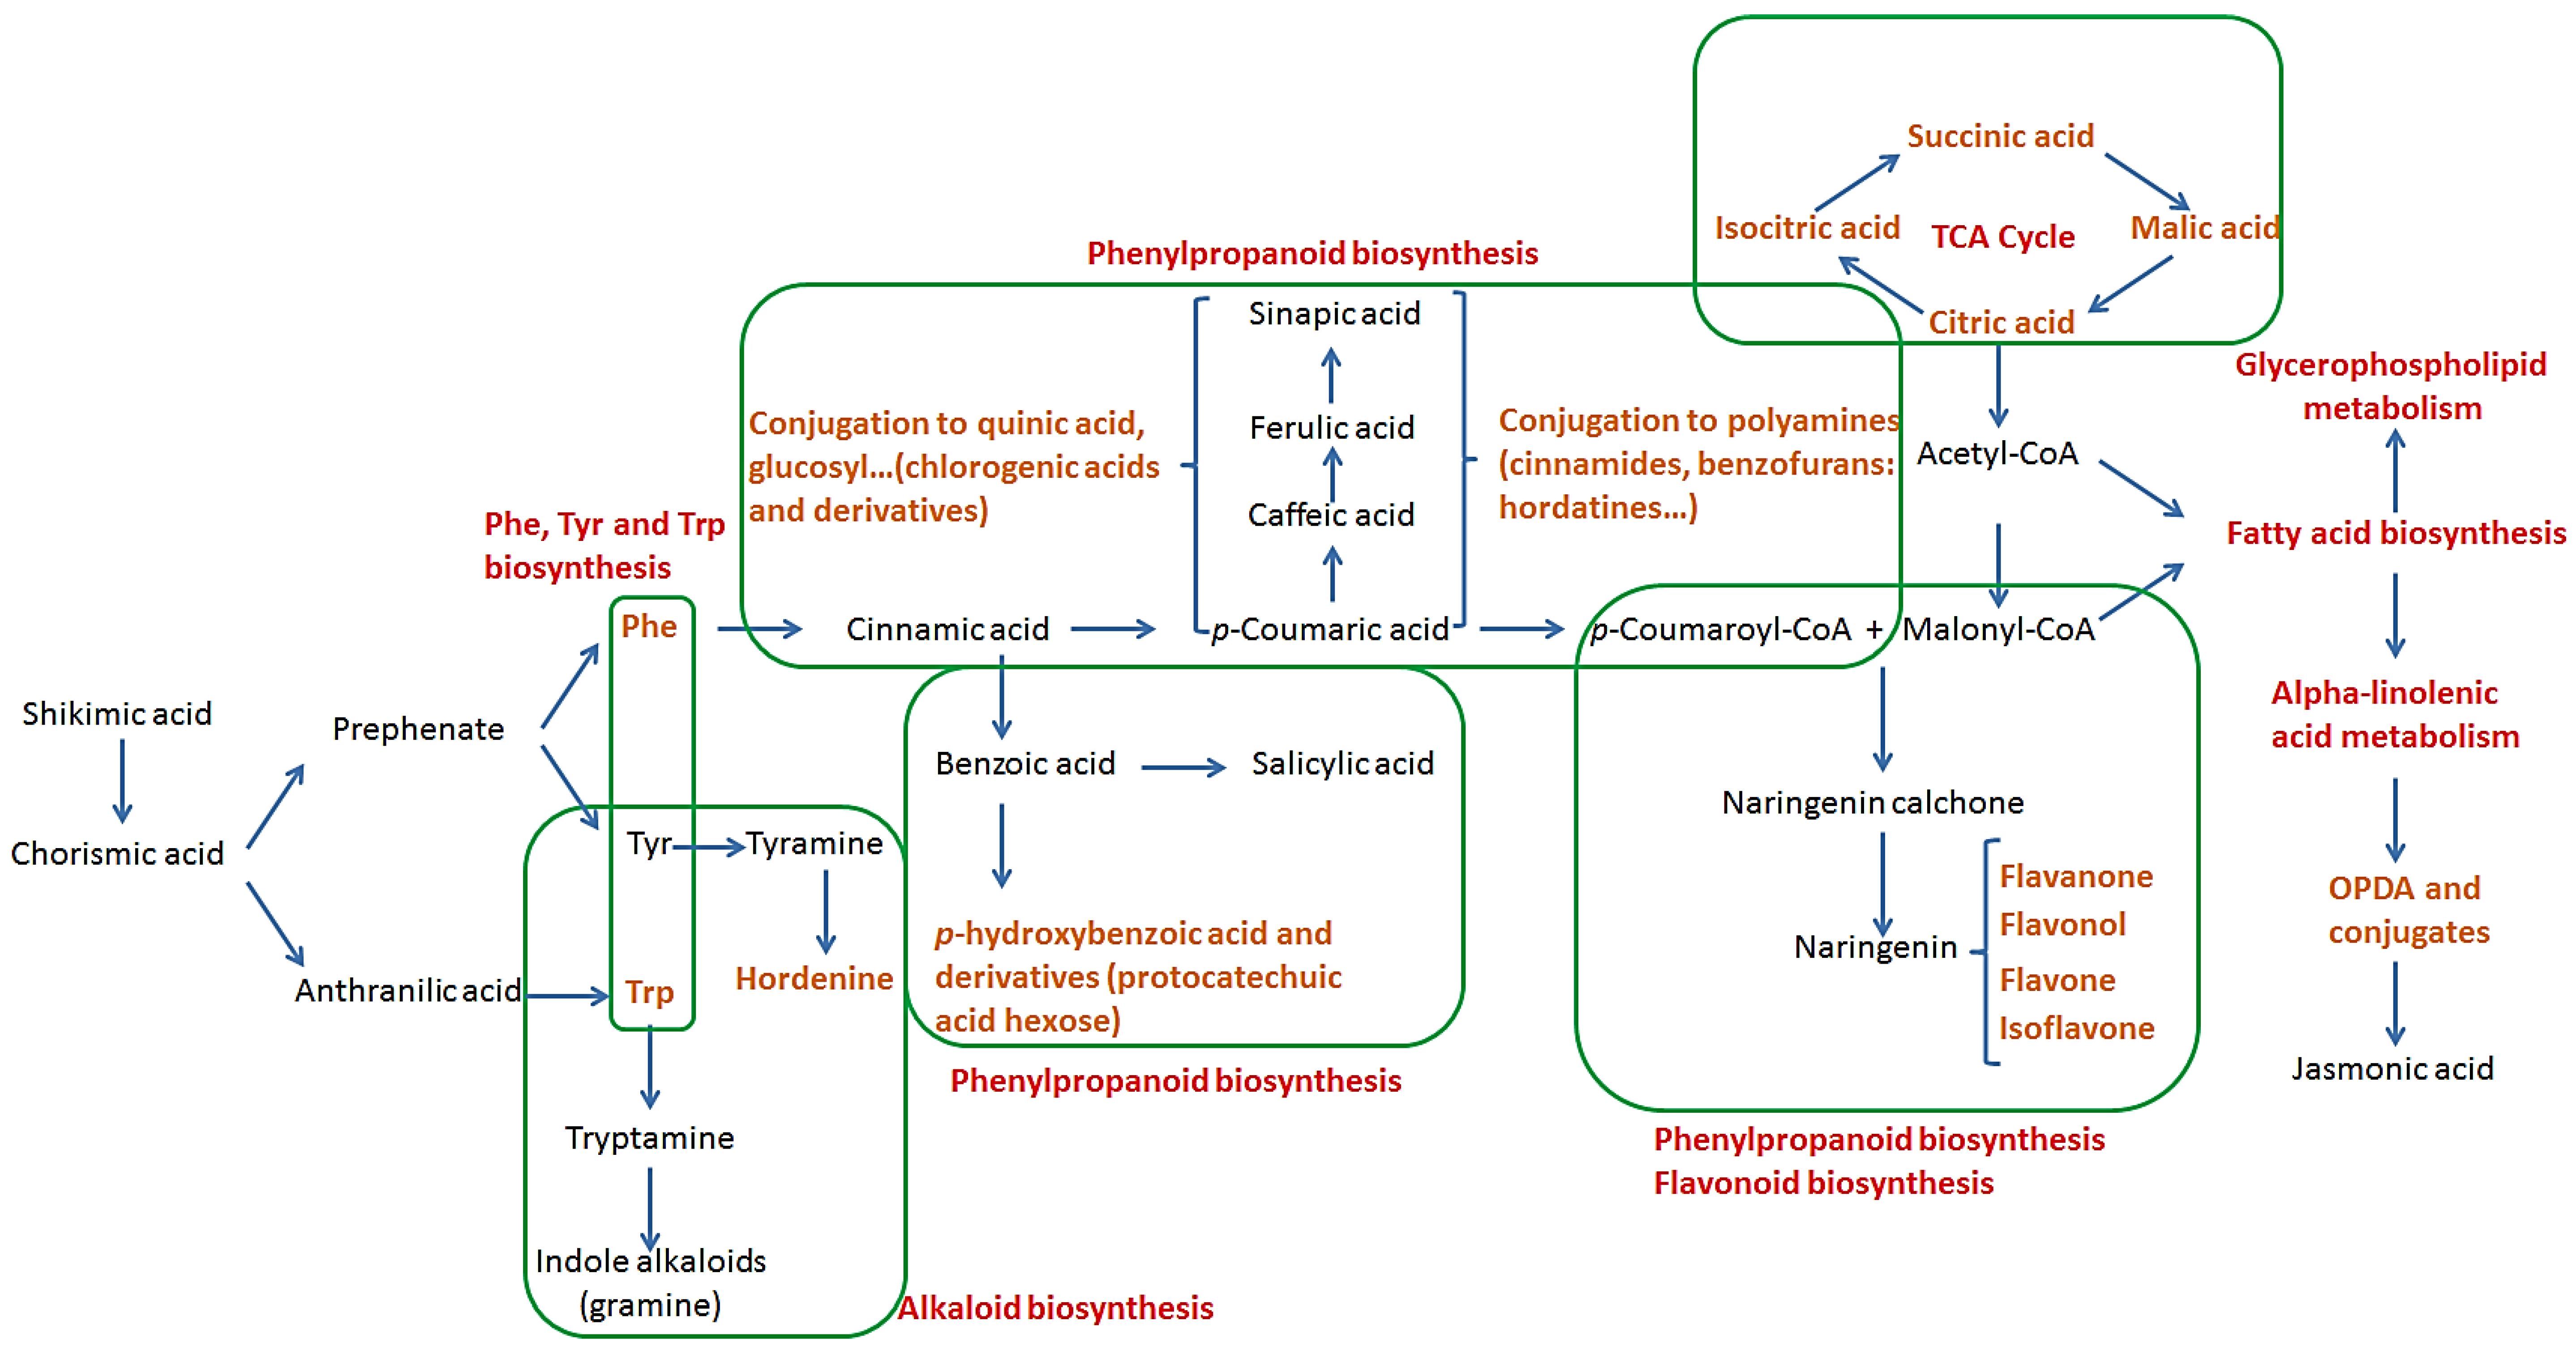
2.2. Pathways Involved in the Biosynthesis of Annotated Metabolites
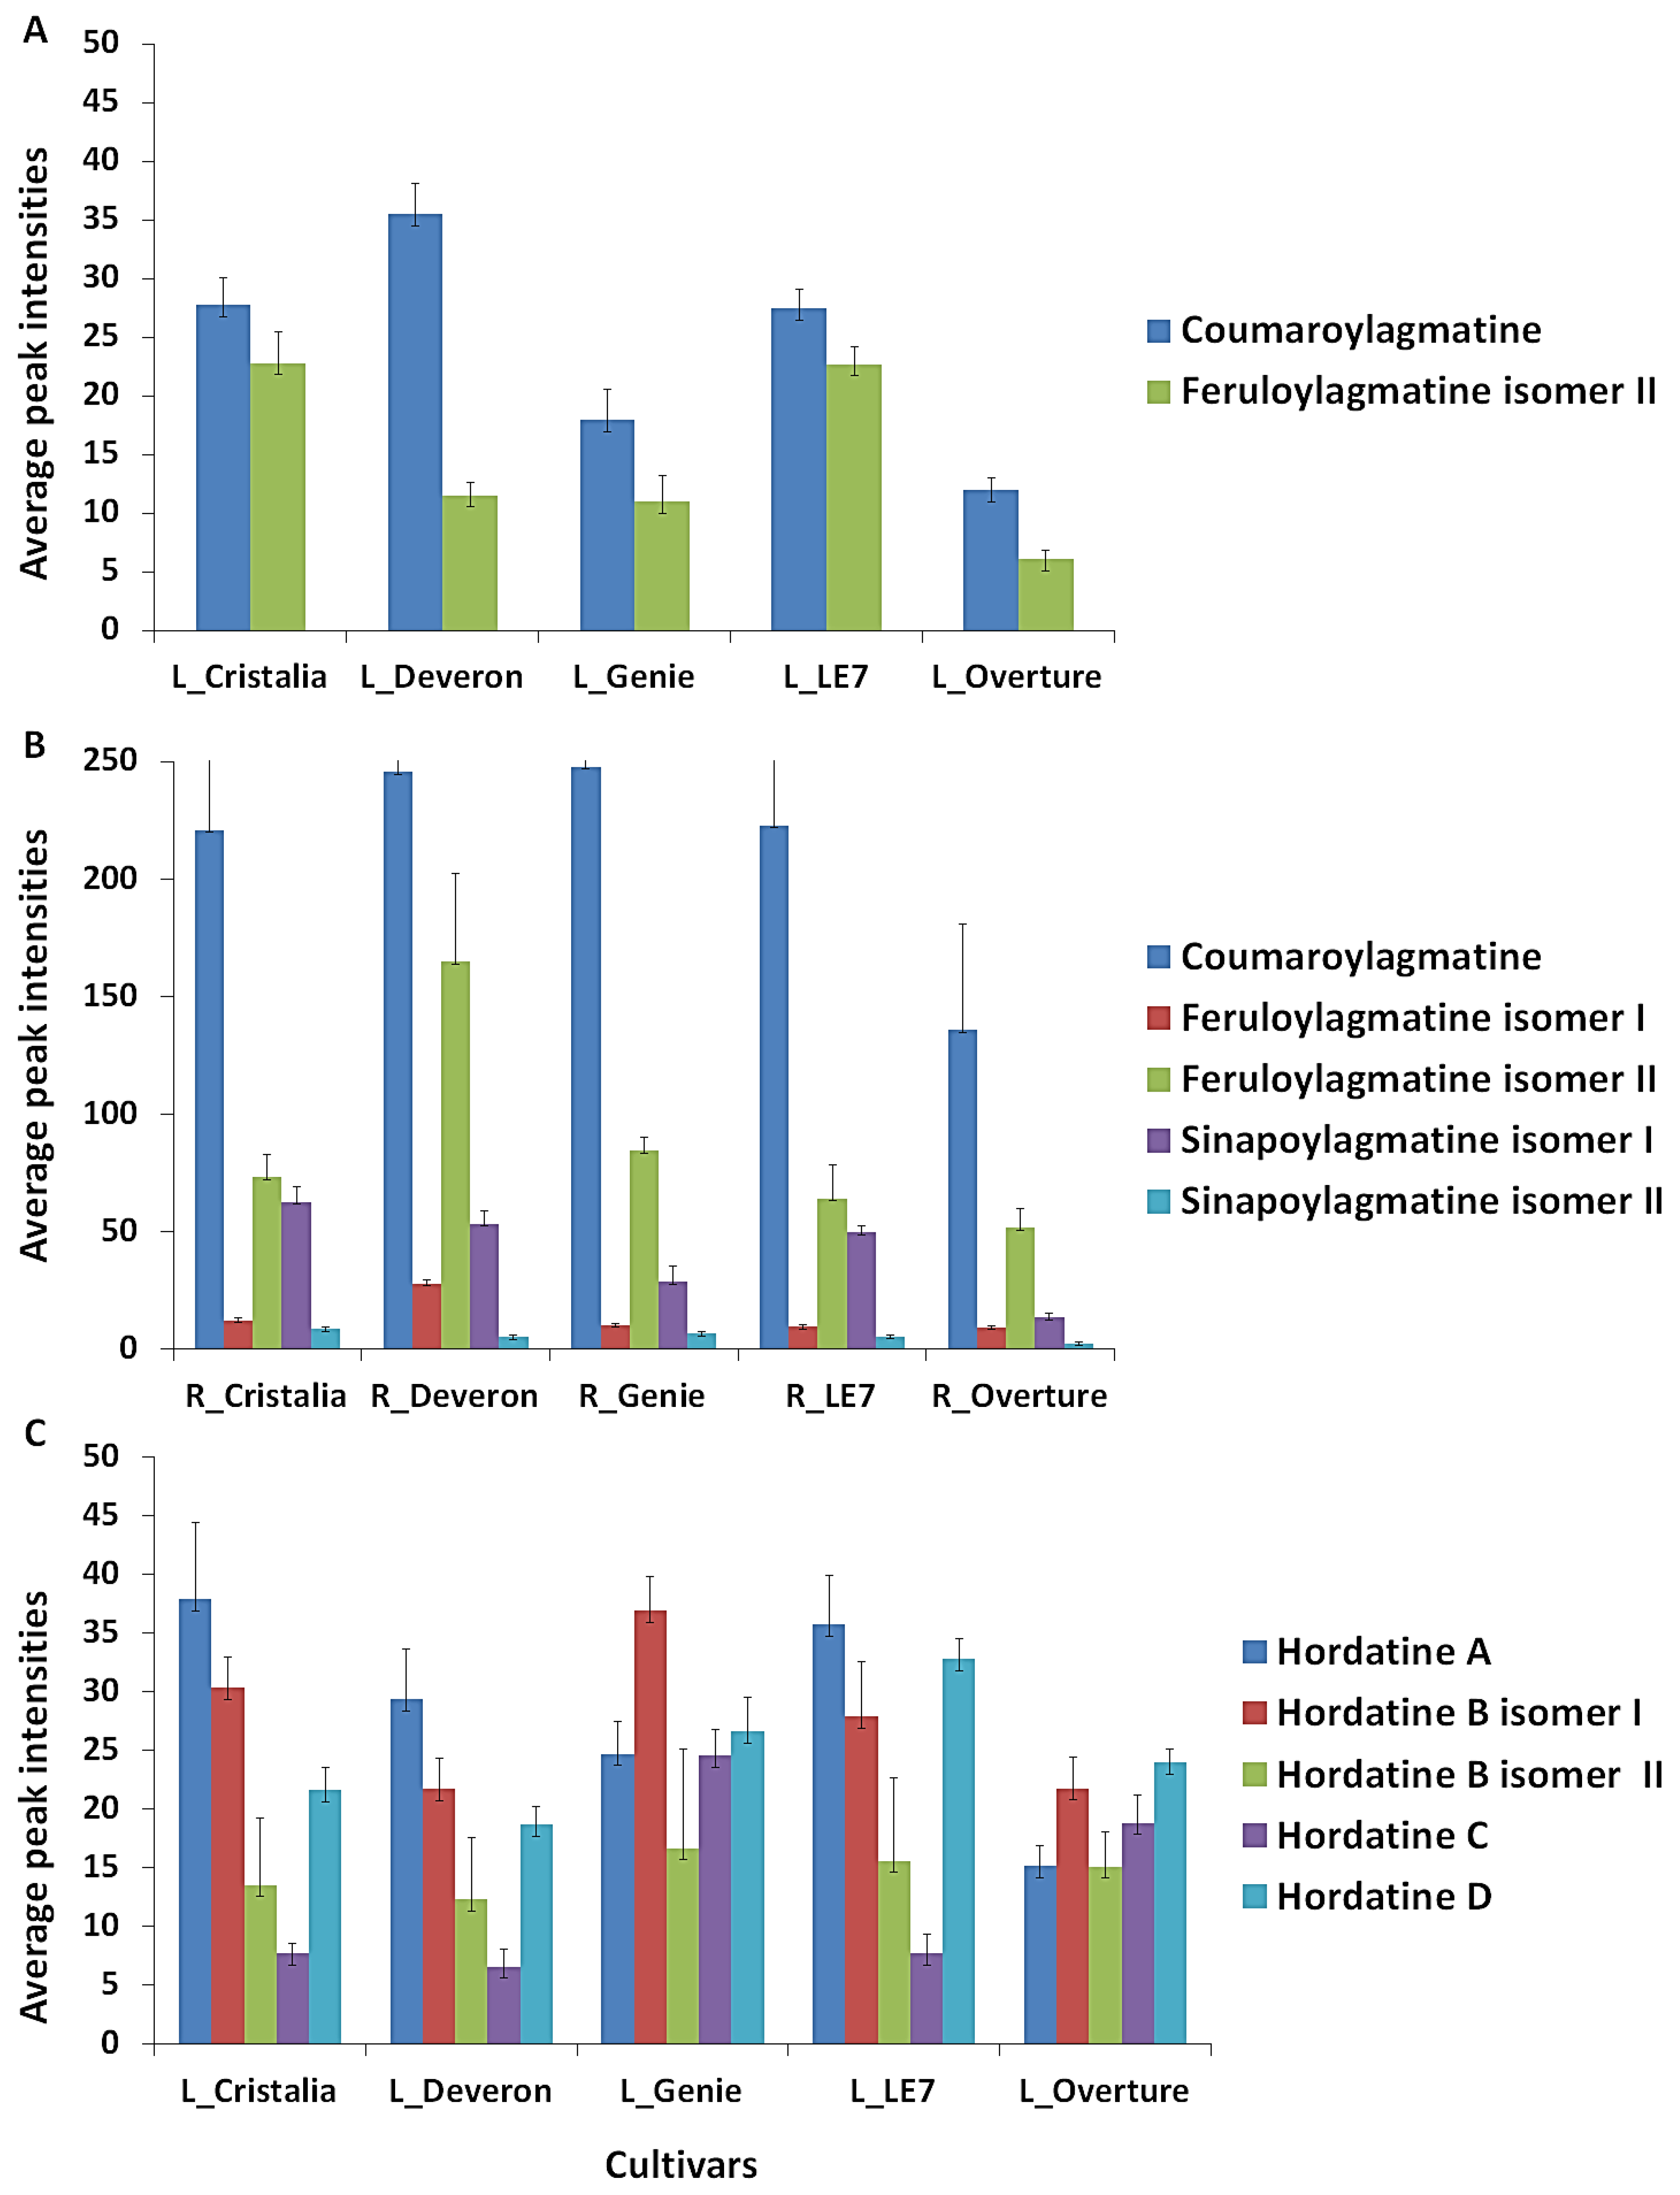
2.3. Metabolite Class Distribution and Roles: Contribution of Barley Hordatines and Biosynthetic Precursors
3. Materials and Methods
3.1. Barley Plant Material and Cultivation
3.2. Metabolite Extraction and Sample Preparation
3.3. Ultra-High Performance Liquid Chromatography (UHPLC)
3.4. High-Definition Mass Spectrometry
3.5. Data Pre-Processing, Multivariate Data Analyses and Statistical Modeling
3.6. Metabolite Annotation
3.7. Metabolomics Pathway Analysis
4. Conclusions
Supplementary Materials
Author Contributions
Funding
Institutional Review Board Statement
Informed Consent Statement
Data Availability Statement
Acknowledgments
Conflicts of Interest
References
- Pourkheirandish, M.; Komatsuda, T. The importance of barley genetics and domestication in a global perspective. Ann. Bot. 2007, 100, 999–1008. [Google Scholar] [CrossRef] [PubMed]
- Holopainen-Mantila, U. Composition and structure of barley (Hordeum vulgare L.) grain in relation to end uses. Academic dissertation, University of Helsinki, Finland. VTT Sci. 2015, 1–108. [Google Scholar]
- Angessa, T.T.; Li, C. Exploration and utilization of genetic diversity exotic germplasm for barley improvement. In Exploration, Identification and Utilization of Barley Germplasm, 1st ed.; Zhang, G., Li, C., Eds.; Elsevier Inc.: Amsterdam, The Netherlands; Academic Press: Cambridge, MA, USA, 2016; pp. 223–240, Chapter 9. [Google Scholar]
- Dai, F.; Zhang, G. Domestication and improvement of cultivated barley. In Exploration, Identification and Utilization of Barley Germplasm, 1st ed.; Zhang, G., Li, C., Eds.; Academic Press: Cambridge, MA, USA, 2016; pp. 1–26, Chapter 1. [Google Scholar]
- Grando, S.; Macpherson, H.S. (Eds.) Food Barley: Importance, Uses and Local Knowledge; ICARDA: Aleppo, Syria, 2005; pp. 1–156. [Google Scholar]
- Idehen, E.; Tang, Y.; Sang, S. Bioactive phytochemicals in barley. J. Food Drug Anal. 2017, 25, 148–161. [Google Scholar] [CrossRef] [PubMed]
- Langridge, P. Economic and academic importance of barley. In The Barley Genome; Stein, N., Muehlbauer, G., Eds.; Springer: Cham, Switzerland, 2018; pp. 1–10. [Google Scholar] [CrossRef]
- Panhwar, R.B.; Akbar, A.; Ali, M.F.; Yang, Q.; Feng, B. Phytochemical components of some minor cereals associated with diabetes prevention and management. J. Biosci. Med. 2018, 6, 9. [Google Scholar] [CrossRef]
- Roumani, M.; Besseau, S.; Gagneul, D.; Robin, C.; Larbat, R. Phenolamides in plants: An update on their function, regulation, and origin of their biosynthetic enzymes. J. Exp. Bot. 2021, 72, 2334–2355. [Google Scholar] [CrossRef]
- Zeiss, D.R.; Piater, L.A.; Dubery, I.A. Hydroxycinnamate amides: An intriguing combination of plant protective metabolites. Trends Plant Sci. 2021, 26, 184. [Google Scholar] [CrossRef]
- Dong, X.; Gao, Y.; Chen, W.; Wang, W.; Gong, L.; Liu, X.; Luo, J. Spatiotemporal distribution of phenolamides and the genetics of natural variation of hydroxycinnamoyl spermidine in rice. Mol. Plant. 2015, 8, 111–121. [Google Scholar] [CrossRef]
- Onkokesung, N.; Gaquerel, E.; Kotkar, H.; Kaur, H.; Baldwin, I.T.; Galis, I. MYB8 controls inducible phenolamide levels by activating three novel hydroxycinnamoyl-coenzyme A: Polyamine transferases in Nicotiana attenuata. Plant Physiol. 2012, 158, 389–407. [Google Scholar] [CrossRef]
- Hamany Djande, C.Y.; Pretorius, C.; Tugizimana, F.; Piater, L.A.; Dubery, I.A. Metabolomics: A tool for cultivar phenotyping and investigation of grain crops. Agronomy 2020, 10, 831. [Google Scholar] [CrossRef]
- Hamany Djande, C.Y.; Piater, L.A.; Steenkamp, P.A.; Tugizimana, F.; Dubery, I.A. A metabolomics approach and chemometric tools for differentiation of barley cultivars and biomarker discovery. Metabolites 2021, 11, 578. [Google Scholar] [CrossRef]
- Burhenne, K.; Kristensen, B.K.; Rasmussen, S.K. A new class of N-hydroxycinnamoyltransferases: Purification, cloning, and expression of a barley agmatine coumaroyltransferase (EC 2.3. 1.64). J. Biol. Chem. 2003, 278, 13919–13927. [Google Scholar] [CrossRef] [PubMed]
- Gorzolka, K.; Bednarz, H.; Niehaus, K. Detection and localization of novel hordatine-like compounds and glycosylated derivates of hordatines by imaging mass spectrometry of barley seeds. Planta 2014, 239, 1321–1335. [Google Scholar] [CrossRef] [PubMed]
- Piasecka, A.; Sawikowska, A.; Krajewski, P.; Kachlicki, P. Combined mass spectrometric and chromatographic methods for in-depth analysis of phenolic secondary metabolites in barley leaves. J. Mass Spectrom. 2015, 50, 513–532. [Google Scholar] [CrossRef] [PubMed]
- Pihlava, J.M.; Kurtelius, T.; Hurme, T. Total hordatine content in different types of beers. J. Inst. Brew. 2016, 122, 212–217. [Google Scholar] [CrossRef]
- Gorzolka, K.; Kölling, J.; Nattkemper, T.W.; Niehaus, K. Spatio-temporal metabolite profiling of the barley germination process by MALDI MS imaging. PLoS ONE 2016, 11, e0150208. [Google Scholar] [CrossRef]
- Pihlava, J.M. Identification of hordatines and other phenolamides in barley (Hordeum vulgare) and beer by UPLC-QTOF-MS. J. Cereal Sci. 2014, 60, 645–652. [Google Scholar] [CrossRef]
- Bhattacharya, A.; Sood, P.; Citovsky, V. The roles of plant phenolics in defence and communication during Agrobacterium and Rhizobium infection. Mol. Plant Pathol. 2010, 11, 705–719. [Google Scholar] [CrossRef]
- Khang, D.T.; Dung, T.N.; Elzaawely, A.A.; Xuan, T.D. Phenolic profiles and antioxidant activity of germinated legumes. Foods 2016, 5, 27. [Google Scholar] [CrossRef]
- Hamany Djande, C.Y.; Steenkamp, P.A.; Piater, L.A.; Madala, N.E.; Dubery, I.A. Habituated Moringa oleifera callus retains metabolic responsiveness to external plant growth regulators. Plant Cell Tissue Organ Cult. 2019, 137, 249–264. [Google Scholar] [CrossRef]
- Clifford, M.N.; Johnston, K.L.; Knight, S.; Kuhnert, N. Hierarchical scheme for LC-MSn identification of chlorogenic acids. J. Agric. Food Chem. 2003, 51, 2900–2911. [Google Scholar] [CrossRef]
- Bollina, V.; Kushalappa, A.C.; Choo, T.M.; Dion, Y.; Rioux, S. Identification of metabolites related to mechanisms of resistance in barley against Fusarium graminearum, based on mass spectrometry. Plant Mol. Biol. 2011, 77, 355–370. [Google Scholar] [CrossRef] [PubMed]
- Boz, H. Ferulic acid in cereals-a review. Czech J. Food Sci. 2015, 33, 1–7. [Google Scholar] [CrossRef]
- Atanasova-Penichon, V.; Barreau, C.; Richard-Forget, F. Antioxidant secondary metabolites in cereals: Potential involvement in resistance to Fusarium and mycotoxin accumulation. Front. Microbiol. 2016, 7, 566. [Google Scholar] [CrossRef] [PubMed]
- Alamgir, K.M.; Hojo, Y.; Christeller, J.T.; Fukumoto, K.; Isshiki, R.; Shinya, T.; Baldwin, I.T.; Galis, I. Systematic analysis of rice (Oryza sativa) metabolic responses to herbivory. Plant Cell Environ. 2016, 39, 453–466. [Google Scholar] [CrossRef] [PubMed]
- Le Roy, J.; Huss, B.; Creach, A.; Hawkins, S.; Neutelings, G. Glycosylation is a major regulator of phenylpropanoid availability and biological activity in plants. Front. Plant Sci. 2016, 7, 735. [Google Scholar] [CrossRef]
- Stoessl, A. the antifungal factors in barley-the constitutions of hordatines A and B. Tetrahedron Lett. 1966, 7, 2287–2292. [Google Scholar] [CrossRef]
- Yamaji, N.; Yokoo, Y.; Iwashita, T.; Nemoto, A.; Koike, M.; Suwa, Y.; Wakimoto, T.; Tsuji, K.; Nukaya, H. Structural determination of two active compounds that bind to the muscarinic M3 receptor in beer. Alcohol. Clin. Exp. Res. 2007, 31, S9–S14. [Google Scholar] [CrossRef]
- Kageyama, N.; Inui, T.; Fukami, H.; Komura, H. Elucidation of chemical structures of components responsible for beer aftertaste. J Am. Soc. Brew. Chem. 2011, 69, 255–259. [Google Scholar] [CrossRef]
- Bollina, V.; Kumaraswamy, G.K.; Kushalappa, A.C.; Choo, T.M.; Dion, Y.; Rioux, S.; Faubert, D.; Hamzehzarghani, H. Mass spectrometry-based metabolomics application to identify quantitative resistance-related metabolites in barley against Fusarium head blight. Mol. Plant. Pathol. 2010, 11, 769–782. [Google Scholar] [CrossRef]
- Bouhaouel, I.; Richard, G.; Fauconnier, M.L.; Ongena, M.; Franzil, L.; Gfeller, A.; Slim Amara, H.; du Jardin, P. Identification of barley (Hordeum vulgare L. subsp. vulgare) root exudates allelochemicals, their autoallelopathic activity and against Bromus diandrus Roth. Germination. Agronomy 2019, 9, 345. [Google Scholar] [CrossRef]
- Kilaru, A.; Herrfurth, C.; Keereetaweep, J.; Hornung, E.; Venables, B.J.; Feussner, I.; Chapman, K.D. Lipoxygenase-mediated oxidation of polyunsaturated N-acylethanolamines in Arabidopsis. J. Biol. Chem. 2011, 286, 15205–15214. [Google Scholar] [CrossRef] [PubMed]
- Oliw, E.H.; Hamberg, M. Biosynthesis of jasmonates from linoleic acid by the fungus Fusarium oxysporum. Evidence for a novel allene oxide cyclase. Lipids 2019, 54, 543–556. [Google Scholar] [CrossRef] [PubMed]
- Enomoto, H.; Sensu, T.; Sato, K.; Sato, F.; Paxton, T.; Yumoto, E.; Miyamoto, K.; Asahina, M.; Yokota, T.; Yamane, H. Visualisation of abscisic acid and 12-oxo-phytodienoic acid in immature Phaseolus vulgaris L. seeds using desorption electrospray ionisation-imaging mass spectrometry. Sci. Rep. 2017, 7, 42977. [Google Scholar] [CrossRef] [PubMed]
- Hamany Djande, C.Y.; Madala, N.E.; Dubery, I.A. Mass spectrometric approaches to study the metabolism of jasmonates: Biotransformation of exogenously-supplemented methyl jasmonate by cell suspension cultures of Moringa oleifera. In Jasmonate in Plant Biology, Methods and Protocols; Champion, A., Laplaze, L., Eds.; Springer Nature: New York, NY, USA, 2020; pp. 211–227, Chapter 16. [Google Scholar] [CrossRef]
- Ghosson, H.; Schwarzenberg, A.; Jamois, F.; Yvin, J.C. Simultaneous untargeted and targeted metabolomics profiling of underivatized primary metabolites in sulfur-deficient barley by ultra-high performance liquid chromatography-quadrupole/time-of-flight mass spectrometry. Plant Methods 2018, 14, 62. [Google Scholar] [CrossRef]
- Al Kadhi, O.; Melchini, A.; Mithen, R.; Saha, S. Development of a LC-MS/MS method for the simultaneous detection of tricarboxylic acid cycle intermediates in a range of biological matrices. J Anal. Meth. Chem. 2017, 2017, 5391832. [Google Scholar] [CrossRef]
- Zhang, P.; Chan, W.; Ang, I.L.; Wei, R.; Lam, M.M.; Lei, K.M.; Poon, T.C. Revisiting fragmentation reactions of protonated α-amino acids by high-resolution electrospray ionization tandem mass spectrometry with collision-induced dissociation. Sci. Rep. 2019, 9, 6453. [Google Scholar] [CrossRef]
- Santos-Sánchez, N.F.; Salas-Coronado, R.; Hernández-Carlos, B.; Villanueva-Cañongo, C. Shikimic acid pathway in biosynthesis of phenolic compounds. In Plant Physiological Aspects of Phenolic Compounds; Soto-Hernández, M., García-Mateos, R., Palma-Tenango, M., Eds.; InTechOpen: London, UK, 2019; Volume 1, pp. 1–15. [Google Scholar] [CrossRef]
- Kim, S.C.; Lee, J.H.; Kim, M.H.; Lee, J.A.; Kim, Y.B.; Jung, E.; Kim, Y.S.; Lee, J.; Park, D. Hordenine, a single compound produced during barley germination, inhibits melanogenesis in human melanocytes. Food Chem. 2013, 141, 174–181. [Google Scholar] [CrossRef]
- Zabala, G.; Zou, J.; Tuteja, J.; Gonzalez, D.O.; Clough, S.J.; Vodkin, L.O. Transcriptome changes in the phenylpropanoid pathway of Glycine max in response to Pseudomonas syringae infection. BMC Plant Biol. 2006, 6, 26. [Google Scholar] [CrossRef]
- Paasela, T.; Lim, K.J.; Pietiäinen, M.; Teeri, T.H. The O-methyltransferase PMT 2 mediates methylation of pinosylvin in Scots pine. New Phytol. 2017, 214, 1537–1550. [Google Scholar] [CrossRef]
- Kachroo, A.; Kachroo, P. Fatty acid–derived signals in plant defense. Annu. Rev. Phytopathol. 2009, 47, 153–176. [Google Scholar] [CrossRef]
- Karki, N.; Johnson, B.S.; Bates, P.D. Metabolically distinct pools of phosphatidylcholine are involved in trafficking of fatty acids out of and into the chloroplast for membrane production. Plant Cell 2019, 31, 2768–2788. [Google Scholar] [CrossRef] [PubMed]
- He, M.; Qin, C.-X.; Wang, X.; Ding, N.-Z. Plant unsaturated fatty acids: Biosynthesis and regulation. Front. Plant Sci. 2020, 11, 390. [Google Scholar] [CrossRef] [PubMed]
- Pretorius, C.J.; Zeiss, D.R.; Dubery, I.A. The presence of oxygenated lipids in plant defense in response to biotic stress: A metabolomics appraisal. Plant Signal. Behav. 2021, 16, 1989215. [Google Scholar] [CrossRef] [PubMed]
- Fernie, A.R.; Pichersky, E. Focus issue on metabolism: Metabolites, metabolites everywhere. Plant Physiol. 2015, 169, 1421–1423. [Google Scholar] [CrossRef]
- Razzaq, A.; Sadia, B.; Raza, A.; Khalid Hameed, M.; Saleem, F. Metabolomics: A way forward for crop improvement. Metabolites 2019, 9, 303. [Google Scholar] [CrossRef]
- Lim, G.H.; Singhal, R.; Kachroo, A.; Kachroo, P. Fatty acid–and lipid-mediated signaling in plant defense. Annu. Rev. Phytopathol. 2017, 55, 505–536. [Google Scholar] [CrossRef]
- Soubeyrand, E.; Johnson, T.S.; Latimer, S.; Block, A.; Kim, J.; Colquhoun, T.A.; Butelli, E.; Martin, C.; Wilson, M.A.; Basset, G.J. The peroxidative cleavage of kaempferol contributes to the biosynthesis of the benzenoid moiety of ubiquinone in plants. Plant Cell 2018, 30, 2910–2921. [Google Scholar] [CrossRef] [PubMed]
- Erb, M.; Kliebenstein, D.J. Plant secondary metabolites as defenses, regulators, and primary metabolites: The blurred functional trichotomy. Plant Physiol. 2020, 184, 39–52. [Google Scholar] [CrossRef]
- Tiburcio, A.F.; Altabella, T.; Bitrian, M.; Alcazar, R. The roles of polyamines during the lifespan of plants: From development to stress. Planta 2014, 240, 1–18. [Google Scholar] [CrossRef]
- Macoy, D.M.; Kim, W.Y.; Lee, S.Y.; Kim, M.G. Biotic stress related functions of hydroxycinnamic acid amide in plants. J. Plant Biol. 2015, 58, 156–163. [Google Scholar] [CrossRef]
- Stoessl, A. The antifungal factors in barley. IV. Isolation, structure, and synthesis of the hordatines. Can. J. Chem. 1967, 45, 1745–1760. [Google Scholar] [CrossRef]
- Stoessl, A.; Unwin, C.H. The antifungal factors in barley. V. Antifungal activity of the hordatines. Can. J. Chem. 1970, 48, 465–470. [Google Scholar] [CrossRef]
- Smith, T.A.; Graham, R.B. Distribution of the hordatines in barley. Phytochemistry 1978, 17, 1093–1098. [Google Scholar] [CrossRef]
- Nomura, T.; Sue, M.; Horikoshi, R.; Tebayashi, S.I.; Ishihara, A.; Endo, T.R.; Iwamura, H. Occurrence of hordatines, the barley antifungal compounds, in a wheat-barley chromosome addition line. Genes Genetic. Sys. 1999, 74, 99–103. [Google Scholar] [CrossRef]
- Batchu, A.K.; Zimmermann, D.; Schulze-Lefert, P.; Koprek, T. Correlation between hordatine accumulation, environmental factors and genetic diversity in wild barley (Hordeum spontaneum C. Koch) accessions from the Near East Fertile Crescent. Genetica 2006, 127, 87–99. [Google Scholar] [CrossRef]
- Cowley, T.; Walters, D.R. Polyamine metabolism in barley reacting hypersensitively to the powdery mildew fungus Blumeria graminis f. sp. hordei. Plant Cell Environ. 2002, 25, 461–468. [Google Scholar] [CrossRef]
- Kristensen, B.K.; Burhenne, K.; Rasmussen, S.K. Peroxidases and the metabolism of hydroxycinnamic acid amides in Poaceae. Phytochem. Rev. 2004, 3, 127–140. [Google Scholar] [CrossRef]
- Gargallo-Garriga, A.; Sardans, J.; Pérez-Trujillo, M.; Rivas-Ubach, A.; Oravec, M.; Vecerova, K.; Urban, O.; Jentsch, A. Opposite metabolic responses of shoots and roots to drought. Sci. Rep. 2014, 4, 6829. [Google Scholar] [CrossRef]
- Linatoc, A.C.; Idris, A.; Bakar, M.F.A. Influence of light intensity on the photosynthesis and phenolic contents of Mangifera indica. J. Sci. Technol. 2018, 10, 47–54. [Google Scholar] [CrossRef][Green Version]
- Zadoks, J.C.; Chang, T.T.; Konzak, C.F. A decimal code for the growth stages of cereals. Weed Res. 1974, 14, 415–421. [Google Scholar] [CrossRef]
- PubChem. Available online: https://pubchem.ncbi.nlm.nih.gov (accessed on 24 March 2020).
- MassBank. Available online: https://mona.fiehnlab.ucdavis.edu/spectra/search (accessed on 18 September 2019).
- MS-Dial. Available online: http://prime.psc.riken.jp/Metabolomics_Software/MS-DIAL (accessed on 18 December 2021).
- ChemSpider. Available online: http://www.chemspider.com/ (accessed on 21 January 2022).
- Lipidmaps. Available online: https://www.lipidmaps.org (accessed on 18 December 2021).
- Dictionary of Natural Products. Available online: www.dnp.chemnetbase.com (accessed on 3 December 2021).
- MetaboAnalyst—Statistical, Functional and Integrative Analysis of Metabolomics Data. Available online: www.metaboanalyst.ca (accessed on 10 April 2019).
- KEGG. Available online: http://www.genome.jp/kegg/ (accessed on 10 April 2019).


| No | Compounds | Rt (min) | m/z (ESI–) | Diagnostic Fragments | m/z (ESI+) | Diagnostic Fragments | Shoots | Roots |
|---|---|---|---|---|---|---|---|---|
| Hydroxybenzoic acids | ||||||||
| 1 | Protocatechuic acid hexose | 1.69 | 315.0749 | 153 | √ | √ | ||
| 2 | Benzylalcohol-hexose-pentose | 5.66 | 401.1405 | 401, 269, 161, 101 | √ | √ | ||
| 3 | Gallic acid monohydrate | 12.56 | 187.0942 | 169, 125 | √ | √ | ||
| Hydroxycinnamic acids and derivatives | ||||||||
| 4 | Ferulic acid hexose | 1.76 | 355.0676 | 193 | √ | |||
| 5 | 3-Caffeoylquinic acid | 2.16 | 353.0865 | 191, 179 | √ | |||
| 6 | 3-Feruloylquinic acid | 4.08 | 367.1053 | 367, 193, 134 | √ | |||
| 7 | Sinapic acid hexose | 5.37 | 385.1129 | 385, 223, 164 | √ | |||
| 8 | 4-Feruloyquinic acid | 7.44 | 367.0996 | 367, 193, 173 | √ | |||
| Hydroxycinnamic acid amides | ||||||||
| 9 | p-Coumaroylhydroxyagmatine hexoside | 1.82 | 455.2128 | 293, 147 | √ | |||
| 10 | p-Coumaroylputrescine | 2.46 | 235.1346 | 218, 188, 147, 119, 91 | √ | |||
| 11 | Feruloylhydroxyagmatine hexoside | 2.57 | 485.2265 | 323, 177 | √ | |||
| 12 | p-Coumaroylhydroxyagmatine | 2.66 | 291.1426 | 119 | 293.1544 | 147 | √ | √ |
| 13 | p-Coumaroylagmatine hexoside | 2.85 | 439.2234 | 277, 217, 147, 119 | √ | |||
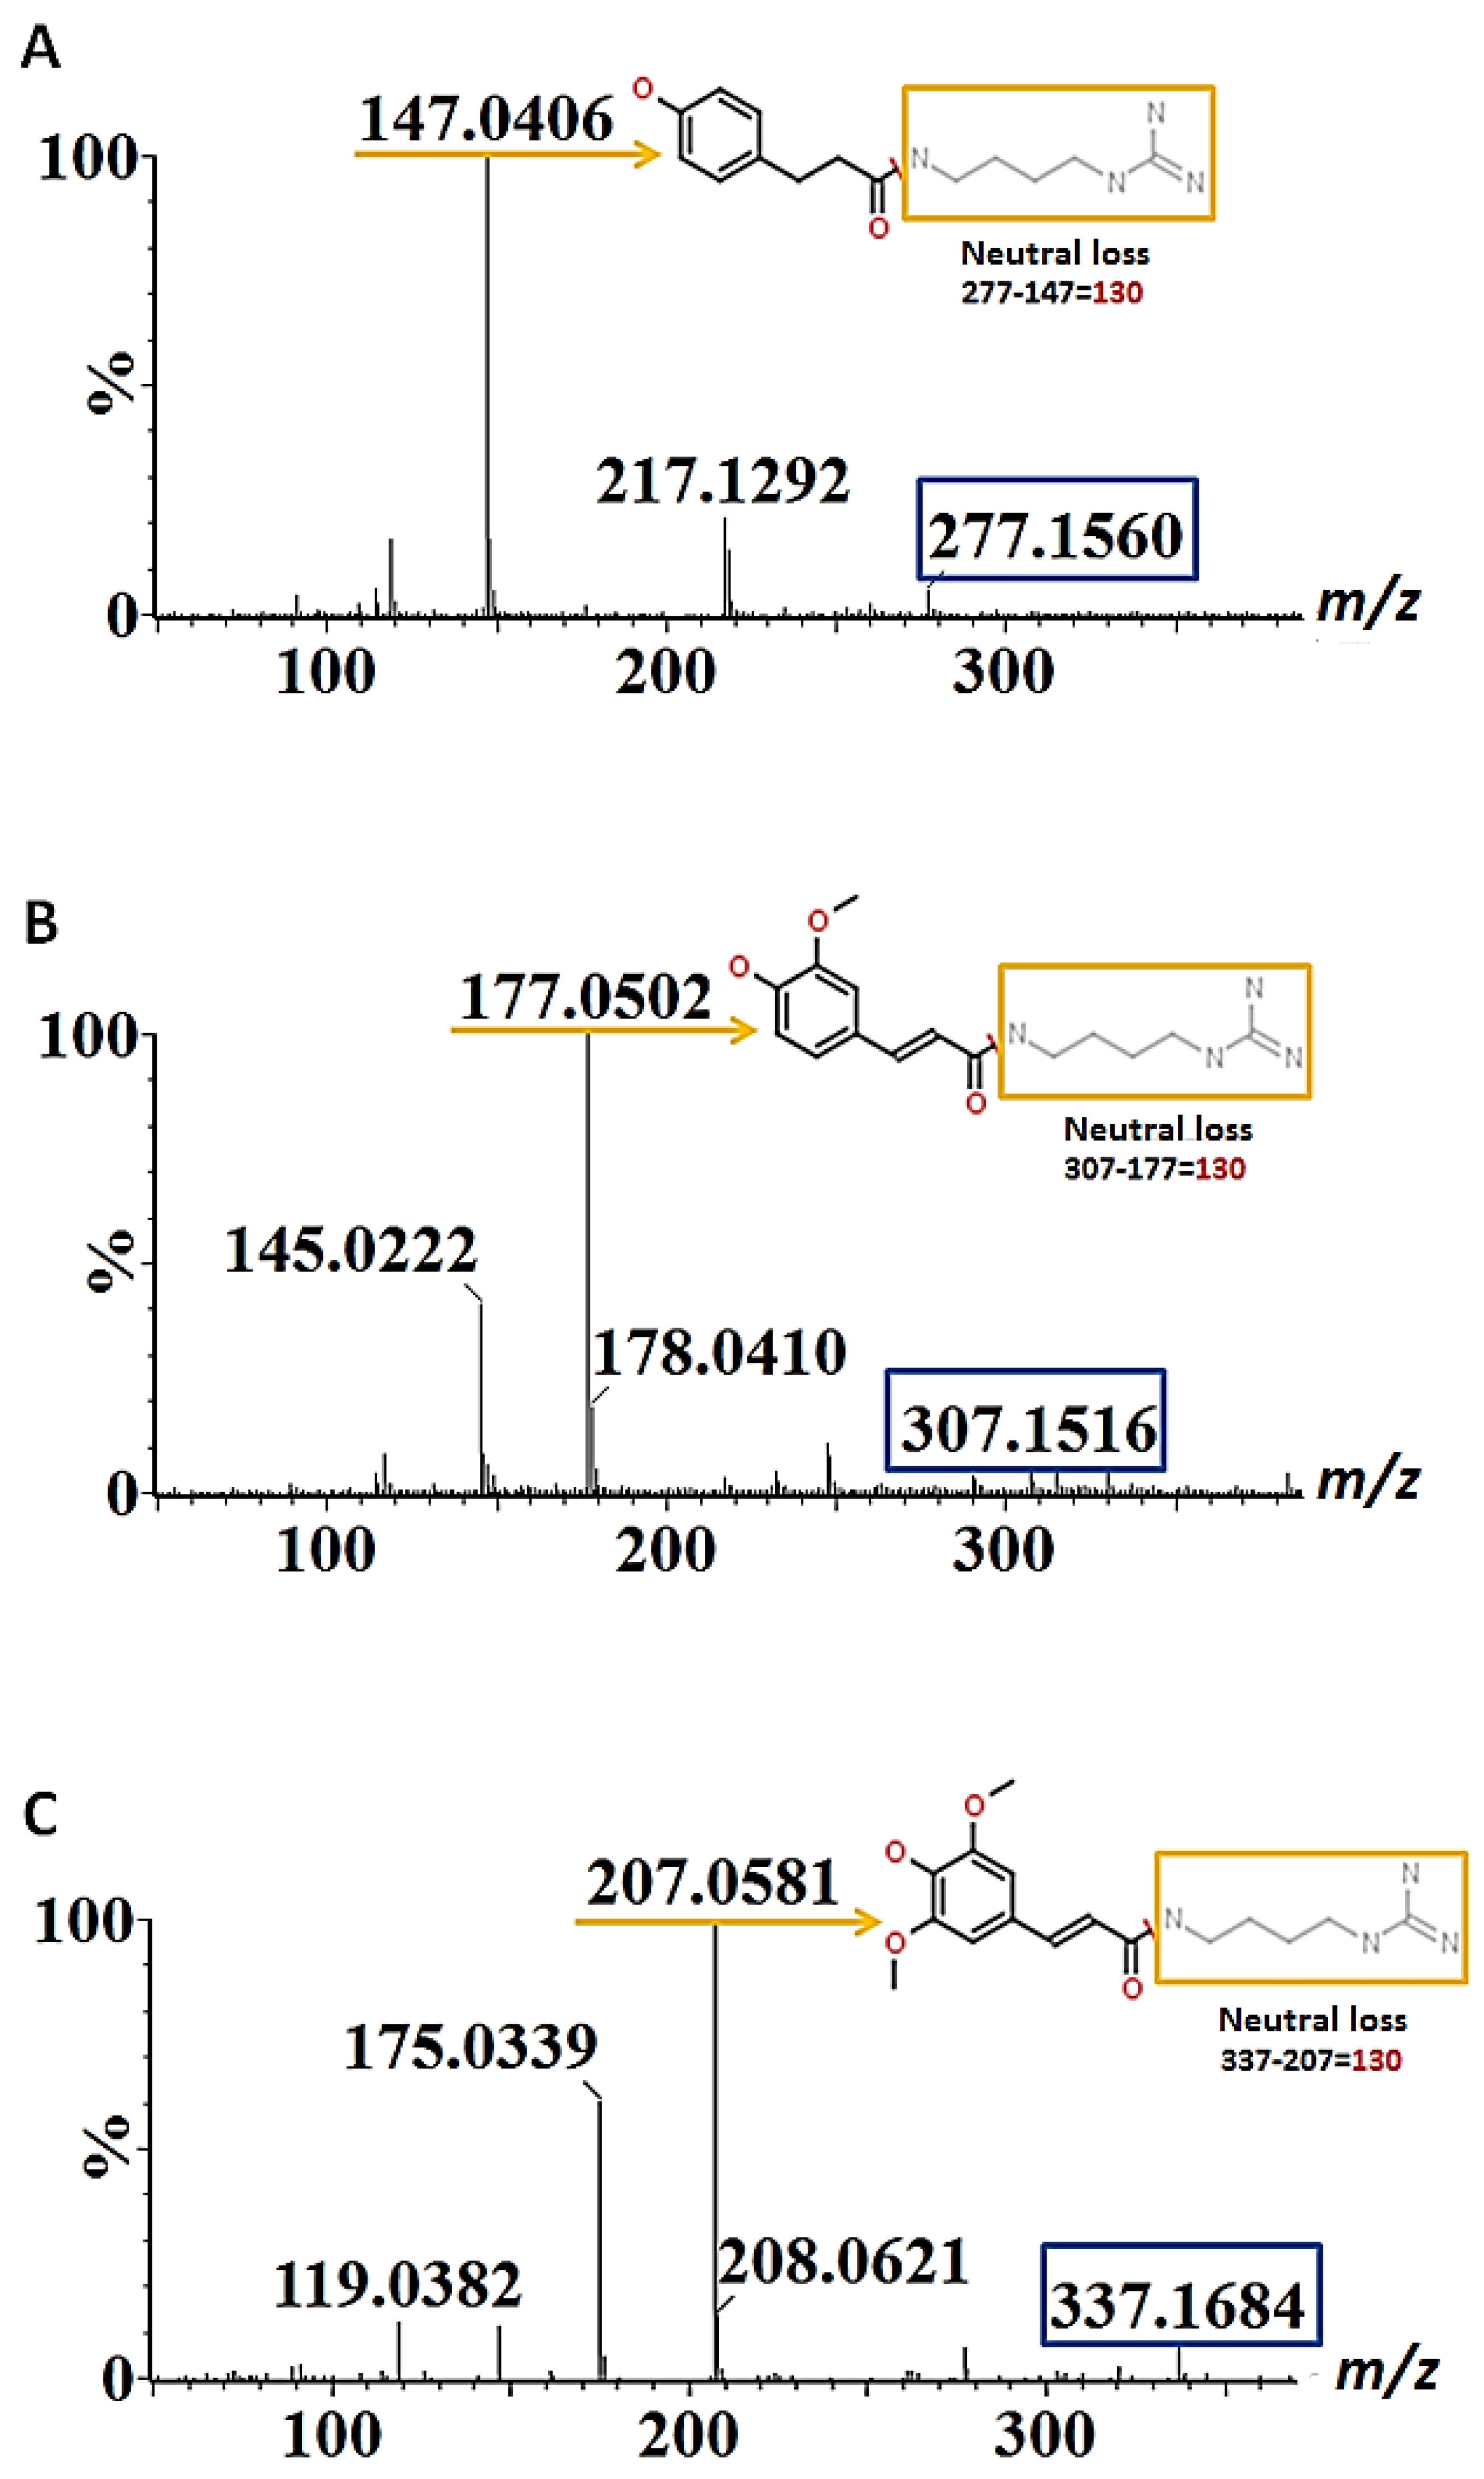
| 14 | Feruloylagmatine isomer I | 3.29 | 307.1745 | 307, 177, 147/145 | √ | |||
| 15 | Feruloylhydroxyagmatine | 3.54 | 323.1679 | 323, 177 | √ | √ | ||
| 16 | p-Coumaroylagmatine | 4.23 | 277.1581 | 277, 217, 147, 131 | √ | √ | ||
| 17 | Feruloylagmatine hexoside | 4.45 | 469.2355 | 307, 293, 177, 147, 119 | √ | |||
| 18 | Feruloylagmatine isomer II | 5.49 | 307.1705 | 307, 177, 145 | √ | √ | ||
| 19 | Sinapoylagmatine isomer I | 6.41 | 337.1794 | 337, 207, 175, 147, 119 | √ | |||
| 20 | Sinapoylhydroxyagmatine | 6.54 | 351.1222 | 351, 249, 101 | √ | √ | ||
| 21 | Sinapoylagmatine isomer II | 7.89 | 337.1819 | 337, 207, 175, 147, 120 | √ | |||
| Benzofurans | ||||||||
| 22 | Hordatine B isomer I | 7.60 | 579.2993 | 579, 423, 267 | 581.3153 | 581, 425, 321, 295, 293, 157, 131, 114 | √ | |
| 23 | Hordatine B isomer II | 7.72 | 581.3143 | 581, 425,321, 291, 157, 131, 114 | √ | |||
| 24 | Hordatine D | 7.82 | 641.1716 | 641, 425, 291, 157, 131, 141, 118 | √ | |||
| 25 | Hordatine A | 7.93 | 549.2915 | 549, 393, 385, 267, 249 | 551.3013 | 551, 425, 395, 291, 276, 265, 157, 131, 114 | √ | |
| 26 | Hordatine C | 8.25 | 609.3073 | 579, 453, 423, 393, 297, 237 | 611.3342 | 611, 581, 455, 425, 395, 325, 306, 157, 131, 114 | √ | |
| 27 | Hordatine C hexose isomer I | 3.56 | 771.2131 | 771, 609, 593, 503, 473 | √ | |||
| 28 | Hordatine B hexose | 4.03 | 787.3706 | 787 (741 + formic acid), 741, 579 | 743.382 | 743, 564, 425, 372, 291, 261, 157 | √ | |
| 29 | Hordatine A hexose | 4.34 | 757.3595 | 757 (711 + formic acid), 711, 549, 393, 131 | 713.3724 | 713, 551, 533, 395, 357, 276, 247, 131 | √ | |
| 30 | Hordatine C hexose isomer II | 5.41 | 771.1981 | 771, 609, 467, 205, 190 | √ | |||
| Flavonoids | ||||||||
| 31 | Isoorientin-7-O-glucoside/Lutonarin | 6.74 | 609.1421 | 609, 447, 327 | 611.1583 | 611, 449, 431, 383, 353, 329, 299, 329 | √ | |
| 32 | Isovitexin-7-O-glucoside/Saponarin | 8.64 | 593.1534 | 593, 473, 431, 341, 311 | √ | √ | ||
| 33 | Isovitexin-7-O-rhamnosyl-glucoside | 9.04 | 739.2300 | 739, 431, 341, 311 | √ | |||
| 34 | Isoscoparin-7-O-glucoside | 9.20 | 623.1533 | 623, 461, 341 | √ | |||
| 35 | Isovitexin-7-O-[6″-sinapoyl]-glucoside 4′-O-glucoside | 9.40 | 961.2755 | 961, 799, 593, 431, 311 | √ | |||
| 36 | Isovitexin derivative | 9.91 | 611.2522 | 611, 431, 251, 207 | √ | |||
| 37 | Isovitexin 2″-O-glucoside | 10.01 | 593.1427 | 593, 413, 293 | 595.1627 | 595, 433, 415, 367, 337, 283 | √ | |
| 38 | Isovitexin 2″-O-arabinoside | 10.15 | 563.134 | 563, 413, 293 | 565.1579 | √ | ||
| 39 | Luteolin 7-O-arabinosylglucoside | 10.91 | 579.1371 | 579, 447, 285 | √ | |||
| 40 | Isovitexin-7-O-[6″-sinapoyl]-glucoside | 11.59 | 799.2158 | 431, 341, 311 | 801.2339 | 801, 783, 747, 681, 621, 397, 379, 283 | √ | |
| 41 | Isoscoparin-7-O-[6″-sinapoyl]-glucoside | 11.69 | 829.2297 | 829, 461, 341 | √ | |||
| 42 | Isovitexin-7-O-[X″-feruloyl]-glucoside | 11.98 | 769.2041 | 769, 431, 311 | 771.2312 | 771, 415, 379, 361, 313, 283, 177 | √ | |
| 43 | Apigenin-7-O-arabinosylglucoside | 12.06 | 563.14 | 563, 269 | √ | |||
| 44 | Isoscoparin-7-O-[6″-feruloyl]-glucoside | 12.10 | 799.2159 | 799, 461, 341 | √ | |||
| 45 | Chrysoeriol-7-O-arabinosyl-glucoside | 12.37 | 593.144 | 593, 299 | 595.1630 | 595, 463, 301, 262 | √ | |
| 46 | 6-Prenylnaringenin | 19.18 | 339.2123 | 339, 307, 321, 289 | √ | |||
| 47 | Isoorientin-7-O-[6″-sinapoyl]-glucoside | 10.71 | 815.2056 | 815, 447, 327 | √ | |||
| 48 | Flavonoid-related compound | 11.03 | 787.2163 | 431, 413, 395, 383, 377, 365, 353, 329, 299,177 | √ | |||
| Alkaloids | ||||||||
| 49 | Hordenine | 1.17 | 166.1139 | 121 | √ | √ | ||
| Amino acids and derivatives | ||||||||
| 50 | Phenylalanine | 1.68 | 164.0699 | 147, 101 | 166.0823 | 120, 103, 93, 91 | √ | √ |
| 51 | Tryptophan | 2.51 | 203.0767 | 116, 142, 158/159, 203 | 205.0928 | 188, 146, 118, 91 | √ | √ |
| 52 | N-Acetylaspartylglutamic acid | 6.03 | 303.0826 | 96 | √ | |||
| Organic acids compounds | ||||||||
| 53 | Isocitric acid | 0.92 | 191.0038 | 111 | √ | √ | ||
| 54 | Malic acid | 1.02 | 133.0120 | 115 | √ | √ | ||
| 55 | Citric acid | 1.16 | 191.0066 | 111, 173 | √ | √ | ||
| 56 | Succinic acid | 1.20 | 117.0103 | 117 | √ | √ | ||
| 57 | Citric acid derivative | 1.41 | 306.1123 | 191, 173, 111 | √ | |||
| Fatty acids and derivatives | ||||||||
| 58 | 12-hydroxyjasmonate sulfate | 4.59 | 305.0635 | 305, 225, 96 | √ | |||
| 59 | α-Linolenoyl ethanolamide | 9.87 | 322.2772 | √ | ||||
| 60 | Linoleoyl ethanolamide | 12.33 | 324.2901 | √ | ||||
| 61 | (10E,15Z)-9,12,13-trihydroxyoctadeca-10,15-dienoic acid isomer I (9,12,13-TriHODE) | 16.57 | 327.2131 | 327, 229, 211, 171, 113 | √ | |||
| 62 | 9,12,13-TriHODE isomer II | 16.67 | 327.2170 | 327, 229, 211 | √ | √ | ||
| 63 | 9,12,13-TriHODE isomer III | 16.79 | 327.2132 | 327, 229, 211 | √ | |||
| 64 | Trihydroxyoctadecenoic acid | 17.38 | 329.2278 | 329, 229, 211 | √ | √ | ||
| 65 | 9-Oxo-12,13-dihydroxy-10E,15Z-octadecadienoic acid (9K,12,13-diHODE) | 17.61 | 325.1967 | 325, 307, 209 | √ | √ | ||
| 66 | OPDA conjugate isomer I | 19.61 | 309.2024 | 309, 291, 273, 247 | √ | √ | ||
| 67 | OPDA conjugate isomer II | 19.68 | 309.1991 | 309, 291, 273, 247, 209, 179, 165 | √ | √ | ||
| 68 | 9-Hydroxy-12-oxo-10(E),15(Z)-octadecadienoic acid isomer I (12K, 9-HODE) | 20.09 | 309.2034 | 309, 291, 197 | √ | |||
| 69 | 12K, 9-HODE isomer II | 20.59 | 309.2019 | 309, 291, 247, 165 | √ | √ | ||
| 70 | Linolenic acid derivative I, isomer I | 20.77 | 675.3553 | 675, 415, 397, 277, 235, 89 | √ | |||
| 71 | 12-Oxo-phytodienoic acid (12-OPDA) | 21.11 | 291.1946 | 291, 273, 247, 165 | √ | |||
| 72 | Hydroxyoctadecadienoic acid/hydroxylinoleic acid | 22.37 | 295.2256 | 277, 233, 195 | √ | √ | ||
| 73 | Linolenic acid derivative I, isomer II | 21.07 | 675.3615 | 675, 415, 397, 277, 235, 89 | √ | |||
| 74 | Linolenoylglycerol/monolinolenin isomer I | 20.81 | 353.2632 | 353, 335, 261, 243 | √ | √ | ||
| 75 | Linolenoylglycerol/monolinolenin isomer II | 21.11 | 353.2595 | 353, 335, 261, 243 | √ | |||
| 76 | Linolenoylglycerol/monolinolenin isomer III | 21.27 | 353.2644 | 353, 331, 261, 243 | √ | |||
| 77 | Linolenoylglycerol/monolinolenin isomer VI | 21.94 | 353.2625 | 353, 331, 261, 243 | √ | |||
| 78 | Linolenic acid derivative II | 22.69 | 445.2328 | 445, 311, 293, 277 | √ | |||
Publisher’s Note: MDPI stays neutral with regard to jurisdictional claims in published maps and institutional affiliations. |
© 2022 by the authors. Licensee MDPI, Basel, Switzerland. This article is an open access article distributed under the terms and conditions of the Creative Commons Attribution (CC BY) license (https://creativecommons.org/licenses/by/4.0/).
Share and Cite
Hamany Djande, C.Y.; Steenkamp, P.A.; Piater, L.A.; Tugizimana, F.; Dubery, I.A. Hordatines and Associated Precursors Dominate Metabolite Profiles of Barley (Hordeum vulgare L.) Seedlings: A Metabolomics Study of Five Cultivars. Metabolites 2022, 12, 310. https://doi.org/10.3390/metabo12040310
Hamany Djande CY, Steenkamp PA, Piater LA, Tugizimana F, Dubery IA. Hordatines and Associated Precursors Dominate Metabolite Profiles of Barley (Hordeum vulgare L.) Seedlings: A Metabolomics Study of Five Cultivars. Metabolites. 2022; 12(4):310. https://doi.org/10.3390/metabo12040310
Chicago/Turabian StyleHamany Djande, Claude Y., Paul A. Steenkamp, Lizelle A. Piater, Fidele Tugizimana, and Ian A. Dubery. 2022. "Hordatines and Associated Precursors Dominate Metabolite Profiles of Barley (Hordeum vulgare L.) Seedlings: A Metabolomics Study of Five Cultivars" Metabolites 12, no. 4: 310. https://doi.org/10.3390/metabo12040310
APA StyleHamany Djande, C. Y., Steenkamp, P. A., Piater, L. A., Tugizimana, F., & Dubery, I. A. (2022). Hordatines and Associated Precursors Dominate Metabolite Profiles of Barley (Hordeum vulgare L.) Seedlings: A Metabolomics Study of Five Cultivars. Metabolites, 12(4), 310. https://doi.org/10.3390/metabo12040310