Abstract
Ganoderma lucidum P. karst is an edible fungus that is used in traditional medicine and contains triterpenoids as the major phytoconstituents. Ganoderic acids are the most abundant triterpenoids that showed pharmacological activity. As Indian varieties contain ganoderic acid H (GA-H), we aimed to prepare GA-H-based triterpenoid enriched fraction (TEF) and evaluated its pharmacokinetics, metabolomics, and stability analysis. A high-performance liquid chromatography (HPLC) method was developed to quantify GA-H in TEF and rat plasma. Based on GA-H content, a stability assessment and pharmacokinetic study of TEF were also performed. After its oral administration to rats, TEF’s the metabolic pattern recognition was performed through ultra-performance liquid chromatography mass spectroscopy (UPLC–MS). The developed HPLC method was found to be simple, sensitive, precise (<15%), and accurate (>90% recovery) for the quantification of GA-H. Pharmacokinetic analysis showed that GA-H reached its maximum plasma concentration (Cmax 2509.9 ng/mL) within two hours and sustained quantifiable amount up to 12 h with a low elimination rate (Kel) 0.05 L/h. TEF contained ten bioavailable constituents. The prepared TEF was found to be stable for up to one year at room temperature. The prepared TEF, enriched with ganoderic acid, is stable, contains bioavailable constituents, and can be explored as phytopharmaceuticals for different pharmacological properties. Highlights: (1). Preparation of triterpenoid enriched fraction (TEF) from Ganoderma lucidum. (2). Major triterpenoid in TEF is ganoderic acid H (GA-H). (3). TEF contains several bioavailable phytoconstituents. (4). TEF (considering only GA-H) is stable for up to one year at room temperature. (5). GA-H is rapidly absorbed and has high systemic exposure.
1. Introduction
The intake of dietary supplements has been increased alarmingly due to several health benefits and trend toward healthy lifestyles. There are numerous herbs and living organisms used as dietary supplements. Fungi are the most widely distributed organisms on earth and are of great medicinal importance. Ganoderma lucidum, a fungus known as ‘Mushroom’ in India or ‘Lingzhi’ in China or ‘Reishi’ in Japan, is a well-known medicinal mushroom and has a great future as a dietary supplement. Over 2000 years, G. lucidum has been used in several traditional systems as rejuvenation of health by providing vital energy, strengthening the immune system, anti-aging, and strengthening body resistance [1]. Nowadays, it is widely used as a dietary supplement in the United States and in European countries. It is enriched with different classes of secondary metabolites, such as triterpenoids, polysaccharides, peptides, alkaloids, steroids, flavonoids, iridoids, and lignans, and these metabolites have been scientifically proven to have several pharmacological activities [2]. Among these metabolites, triterpenoids are abundant in G. lucidum, and these were reported to have hepatoprotective, antioxidant, anti-hypertensive, anti-inflammatory, anti-cholesterol, anticancer, antitumor, anti-HIV-1, neurotrophic, immunomodulatory, and nootropic activities [3]. Since, the first discovery of ganoderic acid GA-A and B, more than 150 triterpenoids have been reported in G. lucidum [4,5]. Among them, the major bioactive triterpenoids found in G. lucidum are GA-A, GA-B, GA-BS, GA-C1, GA-C2, GA-D, GA-F, GA-H, GA-I, GA-O, GA-J, GA-K, GA-W, GA-M, GA-Ma, GA-DM, GA-X, GA-Y, GA-Z, GA-lactone, GA-δ, GA-θ, GA-η, GA-ζ, GA-α, ganoderiol F, and ganodermanotriol [6].
Major triterpenoids reported in the Chinese variety of G. lucidum are GA-A, C2, D, F, and H [2,7]. The ganoderic acid triterpenoids (GA-A, GA-F, and GA-H) of G. lucidum were reported to suppress the growth and invasive behavior of breast cancer cells by modulating AP-1 and NF-κB signaling [8]. Indian varieties of G. lucidum were reported to have GA-A, D, and F [9,10]. Several in vitro and in vivo studies support the pharmacological activities of Indian varieties of G. lucidum [11,12]. However, very few reports have been documented on pharmacokinetic study of G. lucidum based on the ganoderic acid A, D, and F content [13,14,15]. In our preliminary study, it was found that GA-H is one of the major triterpenoids found in Indian varieties of G. lucidum. Similar to GA-A, GA-H also hydroxylated and converted into bioactive form. GA-H has also exhibited anticancer activity [16].
Although other ganoderic acids have been explored, not a single report is available on GA-H. The main objective of this study was to assess G. lucidum in terms of GA-H. In the present study, the pharmacokinetics of the triterpenoid-enriched fraction (TEF) of G. lucidum were evaluated. Along with the pharmacokinetic study of TEF, we aimed to identify its pattern of metabolites after oral administration in rats through UPLC–MS. This study will lead to the identification of bioavailable compounds present in TEF. Furthermore, GC–MS-based chemical profiling of TEF was performed. Both GC–MS and UPLC–MS have important characteristics to develop effective phytopharmaceutical-based herbal formulations [17].
The stability of an herbal formulation is the most prevalent issue for its development as medicine. Bioactive components may undergo oxidation, hydrolysis, and other environmental degradation during natural products’ extraction and development process. The monitoring of the presence and concentration of active constituents is extremely important to check the quality, efficacy, and shelf-life of natural products [18]. To date, no such study has been reported on the stability of TEF. In this context, we have addressed the stability profile of TEF in terms of GA-H content, which will be helpful to develop stable phytopharmaceutical-based herbal products.
2. Results
G. lucidum mostly contains the lanosterol type of triterpenoids. The solubility criterion (like dissolves like) rule was followed for the extraction–isolation–purification of the TEF from G. lucidum. Then, the enrichment of the secondary-metabolites-based extraction process was applied to remove non-terpenoidal impurities. For solvent evaporation, reduced pressure and 50 and 40 °C temperatures were used for 95% ethanol and DCM, respectively, to get dried TEF of G. lucidum. The consistency of the produced TEF was syrupy and dark brown in color. The calculated yield of TEF was 0.84% w/w. TEF was stored in a well-closed container at −20 °C prior to experimental analysis.
2.1. Validation of HPLC Method for Quantitative Analysis of GA-H
An in-house high-performance liquid chromatographic (HPLC) method was developed and validated for the quantitative estimation of GA-H. In the developed chromatographic conditions, GA-H was eluted at 17.24 min. The linear concentration range of the GA-H was 100–1000 ng/mL, and the regression equation was Y = 2201.4X + 257,447 with 0.9931 of correlation coefficient (r2). The limit of detection (LOD) and limit of quantification (LOQ) of the developed method were 24.71 and 82.39 ng/mL, respectively. The chromatographic conditions were tested for system suitability parameters, such as capacity factor, theoretical plate, height-equivalent theoretical plate, and peak asymmetry at 10% height were 0.14, 8794, 0.019, and 2.15, respectively. The accuracy of the developed method was investigated by testing through the recovery assay. Two different concentrations (500 and 1000 ng/mL) were spiked in two different matrices (plasma and plant extract), followed by extraction and analyzed for its concentration measurement. In both the concentrations, recovery was found as 90.05% and 97.40% with relative standard deviation (%RSD) ≤ 2.0%, indicating good accuracy of the developed method. Besides accuracy, inter-day and intra-day precisions were measured to determine the preciseness of the developed method. For intra-day precision, samples were analyzed in six-replicated within the day. While for inter-day precision, samples were tested on five consecutive days of a week. Both intra-day and inter-day precisions were within the acceptable limits of <15.0% RSD [19]. To determine the robustness of the chromatographic conditions, the developed method was tested for mobile-phase composition, flow rate, and column temperature. Upon slight changes in mobile-phase composition, no significant changes in recovery of GA-H and even no percent change in the detector response of GA-H were observed. It indicates the consistency of the developed method. Details of the method validation are shown in the Supplementary Materials data.
2.2. Sample Preparation of GA-H in Plasma for Its Quantitative Estimation
The liquid–liquid extraction method was followed for the extraction of GA-H from plasma. Different solvent systems, such as methanol with formic acid (100:0.5, v/v); a mixture of methanol, acetonitrile, and formic acid (1:1:0.05, v/v/v); and a mixture of acetonitrile, methanol, and phosphoric acid (1:1:0.05, v/v/v) were tested for optimum extraction of GA-H in plasma. The acceptance criteria for selecting the best extraction solvents were based on the percentage recovery of GA-H and its good precision. Methanol with 0.5% formic acid (v/v) was found to be the best extracting solvent in which the percentage recovery of GA-H was more than 90% (%RSD ≤ 2%). However, for metabolomic fingerprinting of TEF, the same solvent systems were tested, and we found the maximum number of analytes of interest in the same solvents. The same processed samples were used for pharmacokinetic and metabolomic analysis.
2.3. Pharmacokinetic Analysis of TEF
Pharmacokinetic parameters of TEF in terms of GA-H were calculated from the plasma concentration–time graph (Figure 1). Pharmacokinetic parameters showed that GA-H was rapidly absorbed into the systemic circulation after oral administration of TEF. The Cmax of GA-H was 2509.9 ± 28.9 ng/mL, peak plasma concentration was achieved at approximately one hour, and AUC0–t and AUC0–∞ were 9798.8 ± 169.8 h*ng/mL and 9844.5 ± 157.2 h*ng/mL, respectively. The relative exposure of GA-H was expressed in terms of Cmax/D andAUC0–∞/D, and the obtained values were 501.9 ± 25.4 (ng/mL/mg) and 1968.9 ± 32.5 (h*ng/mL/mg), respectively. The volume of distribution (Vd) and clearance (CL) of GA-H were 9660.3 ± 111.5 mL and 507.9 ± 25.6 mL/h, respectively. The half-life of GA-H in blood was 13.18 h, indicating that it was sustained in blood for a longer time and excreted slowly from blood (rate of elimination, Kel 0.05 L/h). While mean residence time of GA-H in blood was found to be 5.42 h. In urine analysis, no GA-H was detected. The reason might be that GA-H remained in blood for a longer time, or it might metabolize to other forms. It would be interesting to analyze its metabolites in plasma and urine.
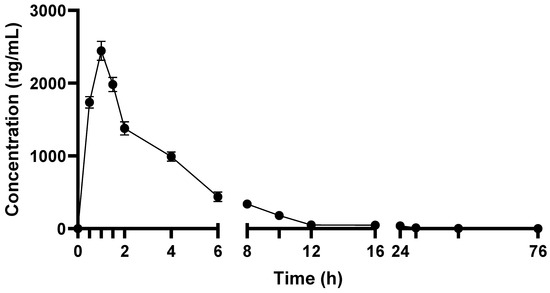
Figure 1.
Plasma concentration–time profile of TEF in terms of GA-H after its oral administration to rats.
2.4. In Vivo Pattern Recognition of TEF
After oral administration of TEF to rats, blood samples were collected and analyzed through UPLC–MS. Compounds were identified by matching masses (m/z) values with different databases. Total nineteen compounds were detected and tentatively identified in TEF after its oral administration to rats (Table 1). In TEF, 14 compounds were identified, out of which only ten compounds were absorbed in systemic circulation after oral administration of TEF to rats. Five different ganoderic acids, namely ganoderic acid N (Rt 5.74 min), ganoderic acid D (Rt 5.90 min), ganoderic acid A (Rt 5.93 min), and ganoderic acid H (Rt 7.02 min), were found in TEF, and all of these were bioavailable. However, ganoderic acid H was checked and confirmed by comparing it with the reference standard. Other than ganoderic acids, two more terpenoids, i.e., tsugaric acid A (Rt 5.96 min) and hericene (Rt 6.12 min), were present in TEF, but these are not bioavailable. One amino acid, i.e., glutamine betaxanthine (Rt 4.13 min), was detected in TEF, and it was absorbed in the systemic circulation. In TEF, two bioavailable fatty acids, 13-methylmyristic acid (Rt 9.27 min) and linoleic acid (Rt 11.24 min), were found. L-carnosine (Rt 2.75 min) is the only bioavailable peptide found in TEF. Epicatechin-6-glucoside (Rt 3.63 min) was the only bioavailable flavonoid found in TEF. Five endogenous metabolites were detected in UPLC–MS analysis. This UPLC–MS-based metabolomic fingerprinting was rapid and efficient for the identification of targeted and untargeted multi-ingredients.

Table 1.
UPLC–MS based metabolic profiling of TEF and blood sample after its oral administration.
2.5. GC–MS Profiling of TEF of G. Lucidum
GC–MS analysis was carried out for methanolic extract of TEF after derivatization. The GC–MS spectrum confirmed the presence of various components with different retention times as illustrated in Supplementary Materials Figure S6, and the detailed tabulation of most abundant compounds present in TEF are given in Table 2. A total of 49 compounds were separated, out of which 13 compounds were identified through the NIST library. Among identified compounds, the most abundant are fatty acids, followed by terpenoids and some hydrocarbons. However, a list of unknown compounds is given in Supplementary Materials Table S3.
Table 2.
GC–MS profiling of TEF and identified major compounds.
2.6. Real-Time Stability Profiling of TEF of G. Lucidum
Real-time stability testing is normally performed for a longer and specified duration to check the degradation of active ingredients under recommended storage conditions. During testing, the samples were collected at specific time intervals. In the present study, stability of GA-H was determined in TEF-based samples, and sampling was performed at every three-month interval up to one year (Table 3). No significant change in GA-H content in TEF was observed at both the temperatures (25 and 37 °C) in humid and normal conditions. However, the stability of TEF at 5 °C was also checked, but no significant change in GA-H content was observed.
Table 3.
Real-time stability analysis at 25 and 37 °C (non-humid and humid conditions at specified times 0, 3, 6, 9, and 12 months of TEF of G. lucidum in terms of GA-H (µg/mg) equivalent.
3. Discussion
Over the years, researchers have found that G. lucidum is enriched with triterpenoids. Among them, GA-H is one of the abundant triterpenoids found in G. lucidum. In this study, TEF was prepared, and GA-H was quantified in it. We used simple liquid–liquid extraction for TEF preparation. Ethanolic extract was suspended in water to dissolve water-soluble compounds, and subsequently DCM was used due to higher affinity of triterpenoids as compared to other phytochemicals. This method is simple and easy to get enriched triterpenoids from crude extract. The quantitative estimation of GA-H from TEF of G. lucidum was performed through an in-house validated RP-HPLC method. The RP-HPLC method was simple, precise, sensitive, economical, and best suited for a quantitatively targeted marker-based approach. RP-HPLC analysis of TEF showed a total of 23 peaks in which GA-H eluted at Rt 17.26 min and recorded at 254 nm with the most prominent peak. The content of GA-H in TEF was 23.9% (w/w) of its total dry weight. These results also agree with other studies in which GA-H was found to be the highly abundant triterpenoids in G. amboinense, G. sessile, G. artum, and G. tropicum [2,7]. In Chinese varieties of G. lucidum, GA-A, C2, D, and F were abundant triterpenoids [2,7,20]. However, Indian varieties are also reported to have GA-A, N, D, and F. However, we are the first to report GA-H in Indian varieties of G. lucidum. An almost-similar amount of GA-H was found in Indian varieties when compared to other reported varieties. In GC–MS analysis, thirteen different organic compounds, including fatty acids, terpenes, and hydrocarbons, were identified. Thus, the prepared TEF can be explored for the development of GA-H-based phytopharmaceuticals or dietary supplements. The study showed that the G. lucidum fruiting-bodies preparations possessed very low toxicity. G. lucidum triterpenoids are complex in nature but also safe at a higher dose. These triterpenoids were already well-proven for several biological ailments beyond nutritional benefits [8,21,22]. Pharmacokinetic and bioavailability assessment of triterpenoids of G. lucidum have been reported so far with several experimental methods. However, there were no scientific data reported with stable triterpenoid equivalent content with a defined dose. Especially, the pharmacokinetics of TEF, in terms of GA-H content, have not been reported to date. This work identified the GA-H equivalent of TEF as an efficient compound showing a good absorption pattern into the system and studied their pharmacokinetic property in Wistar rats. The GA-H was rapidly absorbed into the blood, i.e., in systemic circulation, after oral administration of TEF. Similar pharmacokinetic profiling was reported for GA-C2 and GA-D [5,15]. The present study indicates good oral bioavailability of TEF in terms of GA-H, and it would be effective in different disorders. With optimized chromatographic conditions, the pattern of metabolites of TEF was identified in blood after its oral administration to rats. It revealed general and metabolomic status of constituents present in TEF up to 72 h. LC–MS-based high-throughput screening strategy of metabolites was easy to access, reliable, and powerful approach for complementary to untargeted profiling [23]. Moreover, previously, no scientific data were reported on pattern of GA-H constituents in blood after oral administration of any kind of extract or fraction. In this study, most of the triterpenoids present in TEF were found to be bioavailable. These bioavailable constituents might show strong biological activities by synergy-based effects [24]. Identification of several triterpenoids of G. lucidum was previously reported with best-suited MS-based procedures, but lack of standardization of secondary metabolite-enriched extract and fractions [25].
PCA exhibited the metabolites of TEF and plasma at different time intervals. The cluster of metabolites with significant variation showed two principal components, F1 and F2, in Figure 2A, at a score of 60.41%. From the score plot, samples with a similar pattern of metabolites can be found in the same quadrant, while samples with different metabolite patterns can be found in different quadrants. This exhibited that the metabolites of TEF and plasma at different time intervals (0.5, 24, 48, and 72 h) were in the same quadrant. However, the metabolites at 6 and 12 h were visualized in other quadrants. This concluded that the sample of TEF metabolites was matched with blood. The eigenvalues, cumulative percentage variability, and percentage variance are typically shown in Table 4. The correlation matrix (Pearson value—r) w.r.t pattern of metabolites was calculated (Table 5). From heat-map visualization, metabolites were clearly shown from higher to lower abundance with red, green, and black colors (Figure 2B). We observed that the red-colored metabolites (absorbed in the blood) were showing higher abundance. However, in the case of metabolites of TEF of G. lucidum, few metabolites were showing after being absorbed into the blood at different time intervals. The green color of metabolites showed more abundance in the case of sample TEF, but less distributed in subsequent time intervals. This PLS-DA showed a significant and comparative separation of similarity and dissimilarity of metabolites of TEF at different time intervals. This tool provides an essential platform for rapid and vast information of metabolites for inferring the biological conclusions of TEF of G. lucidum [26].
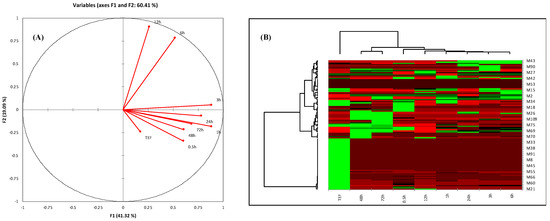
Figure 2.
(A) PCA score plot of correlation circles showing the different collections of samples based on their metabolite pattern. Different quadrants show similarity of metabolites’ pattern and vice versa. (B) Heat map of analyzed metabolites obtained from HPLC and UHPLC–MS profiling. Row correspondence to abundant and metabolite causing differentiations, while column indicates metabolites abundance with respect to sample. Abundancy of metabolites is shown in different colors: red color represents the higher metabolites abundancy, green color represents lower abundancy, and black color represents very lower abundance of metabolites.
Table 4.
Eigenvalues of different variables.
Table 5.
Correlation matrix of variables.
GA-H based TEF of G. lucidum might be applied as an active phytopharmaceutical ingredient for the development of drug [22]. However, the problem associated with any phytopharmaceuticals development is its stability profiling. In this context, we have assessed the stability of TEF based on GA-H content. We found that TEF is stable for up to one year when stored at room temperature in both humid and non-humid conditions. This is the first time to report the assessment of triterpenoids stability in G. lucidum. This study gives a prominent clue for the quality, safety, and efficacy of GA-H of TEF for a longer duration of action.
From all aforesaid experiments, it was confirmed that standardized TEF contains well-known bioavailable phytochemical compounds. This standardized secondary metabolite enrichment fraction of G. lucidum can be explored for the development of phytopharmaceuticals.
4. Materials and Methods
4.1. Chemicals and Fruiting Bodies of Fungus
The analytical grade of GA-H (purity > 98.25%) was procured from LGC promochem (Bengaluru, India). LC–MS and HPLC grade solvents were procured from Merck Life Science (Mumbai, India). Solvents used for extraction, and other chemicals used were of analytical grade and procured from Super Religare Laboratories (SRL) limited (New Delhi, India). The fruiting bodies of G. lucidum were purchased from Aryan Mushrooms private limited (Ahmedabad, India) and authenticated as per the American Herbal Pharmacopoeia [27]. For future reference, sample specimens were stored at Bioactive Natural Product Laboratory (Voucher specimen No. JH/BNPL/G. lucidum/FB/2018).
4.2. Extraction, Fractionation, and Preparation of TEF
The dried fruiting bodies (1.0 kg) were pulverized and extracted three times with five liters of 95% ethanol, using the reflux method. The extract was concentrated under reduced pressure to yield dried mass, then suspended into 50 mL of hot water and extracted with the same volume of dichloromethane (DCM). The organic layer was concentrated to about 1/10th of its original volume and extracted with fifty milliliters of saturated aqueous sodium bicarbonate, and the extract was acidified to pH 3–4 with 6.0 mol/L HCl. The neutralized extract was stored at a cold temperature (0 °C) to become precipitated. The resulting precipitate was re-dissolved in DCM and then dried to get a triterpenoid enriched fraction (TEF). It was stored at −20 °C prior to analysis and other experiments.
4.3. Quantitative Estimation of GA-H
4.3.1. Preparation of Standard Stock and Sample Solutions
Accurately weighed GA-H was dissolved in HPLC-grade methanol to get a final concentration of 1.0 mg/mL. Further, it was diluted with methanol to make different concentrations (100–1000 ng/mL) for linearity assessment. Similarly, TEF solution was also prepared in HPLC grade methanol (5.0 mg/mL), and it was filtered by using 0.45 μM filter (Millipore) before analysis.
4.3.2. Instrumentation and Chromatographic Conditions
Alliance HPLC system (e2695 Separation module, Waters, Milford, MA, USA) with a gradient pump integrated with adjustable wavelength programmable photodiode array detector (PDA) was employed for analysis. Chromatographic separation was executed on Hupersil 5.0 µL C18 (ODS) column (150 × 4.6 mm, Phenomenex, Torrance, CA, USA), using mobile phase composed of 0.5% v/v formic acid in water (A) and methanol (B). Solvents were eluted at a flow rate of 1.0 mL/min in gradient elution program (initially 100% A, 0–5 min 90% A, 5–10 min 70% A, 10–15 min 30% A, 15–20 min 2% A, and 20–22 min 100% A). Detection was carried out in a scanning mode with 3D channel at a wavelength of 254 nm. Total run time was 25 min. The identity of the compounds was established by comparing retention time of analytical standards. The proposed developed method was further validated as per the AOAC guidelines [18].
4.3.3. Validation of Developed HPLC Method
The chromatographic method for quantitative estimation of GA-H was validated for specific parameters, such as selectivity, linearity, sensitivity, accuracy, and precision, according to the Association of Official Analytical Chemists (AOAC) guidelines [19], in a similar manner as methods reported by our laboratory [28]. The linearity was analyzed through the standard plot of GA-H ranging from 100 to 1000 ng/mL. Different dilutions of standard were prepared by diluting stock solution (1.0 mg/mL) with methanol and analyzed in triplicate. The linearity was evaluated by linear regression equation plot analysis, which was calculated by the least-square regression analysis. Sensitivity of the developed method was measured by determining limit of detection (LOD) and limit of quantitation (LOQ). LOD (k = 3.3) and LOQ (k = 10) were calculated from the calibration curve, using A = kσ/S equation, where A is LOD or LOQ, σ is the standard deviation of response, and S is the slope of calibration curve.
The preciseness of the developed method was determined by measuring both intra-day and inter-day precisions. It was determined in six replicates of the mixed standard solution on the same day (intra-day precision) and daily for six times over a period of one week (inter-day precision). All results were expressed as % RSD for each parameter. The robustness of the developed method was studied with change in the mobile phase composition (methanol–water, 5:95, 10:90, and 15:85, v/v), temperature (25, 30, and 35 °C), and flow rate (0.9, 1.0, and 1.1 mL/min), respectively.
Accuracy of the method was measured by percentage recovery of GA-H after spiking it in two different matrices (plasma and crude extract), separately. For determination of recovery from plasma, standard solution of GA-H was spiked with plasma to get concentration of 500 and 1000 ng/mL. The spiked plasma was then extracted and analyzed to measure GA-H content. For extraction, 500 µL of HPLC grade methanol was added in 100 µL of spiked plasma. It was kept in refrigerator for 4 h for maximum protein precipitation and brought to room temperature. Further, it was centrifuged at 14,000 rpm for 10 min. The separated supernatant was dried by passing nitrogen gas and re-suspended in 100 µL of HPLC grade methanol. Similarly, standard solution was spiked in crude extract, and same extraction method was followed. The percentage recovery was calculated as the amount recovered with respect to spiked concentration.
4.4. Real-Time Stability Analysis of TEF
Real time stability assay of TEF was measured in terms of GA-H content. TEF was incubated in humid and normal conditions at two different temperatures (25 °C and 37 °C). Sampling was performed at three-month intervals up to one year. The collected samples were processed immediately and analyzed the GA-H content in TEF. Besides real-time stability assessment, TEF was exposed to ultra-violet radiation to know the effect of UV radiation on its stability and immediately analyzed for GA-H content [29,30].
4.5. Pharmacokinetic Analysis of TEF
4.5.1. Animals and Treatment
Albino Wistar rats (8 weeks old, 180 ± 20 g) were obtained from the Central Animal House Facility of Jamia Hamdard. Animal housing and handling were executed in accordance with the Good Laboratory Practice (GLP) mentioned in CPCSEA guidelines. All experimental protocols were reviewed and approved by the Institutional Animal Ethics Committee (Registration No 173/GO/RE/S/2000/CPCSEA; approval number 1472). All animals were housed in polypropylene cages (not more than three animals per cage) with proper water and feed and were allowed to acclimatize with specified conditions (25 ± 3 °C and 60 ± 5%RH) for a week before the experiment. TEF at a dose of 85 mg/Kg was orally administered to overnight fasted rats. For oral administration, TEF was suspended in 0.1% carboxymethyl cellulose. After oral administration, blood samples were collected from retro-orbital plexus by using heparinized capillaries at 0 (pre-dose), 0.5, 1, 1.5, 2, 4, 6, 8, 10, 12, 16, 24, and 30 h. Blood samples were collected in EDTA tubes and centrifuged at 7000 rpm to get plasma. The separated plasma was stored at −60 °C until analysis. After oral administration of TEF, few animals were placed in metabolic cages, total urine was collected at 4, 12 and 24 h. The collected urine from each animal was pooled for analysis.
4.5.2. Sample Preparation
Liquid–liquid extraction was used for extraction of GA-H from plasma. In 100 µL of plasma, 500 µL of ice-cold methanol was added, vortexed, and incubated at −60 °C for 8 h. After incubation, it was brought to room temperature and centrifuged at 10,000 rpm for 10 min. The supernatant was separated and dried by passing liquid N2 gas. The dried extract was re-suspended with 100 μL of LC–MS grade methanol, sonicated for 10 min, centrifuged at 14,000 rpm for 10 min, supernatant separated, and then transferred into sample vials having insert for analysis. Similar sample preparation protocol and storage conditions were used for urine through liquid–liquid extraction.
4.5.3. Pharmacokinetic Calculation
The maximum plasma concentration (Cmax) and time to attain maximum concentration (Tmax) were directly assessed by plasma concentration–time graph. Other pharmacokinetic parameters, such as AUC, AUC0–t, AUC0–∞, half-life (t1/2), elimination rate constant (Kel), and volume of distribution (Vd), were calculated from plasma concentration vs. time profile response curve by non-compartmental analysis, using software Pkf Excel plug-in program [31].
4.6. In Vivo Pattern Recognition of TEF
For in vivo pattern recognition of TEF, it was orally administered to rats. After its oral administration, blood samples were collected at different time intervals. Prepared plasma samples of pharmacokinetic analysis (0.5, 1, 3, 6, 12, 24, 48, and 72 h) were used for this study. Samples were analyzed by ultra-performance liquid chromatography–mass spectrometry (UPLC–MS) analysis. The UPLC–MS was performed on Water’s ACQUITY UPLCTM system (Waters Corp., Milford, MA, USA) equipped with a binary solvent delivery system, an autosampler, column manager, and a tunable MS detector (Synapt; Waters, Manchester, UK). Chromatographic separation was performed on a Water’s ACQUITY UPLCTM BEH C18 (100.0 × 2.1 mm × 1.7 μm) column. The mobile phase used for chromatographic separation was 0.05% (v/v) formic acid in water (A) and 0.05% (v/v) formic acid in acetonitrile (B). Solvent elution was started with 5% B (0 min), then it was gradually increased to 100% B in 30 min, maintained for another 10 min, and then brought back to initial phase. The flow rate of mobile phase was 0.5 mL/min, and column temperature was set at 25 °C throughout the run time. The mass spectrometry was performed on a quadrupole orthogonal acceleration time of flight tandem mass spectrometer (Waters Q-TOF, Manchester, UK). The nebulizer gas was set to 500 L/h, the cone gas was set to 50 L/h, and the source temperature was set to 100 °C. The capillary voltage was set to 3.0 kV, and the sample cone voltage was set to 40 kV. Argon was employed as the collision gas at a pressure of 5.3 × 10⁻⁵ Torr. The Q-TOF was operated in positive mode with 1.0 min scan time and 0.02 s inter-scan delay. The accurate mass and composition for the precursor ions and the fragment ions were calculated by using MassLynx v 4.1 software incorporated with the instrument. Compounds were tentatively identified from database by comparing their reported m/z values with experimental values. Focus was given to the mass ranges from 130 to 600 m/z for lanosterol type triterpenoids and general terpene hydrocarbon. The databases used for identification of compounds were MassBank and HMDB.
Metabolomic comparison was performed with respect to analysis of TEF. For that, dried TEF was dissolved in LC–MS grade methanol and analyzed with same conditions used for plasma sample analysis. A correlation was established by analyzing metabolites present in blood before and after TEF administration and metabolites present in TEF. This metabolomic analysis was based on metabolites absorbed in blood after oral administration.
4.7. GC–MS Profiling of TEF
Around 100 mg of extract was dissolved in 1.0 mL methanol and vortexed for half an hour. Then, 100 µL methanolic solution was silylated by adding 100 µL of a mixture of N-methyl-N-trimethylsilyltrifluoroacetamide (MSTFA) and trimethylchlorosilane (TMCS) in pyridine (22:13:65 v/v/v) and then incubated at 30 °C for 2 h. The sample was cooled down quickly and re-constituted with 100 µL of hexane. Gas chromatography–mass spectrometry was performed in Agilent 7890A (Agilent Technologies, Santa Clara, CA, USA), equipped CTC-PAL, and auto-sampler attached with an MS detector. Two microliters of derivatized sample was injected with a 10:1 split ratio onto a 30 m × 0.25 mm × 0.25 μm HP-5 MS column (5% diphenyl and 95% dimethyl polysiloxane). Chromatographic separation was performed as per the reported method of our laboratory [32]. Separated compounds were identified by matching the spectrum from NIST library.
4.8. Statistical Correlation of Metabolites Presents in TEF
Principal component analysis (PCA) is an influential statistical tool used for analysis, pattern identification in terms of similarity, and differences among different groups, as validated in our previous publications [32]. It can be assumed that the category and sets of metabolites with specified m/z value in TEF of G. lucidum before and after oral administration of blood at different time intervals may be different. By implementing this concept, UPLC–MS analysis data and HPLC data were processed for statistical analysis. Both sets of data were converted into a table in which compound presence and absence were normalized as 1 and 0, respectively. The extended statistical module XLSTAT 2014.5.03 software was used to perform for PCA. The similarity, dissimilarity, and maximizing separability of TEF and in plasma metabolites at different time intervals were observed across the four quadrants.
4.9. Statistical Analysis
GraphPad Prism version 8.0.2 (GraphPad Software, 2365 Northside Dr. Suite 560, San Diego, CA USA) software was used for the statistical analyses. Two-way analysis of variance (ANOVA) was used to analyze data, and the differences were analyzed by using a multiple comparison (Bonferroni’s test). The results were expressed as (% recovery ± SEM). Differences were considered significant if p < 0.05.
5. Conclusions
Triterpenoid enriched fraction (TEF) was prepared from the fruiting bodies of G. lucidum in which GA-H was quantified by a newly developed and validated HPLC method. Upon oral administration of TEF, the rapid absorption of GA-H into systemic circulation was observed, and it showed longer systemic exposure. Metabolomic fingerprinting revealed that, apart from GA-H, TEF contains other bioavailable ganoderic acids. Based on GA-H content, TEF is stable for up to one year in both humid and normal atmospheric conditions at room temperature. Thus, prepared TEF from Indian varieties of G. lucidum can be explored as a potential phytopharmaceutical for unmet medical needs.
Supplementary Materials
The following are available online at https://www.mdpi.com/article/10.3390/metabo12020097/s1, Figure S1: Representative HPLC chromatogram of ganoderic acid H, Figure S2: Representative HPLC chromatogram ganoderic acid H in mixture of other standards, Figure S3: Representative HPLC chromatogram of TEF, Figure S4: UV spectrum of ganoderic acid H, Figure S5: Representative UHPLC chromatogram of TEF, Figure S6: UPLC-MS chromatogram of TEF extracted at MS 573 showing of GA-H at Rt 8.14 Min, Figure S7: Representative GC-MS chromatogram of TEF, Figure S8: Biplot derived from multivariate statistical analysis, Table S1: Robustness parameters of method validation, Table S2: Intra-day and inter-day precision data of method validation, Table S3. GC-MS profiling of TEF and unknown major compounds.
Author Contributions
Conceptualization, M.H.R.A., W.K., R.P., S.S. and S.A.; methodology, M.H.R.A., S.S. and W.K.; validation, M.H.R.A. and W.K.; investigation, M.H.R.A., W.K., R.P. and S.A.; data curation, M.H.R.A. and W.K.; writing—original draft preparation, M.H.R.A. and S.S.; supervision, M.H.R.A., W.K., R.P. and S.A.; project administration, S.A.; funding acquisition, M.H.R.A. and S.A. All authors have read and agreed to the published version of the manuscript.
Funding
This publication was made possible by a CSIR-SRF fellowship grant with file number 09/591(0153)/2018-EMR-I of the Council of Scientific and Industrial Research (CSIR). The ministry of Human Resources and Development (MHRD) provided scholarship and financial support to Mohd Hafizur Rehman Ansari to carry out of his partial research work.
Institutional Review Board Statement
The study was conducted according to the guidelines of the Declaration of Helsinki, and approved by the Institutional Review Board of Institutional Animal Ethics Committee, protocol code 1472.
Informed Consent Statement
Not applicable.
Data Availability Statement
The data presented in this study are available in Supplementary Materials.
Acknowledgments
The authors are thankful to CSIR, MHRD, India for funding.
Conflicts of Interest
The authors have no conflict of interest.
References
- Yang, Y.; Zhang, H.; Zuo, J.; Gong, X.; Yi, F.; Zhu, W.; Li, L. Advances in research on the active constituents and physiological effects of Ganoderma lucidum. Biomed. Dermatol. 2019, 3, 6. [Google Scholar] [CrossRef]
- Taofiq, O.; Heleno, S.A.; Calhelha, R.C.; Alves, M.J.; Barros, L.; González-Paramás, A.M.; Barreiro, M.F.; Ferreira, I.C.F.R. The potential of Ganoderma lucidum extracts as bioactive ingredients in topical formulations, beyond its nutritional benefits. Food Chem. Toxicol. 2017, 108, 139–147. [Google Scholar] [CrossRef] [PubMed] [Green Version]
- Hsu, C.L.; Yen, G.C. Ganoderic Acid and Lucidenic Acid (Triterpenoid). Protein Methyltransferases 2014, 36, 33–56. [Google Scholar] [CrossRef]
- Min, B.S.; Nakamura, N.; Miyashiro, H.; Bae, K.W.; Hattori, M. Triterpenes from the Spores of Ganoderma lucidum and Their Inhibitory Activity against HIV-1 Protease. Chem. Pharm. Bull. 1998, 46, 1607–1612. [Google Scholar] [CrossRef] [PubMed] [Green Version]
- Guo, X.Y.; Liu, D.; Ye, M.; Han, J.; Deng, S.; Ma, X.C.; Zhao, Y.; Zhang, B.; Shen, X.; Che, Q.-M. Structural characterization of minor metabolites and pharmacokinetics of ganoderic acid C2 in rat plasma by HPLC coupled with electrospray ionization tandem mass spectrometry. J. Pharm. Biomed. Anal. 2013, 75, 64–73. [Google Scholar] [CrossRef]
- Liang, C.; Tian, D.; Liu, Y.; Li, H.; Zhu, J.; Li, M.; Xin, M.; Xia, J. Review of the molecular mechanisms of Ganoderma lucidum triterpenoids: Ganoderic acids A, C2, D, F, DM, X and Y. Eur. J. Med. Chem. 2019, 174, 130–141. [Google Scholar] [CrossRef]
- Wang, X.M.; Yang, M.; Guan, S.H.; Liu, R.X.; Xia, J.M.; Bi, K.S.; Guo, D.A. Quantitative determination of six major triterpenoids in Ganoderma lucidum and related species by high performance liquid chromatography. J. Pharm. Biomed. Anal. 2006, 41, 838–844. [Google Scholar] [CrossRef] [PubMed]
- Jiang, J.; Grieb, B.; Thyagarajan, A.; Sliva, D. Ganoderic acids suppress growth and invasive behavior of breast cancer cells by modulating AP-1 and NF-κB signaling. Int. J. Mol. Med. 2008, 21, 577–584. [Google Scholar] [CrossRef] [Green Version]
- Gill, B.S.; Kumar, S. Navgeet Evaluating antioxidant potential of ganoderic acid A in STAT 3 pathway in prostate cancer. Mol. Biol. Rep. 2016, 43, 1411–1422. [Google Scholar] [CrossRef]
- Gill, B.S.; Kumar, S. Navgeet Ganoderic Acid A Targeting β-Catenin in Wnt Signaling Pathway: In Silico and In Vitro Study. Interdiscip. Sci. Comput. Life Sci. 2018, 10, 233–243. [Google Scholar] [CrossRef]
- Ahmad, M.F. Ganoderma lucidum: Persuasive biologically active constituents and their health endorsement. Biomed. Pharmacother. 2018, 107, 507–519. [Google Scholar] [CrossRef]
- Sanodiya, B.; Thakur, G.; Baghel, R.; Prasad, G.; Bisen, P. Ganoderma lucidum: A Potent Pharmacological Macrofungus. Curr. Pharm. Biotechnol. 2009, 10, 717–742. [Google Scholar] [CrossRef] [PubMed]
- Teekachunhatean, S.; Sadja, S.; Ampasavate, C.; Chiranthanut, N.; Rojanasthien, N.; Sangdee, C. Pharmacokinetics of Ganoderic Acids A and F after Oral Administration of Ling Zhi Preparation in Healthy Male Volunteers. Evid. Based Complement. Altern. Med. 2012, 2012, 1–7. [Google Scholar] [CrossRef]
- Jin, Z.; Wang, Y.; Ren, X.; Xie, H.; Gao, Y.; Wang, L.; Gao, S. Pharmacokinetics and Oral Bioavailability of Ganoderic Acid A by High Performance Liquid Chromatography-Tandem Mass Spectrometry. Int. J. Pharmacol. 2014, 11, 27–34. [Google Scholar] [CrossRef]
- Cheng, C.R.; Yang, M.; Guan, S.H.; Wu, X.H.; Pang, X.Y.; Wang, Y.; Yang, Y.; Ding, J.; Guo, D.A. Pharmacokinetics of ganoderic acid D and its main metabolite by liquid chromatography–tandem mass spectrometry. J. Chromatogr. B 2013, 930, 1–6. [Google Scholar] [CrossRef]
- Cor, D.; Knez, Z.; Knez Hrncic, M. Antitumour, Antimicrobial, Antioxidant and Antiacetylcholinesterase Effect of Ganoderma Lucidum Terpenoids and Polysaccharides: A Review. Molecules 2018, 23, 649. [Google Scholar] [CrossRef] [PubMed] [Green Version]
- Bhatt, A. Phytopharmaceuticals: A new drug class regulated in India. Perspect. Clin. Res. 2016, 7, 59. [Google Scholar] [CrossRef]
- Bakshi, M.; Singh, S. Development of validated stability-indicating assay methods—Critical review. J. Pharm. Biomed. Anal. 2002, 28, 1011–1040. [Google Scholar] [CrossRef]
- Weitzel, M.; Lee, S.M.; Smoot, M.; Viafara, N.; Brodsky, M. How to Meet ISO 17025 Requirements for Method Verification. ALACC Guide 2007, 18. [Google Scholar]
- Yang, M.; Wang, X.; Guan, S.; Xia, J.; Sun, J.; Guo, H.; Guo, D. Analysis of triterpenoids in Ganoderma lucidum using liquid chromatography coupled with electrospray ionization mass spectrometry. J. Am. Soc. Mass Spectrom. 2007, 18, 927–939. [Google Scholar] [CrossRef] [PubMed] [Green Version]
- Lai, G.; Guo, Y.; Chen, D.; Tang, X.; Shuai, O.; Yong, T.; Wang, D.; Xiao, C.; Zhou, G.; Xie, Y.; et al. Alcohol Extracts From Ganoderma lucidum Delay the Progress of Alzheimer’s Disease by Regulating DNA Methylation in Rodents. Front. Pharmacol. 2019, 10, 272. [Google Scholar] [CrossRef]
- Lawal, T.O.; Wicks, S.M.; Mahady, G.B. Ganoderma lucidum (Ling-zhi): The Impact of Chemistry on Biological Activity in Cancer. Curr. Bioact. Compd. 2016, 13, 28–40. [Google Scholar] [CrossRef]
- Wu, H.; Guo, J.; Chen, S.; Liu, X.; Zhou, Y.; Zhang, X.; Xu, X. Recent developments in qualitative and quantitative analysis of phytochemical constituents and their metabolites using liquid chromatography–mass spectrometry. J. Pharm. Biomed. Anal. 2013, 72, 267–291. [Google Scholar] [CrossRef] [PubMed]
- Luan, X.; Zhang, L.J.; Li, X.Q.; Rahman, K.; Zhang, H.; Chen, H.Z.; Zhang, W.D. Compound-based Chinese medicine formula: From discovery to compatibility mechanism. J. Ethnopharmacol. 2020, 254, 112687. [Google Scholar] [CrossRef]
- Adamec, J.; Jannasch, A.; Dudhgaonkar, S.; Jedinak, A.; Sedlak, M.; Sliva, D. Development of a new method for improved identification and relative quantification of unknown metabolites in complex samples: Determination of a triterpenoid metabolic fingerprint for the in situ characterization of Ganoderma bioactive compounds. J. Sep. Sci. 2009, 32, 4052–4058. [Google Scholar] [CrossRef] [PubMed]
- Worley, B.; Powers, R. Multivariate Analysis in Metabolomics. Curr. Metab. 2012, 1, 92–107. [Google Scholar] [CrossRef]
- Upton, R. American Herbal Pharmacopeia and Therapeutic Compendium: Reishi Mushroom, Ganoderma Lucidum. 2000. Available online: http://www.medicinacomplementar.com.br/biblioteca/pdfs/Fitoterapia/fi-0405.pdf (accessed on 8 December 2021).
- Kamal, A.; Khan, W.; Ahmad, S.; Ahmad, F.J.; Saleem, K. Development and validation of high-performance liquid chromatography and high-performance thin-layer chromatography methods for the quantification of khellin in Ammi visnaga seed. J. Pharm. Bioallied Sci. 2015, 7, 308–313. [Google Scholar] [CrossRef] [PubMed]
- Bajaj, S.; Singla, D.; Sakhuja, N. Stability Testing of Pharmaceutical Products. J. Appl. Pharm. Sci. 2021, 2, 129–138. [Google Scholar] [CrossRef]
- Cha, J.; Gilmor, T.; Lane, P.; Ranweiler, J.S. Stability Studies. In Separation Science and Technology; Academic Press: Cambridge, MA, USA, 2011; pp. 459–505. [Google Scholar]
- Zahiruddin, S.; Khan, W.; Nehra, R.; Alam, M.J.; Mallick, M.N.; Parveen, R.; Ahmad, S. Pharmacokinetics and comparative metabolic profiling of iridoid enriched fraction of Picrorhiza kurroa – An Ayurvedic Herb. J. Ethnopharmacol. 2017, 197, 157–164. [Google Scholar] [CrossRef] [PubMed]
- Khan, W.; Gupta, S.; Ahmad, S. Toxicology of the aqueous extract from the flowers of Butea monosperma Lam. and it’s metabolomics in yeast cells. Food Chem. Toxicol. 2017, 108, 486–497. [Google Scholar] [CrossRef]
Publisher’s Note: MDPI stays neutral with regard to jurisdictional claims in published maps and institutional affiliations. |
© 2021 by the authors. Licensee MDPI, Basel, Switzerland. This article is an open access article distributed under the terms and conditions of the Creative Commons Attribution (CC BY) license (https://creativecommons.org/licenses/by/4.0/).