Article

Metabolomics Signatures and Subsequent Maternal Health among Mothers with a Congenital Heart Defect-Affected Pregnancy

1
Arkansas Center for Birth Defects Research and Prevention, Fay W. Boozman College of Public Health, University of Arkansas for Medical Sciences, Little Rock, AR 72205, USA
2
Department of Environmental and Occupational Health, Fay W. Boozman College of Public Health, University of Arkansas for Medical Sciences, Little Rock, AR 72205, USA
3
Department of Epidemiology, Human Genetics, and Environmental Sciences, School of Public Health, University of Texas Health Science Center at Houston (UTHealth), Dallas, TX 75207, USA
4
Department of Pediatrics, Section of Hematology-Oncology, Baylor College of Medicine, Houston, TX 77030, USA
5
Department of Epidemiology, Fay W. Boozman College of Public Health, University of Arkansas for Medical Sciences, Little Rock, AR 72205, USA
*
Authors to whom correspondence should be addressed.
Metabolites 2022, 12(2), 100; https://doi.org/10.3390/metabo12020100
Submission received: 20 November 2021 / Revised: 13 January 2022 / Accepted: 15 January 2022 / Published: 21 January 2022
(This article belongs to the Section Advances in Metabolomics)

Abstract

:
Congenital heart defects (CHDs) are the most prevalent and serious of all birth defects in the United States. However, little is known about the impact of CHD-affected pregnancies on subsequent maternal health. Thus, there is a need to characterize the metabolic alterations associated with CHD-affected pregnancies. Fifty-six plasma samples were identified from post-partum women who participated in the National Birth Defects Prevention Study between 1997 and 2011 and had (1) unaffected control offspring (n = 18), (2) offspring with tetralogy of Fallot (ToF, n = 22), or (3) hypoplastic left heart syndrome (HLHS, n = 16) in this pilot study. Absolute concentrations of 408 metabolites using the AbsoluteIDQ® p400 HR Kit (Biocrates) were evaluated among case and control mothers. Twenty-six samples were randomly selected from above as technical repeats. Analysis of covariance (ANCOVA) and logistic regression models were used to identify significant metabolites after controlling for the maternal age at delivery and body mass index. The receiver operating characteristic (ROC) curve and area-under-the-curve (AUC) are reported to evaluate the performance of significant metabolites. Overall, there were nine significant metabolites (p < 0.05) identified in HLHS case mothers and 30 significant metabolites in ToF case mothers. Statistically significant metabolites were further evaluated using ROC curve analyses with PC (34:1), two sphingolipids SM (31:1), SM (42:2), and PC-O (40:4) elevated in HLHS cases; while LPC (18:2), two triglycerides: TG (44:1), TG (46:2), and LPC (20:3) decreased in ToF; and cholesterol esters CE (22:6) were elevated among ToF case mothers. The metabolites identified in the study may have profound structural and functional implications involved in cellular signaling and suggest the need for postpartum dietary supplementation among women who gave birth to CHD offspring.

1. Introduction

Congenital heart defects (CHDs) affect approximately 1% of all births in the United States [1,2,3]. These conditions represent a serious public health problem as they are a leading cause of death by disease in children [4,5,6], and those who survive often require repeated surgeries and hospitalizations. While understanding the etiologies of CHDs and outcomes among these children remains an important focus of research, much less is known about the outcomes among mothers who have children with these conditions.
This is particularly important, as disrupted metabolism related to the affected birth could impact long-term maternal health. Women with pregnancies affected by CHD have been reported with altered metabolic profiles and were associated with dysregulated metabolic pathways [7,8,9,10]. These markers were often utilized as predictive markers for fetuses with congenital heart defects. However, limited information is available on the mothers’ postpartum health outcome, which might influence not only the health of the mothers but also the children.
Pregnancy is characterized by substantial changes in metabolism and could influence subsequent health outcomes. Metabolomics is a relatively recent addition to omics-based platforms [11]. The biochemical pathways related to metabolic byproducts are measured via chromatographic or nuclear magnetic resonance platforms to estimate the effect of certain stressors in physiological systems [11,12,13,14,15,16]. It has been used to study the physiological impact of toxic exposures [17,18,19] and environmental pollutions [20,21,22,23].
Metabolomics has also been widely used to detect biomarkers in a variety of pathological conditions, including diabetes and insulin resistance [24,25,26], pediatric diseases [27,28], inborn errors of metabolism), cardiovascular diseases [29,30,31], cancers [32,33,34,35,36,37], and aging [38,39] and can serve as useful tools for drug development [40,41,42]. The change in the relative abundance of lipids, amino acids, or carbohydrates influenced by external and internal catalytic processes can offer valuable insights regarding progression of a disease or severity of their impact [43,44,45] and has the potential to predict maternal and perinatal health [46,47,48].
Recently, there have been important strides in improved detection thresholds, analyses, and linking biological pathways associated with diseases using metabolomics [49,50,51]. As they are likely to be an important biomarker of long-term maternal health, our objective was to characterize the metabolic alterations associated with CHD-affected pregnancies in this pilot study among post-partum women who participated in the National Birth Defects Prevention Study (NBDPS).

2. Materials and Methods

2.1. Study Design and Study Participants

Samples on case and control mothers were obtained from the National Birth Defects Prevention Study (NBDPS). Briefly, the NBDPS was a large case-control multicenter study of birth defects in the US, funded by the Centers for Disease Control and Prevention (CDC). The methods have been described previously [52]. Furthermore, subjects selected for this analysis were included in a subsequent follow-up study conducted in Arkansas (an NBDPS site) on maternal biomarkers and risk of offspring with CHDs [52].
Specifically, 550 mothers of cases with CHDs and 221 control mothers were recruited between March 2001 and June 2005. After receiving written informed consent, blood samples were obtained at least 6 weeks postpartum by standard venipuncture (up to 30 mL) and were immediately placed on ice and delivered to the laboratory for storage. Processed samples, including plasma, RBC, DNA, and urine, were aliquoted and stored in locked −80 °C freezers, which are only accessible to authorized study personnel and facility management.
The temperature of the freezer were continuously monitored by an electronic monitoring system and routinely monitored by the biorepository personnel to ensure the integrity of the samples. Prior to sample collection, participants were asked to refrain from eating for at least 3 h prior to the blood sample collection. For this assessment, we selected the following groups: (1) mothers of unaffected offspring (mControl, n = 18); (2) mothers of offspring with tetralogy of Fallot (mToF, n = 22); and (3) mothers of hypoplastic left heart syndrome (mHLHS, n = 16). These case groups were selected based on phenotypic severity. For this analysis, control mothers were matched to mothers of cases on age and race/ethnicity.

2.2. Targeted Metabolite Profiling

For the metabolomics assessment, 50 μL of plasma samples from 56 participants were used for the targeted metabolite profiling, and 26 out of 56 samples were randomly selected as technical repeats in the analytical run. Metabolomic profiling was conducted using a commercial reverse-phase liquid chromatography and tandem mass spectrometry (LC-MS/MS) kit (AbsoluteIDQ® p400 HR Kit, Biocrates Life Science AG, Innsbruck, Austria), including isotope-labeled internal standards of 408 metabolites from 11 compound classes as well as quality control samples and reagents for the derivatization and extraction of metabolites using multiple reaction monitoring (MRM) ion pairs for metabolite identification and quantification.
The complete analytical process was conducted by the Metabolomics Innovation Centre (TMIC) at the University of Alberta. In brief, the separation of amino acids and biogenic amines was performed using Thermo Vanquish UHPLC with a C18 column (Biocrates, Part 9120052121032) and guard column (Biocrates, Part 9120052121049). Analytes were separated using a gradient from 0.2% formic acid in water to 0.2% formic acid in acetonitrile as indicated in the gradient table below. The total UHPLC analysis time was approximately 5.8 min per sample.
Acylcarnitines, monosaccharides (hexose), diglycerides, triglycerides, lysophosphatidylcholines, phosphatidylcholines, sphingomyelins, ceramides, and cholesteryl esters were analyzed by flow injection analysis (FIA) with a total analysis time of approximately 3.1 min per sample. Biocrates provided the FIA mobile phase buffer (Part 9120052121018), which was diluted into LC-MS grade methanol for use with the kit per the manufacturer’s instructions.
Using electrospray ionization in positive ion mode, samples for both UHPLC and flow injection analysis were introduced directly into Q Exactive™ Orbitrap MS systems operating in the full scan or parallel reaction monitoring (PRM) mode. Acquisition methods and tune parameters for all instruments were provided by Biocrates as part of the p400H kit. Data analysis was performed using MetIDQ provided by Biocrates.

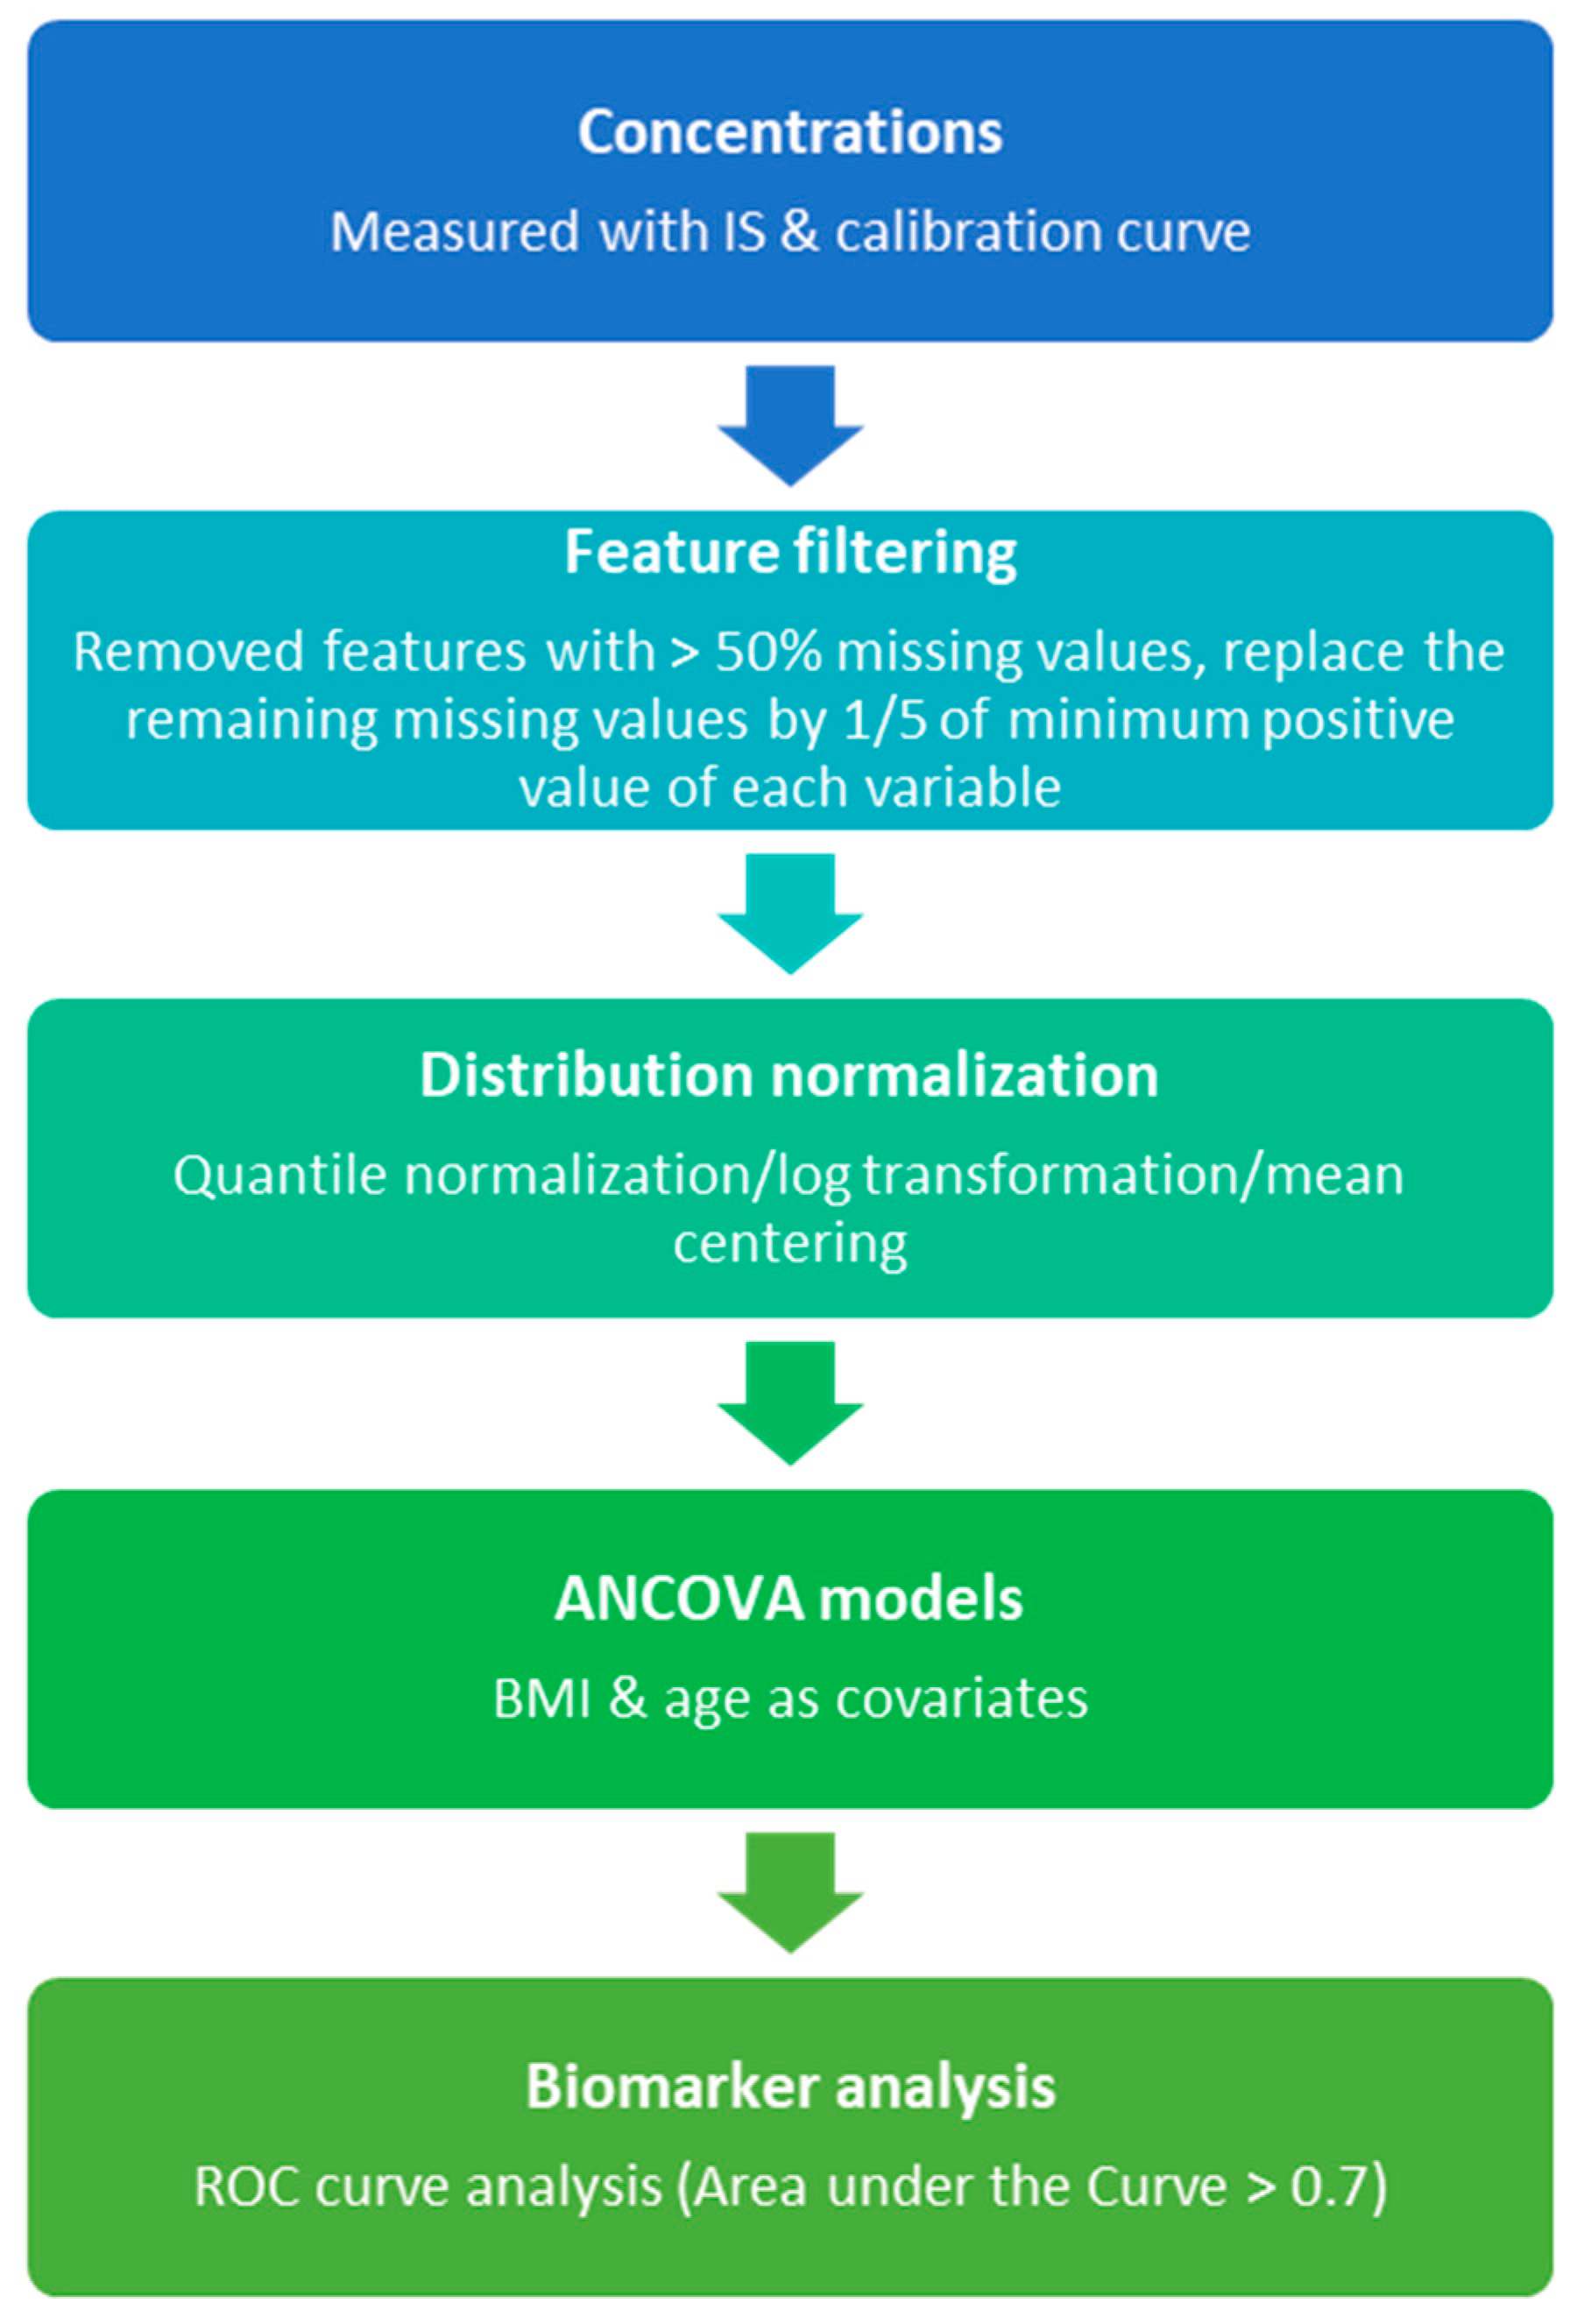
2.3. Metabolomics Data Analysis

Metabolomics data were processed using MetaboAnalyst 4.0 [53]. Metabolites below the limit of detection (LOD) were replaced by a value half of the minimum peak intensity of the entire dataset. Quantile normalization was conducted to reduce sample-to-sample variation, followed by log2 transformation to ensure that the data followed the assumptions of normality and further by mean center scaling to diminish the error in multivariate analysis.
Principal component analysis (PCA) as well as hierarchical clustering were constructed using the Partek Genomics Suite (St. Louis, MO) to obtain a 2- and 3-dimensional visualization of the profiles. Analysis of covariance (ANCOVA) adjusting for maternal age at delivery and body mass index (BMI) with Fisher’s least significant difference contrast method was used to assess the differential metabolites univariately.
A significance level of p < 0.05 was used to define statistical significance. Based on the significant metabolites (p < 0.05), we developed a classification model using a logistic regression with the receiver operating characteristic curve (ROC curve) and the associated area under the curve (AUC) to estimate the predictive accuracy for differentiating between cases and controls. The flowchart describes the primary steps involved in the data-analyses (Figure 1).

2.4. Pathway Analysis

The pathway enrichment was performed using the set of significant metabolites from the following comparisons (1) mControls compared to mToF and (2) mControls compared to mHLHS. The HMDB IDs were mapped onto their corresponding KEGG IDs. The pathway enrichment followed the associated diffusion matrix threshold using the selection criteria of enrichment p < 0.01 with a minimum of 20 pathways and 250 individual nodes comprised of pathways, enzymes, compounds (metabolites), and associated reactions. Final list of pathways were manually rendered based on most relevant metabolic networks associated with the maternal health affected by the CHD pregnancies. Separate network graphs were generated for the two comparisons described using Cytoscape v.3.8.2.

3. Results

3.1. Characteristics of Study Participants

Participants in this study (n = 56) were predominantly of European descendent (91%, see Table 1). The mean age of study participants was 26.5 (range 16–36, SD = 5.5) years, with an average pre-pregnancy BMI of 25.8 kg/m2 (range 16.1–44.6 kg/m2, SD = 6.5), average post-partum BMI of 30.5 kg/m2 (range 21.3–46.9 kg/m2, SD = 5.8), and weight change of 12.7 kg (range 0–38.6, SD = 7.0). High blood pressure was observed among nine women. Notably, none of the variables were significantly different while comparing mHLHS and mToF with mothers of controls (Table 1).

3.2. Targeted Metabolomics Profiling

A total of 408 metabolites were assayed, with an average limits of detection (LOD) detailed in the Table S1. Eight metabolites were not detected in all of our samples, including PC (30:3), PC-O (33:4), TG (56:9), acetyl-Ornithine, carnosine, dopamine, histamine, and phenylethylamine. Therefore, 400 metabolites were included in the final analysis. Summary of data processing results, including the number of metabolites imputed due to missing or below LOD value can be seen in Table S2.
Twenty-six samples serving as technical repeats were randomly selected and distributed among all samples. The high correlation between samples and its repeats represented the reliability of the detection technology (Figure S1). The year of sample collection from 18 control samples ranged from the year 1999 to 2008 and did not show any mass spectrometer variations base on the PCA plot shown in Figure S2.

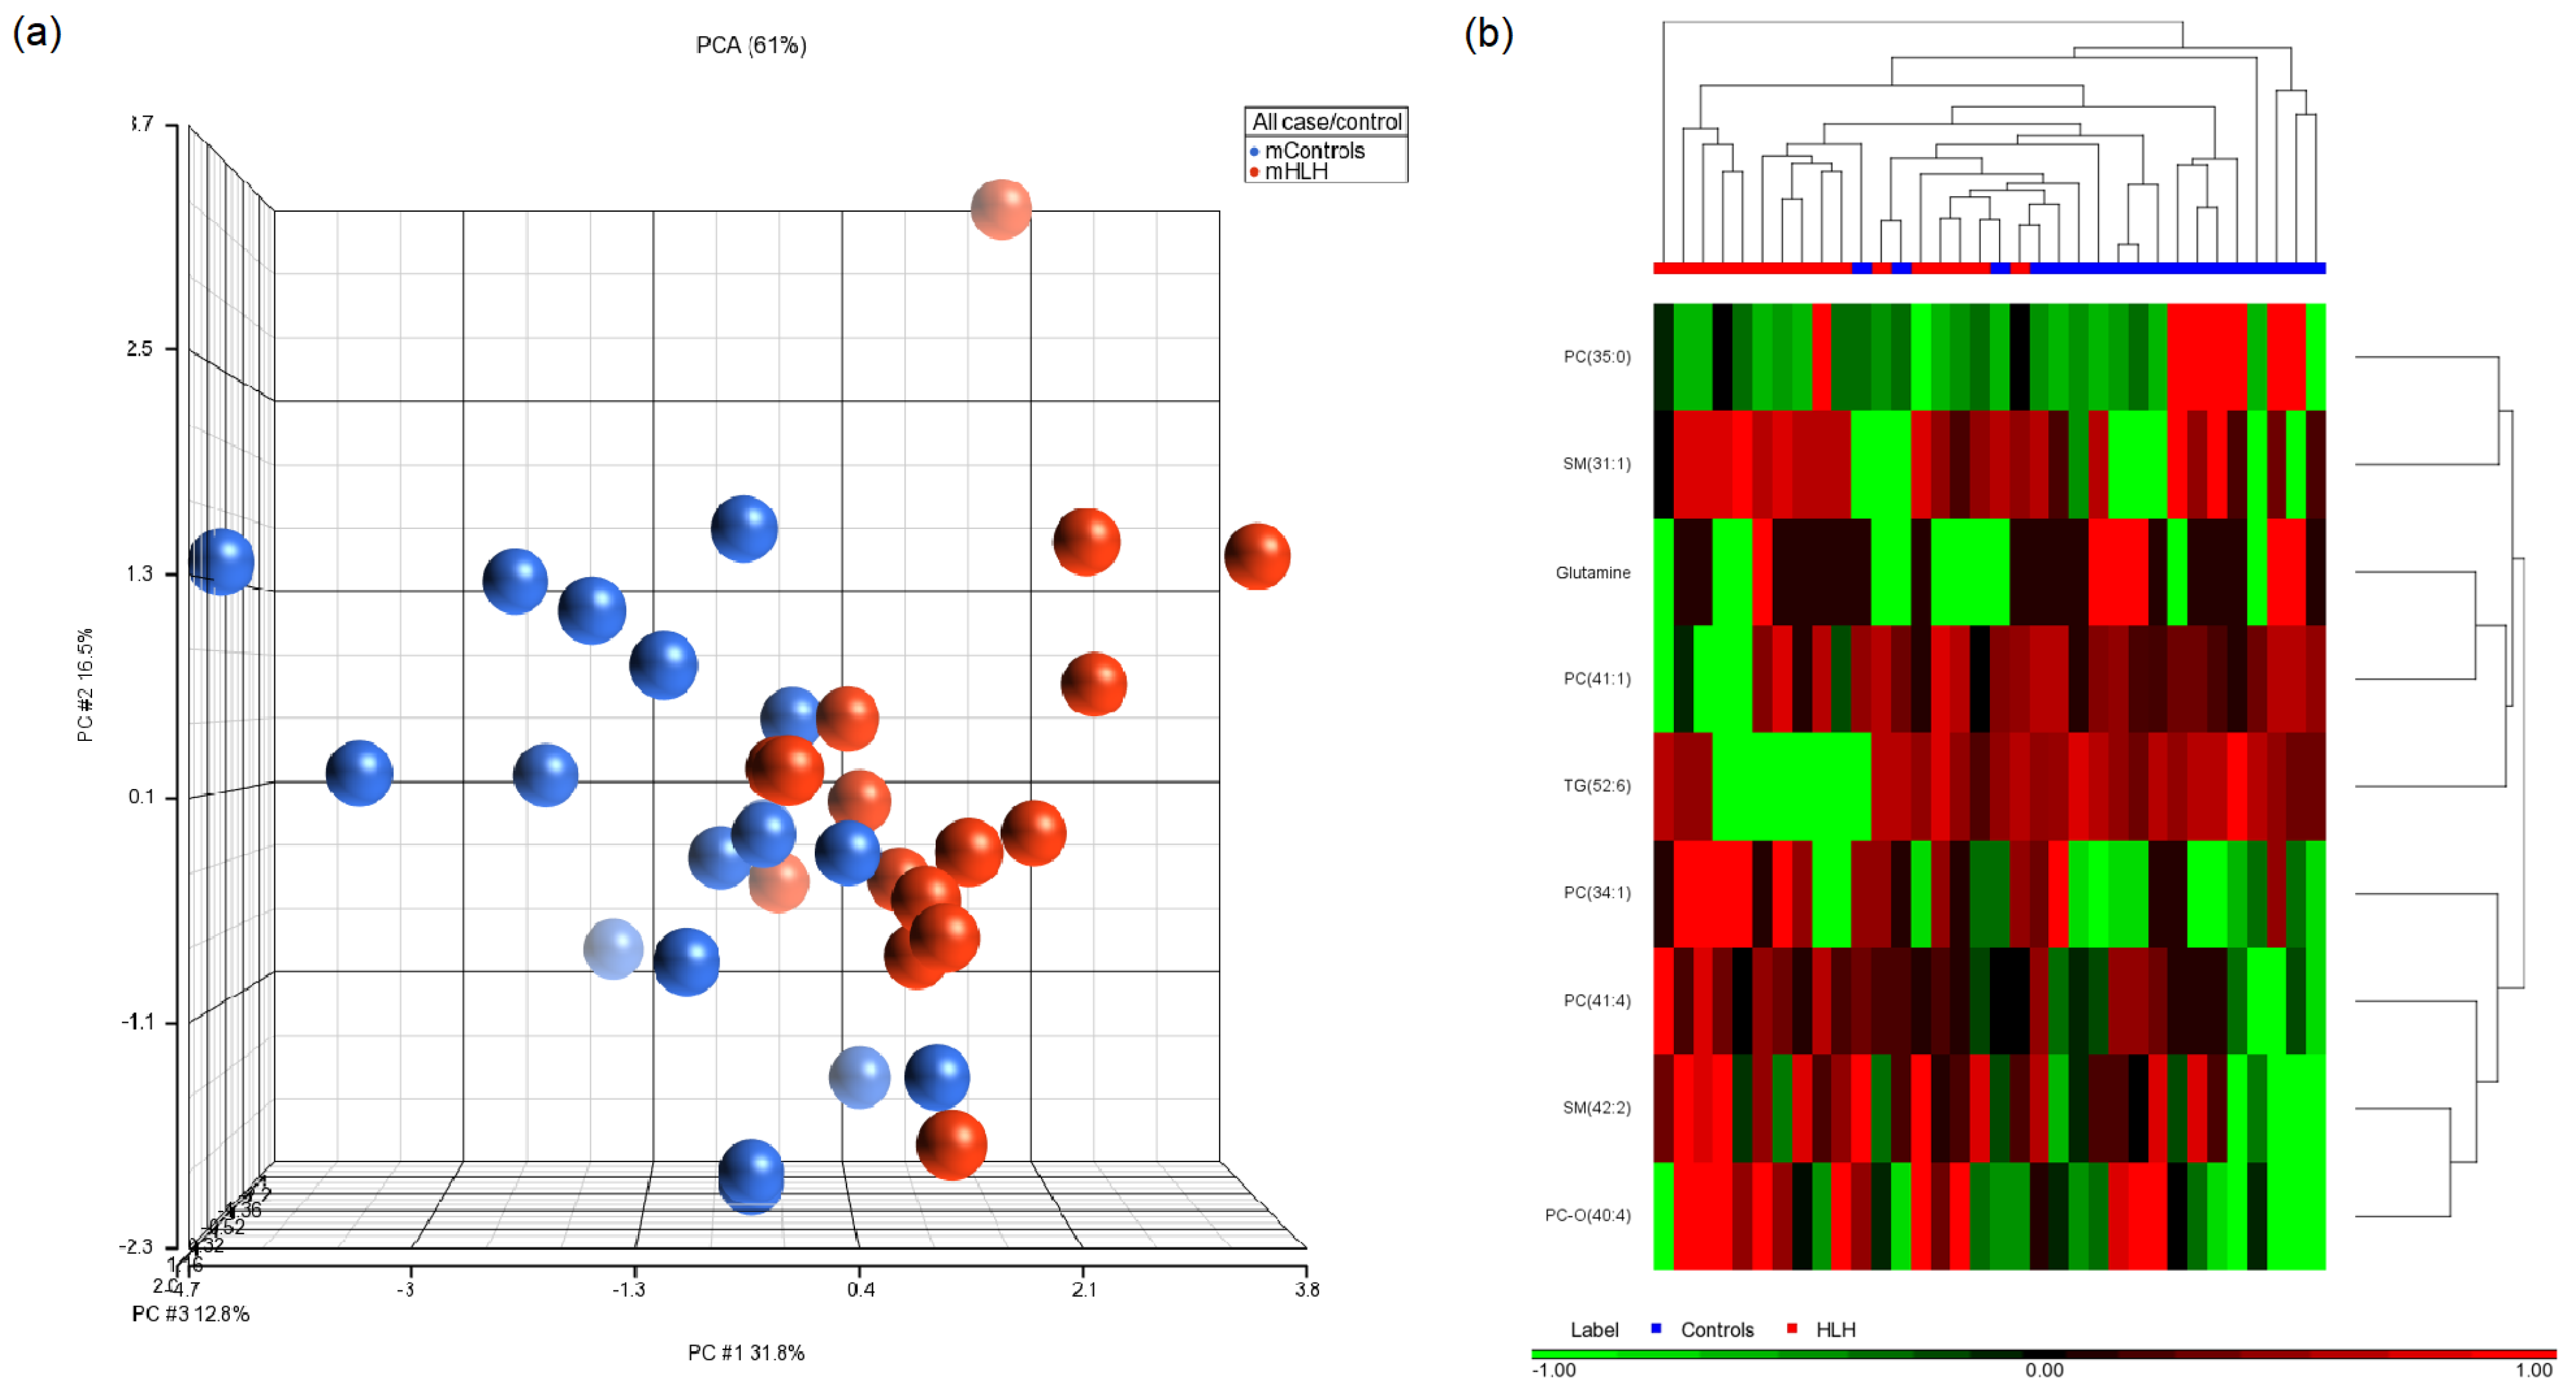
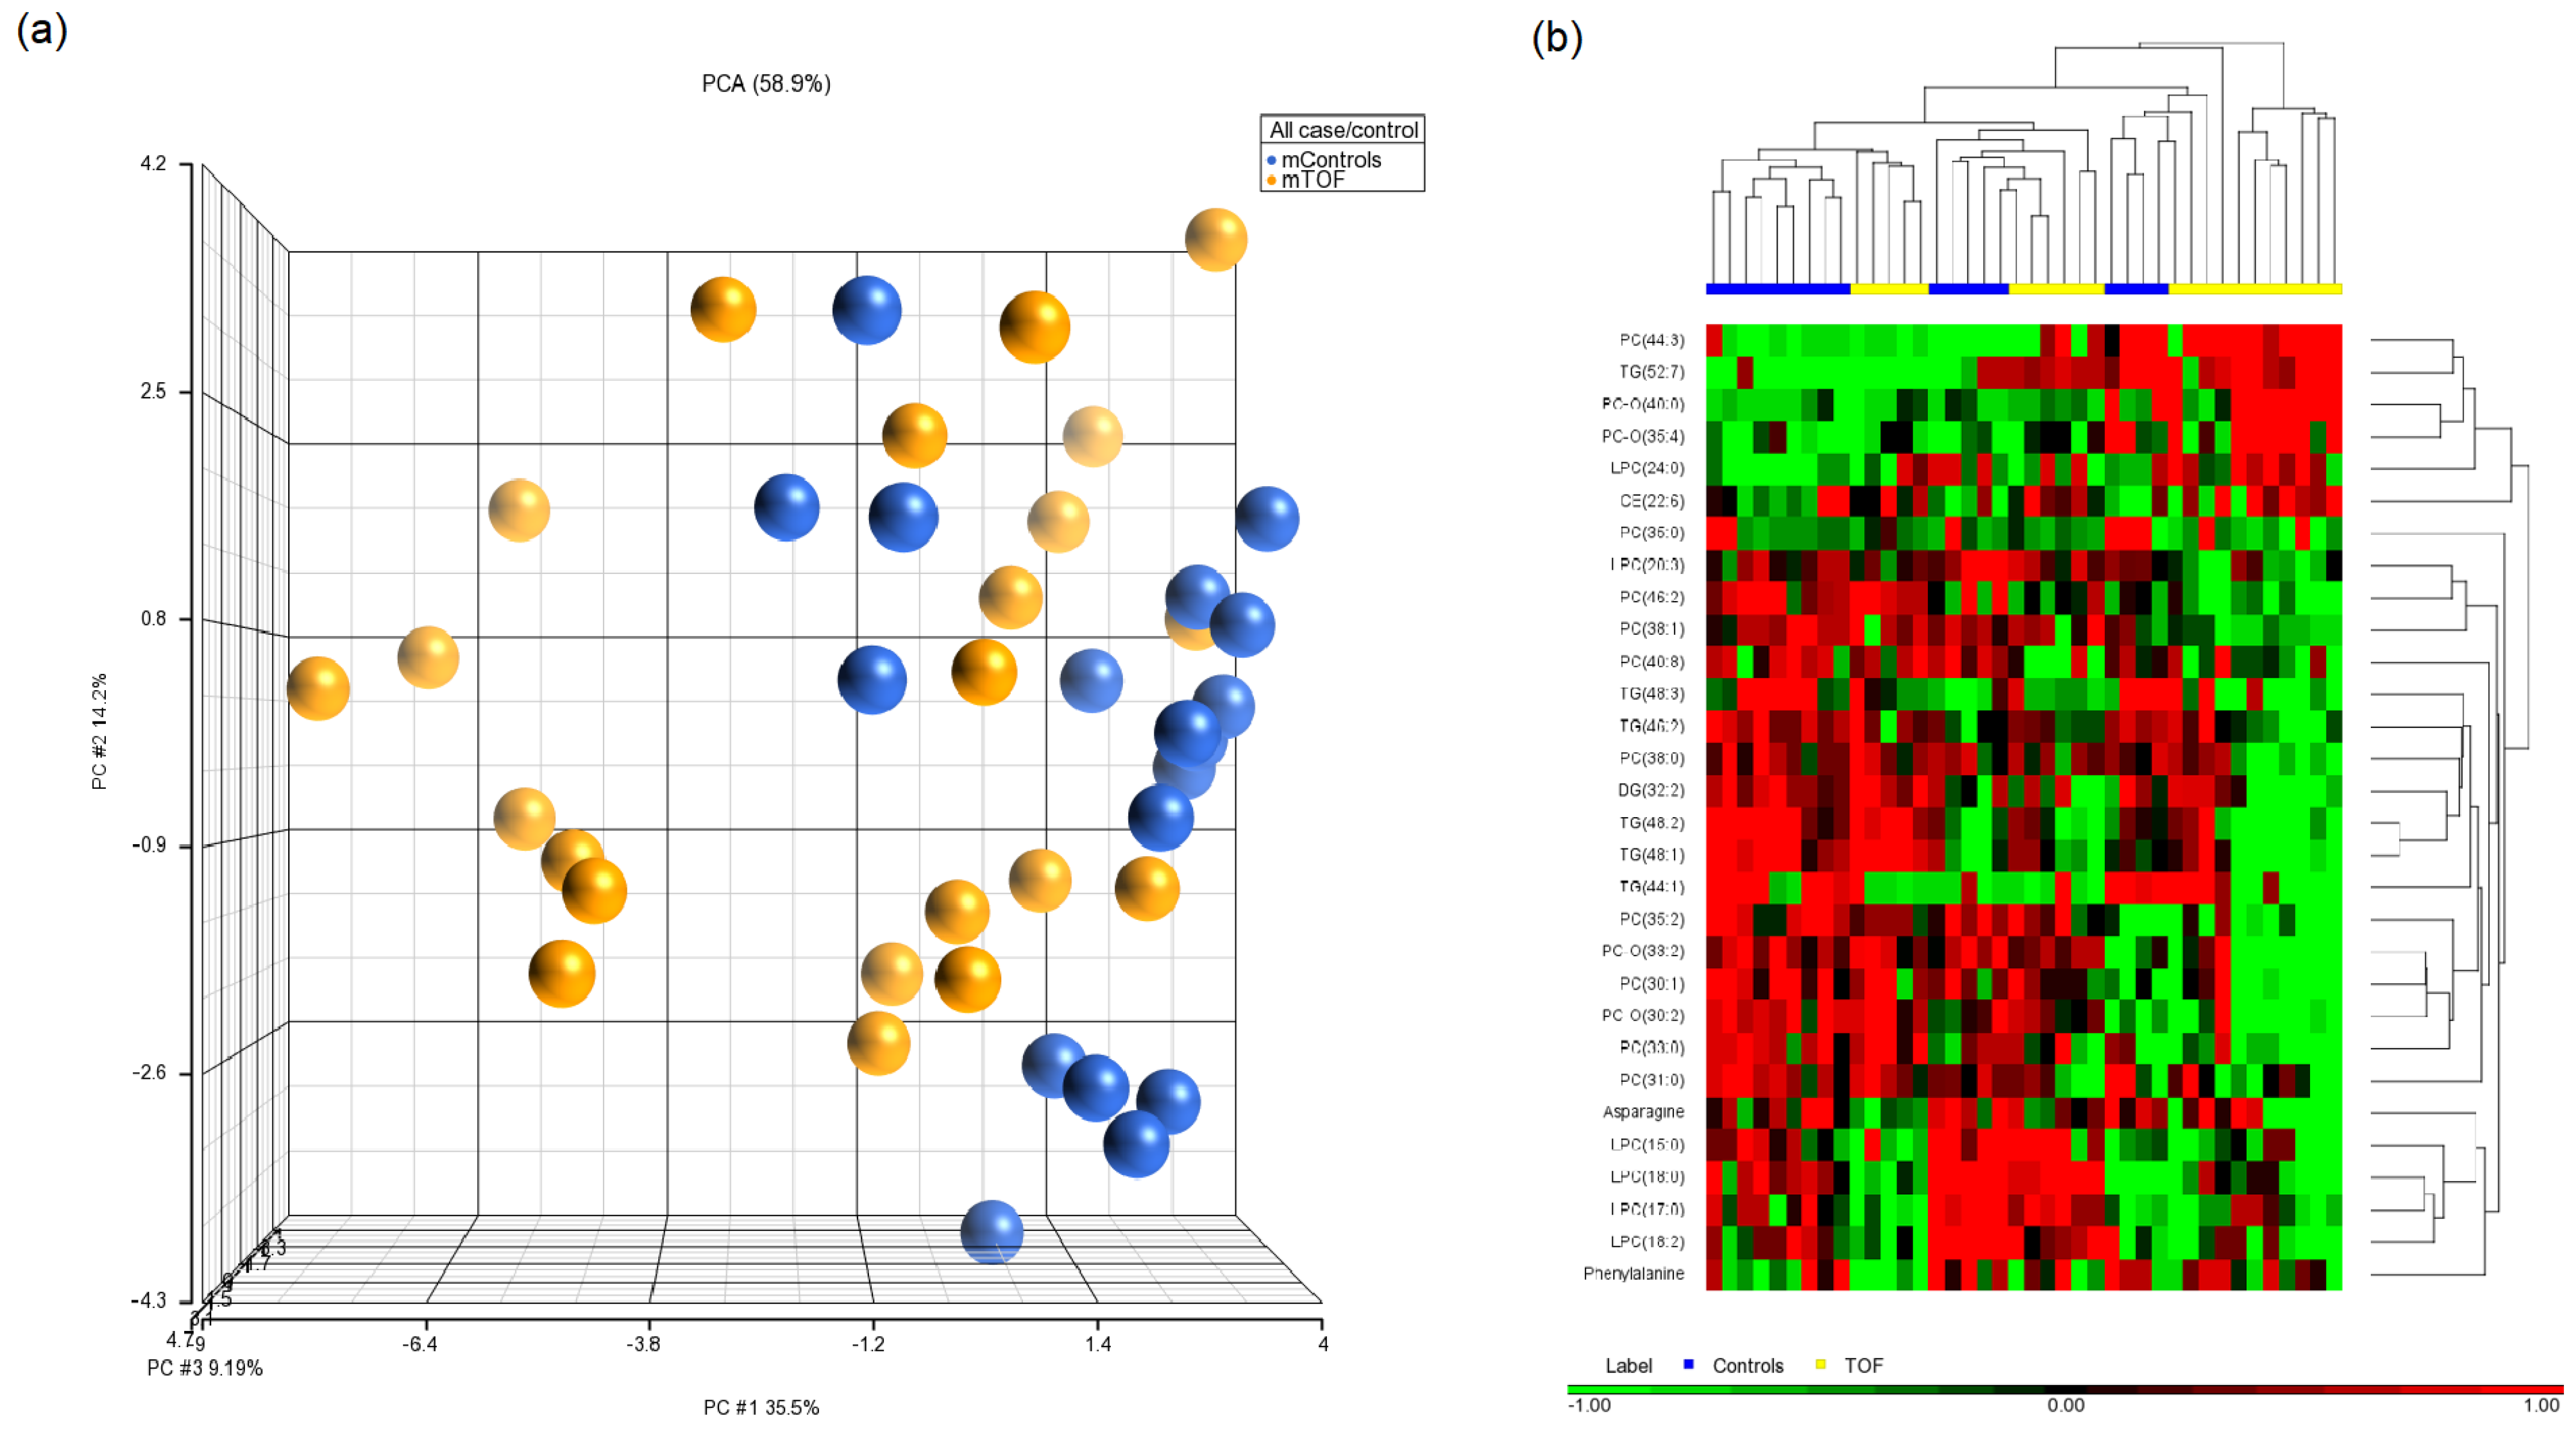
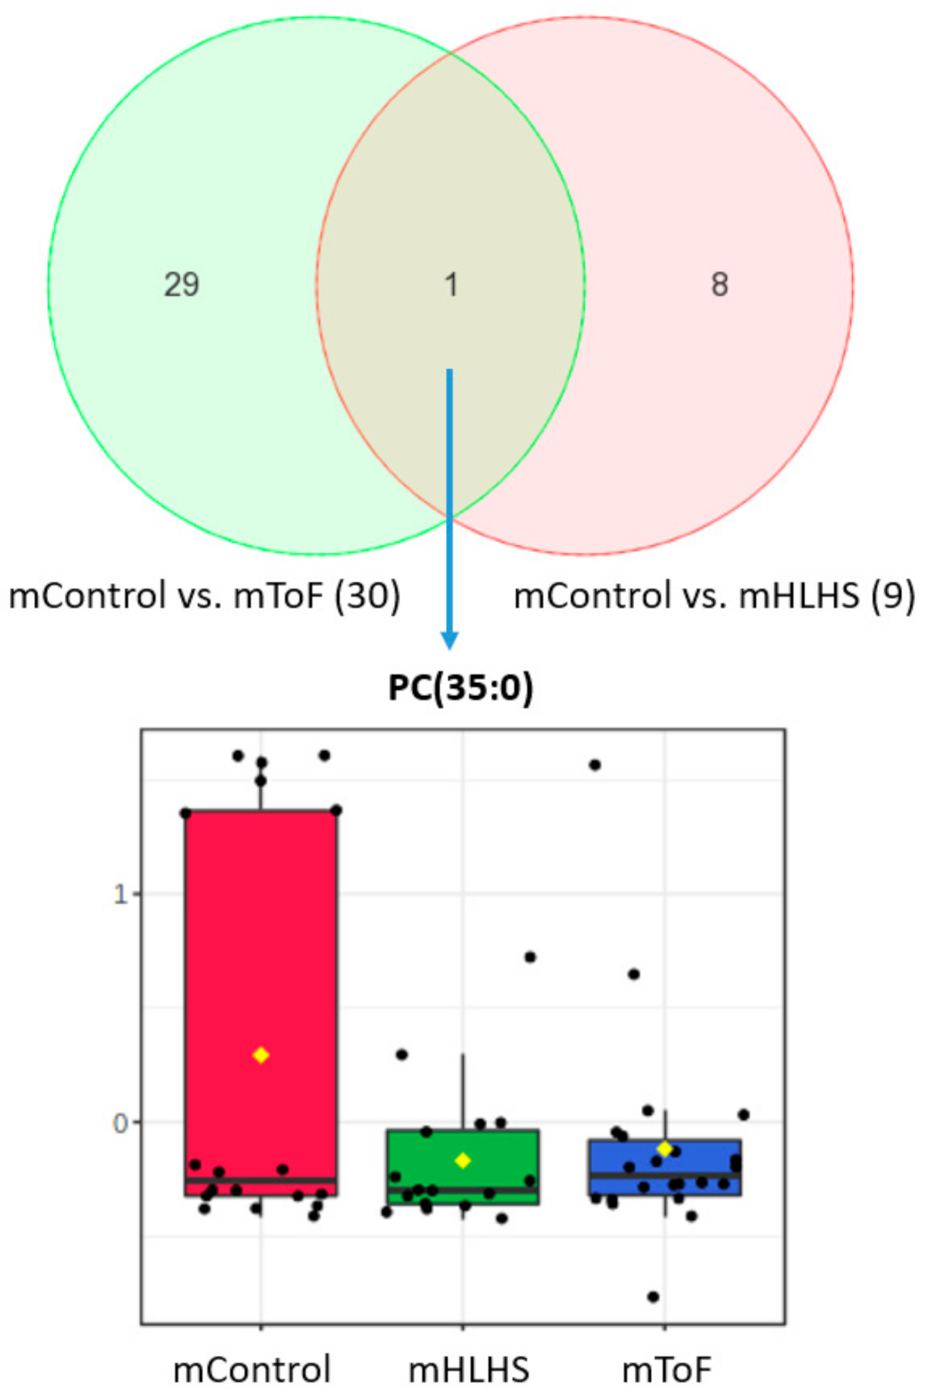
3.3. Maternal Metabolites Associated with CHD-Affected Pregnancies

PCA modeling and hierarchical clustering of the significant metabolites demonstrated separation of metabolomic profiles between mControl vs. mHLHS (Figure 2a,b). In the ANCOVA model, adjusting for maternal age at delivery and BMI (Figure S3a), we identified nine metabolites that were significantly different between the mothers of cases vs. mothers of controls (p < 0.05).
Among those metabolites, PC (34:1), PC (41:4), SM (31:1), SM (42:2), and PC-O (40:4) were consistently higher among HLHS. TG (52:6), PC (41:1), glutamine, and PC (35:0) were lower among mHLHS than mControls (Table 2). In the assessment of ToF-affected pregnancies (Figure 3a,b), we identified 30 metabolites that were significantly different between mToF and control mothers (p < 0.05) using the ANCOVA model adjusting for maternal age at delivery and BMI (Figure S3b). Among those metabolites, six were higher in mToF, whereas 24 were lower among mToF (Table 3). When comparing significant metabolites from both analyses, PC (35:0) was the only metabolite consistently lower among mHLHS and mToF women compared with mControls (Figure 4).

3.4. Biomarker Analysis

Based on the ROC analyses among mHLHS, four out of nine metabolites presented with higher classification potentials (AUC values > 0.70). These included: PC (34:1) (AUC: 0.74, 95%: 0.56–0.89); SM (31:1) (AUC: 0.72, 95%: 0.52–0.88); SM (42:2) (AUC: 0.70, 95%: 0.51–0.87); and PC-O (40:4) (AUC: 0.76, 95%: 0.59–0.90) (Figure 5a–d). For mothers of ToF cases, 5 out of the 30 significant metabolites presented with higher classification potentials. These include: LPC (18:2) (AUC: 0.71, 95%: 0.54–0.87); TG (46:2) (AUC: 0.71, 95%: 0.54–0.86); LPC (20:3) (AUC: 0.71, 95%: 0.52–0.85); CE (22:6) (AUC: 0.74, 95%: 0.57–0.89); and TG (44:1) (AUC: 0.73, 95%: 0.55–0.88) (Figure 6a–e).

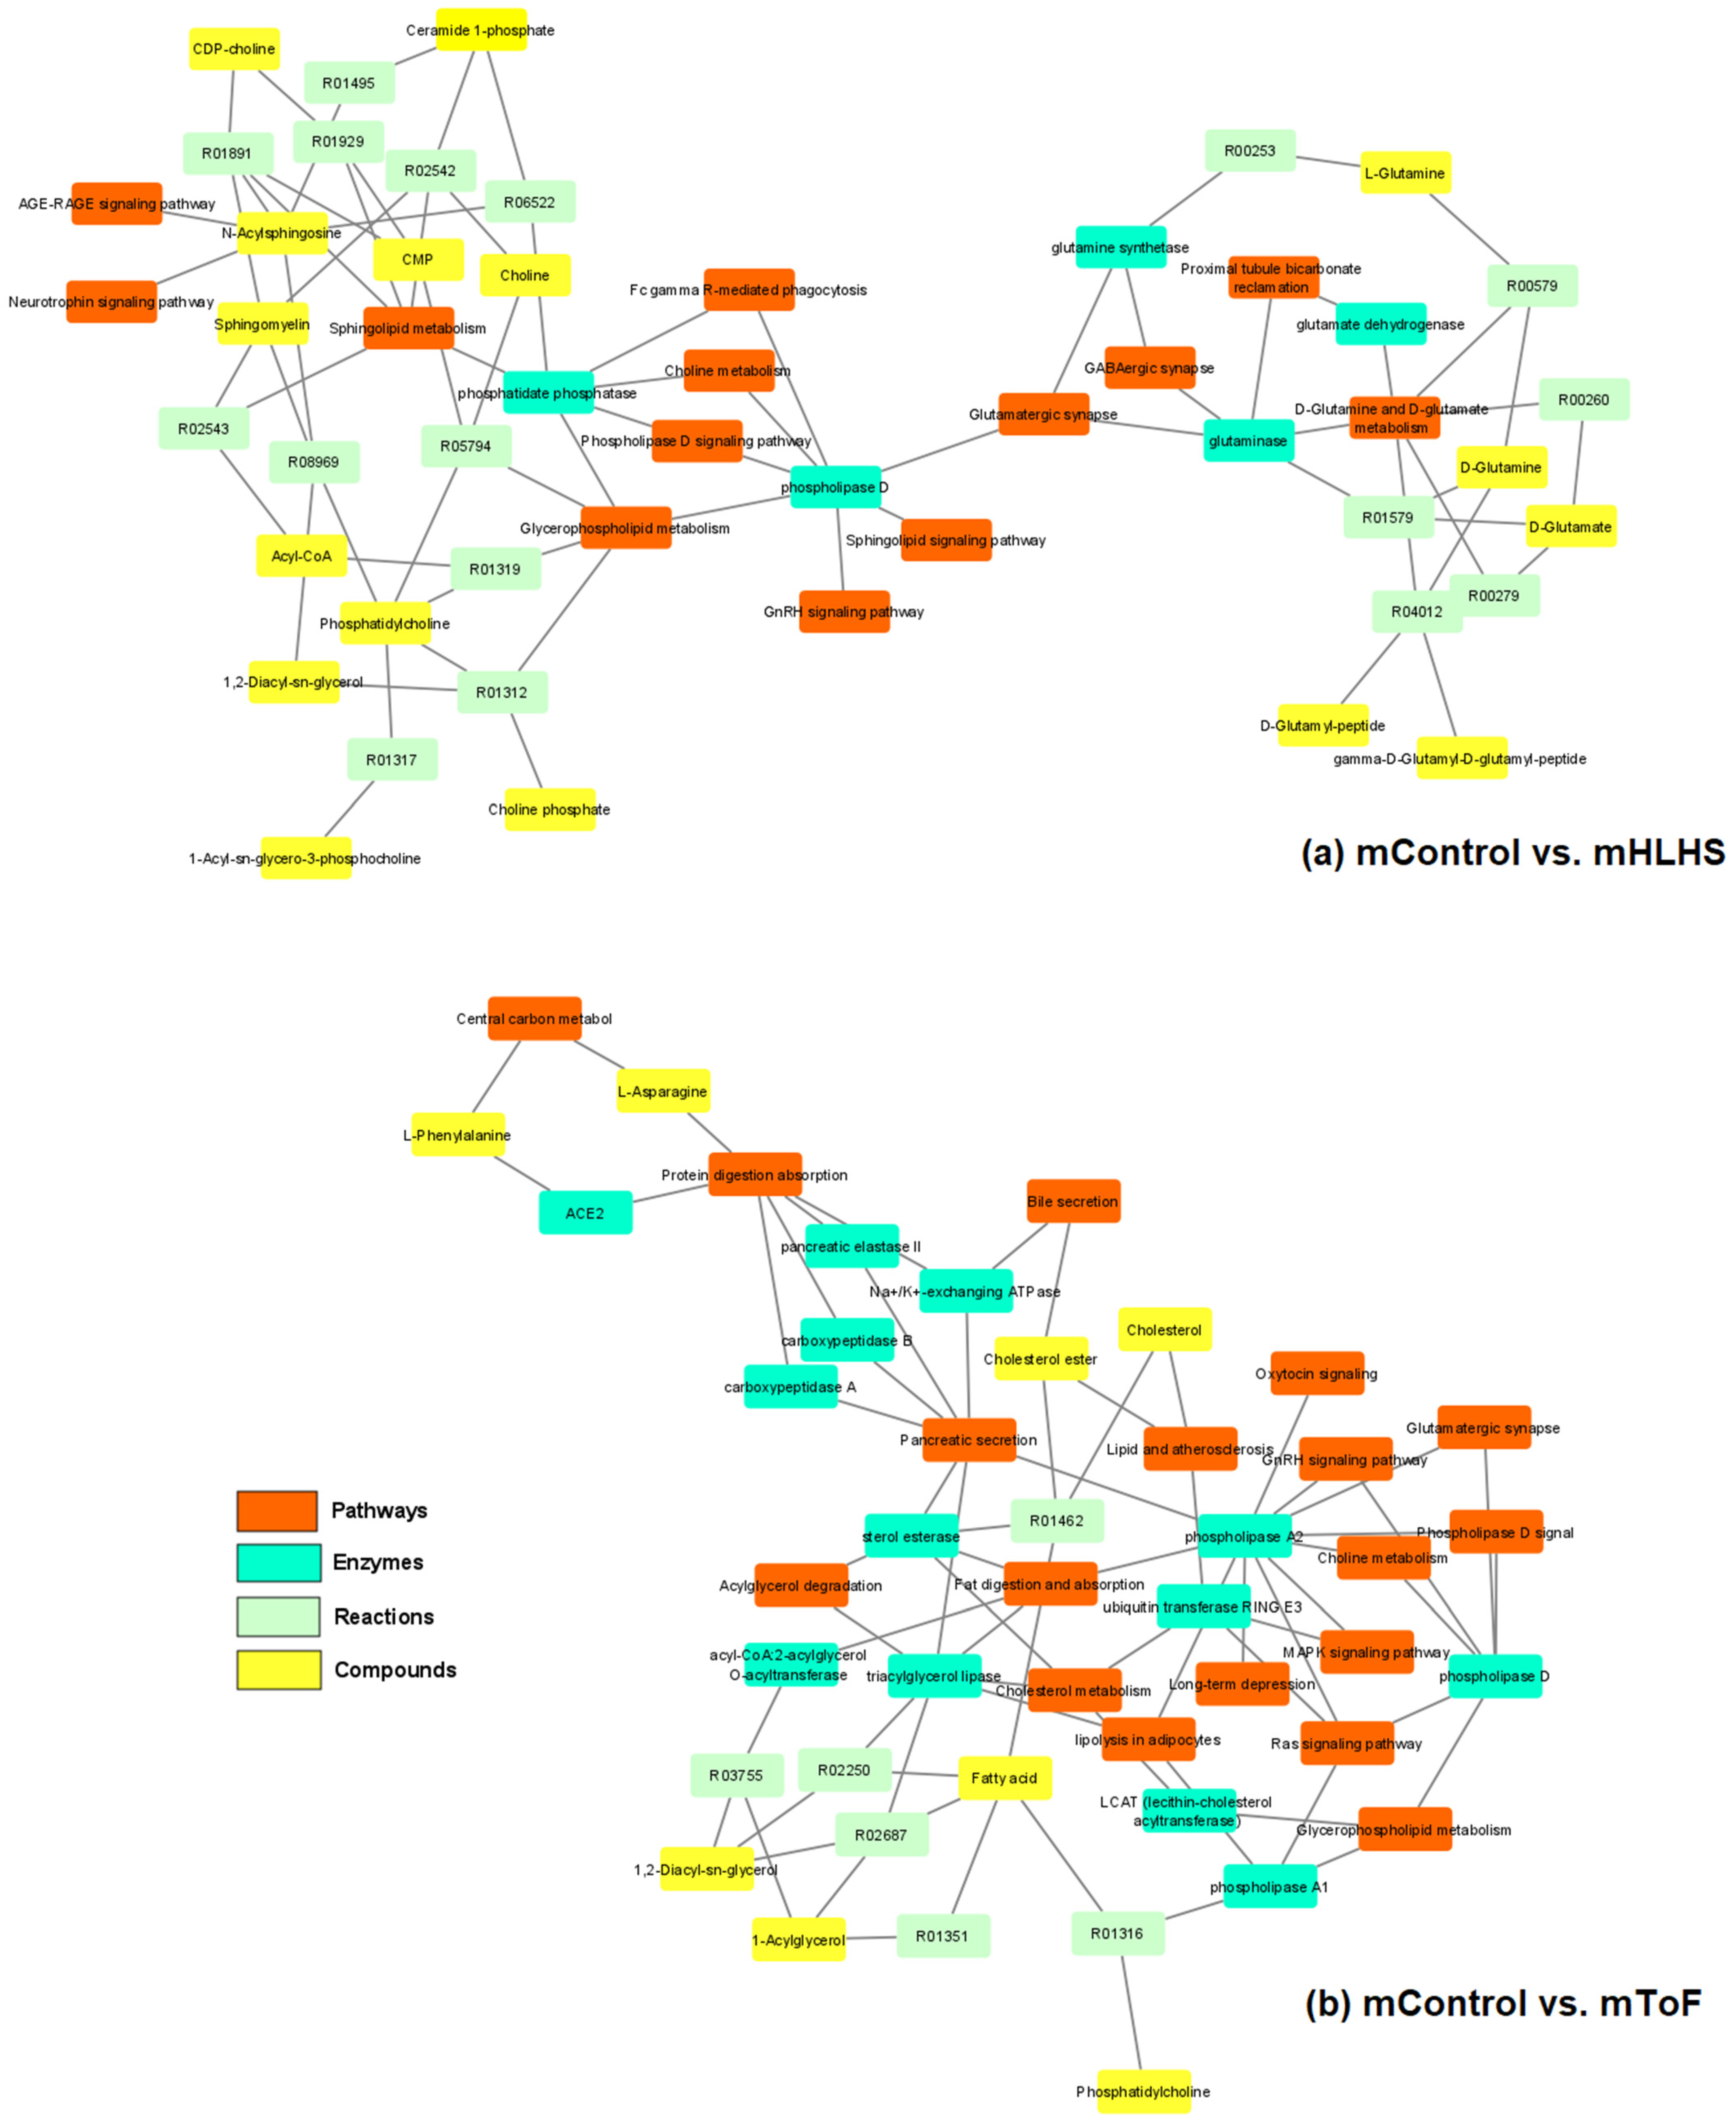
3.5. Pathway Analysis

From the pathway analysis using the nine metabolites identified in the mHLHS analysis, 13 pathways were significantly projected to the network (p < 0.01, Figure 7a), with the D-glutamine and D-glutamate metabolism, sphingolipid metabolism, sphingolipid signaling pathway, glutamatergic synapse, and proximal tubule bicarbonate reclamation as the top pathways affected (p = 1 × 10⁻⁶). From the pathway analysis using the 30 metabolites identified in the mToF analysis, 18 pathways were significantly projected to the network (p < 0.01, Figure 7b) with the glutamatergic synapse, long-term depression, GnRH signaling pathway, pancreatic secretion, central carbon metabolism, choline metabolism, lipid and atherosclerosis, and acylglycerol degradation as the top pathways affected (p = 1 × 10⁻⁶).

4. Discussion

Overall, we found that mothers of children with CHDs had metabolomic profiles associated with phospholipid and glutamate metabolism, suggesting that CHD-affected pregnancies may have an influence on the long-term maternal metabolic health. This is particularly notable as CHDs are the most prevalent of birth defects [54] occurring in 8–10 of every 1000 live births in the US [55,56,57,58]. This is one of the first studies to evaluate subsequent maternal health in this population, which provides new insights into disrupted metabolic pathways associated with CHD-affected pregnancies.
Specifically, among mothers with HLHS-affected pregnancies, we observed higher levels of PC (34:1) (also known as PC aa C34:1) and PC-O (40:4) (phosphatidylcholine with an alkyl ether substituent, also known as PC ae C40:4) when compared to mothers of controls. Glycerophospholipids are lipids composed of glycerol, two fatty acids, phosphate, and an amino alcohol. They are ubiquitous in cell membranes and are involved in the metabolism of cell signaling and permeability as well as maintaining the structural integrity of cell membranes.
Phosphatidylcholine (PC) is the most abundant phospholipid in mammalian cell membranes comprising ~50% of the total phospholipid mass of most cells and their organelles depending on the cell types [59]. Changes in the PC profiles were linked with metabolic disorders, such as atherosclerosis, insulin resistance, and obesity [60]. Additionally, PC (34:1) has been identified as part lipid profiles in mother-infant pairs, with levels being more abundant in mothers than their infants [61].
Levels of PC (35:0), a glycerophospholipid lecithin, is the only metabolite consistently lower among women who had HLHS- and ToF-affected pregnancies (Figure 4). Lecithin can be found in many foods, including soybeans and egg yolks, and has been shown to reduce hypercholesteremia and atherosclerosis [62]. These changes could point to novel interventions (e.g., dietary supplementation) among women who gave birth to children with CHDs.
Lysophosphatidylcholine (LPC), also known as lysolecithins, has received increased attention in relation to cardiovascular diseases. It is a class of lipid biomolecule derived by the cleaving of PC through the phospholipase A2 (PLA2) enzyme [63] or through the conversion of fatty acids to free cholesterol via lecithin-cholesterol acyltransferase (LCAT) [64]. Plasma LPCs have been shown to be inversely associated with cardiovascular disease [65,66,67] but have not been directly implicated in embryonic cardiac development.
In our study, we observed lower levels of LPC (18:2) (also known as lysoPC a C18:2) and LPC (20:3) (also known as lysoPC a C20:3) among women with ToF offspring compared with the controls (Table 3 and Figure 6). Bahado-Singh et al. also reported lower levels of maternal serum LPC (18:2) and LPC (20:3) among mothers of children with CHDs when compared to the mothers of controls [10]. In their study, 17 out of 27 total CHD cases were ToF defects, including double outlet right ventricle (DORV)/ToF (two cases), ToF alone (nine cases), ToF/mitral stenosis (one case), and ToF/pulmonary atresia (five cases) [10].
Complex changes occur in lipid profiles during pregnancy. The TG, total cholesterol (TC), low-density lipoprotein cholesterol (LDL-C), and high-density lipoprotein cholesterol (HDL-C) all increase significantly by the third month or at the end of the first trimester in response to elevated estrogen levels and insulin resistance [68]. The increase in the lipid metabolism during pregnancy aids the nutrient and energy sources for the fetus. In our study, lower levels of TG (44:1) and TG (46:2) were observed among women with ToF offspring than controls (Table 3 and Figure 6), reflecting the altered metabolic health of CHD-affected pregnancies.
Pathway analyses revealed changes in the D-glutamine and D-glutamate metabolism when comparing HLHS with controls and the glutamatergic synapse when comparing ToF with controls. Glutamine is the most abundant amino acid in humans. It plays a critical role in stimulating blood flow and increases blood fluidity by the synthesis of nitric oxide [69,70]. It can be transported into cells and further metabolized to glutamate by the mitochondrial enzyme glutaminase.
There are strong lines of evidence demonstrating that fundamental role of glutamine in maintaining cardiovascular health [71], and altered D-glutamine and D-glutamate metabolisms were identified as significantly impacted pathways among adults with congenital heart disease when compared with healthy controls [72]. Furthermore, glutamine supplements have also been shown to improve the cardiac function of patients with chronic heart failure [73]. We were unable to find any reports published in English in PubMed of glutamine among women with CHF-affected pregnancies. Further study is needed to confirm with the potential of using glutamine as dietary supplement to improve maternal health.
Our study must be considered in the light of certain limitations. The main limitation from our study was the small sample size for each CHD-subtype, which limits the statistical precision in our models. The time of blood collection was not available in this study, and might contribute to the variations in the metabolome.
Although we found no significant differences between the groups regarding pre-existing metabolic syndromes during pregnancy, such as high blood pressure and Type II Diabetes, pre-pregnancy plasma samples were not available, and thus the differences observed may be explained by other factors than CHD-affected pregnancy, such as environmental exposures [74,75], pre-existing metabolic conditions, and lifestyle factors before or during pregnancy [76,77,78].
In this pilot study, we demonstrated the feasibility of using targeted metabolomics to identify biomarkers for cardiometabolic health among mothers with a CHD-affected pregnancy. Since CHD is a rare condition with various subtypes, it is challenging to obtain a large patient base in a single biomarker study [10,79,80]. Nevertheless, our assessment adds to a growing body of literature indicating that mothers of children with birth defects may be at risk for adverse health conditions. Future studies collaborating with other birth defect centers are needed to confirm our results and further characterize these affected metabolic pathways.

Supplementary Materials

The following supporting information can be downloaded at: https://www.mdpi.com/article/10.3390/metabo12020100/s1, Table S1: Metabolites and the LODs quantified by compound class from the AbsoluteIDQ® p400 HR Kit in the study; Table S2: Summary of Data Processing Results. Figure S1: Correlation matrix represents the reproducibility of targeted metabolomics data among technical repeats; Figure S2: Principle component analysis of mControl samples and all samples; Figure S3: Sources of variations plots.

Author Contributions

Conceptualization, P.-C.H., P.J.L. and W.N.N.; methodology, P.-C.H.; software, P.-C.H.; formal analysis, P.-C.H. and S.M.; resources, W.N.N.; data curation, P.-C.H.; writing—original draft preparation, P.-C.H. and S.M.; writing—review and editing, P.-C.H., S.M., J.P., P.J.L. and W.N.N.; visualization, P.-C.H. and S.M.; supervision, W.N.N.; funding acquisition, P.-C.H. and W.N.N. All authors have read and agreed to the published version of the manuscript.

Funding

This project was supported through the Centers for Disease Control and Prevention (CDC) cooperative agreements under PA #96043, PA #02081, FOA #DD09-001, FOA #DD13-003, and NOFO #DD18-001 to the Centers for Birth Defects Research and Prevention participating in the National Birth Defects Prevention Study (NBDPS) and/or the Birth Defects Study To Evaluate Pregnancy exposureS (BD-STEPS). This study received support from the National Center on Birth Defects and Developmental Disabilities (NCBDDD) under award number 5U01DD000491-05 and 5U01DD001285-03, National Institute of Child Health & Human Development under award number 5R01HD039054-14, as well as the National Institute of General Medical Sciences under P20 GM109005.

Institutional Review Board Statement

The study was conducted in accordance with the Declaration of Helsinki, and approved by the Institutional Review Board of University of Arkansas for Medical Sciences (IRB# 06325, protocol modification approved 8/29/2019).

Informed Consent Statement

Informed consent was obtained from all subjects involved in the study.

Data Availability Statement

The data presented in this study are available on request from the corresponding author. The data are not publicly available due to privacy reasons.

Acknowledgments

The authors would like to thank the study staff, especially Yevgeniya Gokun and Bruce Hulsey, and participants, whose contributions were vital for both the NBDPS and NICHD studies.

Conflicts of Interest

The authors declare no conflict of interests.

References

  1. Botto, L.D.; Mulinare, J.; Erickson, J.D. Occurrence of congenital heart defects in relation to maternal mulitivitamin use. Am. J. Epidemiol. 2000, 151, 878–884. [Google Scholar] [CrossRef]
  2. Gilboa, S.M.; Devine, O.J.; Kucik, J.E.; Oster, M.E.; Riehle-Colarusso, T.; Nembhard, W.N.; Xu, P.; Correa, A.; Jenkins, K.; Marelli, A.J. Congenital Heart Defects in the United States: Estimating the Magnitude of the Affected Population in 2010. Circulation 2016, 134, 101–109. [Google Scholar] [CrossRef] [PubMed] [Green Version]
  3. Nembhard, W.N.; Tang, X.; Hu, Z.; MacLeod, S.; Stowe, Z.; Webber, D. Maternal and infant genetic variants, maternal periconceptional use of selective serotonin reuptake inhibitors, and risk of congenital heart defects in offspring: Population based study. BMJ 2017, 356, j832. [Google Scholar] [CrossRef] [PubMed] [Green Version]
  4. Cleves, M.A.; Ghaffar, S.; Zhao, W.; Mosley, B.S.; Hobbs, C.A. First-year survival of infants born with congenital heart defects in Arkansas (1993–1998): A survival analysis using registry data. Birth Defects Res. Part A Clin. Mol. Teratol. 2003, 67, 662–668. [Google Scholar] [CrossRef] [PubMed]
  5. Gilboa, S.M.; Salemi, J.L.; Nembhard, W.N.; Fixler, D.E.; Correa, A. Mortality resulting from congenital heart disease among children and adults in the United States, 1999 to 2006. Circulation 2010, 122, 2254–2263. [Google Scholar] [CrossRef] [Green Version]
  6. Nembhard, W.N.; Waller, D.K.; Sever, L.E.; Canfield, M.A. Patterns of first-year survival among infants with selected congenital anomalies in Texas, 1995–1997. Teratology 2001, 64, 267–275. [Google Scholar] [CrossRef]
  7. Friedman, P.; Yilmaz, A.; Ugur, Z.; Jafar, F.; Whitten, A.; Ustun, I.; Turkoglu, O.; Graham, S.; Singh, R.B. Urine metabolomic biomarkers for prediction of isolated fetal congenital heart defect. J. Matern.-Fetal Neonatal Med. 2021, 2021, 1–8. [Google Scholar] [CrossRef]
  8. Troisi, J.; Cavallo, P.; Richards, S.; Symes, S.; Colucci, A.; Sarno, L.; Landolfi, A.; Scala, G.; Adair, D.; Ciccone, C.; et al. Noninvasive screening for congenital heart defects using a serum metabolomics approach. Prenat. Diagn. 2021, 41, 743–753. [Google Scholar] [CrossRef]
  9. Xie, D.; Luo, Y.; Xiong, X.; Lou, M.; Liu, Z.; Wang, A.; Xiong, L.; Kong, F.; Wang, Y.; Wang, H. Study on the Potential Biomarkers of Maternal Urine Metabolomics for Fetus with Congenital Heart Diseases Based on Modified Gas Chromatograph-Mass Spectrometer. BioMed Res. Int. 2019, 2019, 1905416. [Google Scholar] [CrossRef] [Green Version]
  10. Bahado-Singh, R.O.; Ertl, R.; Mandal, R.; Bjorndahl, T.C.; Syngelaki, A.; Han, B.; Dong, E.; Liu, P.B.; Alpay-Savasan, Z.; Wishart, D.S.; et al. Metabolomic prediction of fetal congenital heart defect in the first trimester. Am. J. Obs. Gynecol. 2014, 211, e1–e204. [Google Scholar] [CrossRef]
  11. Rochfort, S. Metabolomics Reviewed:  A New “Omics” Platform Technology for Systems Biology and Implications for Natural Products Research. J. Nat. Prod. 2005, 68, 1813–1820. [Google Scholar] [CrossRef]
  12. Aliferis, K.A.; Chrysayi-Tokousbalides, M. Metabolomics in pesticide research and development: Review and future perspectives. Metabolomics 2011, 7, 35–53. [Google Scholar] [CrossRef]
  13. Beger, R.D. A Review of Applications of Metabolomics in Cancer. Metabolites 2013, 3, 552–574. [Google Scholar] [CrossRef] [Green Version]
  14. De Raad, M.; Fischer, C.R.; Northen, T.R. High-throughput platforms for metabolomics. Curr. Opin. Chem. Biol. 2016, 30, 7–13. [Google Scholar] [CrossRef] [Green Version]
  15. Macel, M.; Van Dam, N.M.; Keurentjes, J.J.B. Metabolomics: The chemistry between ecology and genetics. Mol. Ecol. Resour. 2010, 10, 583–593. [Google Scholar] [CrossRef] [PubMed]
  16. Maity, S.; Jannasch, A.; Adamec, J.; Nalepa, T.; Höök, T.O.; Sepúlveda, M.S. Starvation causes disturbance in amino acid and fatty acid metabolism in Diporeia. Comp. Biochem. Physiol. Part B Biochem. Mol. Biol. 2012, 161, 348–355. [Google Scholar] [CrossRef] [PubMed] [Green Version]
  17. Gao, Y.; Lu, Y.; Huang, S.; Gao, L.; Liang, X.; Wu, Y.; Wang, J.; Huang, Q.; Tang, L.; Wang, G.; et al. Identifying Early Urinary Metabolic Changes with Long-Term Environmental Exposure to Cadmium by Mass-Spectrometry-Based Metabolomics. Environ. Sci. Technol. 2014, 48, 6409–6418. [Google Scholar] [CrossRef]
  18. Grison, S.; Favé, G.; Maillot, M.; Manens, L.; Delissen, O.; Blanchardon, E.; Dublineau, I.; Aigueperse, J.; Bohand, S.; Martin, J.C.; et al. Metabolomics reveals dose effects of low-dose chronic exposure to uranium in rats: Identification of candidate biomarkers in urine samples. Metabolomics. 2016, 12, 154. [Google Scholar] [CrossRef]
  19. Xu, M.-Y.; Sun, Y.-J.; Wang, P.; Xu, H.-Y.; Chen, L.-P.; Zhu, L.; Wu, Y.-J. Metabolomics Analysis and Biomarker Identification for Brains of Rats Exposed Subchronically to the Mixtures of Low-Dose Cadmium and Chlorpyrifos. Chem. Res. Toxicol. 2015, 28, 1216–1223. [Google Scholar] [CrossRef]
  20. Gyawali, P.; Karpe, A.V.; Hillyer, K.E.; Nguyen, T.V.; Hewitt, J.; Beale, D.J. A multi-platform metabolomics approach to identify possible biomarkers for human faecal contamination in Greenshell™ mussels (Perna canaliculus). Sci. Total Environ. 2021, 771, 145363. [Google Scholar] [CrossRef]
  21. Sulek, K.; Han, T.-L.; Villas-Boas, S.; Wishart, D.S.; Soh, S.E.; Kwek, K.; Gluckman, P.D.; Chong, Y.S.; Kenny, L.; Baker, P. Hair metabolomics: Identification of fetal compromise provides proof of concept for biomarker discovery. Theranostics 2014, 4, 953–959. [Google Scholar] [CrossRef] [PubMed]
  22. Wang, X.; Liu, L.; Zhang, W.; Zhang, J.; Du, X.; Huang, Q.; Tian, M.; Shen, H. Serum metabolome biomarkers associate low-level environmental perfluorinated compound exposure with oxidative/nitrosative stress in humans. Environ. Pollut. 2017, 229, 168–176. [Google Scholar] [CrossRef] [PubMed]
  23. Maity, S.; Jannasch, A.; Adamec, J.; Watkins, J.M.; Nalepa, T.; Höök, T.O.; Sepúlveda, M.S. Elucidating causes of Diporeia decline in the Great Lakes via metabolomics: Physiological responses after exposure to different stressors. Physiol. Biochem. Zool. PBZ 2013, 86, 213–223. [Google Scholar] [CrossRef]
  24. Klein, M.S.; Shearer, J. Metabolomics and Type 2 Diabetes: Translating Basic Research into Clinical Application. J. Diabetes Res. 2016, 2016, 3898502. [Google Scholar] [CrossRef] [Green Version]
  25. Urpi-Sarda, M.; Almanza-Aguilera, E.; Tulipani, S.; Tinahones, F.J.; Salas-Salvadó, J.; Andres-Lacueva, C. Metabolomics for biomarkers of type 2 diabetes mellitus: Advances and nutritional intervention trends. Curr. Cardiovasc. Risk Rep. 2015, 9, 12. [Google Scholar] [CrossRef]
  26. Milburn, M.V.; Lawton, K.A. Application of Metabolomics to Diagnosis of Insulin Resistance. Annu. Rev. Med. 2013, 64, 291–305. [Google Scholar] [CrossRef] [Green Version]
  27. Moco, S.; Collino, S.; Rezzi, S.; Martin, F.-P.J. Metabolomics perspectives in pediatric research. Pediatr. Res. 2013, 73, 570–576. [Google Scholar] [CrossRef]
  28. Papamichael, M.; Katsardis, C.; Sarandi, E.; Georgaki, S.; Frima, E.-S.; Varvarigou, A.; Tsoukalas, D. Application of Metabolomics in Pediatric Asthma: Prediction, Diagnosis and Personalized Treatment. Metabolites 2021, 11, 251. [Google Scholar] [CrossRef] [PubMed]
  29. Dona, A.C.; Coffey, S.; Figtree, G. Translational and emerging clinical applications of metabolomics in cardiovascular disease diagnosis and treatment. Eur. J. Prev. Cardiol. 2020, 23, 1578–1589. [Google Scholar] [CrossRef]
  30. Senn, T.; Hazen, S.L.; Tang, W.H.W. Translating Metabolomics to Cardiovascular Biomarkers. Prog. Cardiovasc. Dis. 2012, 55, 70–76. [Google Scholar] [CrossRef] [PubMed] [Green Version]
  31. Lewis, G.D.; Asnani, A.; Gerszten, R.E. Application of Metabolomics to Cardiovascular Biomarker and Pathway Discovery. J. Am. Coll. Cardiol. 2008, 52, 117–123. [Google Scholar] [CrossRef] [Green Version]
  32. Jasbi, P.; Wang, D.; Cheng, S.L.; Fei, Q.; Cui, J.Y.; Liu, L.; Wei, Y.; Raftery, D.; Gu, H. Breast cancer detection using targeted plasma metabolomics. J. Chromatogr. B 2019, 1105, 26–37. [Google Scholar] [CrossRef]
  33. Putluri, N.; Maity, S.; Kommagani, R.; Creighton, C.J.; Putluri, V.; Chen, F.; Nanda, S.; Bhowmik, S.K.; Terunuma, A.; Dorsey, T.; et al. Pathway-Centric Integrative Analysis Identifies RRM2 as a Prognostic Marker in Breast Cancer Associated with Poor Survival and Tamoxifen Resistance. Neoplasia 2014, 16, 390–402. [Google Scholar] [CrossRef] [Green Version]
  34. Shajahan-Haq, A.N.; Cheema, M.S.; Clarke, R. Application of Metabolomics in Drug Resistant Breast Cancer Research. Metabolites 2015, 5, 100–118. [Google Scholar] [CrossRef] [PubMed] [Green Version]
  35. Jiao, L.; Maity, S.; Coarfa, C.; Rajapakshe, K.; Chen, L.; Jin, F.; Putluri, V.; Tinker, L.F.; Mo, Q.; Chen, F.; et al. A Prospective Targeted Serum Metabolomics Study of Pancreatic Cancer in Postmenopausal Women. Cancer Prev. Res. 2019, 12, 237–246. [Google Scholar] [CrossRef] [PubMed] [Green Version]
  36. Lindahl, A.; Heuchel, R.; Forshed, J.; Lehtiö, J.; Löhr, M.; Nordström, A. Discrimination of pancreatic cancer and pancreatitis by LC-MS metabolomics. Metabolomics 2017, 13, 61. [Google Scholar] [CrossRef] [Green Version]
  37. Sakai, A.; Suzuki, M.; Kobayashi, T.; Nishiumi, S.; Yamanaka, K.; Hirata, Y.; Nakagawa, T.; Azuma, T.; Yoshida, M. Pancreatic cancer screening using a multiplatform human serum metabolomics system. Biomark. Med. 2016, 10, 577–586. [Google Scholar] [CrossRef] [PubMed]
  38. Simpson, B.N.; Kim, M.; Chuang, Y.-F.; Beason-Held, L.; Kitner-Triolo, M.; Kraut, M.; Lirette, S.T.; Windham, B.G.; Griswold, M.E.; Legido-Quigley, C.; et al. Blood metabolite markers of cognitive performance and brain function in aging. J. Cereb. Blood Flow Metab. 2016, 36, 1212–1223. [Google Scholar] [CrossRef] [Green Version]
  39. Srivastava, S. Emerging Insights into the Metabolic Alterations in Aging Using Metabolomics. Metabolites 2019, 9, 301. [Google Scholar] [CrossRef] [Green Version]
  40. Jacob, M.; Lopata, A.L.; Dasouki, M.; Abdel Rahman, A.M. Metabolomics toward personalized medicine. Mass Spectrom. Rev. 2019, 38, 221–238. [Google Scholar] [CrossRef] [PubMed]
  41. Tuyiringire, N.; Tusubira, D.; Munyampundu, J.-P.; Tolo, C.U.; Muvunyi, C.M.; Ogwang, P.E. Application of metabolomics to drug discovery and understanding the mechanisms of action of medicinal plants with anti-tuberculosis activity. Clin. Transl. Med. 2018, 7, 29. [Google Scholar] [CrossRef] [PubMed]
  42. York, B.; Li, F.; Lin, F.; Marcelo, K.L.; Mao, J.; Dean, A.; Gonzales, N.; Gooden, D.; Maity, S.; Coarfa, C.; et al. Pharmacological inhibition of CaMKK2 with the selective antagonist STO-609 regresses NAFLD. Sci. Rep. 2017, 7, 11793. [Google Scholar] [CrossRef] [PubMed]
  43. Bhargava, P.; Anthony, D.C. Metabolomics in multiple sclerosis disease course and progression. Mult. Scler. J. 2020, 26, 591–598. [Google Scholar] [CrossRef]
  44. Varma, V.R.; Oommen, A.M.; Varma, S.; Casanova, R.; An, Y.; Andrews, R.M.; O’Brien, R.; Pletnikova, O.; Troncoso, J.C.; Toledo, J.; et al. Brain and blood metabolite signatures of pathology and progression in Alzheimer disease: A targeted metabolomics study. PLoS Med. 2018, 15, e1002482. [Google Scholar] [CrossRef]
  45. Villoslada, P.; Alonso, C.; Agirrezabal, I.; Kotelnikova, E.; Zubizarreta, I.; Pulido-Valdeolivas, I.; Saiz, A.; Comabella, M.; Montalban, X.; Villar, L.; et al. Metabolomic signatures associated with disease severity in multiple sclerosis. Neurol. Neuroimmunol. Neuroinflamm. 2017, 4, e321. [Google Scholar] [CrossRef] [Green Version]
  46. Huang, J.; Mo, J.; Zhao, G.; Lin, Q.; Wei, G.; Deng, W.; Chen, D.; Yu, B. Application of the amniotic fluid metabolome to the study of fetal malformations, using Down syndrome as a specific model. Mol. Med. Rep. 2017, 16, 7405–7415. [Google Scholar] [CrossRef] [Green Version]
  47. Parfieniuk, E.; Zbucka-Kretowska, M.; Ciborowski, M.; Kretowski, A.; Barbas, C. Untargeted metabolomics: An overview of its usefulness and future potential in prenatal diagnosis. Expert Rev. Proteom. 2018, 15, 809–816. [Google Scholar] [CrossRef] [PubMed]
  48. Souza, R.T.; Mayrink, J.; Leite, D.F.; Costa, M.L.; Calderon, I.M.; Rocha, E.A.; Vettorazzi, J.; Feitosa, F.E.; Cecatti, J.G. Metabolomics applied to maternal and perinatal health: A review of new frontiers with a translation potential. Clinics 2019, 74, e894. [Google Scholar] [CrossRef]
  49. Wishart, D.S. Metabolomics for Investigating Physiological and Pathophysiological Processes. Physiol. Rev. 2019, 99, 1819–1875. [Google Scholar] [CrossRef]
  50. Johnson, C.H.; Ivanisevic, J.; Siuzdak, G. Metabolomics: Beyond biomarkers and towards mechanisms. Nat. Rev. Mol. Cell Biol. 2016, 17, 451–459. [Google Scholar] [CrossRef] [Green Version]
  51. Mi, K.; Jiang, Y.; Chen, J.; Lv, D.; Qian, Z.; Sun, H.; Shang, D. Construction and Analysis of Human Diseases and Metabolites Network. Front. Bioeng. Biotechnol. 2020, 8, 398. [Google Scholar] [CrossRef]
  52. Tang, X.; Cleves, M.A.; Nick, T.G.; Li, M.; MacLeod, S.L.; Erickson, S.W.; Li, J.; Shaw, G.M.; Mosley, B.S.; Hobbs, C.A.; et al. Obstructive heart defects associated with candidate genes, maternal obesity, and folic acid supplementation. Am. J. Med. Genet. Part A 2015, 167, 1231–1242. [Google Scholar] [CrossRef] [Green Version]
  53. Chong, J.; Soufan, O.; Li, C.; Caraus, I.; Li, S.; Bourque, G.; Wishart, D.S.; Xia, J. MetaboAnalyst 4.0: Towards more transparent and integrative metabolomics analysis. Nucleic Acids Res. 2018, 46, W486–W494. [Google Scholar] [CrossRef] [Green Version]
  54. Olshan, A.F.; Hobbs, C.A.; Shaw, G.M. Discovery of genetic susceptibility factors for human birth defects: An opportunity for a National Agenda. Am. J. Med. Genet. Part A 2011, 155, 1794–1797. [Google Scholar] [CrossRef] [PubMed]
  55. Boneva, R.S.; Botto, L.D.; Moore, C.A.; Yang, Q.; Correa, A.; Erickson, J.D. Mortality associated with congenital heart defects in the United States: Trends and racial disparities, 1979–1997. Circulation 2001, 103, 2376–2381. [Google Scholar] [CrossRef] [PubMed] [Green Version]
  56. Narchi, H.; Kulaylat, N. Heart disease in infants of diabetic mothers. Images Paediatr. Cardiol. 2000, 2, 17–23. [Google Scholar] [PubMed]
  57. Levy, H.L.; Guldberg, P.; Güttler, F.; Hanley, W.B.; Matalon, R.; Rouse, B.M.; Trefz, F.; Azen, C.; Allred, E.N.; De La Cruz, F.; et al. Congenital heart disease in maternal phenylketonuria: Report from the Maternal PKU Collaborative Study. Pediatr. Res. 2001, 49, 636–642. [Google Scholar] [CrossRef] [Green Version]
  58. Hedermann, G.; Hedley, P.L.; Thagaard, I.N.; Krebs, L.; Ekelund, C.K.; Sørensen, T.I.A.; Christiansen, M. Maternal obesity and metabolic disorders associate with congenital heart defects in the offspring: A systematic review. PLoS ONE 2021, 16, e0252343. [Google Scholar] [CrossRef] [PubMed]
  59. Testerink, N.; van der Sanden, M.H.; Houweling, M.; Helms, J.B.; Vaandrager, A.B. Depletion of phosphatidylcholine affects endoplasmic reticulum morphology and protein traffic at the Golgi complex. J. Lipid Res. 2009, 50, 2182–2192. [Google Scholar] [CrossRef] [Green Version]
  60. Van der Veen, J.N.; Kennelly, J.P.; Wan, S.; Vance, J.E.; Vance, D.E.; Jacobs, R.L. The critical role of phosphatidylcholine and phosphatidylethanolamine metabolism in health and disease. Biochim. Biophys. Acta Biomembr. 2017, 1859, 1558–1572. [Google Scholar] [CrossRef]
  61. Furse, S.; Billing, G.; Snowden, S.G.; Smith, J.; Goldberg, G.; Koulman, A. Relationship between the lipid composition of maternal plasma and infant plasma through breast milk. Metabolomics 2019, 15, 129. [Google Scholar] [CrossRef] [Green Version]
  62. Mourad, A.M.; de Carvalho Pincinato, E.; Mazzola, P.G.; Sabha, M.; Moriel, P. Influence of soy lecithin administration on hypercholesterolemia. Cholesterol 2010, 2010, 824813. [Google Scholar] [CrossRef]
  63. Gauster, M.; Rechberger, G.; Sovic, A.; Hörl, G.; Steyrer, E.; Sattler, W.; Frank, S. Endothelial lipase releases saturated and unsaturated fatty acids of high density lipoprotein phosphatidylcholine. J. Lipid Res. 2005, 46, 1517–1525. [Google Scholar] [CrossRef] [Green Version]
  64. Dullaart, R.P.; Gansevoort, R.T.; Dikkeschei, B.D.; de Zeeuw, D.; de Jong, P.E.; Van Tol, A. Role of elevated lecithin: Cholesterol acyltransferase and cholesteryl ester transfer protein activities in abnormal lipoproteins from proteinuric patients. Kidney Int. 1993, 44, 91–97. [Google Scholar] [CrossRef] [PubMed] [Green Version]
  65. Stegemann, C.; Pechlaner, R.; Willeit, P.; Langley, S.R.; Mangino, M.; Mayr, U.; Menni, C.; Moayyeri, A.; Santer, P.; Rungger, G.; et al. Lipidomics profiling and risk of cardiovascular disease in the prospective population-based Bruneck study. Circulation 2014, 129, 1821–1831. [Google Scholar] [CrossRef] [Green Version]
  66. Ganna, A.; Salihovic, S.; Sundström, J.; Broeckling, C.D.; Hedman, Å.K.; Magnusson, P.K.; Pedersen, N.L.; Larsson, A.; Siegbahn, A.; Zilmer, M.; et al. Large-scale metabolomic profiling identifies novel biomarkers for incident coronary heart disease. PLoS Genet. 2014, 10, e1004801. [Google Scholar] [CrossRef] [PubMed]
  67. Lee, Y.-K.; Lee, D.H.; Kim, J.K.; Park, M.-J.; Yan, J.-J.; Song, D.-K.; Vaziri, N.D.; Noh, J.-W. Lysophosphatidylcholine, oxidized low-density lipoprotein and cardiovascular disease in Korean hemodialysis patients: Analysis at 5 years of follow-up. J. Korean Med. Sci. 2013, 28, 268–273. [Google Scholar] [CrossRef] [PubMed] [Green Version]
  68. Grimes, S.B.; Wild, R. Effect of Pregnancy on Lipid Metabolism and Lipoprotein Levels; Feingold, K.R., Anawalt, B., Boyce, A., Chrousos, G., de Herder, W.W., Dhatariya, K., Dungan, K., Hershman, J.M., Hofland, J., Kalra, S., et al., Eds.; Endotext, MDText.com, Inc.: South Dartmouth, MA, USA, 2018. [Google Scholar]
  69. Xi, P.; Jiang, Z.; Zheng, C.; Lin, Y.; Wu, G. Regulation of protein metabolism by glutamine: Implications for nutrition and health. Front. Biosci. (Landmark Ed.) 2011, 16, 578–597. [Google Scholar] [CrossRef] [Green Version]
  70. DeBerardinis, R.J.; Cheng, T. Q’s next: The diverse functions of glutamine in metabolism, cell biology and cancer. Oncogene 2010, 29, 313–324. [Google Scholar] [CrossRef] [Green Version]
  71. Durante, W. The Emerging Role of l-Glutamine in Cardiovascular Health and Disease. Nutrients 2019, 11, 2092. [Google Scholar] [CrossRef] [Green Version]
  72. Cedars, A.; Manlhiot, C.; Ko, J.-M.; Bottiglieri, T.; Arning, E.; Weingarten, A.; Opotowsky, A.; Kutty, S. Metabolomic Profiling of Adults with Congenital Heart Disease. Metabolites 2021, 11, 525. [Google Scholar] [CrossRef]
  73. Shao, M.; Huang, C.; Li, Z.; Yang, H.; Feng, Q. Effects of glutamine and valsartan on the brain natriuretic peptide and N-terminal pro-B-type natriuretic peptide of patients with chronic heart failure. Pak. J. Med. Sci. 2015, 31, 82–86. [Google Scholar] [CrossRef]
  74. Gong, W.; Liang, Q.; Zheng, D.; Zhong, R.; Wen, Y.; Wang, X. Congenital heart defects of fetus after maternal exposure to organic and inorganic environmental factors: A cohort study. Oncotarget 2017, 8, 100717–100723. [Google Scholar] [CrossRef] [PubMed]
  75. Peyvandi, S.; Baer, R.J.; Chambers, C.D.; Norton, M.E.; Rajagopal, S.; Ryckman, K.K.; Moon-Grady, A.; Jelliffe-Pawlowski, L.L.; Steurer, M.A. Environmental and Socioeconomic Factors Influence the Live-Born Incidence of Congenital Heart Disease: A Population-Based Study in California. J. Am. Heart Assoc. 2020, 9, e015255. [Google Scholar] [CrossRef] [PubMed]
  76. Helle, E.; Priest, J.R. Maternal Obesity and Diabetes Mellitus as Risk Factors for Congenital Heart Disease in the Offspring. J. Am. Heart Assoc. 2020, 9, e011541. [Google Scholar] [CrossRef]
  77. Øyen, N.; Diaz, L.J.; Leirgul, E.; Boyd, H.A.; Priest, J.; Mathiesen, E.R.; Quertermous, T.; Wohlfahrt, J.; Melbye, M. Prepregnancy Diabetes and Offspring Risk of Congenital Heart Disease: A Nationwide Cohort Study. Circulation 2016, 133, 2243–2253. [Google Scholar] [CrossRef]
  78. Feng, Y.; Yu, D.; Yang, L.; Da, M.; Wang, Z.; Lin, Y.; Ni, B.; Wang, S.; Mo, X. Maternal lifestyle factors in pregnancy and congenital heart defects in offspring: Review of the current evidence. Ital. J. Pediatr. 2014, 40, 85. [Google Scholar] [CrossRef] [PubMed] [Green Version]
  79. Clausen, H.; Noren, E.; Valtonen, S.; Koivu, A.; Sairanen, M.; Liuba, P. Evaluation of Circulating Cardiovascular Biomarker Levels for Early Detection of Congenital Heart Disease in Newborns in Sweden. JAMA Netw. Open. 2020, 3, e2027561. [Google Scholar] [CrossRef]
  80. Neves, A.L.; Cabral, M.; Leite-Moreira, A.; Monterroso, J.; Ramalho, C.; Guimarães, H.; Barros, H.; Guimarães, J.T.; Henriques-Coelho, T.; Areias, J.C. Myocardial Injury Biomarkers in Newborns with Congenital Heart Disease. Pediatr. Neonatol. 2016, 57, 488–495. [Google Scholar] [CrossRef] [Green Version]
Figure 1. Metabolomics analysis workflow.
Metabolites 12 00100 g001
Figure 2. Visualization of the significant metabolites (p < 0.05) in (a) principle component analysis and (b) hierarchical clustering distinguishing between mControl vs. mHLHS.
Metabolites 12 00100 g002
Figure 3. Visualization of the significant metabolites (p < 0.05) in (a) principle component analysis and (b) hierarchical clustering distinguishing between mControls vs. mToF.
Metabolites 12 00100 g003
Figure 4. Box plot of significant metabolite overlapping between two comparisons (mControls vs. mTOF and mControl vs. mHLHS). Levels of PC (35:0), a glycerophospholipid lecithin, were significantly higher in the mControl compared to mHLHS and mToF.
Metabolites 12 00100 g004
Figure 5. Biomarker analysis for the predictive values metabolites for mHLHS. The sensitivity (true positive rate) is on the y-axis, and the specificity (one minus the false positive rate) is on the x-axis, with the area under the curve (AUC) > 0.70 on four metabolites, including (a) PC (34:1), (b) SM (31:1), (c) SM (42:2) and (d) PC-O (40:4). A horizontal line in red in the box plots indicates the optimal cutoff of between two groups.
Metabolites 12 00100 g005
Figure 6. Biomarker analysis for the predictive values metabolites for mToF. The sensitivity (true positive rate) is on the y-axis, and the specificity (one minus the false positive rate) is on the x-axis, with the area under the curve (AUC) > 0.70 on six metabolites, including (a) LPC (18:2), (b) TG (46:2), (c) LPC (20:3), (d) CE (22:6), and (e) TG (44:1). A horizontal line in red in the box plots indicates the optimal cutoff of between two groups.
Metabolites 12 00100 g006
Figure 7. Metabolic pathways associated with (a) mHLHS and (b) mToF pregnancies when comparing with normal controls. The depicted networks revealed pathways (orange nodes), enzymes (light blue nodes), reactions (light green nodes), and metabolites (yellow nodes) that were involved in the pathways affected (p < 0.01).
Metabolites 12 00100 g007
Table 1. Maternal demographic factors among the CHD control and cases from the Arkansas site of NBDPS (1997–2011) included in the study.
mControl 1 (18)mHLHS 2 (16)mToF 3 (22)p *
Mean ± Std/Counts
Pre-pregnancy BMI 425.9 ± 6.624.5 ± 4.626.6 ± 7.60.6
Post-partum BMI31.6 ± 6.028.6 ± 3.731.0 ± 6.80.3
BMI change5.8 ± 2.74.2 ± 2.44.4 ± 2.20.1
Weight change (kg)15.4 ± 8.011.3 ± 6.811.6 ± 5.90.1
Maternal age at delivery25.8 ± 5.627.3 ± 5.526.6 ± 5.60.7
Maternal age at EDD 525.9 ± 5.727.3 ± 5.526.6 ± 5.60.8
Maternal age at conception25.2 ± 5.726.8 ± 5.526.0 ± 5.70.7
Maternal age at delivery25.8 ± 5.627.3 ± 5.526.6 ± 5.60.7
Race 0.6
Non-Hispanic white171420
Non-Hispanic black112
Asian/Pacific Islander010
Alcohol consumption 0.2
Yes (B1-M3) **1066
No81016
Maternal smoking 0.9
Heavy smokers or 15+ cigs per day212
Medium smokers or 5–14 cigs per day332
Light smokers or ≤1–4 cigs per day123
No smoking121015
High blood pressure during pregnancy 0.7
Yes135
No111
No answer161216
High blood pressure medicine use 0.3
Yes010
No136
No answer171216
Type II Diabetes 0.9
Yes222
No161420
* p-values represent differences between groups. Continuous variables were evaluated by ANOVA, and chi square (X2) tests were used to investigate the differences in distributions of categorical variables. 1 mControl: mothers of unaffected offspring; 2 mHLHS: mothers of offspring with hypoplastic left heart syndrome; 3 mToF: mothers of offspring with tetralogy of Fallot; 4 BMI: body mass index; 5 EDD: estimated due date. ** One month before conception to end of first trimester.
Table 2. Significant metabolites between the mothers of control infants (mControl) compared to the mothers of infants with hypoplastic left heart syndrome (mHLHS), Arkansas site of NBDPS, 1997–2011.
MetabolitesmControlmHLHSmControl vs. mHLHS (mControl/mHLHS)
Mean ± Std (μM)p *FC *Trend
PC (34:1)149.56 ± 29.13157 ± 36.540.014−1.03Controls down
TG (52:6)2.98 ± 1.442.81 ± 2.030.0162.02Controls up
PC (41:4)1.65 ± 0.671.90 ± 0.620.020−1.27Controls down
SM (31:1)0.49 ± 0.260.48 ± 0.250.023−1.43Controls down
SM (42:2)39.98 ± 7.6241.38 ± 6.630.027−1.07Controls down
PC (41:1)0.66 ± 0.360.40 ± 0.360.0291.38Controls up
Glutamine548 ± 73.95484.10 ± 63.810.0461.04Controls up
PC (35:0)0.12 ± 0.180.008 ± 0.0090.0461.39Controls up
PC-O (40:4)0.95 ± 0.281.20 ± 0.490.049−1.10Controls down
* FC = fold change. Raw p-values and FC represent differences between groups.
Table 3. Significant metabolites between the mothers of control infants (mControl) compared to the mothers of infants with Tetralogy of Fallot (mToF), Arkansas site of NBDPS, 1997–2011.
MetabolitesmControlmToFmControl vs. mToF (mControl/mToF)
Mean ± Std (μM)p *FC *Trend
LPC (18:2)14.62 ± 7.179.87 ± 3.760.0041.15Controls up
Asparagine45.87 ± 7.4739.85 ± 10.070.0061.08Controls up
PC (31:0)0.54 ± 0.220.37 ± 0.180.0101.16Controls up
LPC (24:0)0.105 ± 0.110.111 ± 0.100.014−2.11Controls down
PC (40:8)6.96 ± 5.943.71 ± 4.230.0141.36Controls up
PC-O (40:0)0.006 ± 0.0030.004 ± 0.0030.017−2.54Controls down
TG (52:7)1.20 ± 0.821.86 ± 0.950.017−2.33Controls down
TG (44:1)1.86 ± 1.590.78 ± 1.390.0181.55Controls up
LPC (20:3)2.42 ± 1.111.54 ± 0.730.0201.20Controls up
PC (38:1)0.59 ± 0.220.42 ± 0.230.0211.17Controls up
LPC (15:0)0.59 ± 0.190.44 ± 0.130.0251.08Controls up
PC-O (30:2)0.008 ± 0.0010.007 ± 0.0010.0251.07Controls up
PC (38:0)0.66 ± 0.310.46 ± 0.310.0261.20Controls up
PC-O (33:2)0.005 ± 0.0010.004 ± 0.0010.0281.08Controls up
PC-O (35:4)0.29 ± 0.350.15 ± 0.050.032−1.82Controls down
Phenylalanine65.61 ± 13.552.38 ± 8.630.0321.04Controls up
PC (33:0)0.85 ± 0.250.69 ± 0.170.0341.05Controls up
TG (48:3)5.78 ± 6.722.60 ± 5.630.0371.59Controls up
PC (44:3)1.65 ± 2.74.89 ± 5.420.038−1.82Controls down
LPC (18:0)22.04 ± 8.5817.62 ± 6.670.0401.09Controls up
LPC (17:0)1.43 ± 0.451.144 ± 0.440.0411.08Controls up
PC (35:2)8.02 ± 2.156.43 ± 1.570.0411.06Controls up
CE (22:6)65.41 ± 23.5175.38 ± 21.320.041−1.08Controls down
PC (35:0)0.12 ± 0.180.03 ± 0.090.0421.36Controls up
PC (30:1)0.009 ± 0.0020.008 ± 0.0010.0451.07Controls up
TG (48:2)13.74 ± 8.149.71 ± 8.080.0471.13Controls up
TG (46:2)3.72 ± 2.612.30 ± 3.280.0471.36Controls up
TG (48:1)15.35 ± 9.0410.49 ± 8.540.0481.14Controls up
DG (32:2)0.77 ± 0.400.55 ± 0.370.0481.12Controls up
PC (46:2)8.91 ± 4.996.26 ± 4.140.0491.12Controls up
* FC = fold change. Raw p-values and FC represent differences between groups.
Publisher’s Note: MDPI stays neutral with regard to jurisdictional claims in published maps and institutional affiliations.

