


Feeding Rainbow Trout with Different Types of Non-Starch Polysaccharides: Impacts on Serum Metabolome and Gut Microbiota

 ,
,
Abstract
:
1. Introduction
2. Material and Methods
2.1. Feed Production, Fish and Management
2.2. Sampling Works
2.3. Serum Metabolome Analysis
2.4. Microbiome Analysis
2.5. Statistical Analysis
3. Results
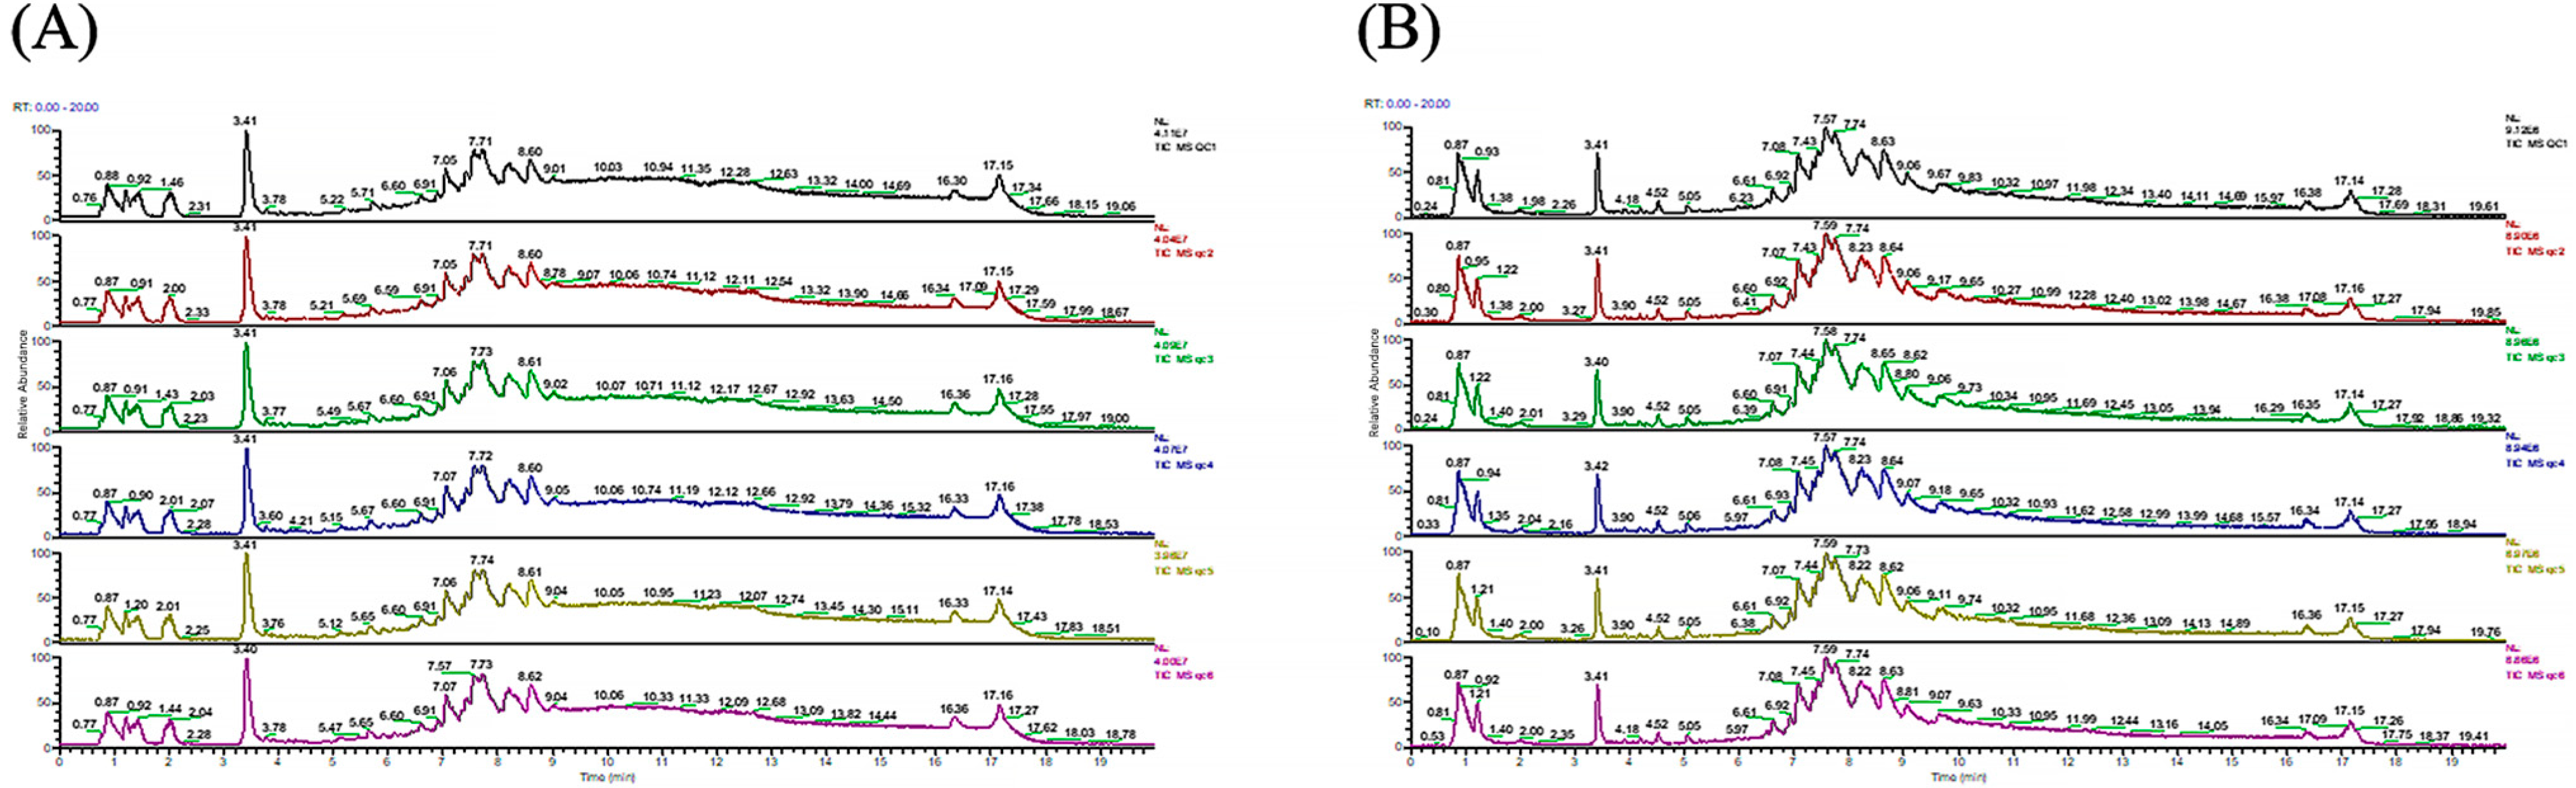
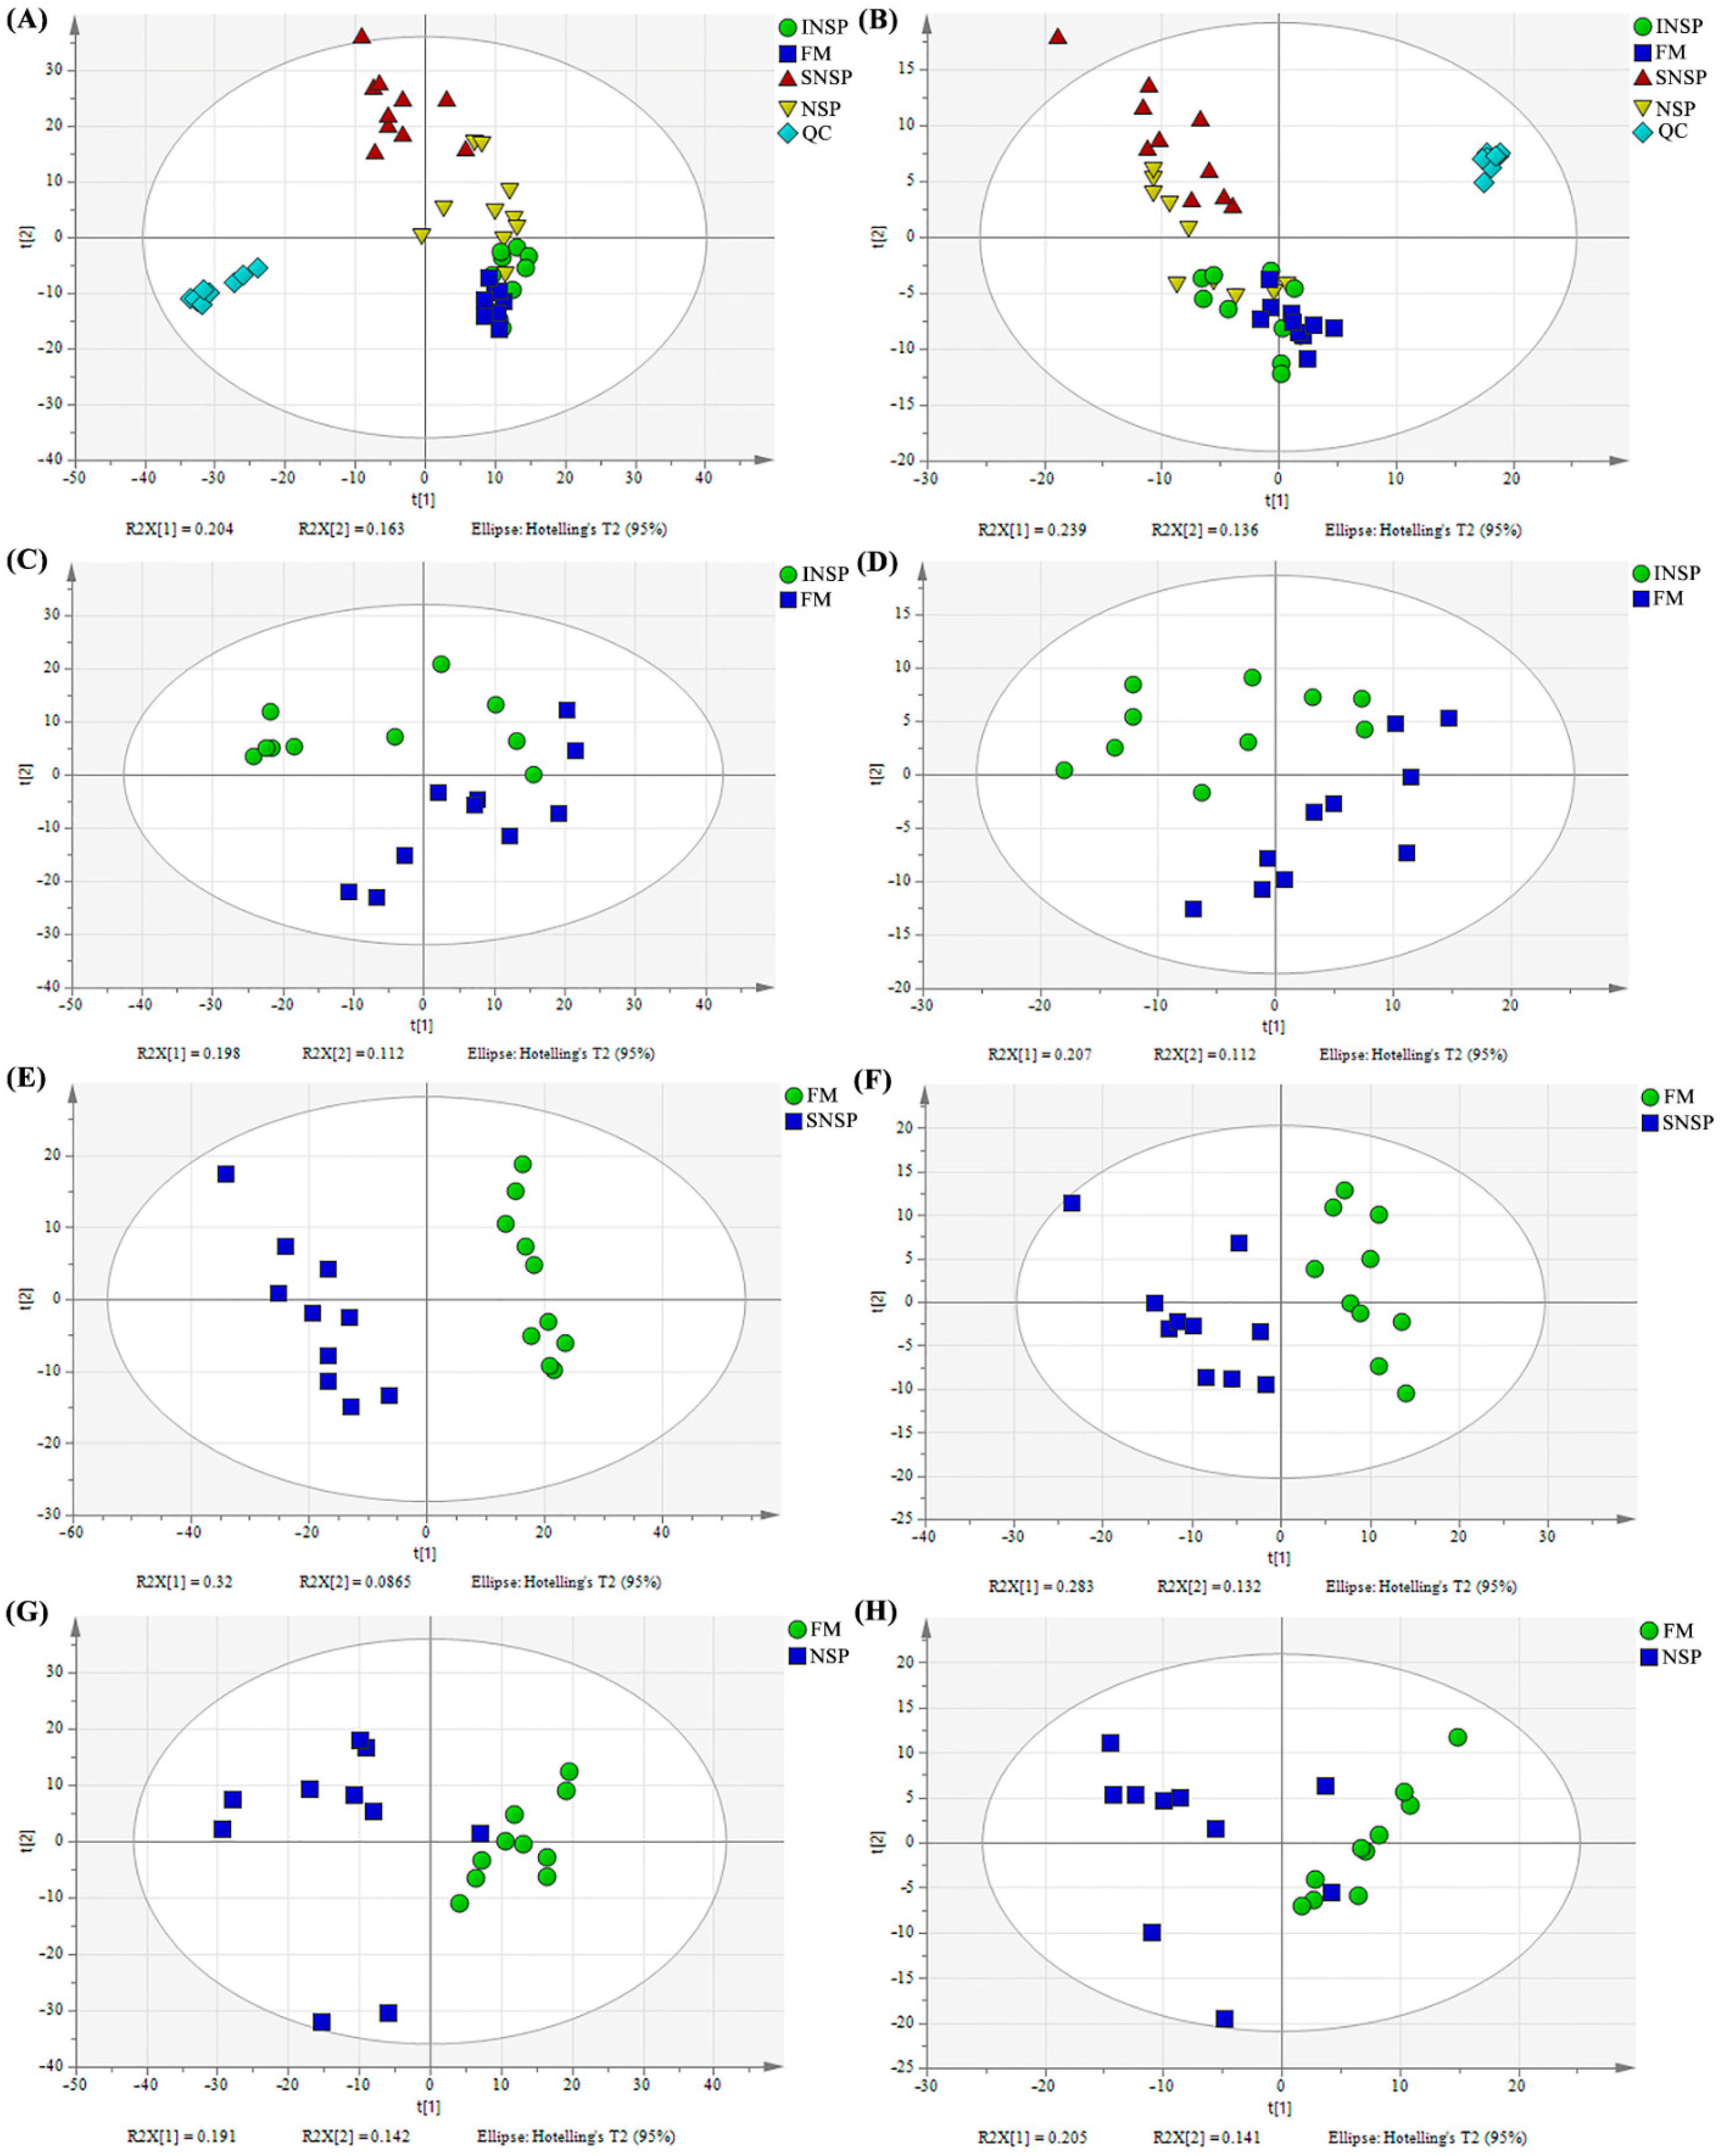
3.1. Quality Control and PCA Analysis
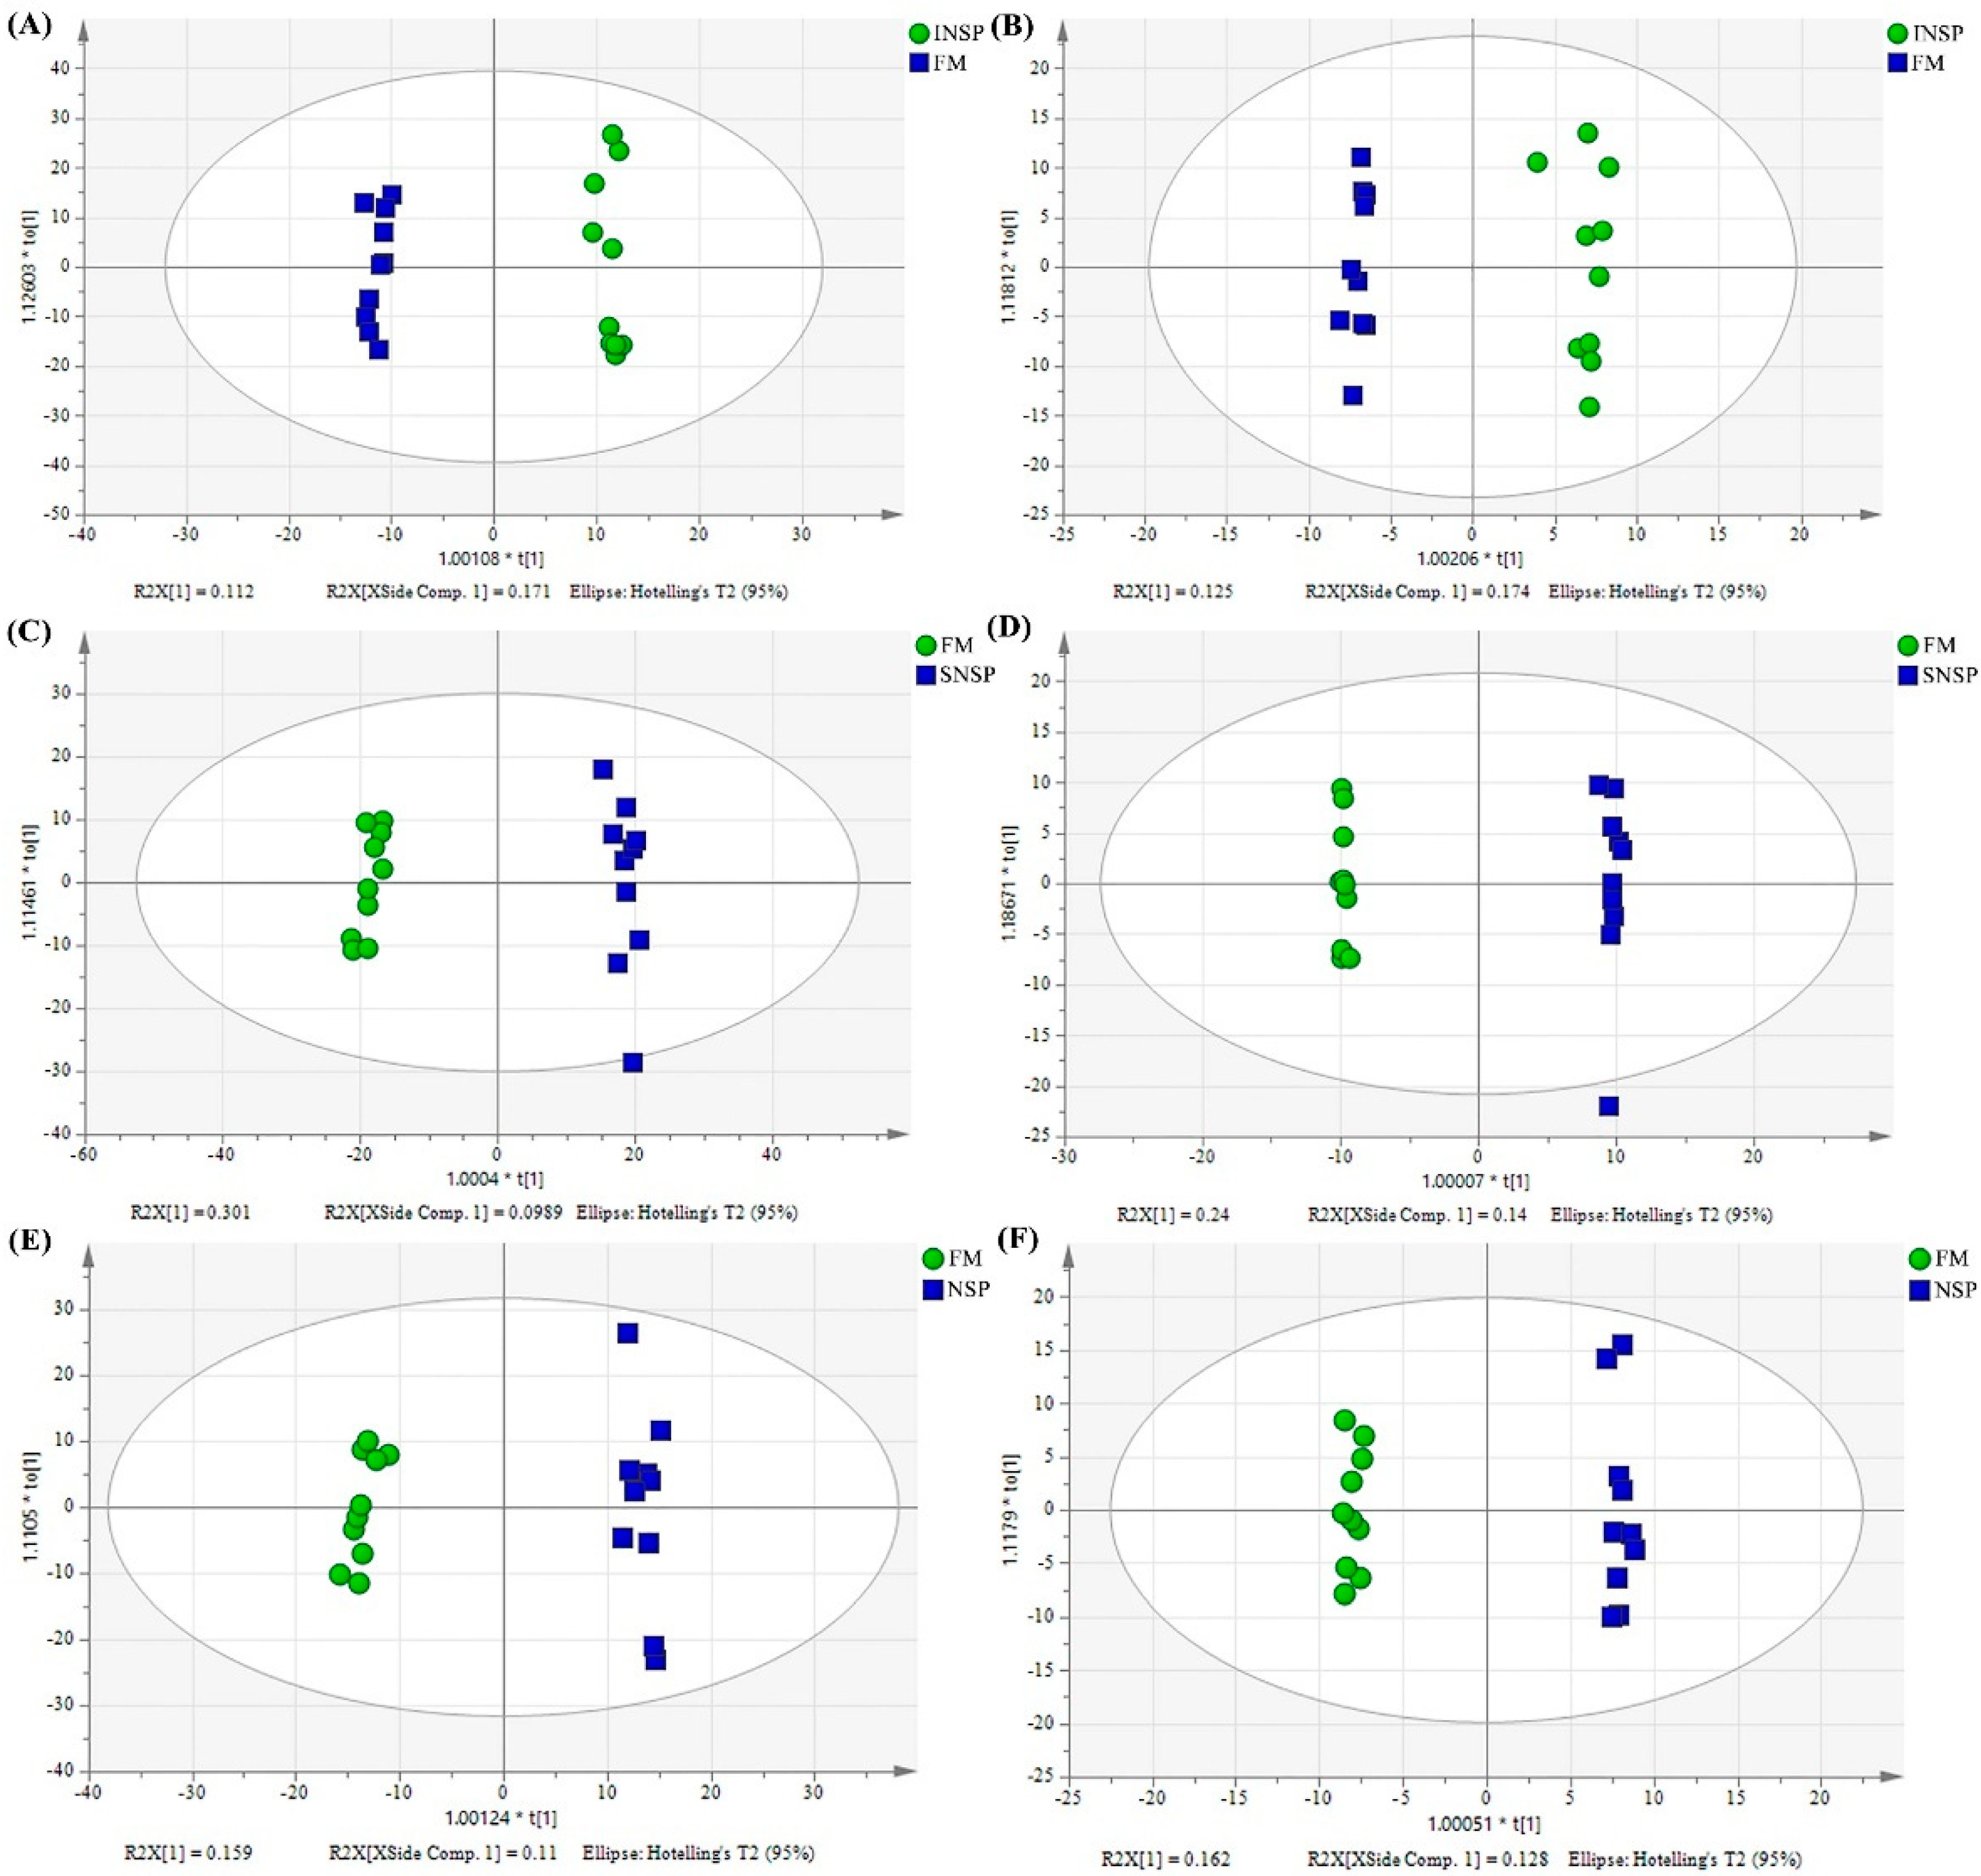
3.2. OPLS-DA Analysis and Differential Metabolite Identification
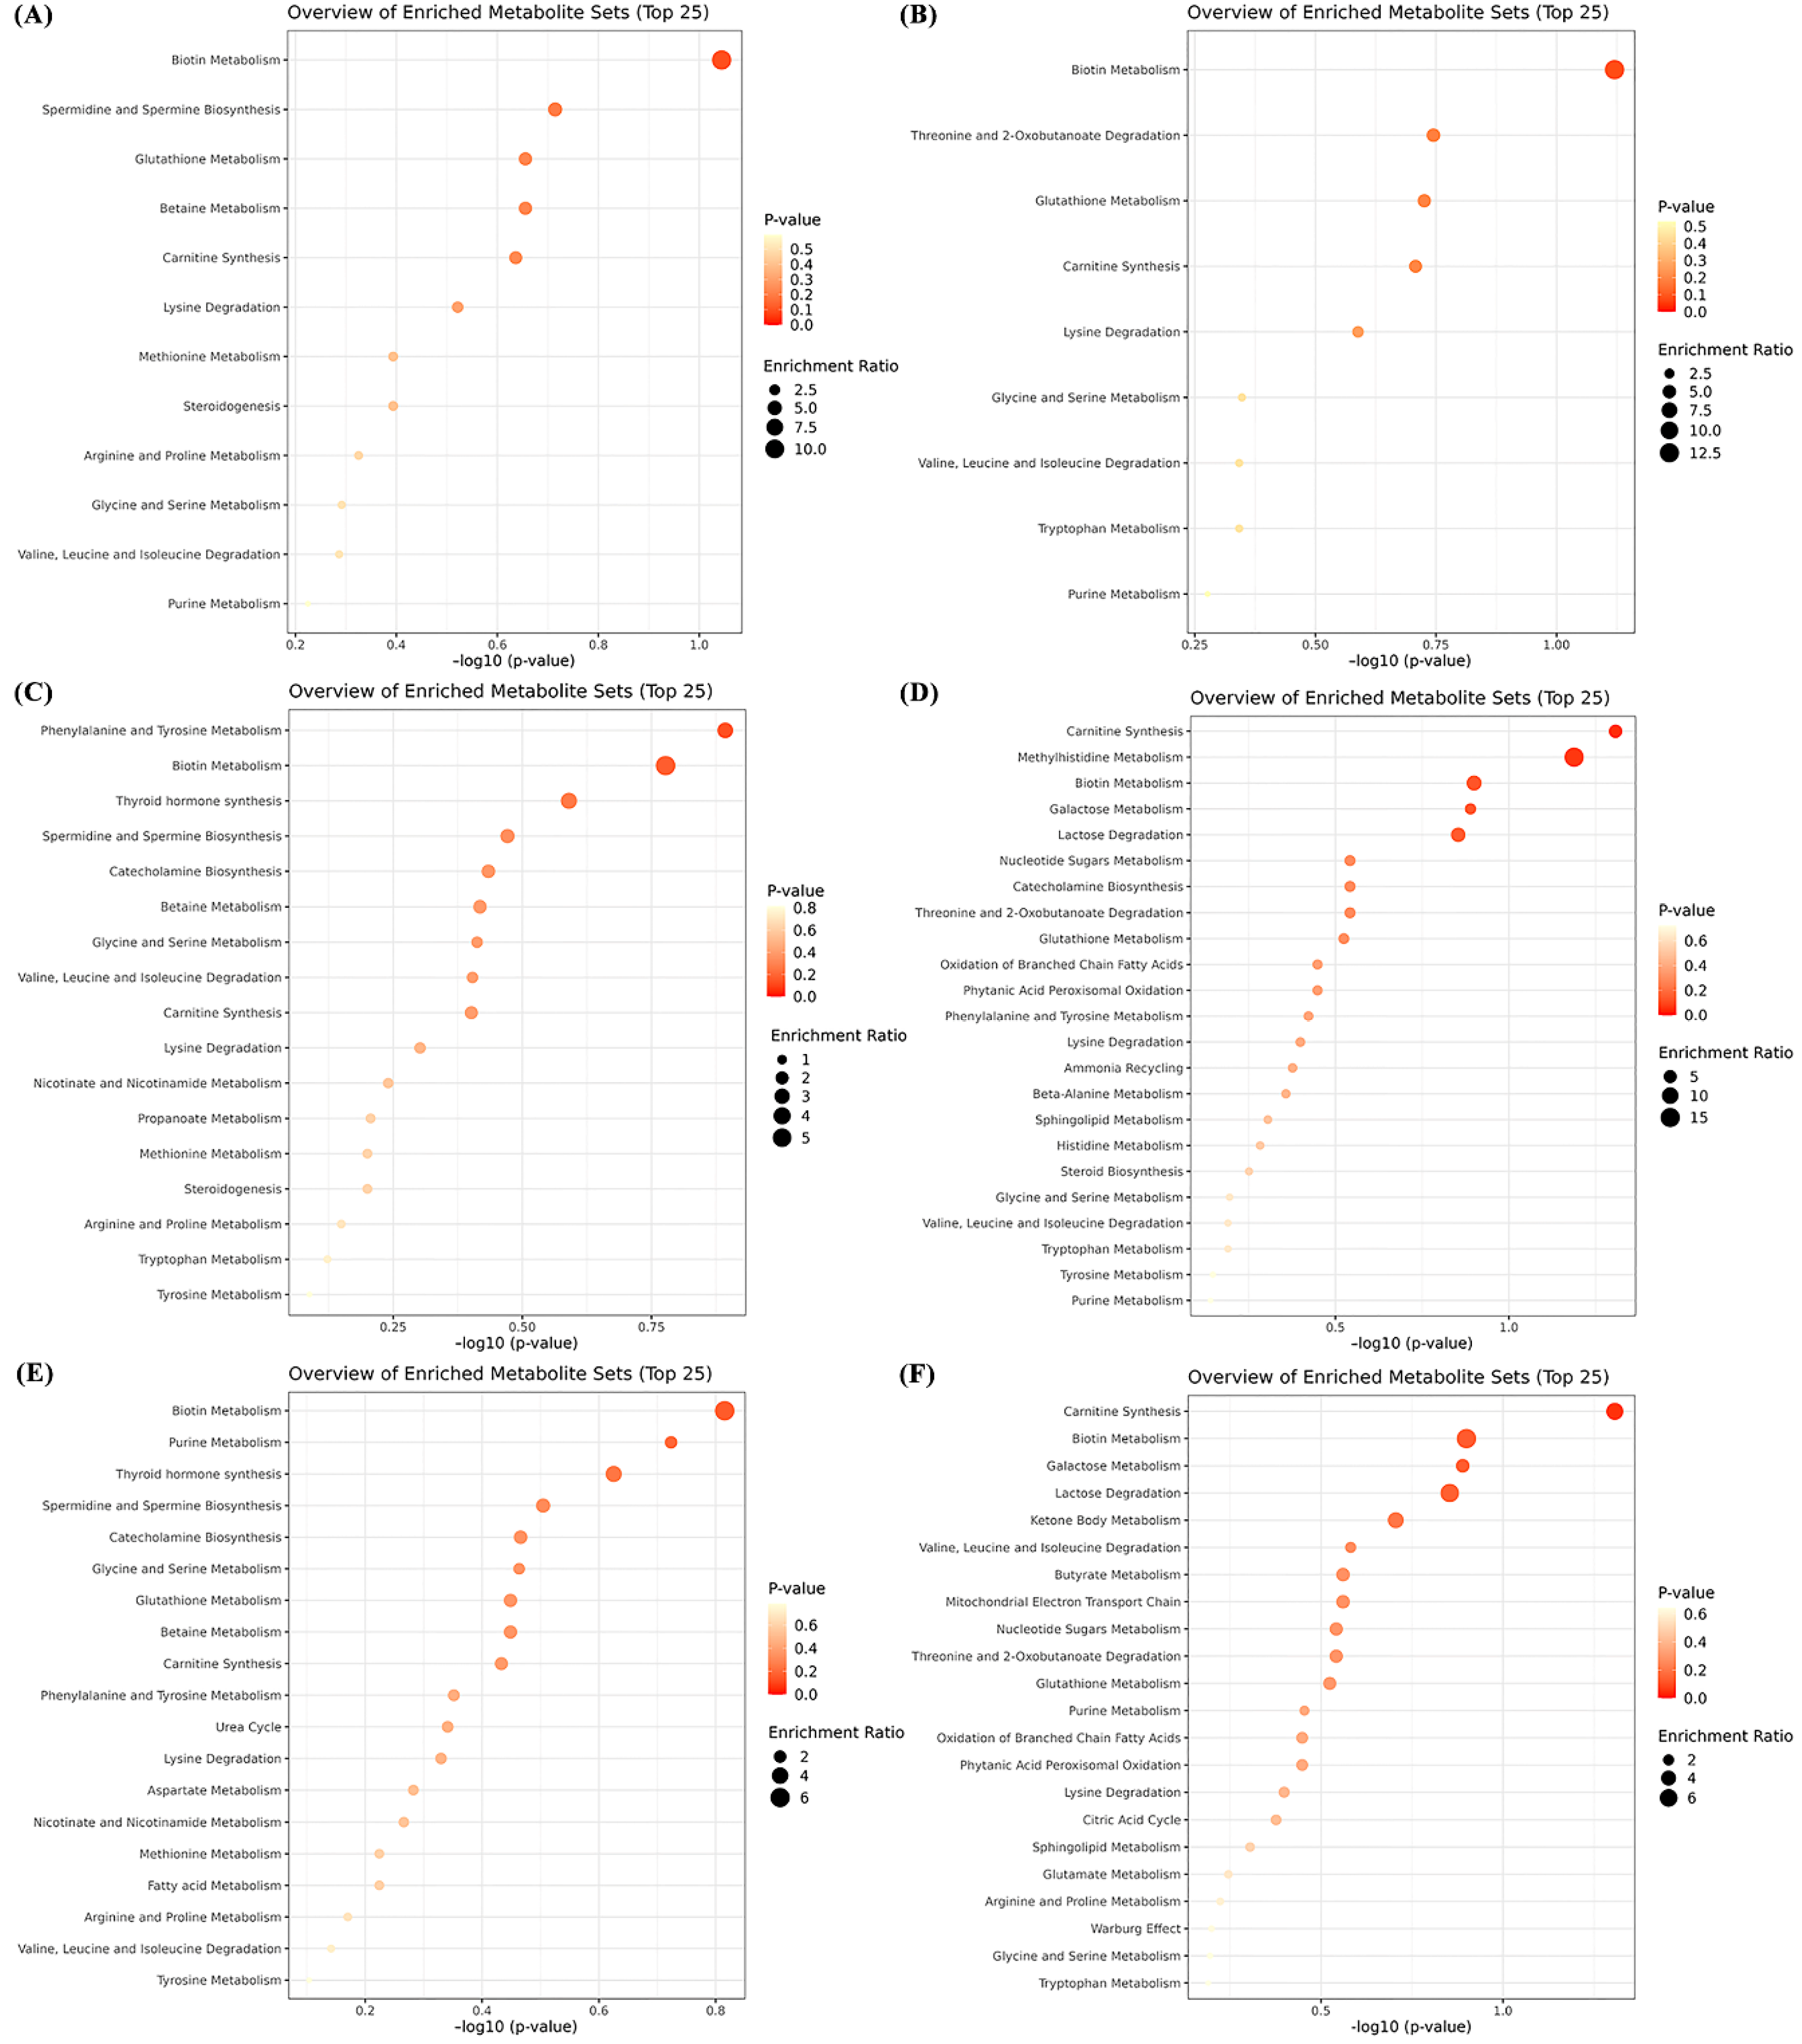
3.3. Metabolic Pathway Enrichment Analysis of Differential Metabolites
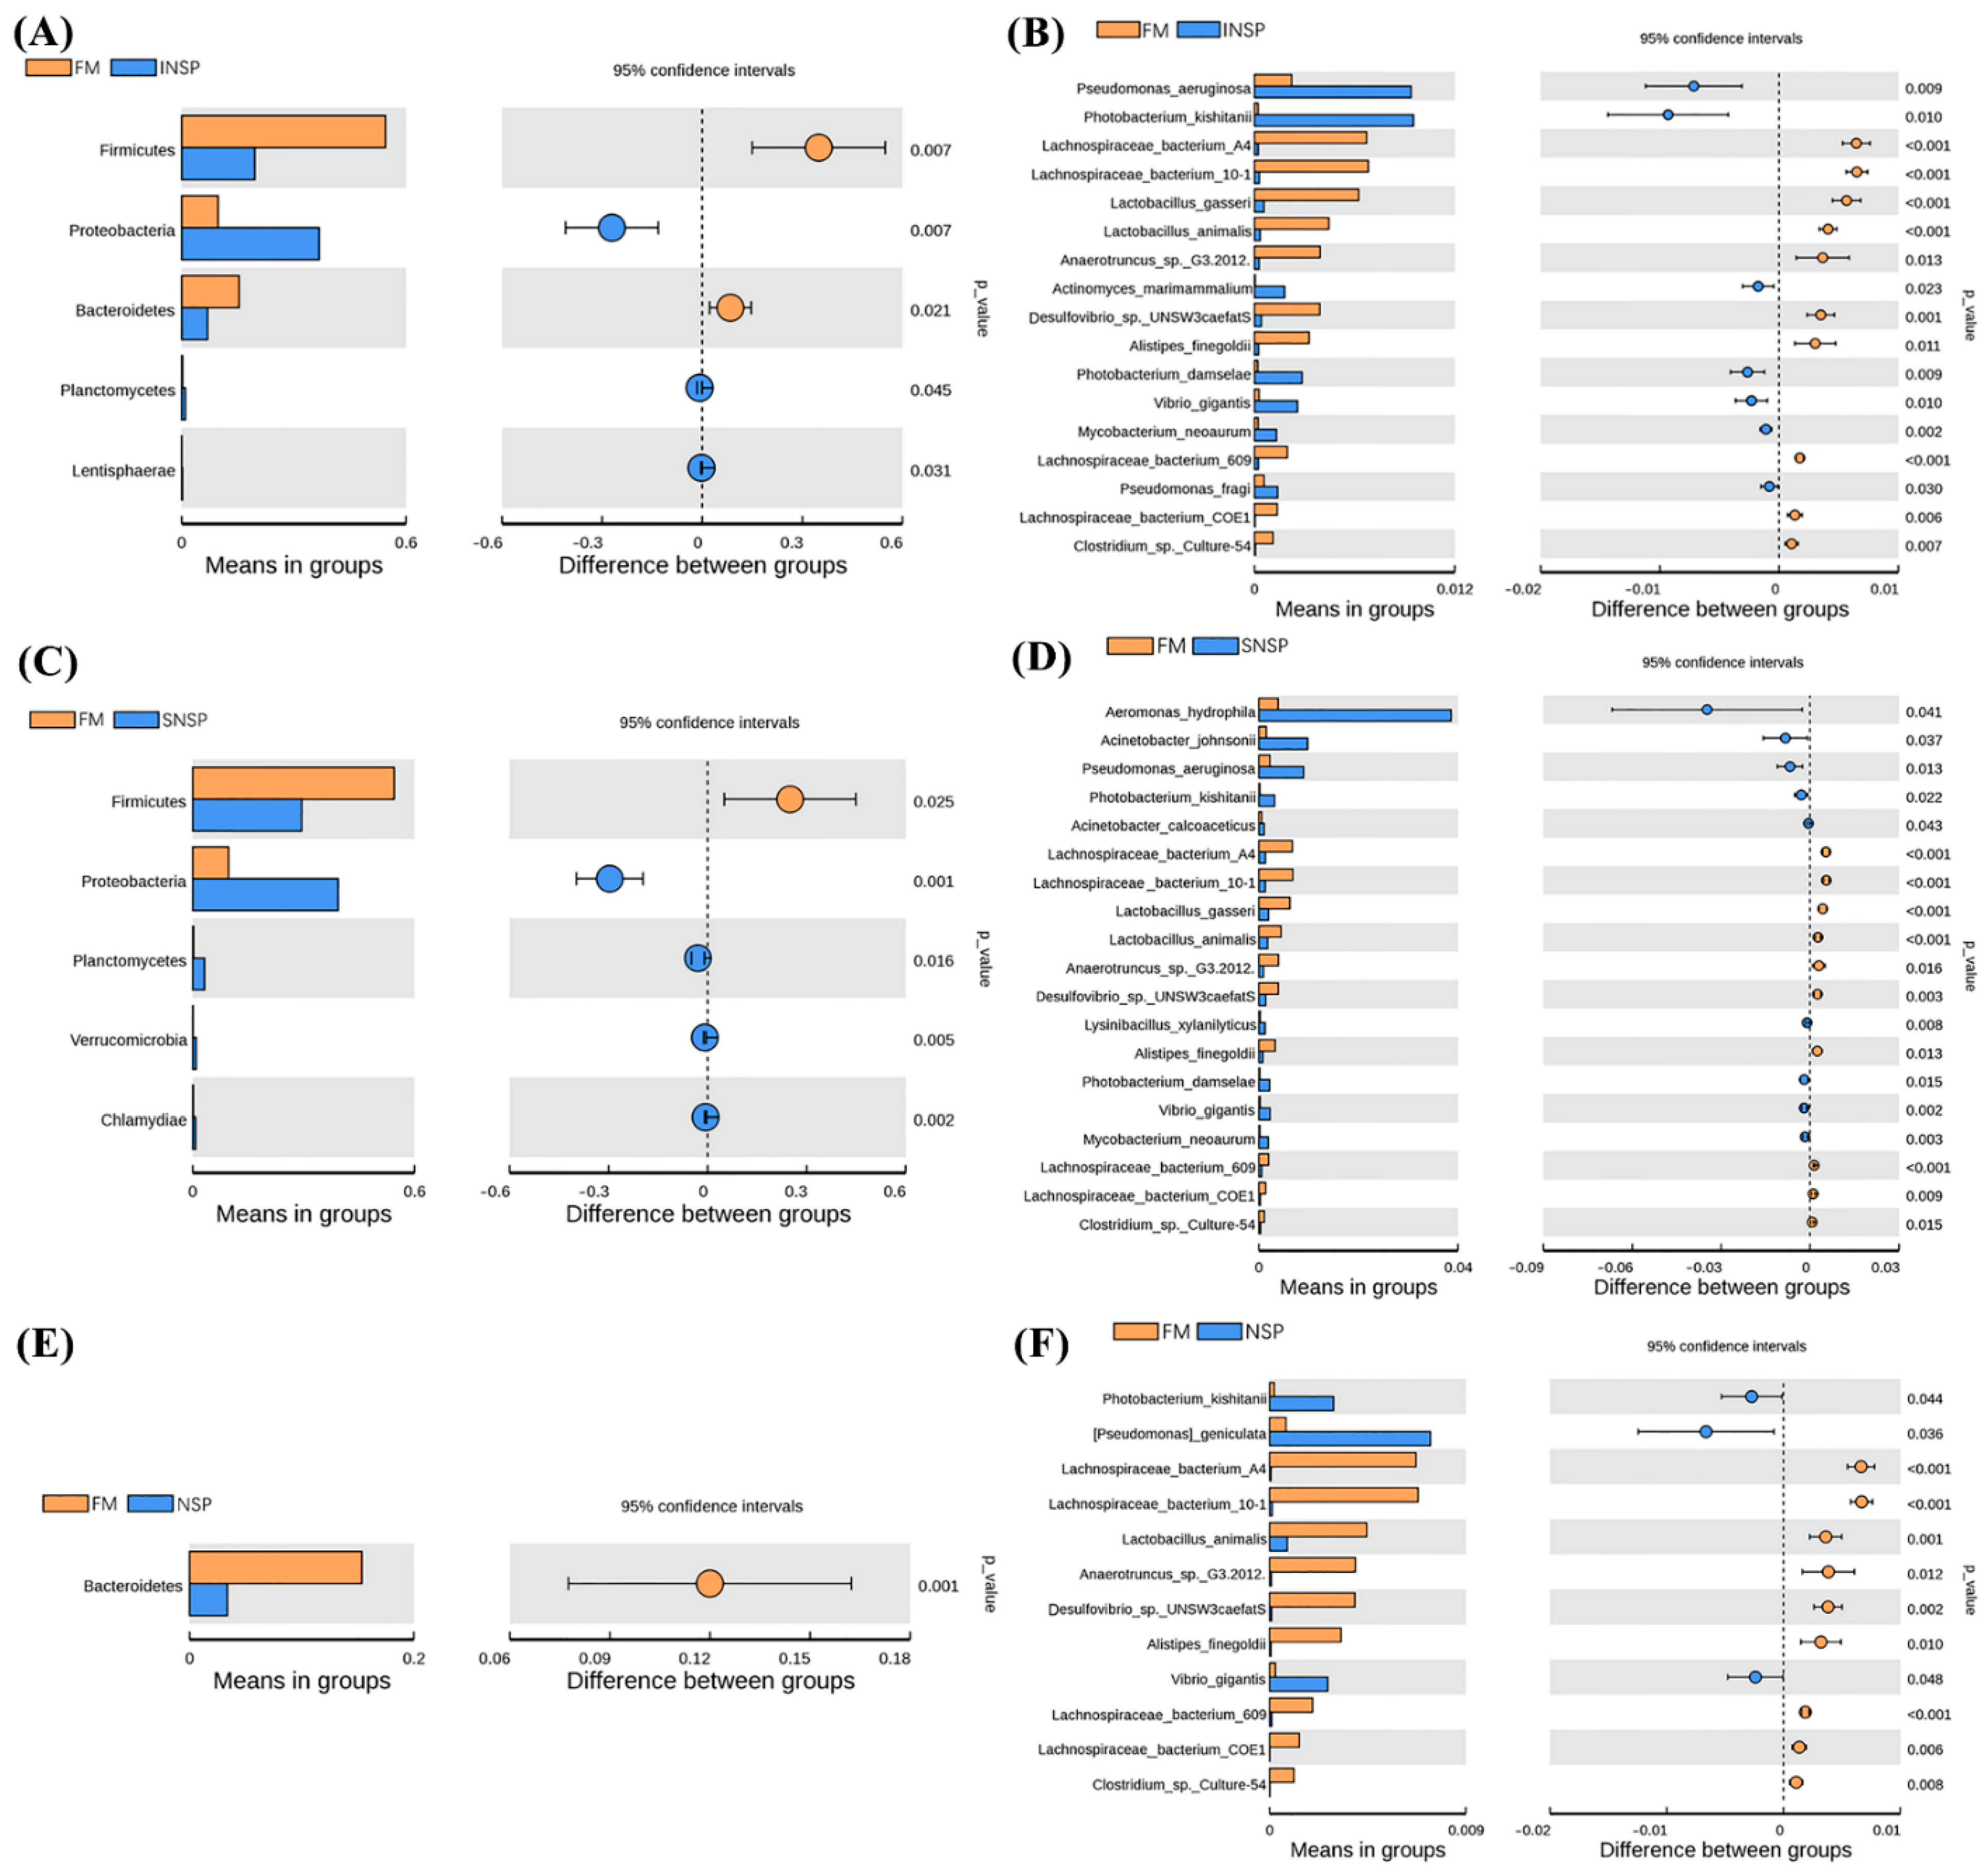
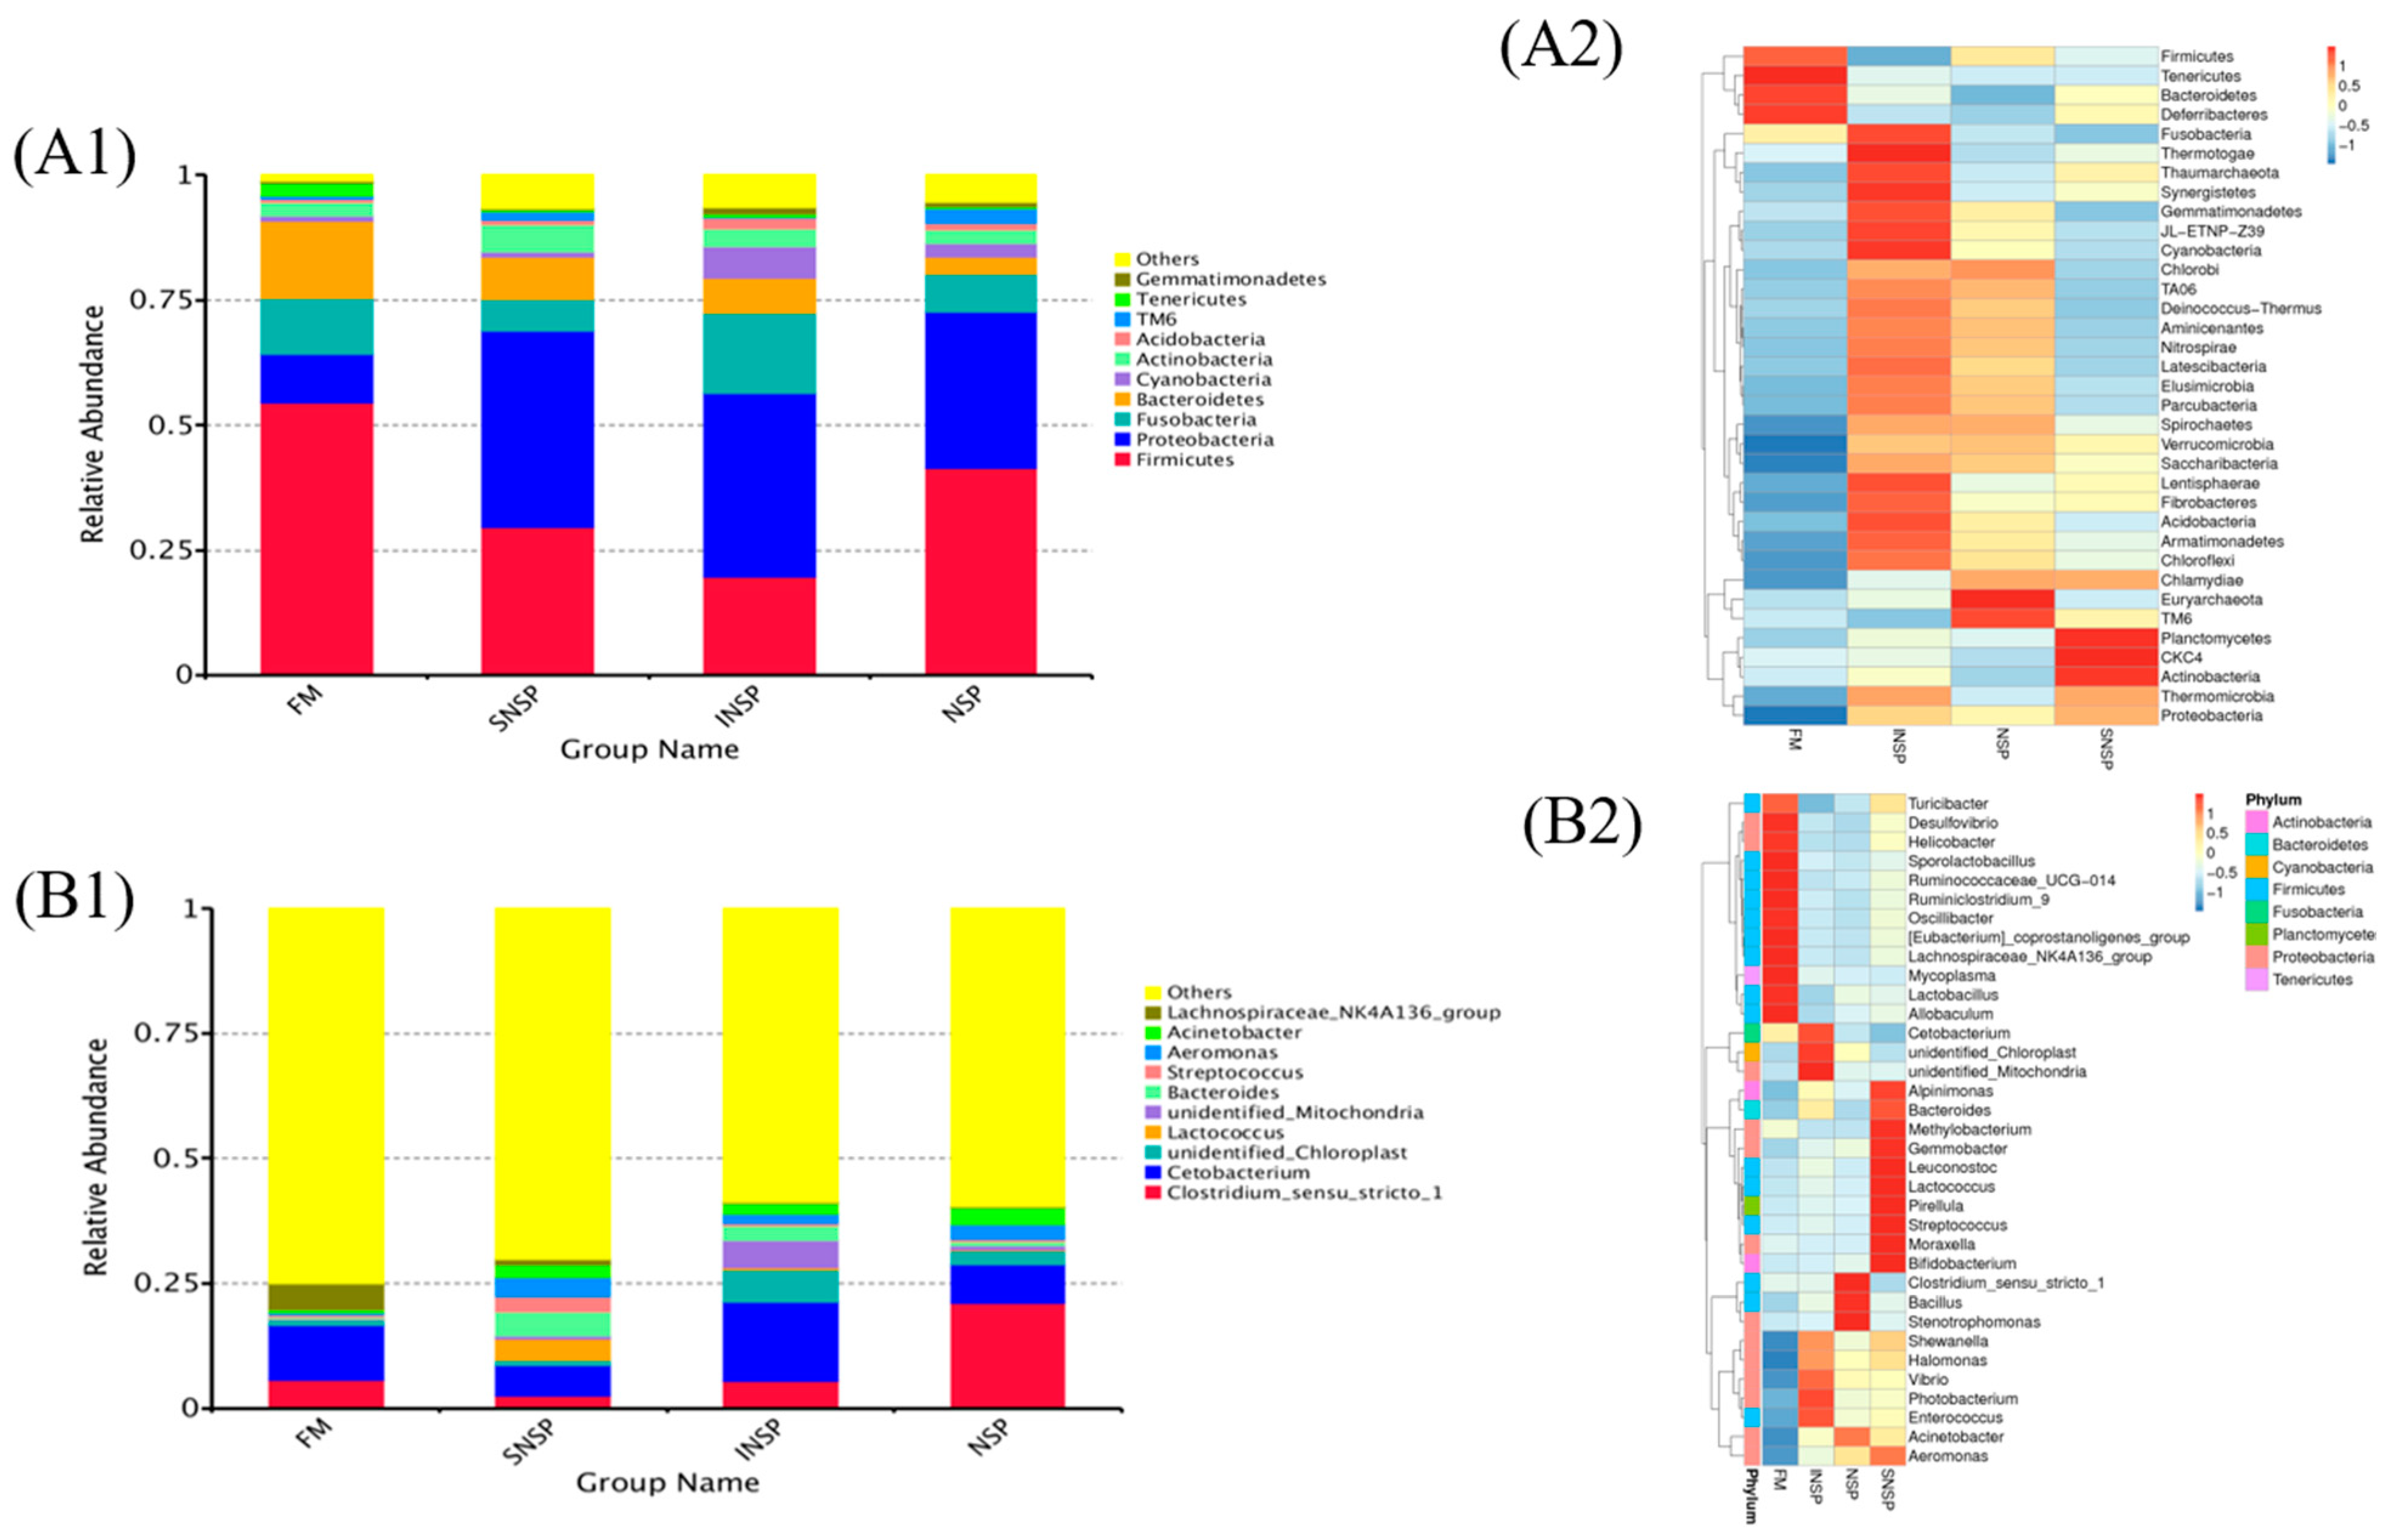
3.4. Microbiota Structure
4. Discussion
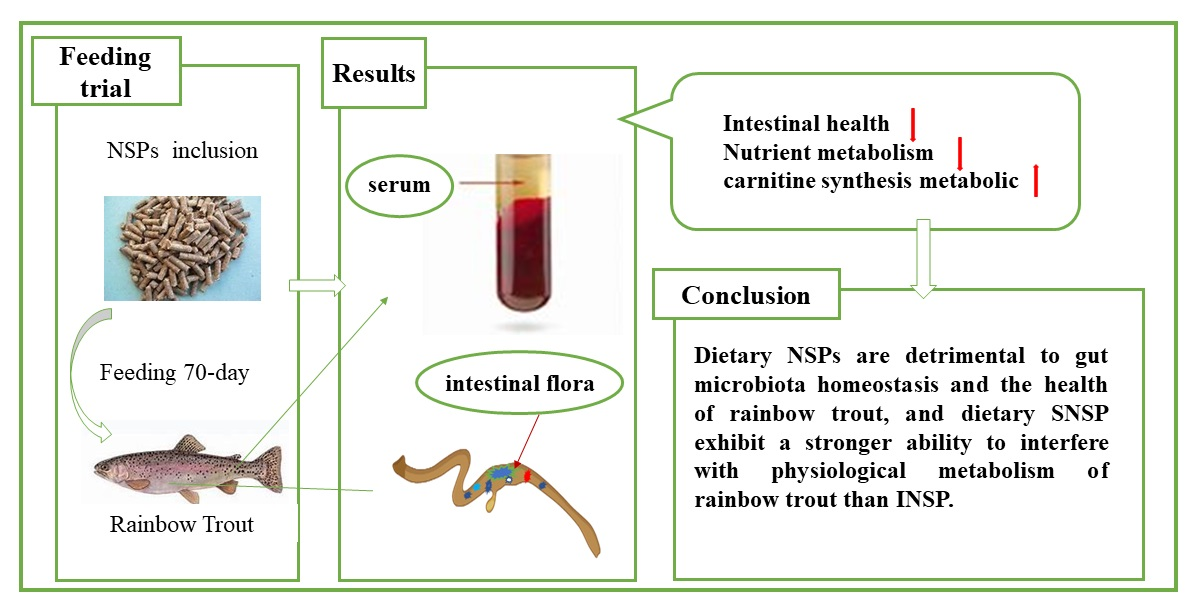
5. Conclusions
Supplementary Materials
Author Contributions
Funding
Institutional Review Board Statement
Informed Consent Statement
Data Availability Statement
Conflicts of Interest
References
- Liu, H.; Wang, F.; Zhang, S.; Li, C.; Ma, Y. Effect of Chinese Herbal Compound on Immune Protection of Rainbow Trout (Oncorhynchus mykiss). J. Guangdong Ocean Univ. 2022, 42, 7–12. [Google Scholar] [CrossRef]
- Denstadli, V.; Hillestad, M.; Verlhac, V.; Klausen, M.; Øverland, M. Enzyme pretreatment of fibrous ingredients for carnivorous fish: Effects on nutrient utilisation and technical feed quality in rainbow trout (Oncurhynchus mykiss). Aquaculture 2011, 319, 391–397. [Google Scholar] [CrossRef]
- Ma, R.; Liu, X.; Meng, Y.; Wu, J.; Zhang, L.; Han, B.; Zhou, C.; Xu, D.; Chen, L. Protein nutrition on sub-adult triploid rainbow trout (1): Dietary requirement and effect on anti-oxidative capacity, protein digestion and absorption. Aquaculture 2019, 507, 428–434. [Google Scholar] [CrossRef]
- Storebakken, T. Binders in fish feeds: I. Effect of alginate and guar gum on growth, digestibility, feed intake and passage through the gastrointestinal tract of rainbow trout. Aquaculture 1985, 47, 11–26. [Google Scholar] [CrossRef]
- Kaiser, F.; Harloff, H.; Tressel, R.; Graßl, A.L.; Parsche, F.; Schulz, C. Fat encapsulation and supplementation with free amino acids cannot compensate for negative effects from dietary rapeseed protein isolate on growth performance of rainbow trout (Oncorhynchus mykiss). Aquac. Rep. 2021, 20, 100702. [Google Scholar] [CrossRef]
- Deng, J.; Zhang, X.; Sun, Y.; Mi, H.; Zhang, L. Effects of different types of non-starch polysaccharides on growth, digestive enzyme activity, intestinal barrier function and antioxidant activity of rainbow trout (Oncorhynchus mykiss). Aquac. Rep. 2021, 21, 100864. [Google Scholar] [CrossRef]
- Cai, C.; Ren, S.; Cui, G.; Ni, Q.; Li, X.; Meng, Y.; Meng, Z.; Zhang, Z.; Su, X.; Chen, H. Short-term stress due to dietary pectin induces cholestasis, and chronic stress induces hepatic steatosis and fibrosis in yellow catfish, Pelteobagrus fulvidraco. Aquaculture 2019, 516, 734607. [Google Scholar] [CrossRef]
- Liu, Y.; Huang, H.; Fan, J.; Zhou, H.; Zhang, Y.; Cao, Y.; Wen, J.; Wen, Z.; Deng, J.; Tan, B. Effects of dietary non-starch polysaccharides level on the growth, intestinal flora and intestinal health of juvenile largemouth bass Micropterus salmoides. Aquaculture 2022, 557, 738343. [Google Scholar] [CrossRef]
- Liu, Y.; Zhang, Y.; Fan, J.; Zhou, H.; Huang, H.; Cao, Y.; Wen, J.; Wen, Z.; Deng, J.; Tan, B. Effects of Different Viscous Guar Gums on Growth, Apparent Nutrient Digestibility, Intestinal Development and Morphology in Juvenile Largemouth Bass, Micropterus salmoides. Front. Physiol. 2022, 13, 1558. [Google Scholar] [CrossRef]
- Ren, S.; Cai, C.; Cui, G.; Ni, Q.; Jiang, R.; Su, X.; Wang, Q.; Chen, W.; Zhang, Z.; Wu, P. High dosages of pectin and cellulose cause different degrees of damage to the livers and intestines of Pelteobagrus fulvidraco. Aquaculture 2020, 514, 734445. [Google Scholar] [CrossRef]
- Liu, Y.; Cao, Y.; Zhang, Y.; Fan, J.; Zhou, H.; Huang, H.; Wen, J.; Wei, Z.; Deng, J.; Tan, B. Intestinal flora and immunity response to different viscous diets in juvenile largemouth bass, Micropterus salmoides. Fish Shellfish Immunol. 2022, 127, 1012–1023. [Google Scholar] [CrossRef] [PubMed]
- Yang, P.; Hu, H.; Li, Y.; Ai, Q.; Zhang, W.; Zhang, Y.; Mai, K. Effect of dietary xylan on immune response, tight junction protein expression and bacterial community in the intestine of juvenile turbot (Scophthalmus maximus L.). Aquaculture 2019, 512, 734361. [Google Scholar] [CrossRef]
- Liu, Y.; Deng, J.; Tan, B.; Xie, S.; Zhang, W. Effects of Soluble and Insoluble Non-Starch Polysaccharides on Growth Performance, Digestive Enzyme Activity, Antioxidant Capacity, and Intestinal Flora of Juvenile Genetic of Improvement of Farmed Tilapia (Oreochromis niloticus). Front. Mar. Sci. 2022, 9, 735. [Google Scholar] [CrossRef]
- He, Y.; Chi, S.Y.; Tan, B.; Zhang, H.; Dong, X.H.; Yang, Q.; Wen, W.; Liang, J.; Tian, X.; Fu, W. Effect of Yeast Culture on Intestinal Microbiota of Litopenaeus vannamei. J. Guangdong Ocean Univ. 2017, 37, 21–27. [Google Scholar]
- Tomassini, A.; Curone, G.; Solè, M.; Capuani, G.; Sciubba, F.; Conta, G.; Miccheli, A. NMR-based metabolomics to evaluate the milk composition from Friesian and autochthonous cows of Northern Italy at different lactation times. Nat. Prod. Res. 2019, 33, 1085–1091. [Google Scholar] [CrossRef] [PubMed]
- Xu, W.; Kenéz, Á.; Mann, S.; Overton, T.R.; Wakshlag, J.J.; Nydam, D.V.; Tao, F.; Francisco, L. Effects of dietary branched-chain amino acid supplementation on serum and milk metabolome profiles in dairy cows during early lactation. J. Dairy Sci. 2022, 10, 8497–8508. [Google Scholar] [CrossRef]
- Bar, N.; Korem, T.; Weissbrod, O.; Zeevi, D.; Rothschild, D.; Leviatan, S.; Kosower, N.; Lotan-Pompanet, M.; Weinberger, A.; Le Roy, C.I. A reference map of potential determinants for the human serum metabolome. Nature 2020, 588, 135–140. [Google Scholar] [CrossRef]
- Xu, W.; Mann, S.; Curone, G.; Kenéz, Á. Heat treatment of bovine colostrum: Effects on colostrum metabolome and serum metabolome of calves. Animal 2021, 15, 100180. [Google Scholar] [CrossRef]
- Neyrinck, A.M.; Rodriguez, J.; Zhang, Z.; Nazare, J.; Bindels, L.B.; Cani, P.D.; Véronique, M.; Martine, L.; Stephan, C.B.; Jens, W. Breath volatile metabolome reveals the impact of dietary fibres on the gut microbiota: Proof of concept in healthy volunteers. Ebiomedicine 2022, 80, 104051. [Google Scholar] [CrossRef]
- Deng, J.M.; Lin, B.B.; Zhang, X.D.; Guo, L.; Chen, L.S.; Li, G.B.; Wang, Q.; Yu, C.; Mi, H. Effects of dietary sodium humate on growth, antioxidant capacity, non-specific immune response, and resistance to Aeromonas hydrophila in genetic improvement of farmed tilapia (GIFT, Oreochromis niloticus). Aquaculture 2020, 520, 734788. [Google Scholar] [CrossRef]
- Zhang, W.; Tan, B.; Pang, A.; Deng, J.; Yang, Q.; Zhang, H. Screening of Potential Biomarkers for Soybean Meal Induced Enteritis in Pearl Gentian Grouper (Epinephelus fuscoguttatus♀ × Epinephelus lanceolatus♂). J. Guangdong Ocean Univ. 2022, 42, 1–12. [Google Scholar] [CrossRef]
- Liu, Y.; Fu, X.; Zhou, H.; Fan, J.; Huang, H.; Deng, J.; Tan, B. Different Types of Non-Starch Polysaccharides Alter the Growth, Intestinal Flora and Serum Metabolite Profile of Grass. Metabolites 2022, 12, 1003. [Google Scholar] [CrossRef]
- Yang, L.; Zeng, X.; Qiao, S. Research Advances on Non-starch Polysaccharide in the Regulation of Intestinal Microflora in Pigs. Biotechnol. Bull. 2020, 36, 9–16. [Google Scholar] [CrossRef]
- Sinha, A.K.; Kumar, V.; Makkar, H.P.S.; De Boeck, G.; Becker, K. Non-starch polysaccharides and their role in fish nutrition-A review. Food Chem. 2011, 127, 1409–1426. [Google Scholar] [CrossRef]
- Zhang, Z. The Effects of Pectin and Xylan on Growth, Digestion and Intestinal Flora in Chinese Mitten Crab (Eriocheir sinensis) and Yellow Catfish (Pelteobagrus fulvidraco). Dr. Diss Soochow Univ. 2014, 557, 738343. [Google Scholar]
- Ghanbari, M.; Kneifel, W.; Domig, K.J. A new view of the fish gut microbiome: Advances from next-generation sequencing. Aquaculture 2015, 448, 464–475. [Google Scholar] [CrossRef]
- Foysal, M.J.; Gupta, S.K. A systematic meta-analysis reveals enrichment of Actinobacteria and Firmicutes in the fish gut in response to black soldier fly (Hermetica illucens) meal-based diets. Aquaculture 2022, 549, 737760. [Google Scholar] [CrossRef]
- Supatjaree, R.S.; Sup Yuki, K.; Naoshige, S.; Bhusita, W.; Jiro, N.A.S.N.; Nitisinprasert, S. Senior Thai Fecal Microbiota Comparison Between Vegetarians and Non-Vegetarians Using PCR-DGGE and Real-Time PCR. J. Microbiol. Biotechnol. 2014, 24, 1026–1033. [Google Scholar] [CrossRef]
- Marx, T. Immunoprotective Effects of Probiotics in the Elderly. In Foods and Dietary Supplements in the Prevention and Treatment of Disease in Older Adults; Watson, R.R., Ed.; Academic Press: San Diego, CA, USA, 2015; pp. 363–372. [Google Scholar]
- De Maesschalck, C.; Eeckhaut, V.; Maertens, L.; De Lange, L.; Marchal, L.; Daube, G.; Jeroen, D.; Freddy, H.; Richard, D.; Bernard, T. Amorphous cellulose feed supplement alters the broiler caecal microbiome. Poult. Sci. 2019, 98, 3811–3817. [Google Scholar] [CrossRef]
- Reichardt, N.; Duncan, S.H.; Young, P.; Belenguer, A.; McWilliam Leitch, C.; Scott, K.P.; Hantula, J. Phylogenetic distribution of three pathways for propionate production within the human gut microbiota. ISME J. 2014, 8, 1323–1335. [Google Scholar] [CrossRef] [Green Version]
- Hosseini, E.; Grootaert, C.; Verstraete, W.; Van de Wiele, T. Propionate as a health-promoting microbial metabolite in the human gut. Nutr. Rev. 2011, 69, 245–258. [Google Scholar] [CrossRef]
- Song, B.; Zheng, C.; Zheng, J.; Zhang, S.; Zhong, Y.; Guo, Q.; Li, F.; Long, F.; Xu, K.; Duan, Y. Comparisons of carcass traits, meat quality, and serum metabolome between Shaziling and Yorkshire pigs. Anim. Nutr. 2022, 8, 125–134. [Google Scholar] [CrossRef]
- Gong, B.; Bao, F.; Wang, Y.; Liu, H.; Xiao, M.; He, J. Metabonomics study on the effect of traditional Chinese medicines feed addition on growth performance and serum metabolic profile of juvenile Chinese softshell turtle (Pelodiscus sinensis Wiegmann). Aquac. Rep. 2021, 20, 100632. [Google Scholar] [CrossRef]
- Shi, H.; Zhao, S.; Wang, K.; Fan, M.; Han, Y.; Wang, H. Effects of dietary Astragalus Membranaceus supplementation on growth performance, and intestinal morphology, microbiota and metabolism in common carp (Cyprinus carpio). Aquac. Rep. 2022, 22, 100955. [Google Scholar] [CrossRef]
- Longo, N.; Frigeni, M.; Pasquali, M. Carnitine transport and fatty acid oxidation. Biochim. Biophys. Acta (BBA)-Mol. Cell Res. 2016, 1863, 2422–2435. [Google Scholar] [CrossRef]
- Abdallah, G.; Dong, Z.; Mohammed, F.; Wang, Q. The Impact of Carnitine on Dietary Fiber and Gut Bacteria Metabolism and Their Mutual Interaction in Monogastrics. Int. J. Mol. Sci. 2018, 19, 1008. [Google Scholar] [CrossRef] [Green Version]
- Sachan, D.S.; Hoppel, C.L. Carnitine biosynthesis. Hydroxylation of N6-trimethyl-lysine to 3-hydroxy-N6-trimethyl-lysine. Biochem. J. 1980, 188, 529–534. [Google Scholar] [CrossRef] [Green Version]
- Miyada, T.; Nakajima, A.; Ebihara, K. Iron bound to pectin is utilised by rats. Brit. J. Nutr. 2011, 106, 73–78. [Google Scholar] [CrossRef] [Green Version]
- Torre, M.; Rodriguez, A.R.; Saura-Calixto, F. Interactions of Fe (II), Ca (II) and Fe (III) with high dietary fibre materials: A physicochemical approach. Food Chem. 1995, 54, 23–31. [Google Scholar] [CrossRef]
- Kraugerud, O.F.; Penn, M.; Storebakken, T.; Refstie, S.L.; Krogdahl, S.; Svihus, B. Nutrient digestibilities and gut function in Atlantic salmon (Salmo salar) fed diets with cellulose or non-starch polysaccharides from soy. Aquaculture 2007, 273, 96–107. [Google Scholar] [CrossRef]
- Leenhouwers, J.I.; Veld, M.T.; Verreth, J.; Schrama, J.W. Digesta characteristiscs and performance of African catfish (Clarias gariepinus) fed cereal grains that differ in viscosity. Aquaculture 2007, 264, 330–341. [Google Scholar] [CrossRef]
- Li, J.; Li, L.; Qin, X.; Degrace, P.; Demizieux, L.; Limbu, S.M.; Wang, X.; Zhang, M.; Li, D.; Du, Z. Inhibited Carnitine Synthesis Causes Systemic Alteration of Nutrient Metabolism in Zebrafish. Front. Physiol. 2018, 9, 509. [Google Scholar] [CrossRef] [PubMed]


| FM | INSP | NSP | NSPs | |
|---|---|---|---|---|
| Effective Tags | 63,957.00 ± 1300.49 | 64,044.00 ± 3384.14 | 65,748.25 ± 5820.50 | 67,629.75 ± 4018.80 |
| Shannon | 6.65 ± 0.25 | 7.36 ± 0.17 | 7.12 ± 1.04 | 6.02 ± 1.29 |
| Simpson | 0.94 ± 0.02 | 0.93 ± 0.03 | 0.97 ± 0.01 | 0.88 ± 0.06 |
| Chao1 | 1667.05 ± 8.84 | 2762.44 ± 505.06 | 2144.58 ± 126.56 | 2203.73 ± 525.44 |
| ACE | 1705.18 ± 51.96 | 2746.35 ± 513.16 | 2179.36 ± 125.66 | 2259.24 ± 531.05 |
| Goods coverage | 0.99 ± 0.00 | 0.99 ± 0.00 | 0.99 ± 0.00 | 0.99 ± 0.00 |
| Group | R-Value | p-Value |
|---|---|---|
| FM-INSP | 0.781 | 0.032 |
| FM-SNSP | 1.000 | 0.021 |
| FM-NSP | 0.583 | 0.028 |
Publisher’s Note: MDPI stays neutral with regard to jurisdictional claims in published maps and institutional affiliations. |
© 2022 by the authors. Licensee MDPI, Basel, Switzerland. This article is an open access article distributed under the terms and conditions of the Creative Commons Attribution (CC BY) license (https://creativecommons.org/licenses/by/4.0/).
Share and Cite
Zhou, H.; Liu, Y.; Fan, J.; Huang, H.; Deng, J.; Tan, B. Feeding Rainbow Trout with Different Types of Non-Starch Polysaccharides: Impacts on Serum Metabolome and Gut Microbiota. Metabolites 2022, 12, 1167. https://doi.org/10.3390/metabo12121167
Zhou H, Liu Y, Fan J, Huang H, Deng J, Tan B. Feeding Rainbow Trout with Different Types of Non-Starch Polysaccharides: Impacts on Serum Metabolome and Gut Microbiota. Metabolites. 2022; 12(12):1167. https://doi.org/10.3390/metabo12121167
Chicago/Turabian StyleZhou, Hang, Yu Liu, Jiongting Fan, Huajing Huang, Junming Deng, and Beiping Tan. 2022. "Feeding Rainbow Trout with Different Types of Non-Starch Polysaccharides: Impacts on Serum Metabolome and Gut Microbiota" Metabolites 12, no. 12: 1167. https://doi.org/10.3390/metabo12121167
APA StyleZhou, H., Liu, Y., Fan, J., Huang, H., Deng, J., & Tan, B. (2022). Feeding Rainbow Trout with Different Types of Non-Starch Polysaccharides: Impacts on Serum Metabolome and Gut Microbiota. Metabolites, 12(12), 1167. https://doi.org/10.3390/metabo12121167