Abstract
In 2016, the WHO introduced new guidelines for the diagnosis of brain gliomas based on new genomic markers. The addition of these new markers to the pre-existing diagnostic methods provided a new level of precision for the diagnosis of glioma and the prediction of treatment effectiveness. Yet, despite this new classification tool, glioblastoma (GBM), a grade IV glioma, continues to have one of the highest mortality rates among central nervous system tumors. Metabolomics is a particularly promising tool for the analysis of GBM tumors and potential methods of treating them, as it is the only “omics” approach that is capable of providing a metabolic signature of a tumor’s phenotype. With careful experimental design, cell cultures can be a useful matrix in GBM metabolomics, as they ensure stable conditions and, under proper conditions, are capable of capturing different tumor phenotypes. This paper reviews in vitro metabolomic profiling studies of high-grade gliomas, with a particular focus on sample-preparation techniques, crucial metabolites identified, cell culture conditions, in vitro-in vivo extrapolation, and pharmacometabolomics. Ultimately, this review aims to elucidate potential future directions for in vitro GBM metabolomics.
1. Introduction
Glioblastoma (GBM) is one of the most aggressive and difficult-to-treat central nervous system (CNS) brain tumors. Since 2007, the World Health Organization (WHO) has classified gliomas based on their cell type and aggressiveness, with Class I consisting of benign tumors, and Class IV comprising the most aggressive types of tumors. GBM is a Class IV brain tumor [1]. While this classification system allows clinicians to determine appropriate treatments and prognoses, years of studies have indicated that this approach should be supplemented with genetic testing, as it lacks adequate specificity on its own. As a result, in 2016 the WHO introduced a novel CNS grading system that provided a level of precision surpassing all known CNS diagnostic and classification methods. This novel grading system incorporated new genetic markers—for example, IDH1/IDH2, O6 -mtehylguanine DNA methyltransferase (MGMT), and epidermal growth factor receptors (EGFR)—thereby allowing clinicians to differentiate tumors not only by their cell type and aggressiveness, as was possible with pre-existing methods, but also by the genetic phenotype of the neoplastic cells, thus providing better correlation with the tumor prognosis [2]. Despite this new, improved diagnostic system, GBM continues to be the most lethal primary malignant CNS tumor. Indeed, in the USA, patients diagnosed with GBM have an average life-expectancy of eight months, with only 7.2% surviving beyond five years of diagnosis [3].
The treatment of GBM remains a challenge, as newly proposed drugs must meet specific requirements, such as being able to cross the blood-brain barrier (BBB) and efficiently infiltrating the tumor. GBM tumors are known for their complex structure, which is the result of a demanding growth environment. Other features of GBM tumors that make them so challenging to treat include high proliferation indices, angiogenesis, and pseudopalisading necrosis [4]. Intratumoral hypoxia is caused by rapid cell proliferation and vascular collapse, and it induces the expression of hypoxia-inducible factor-1 (HIF-1), which is responsible for regulating many key processes involved in tumor progression and invasion. Among these processes, metabolic reprogramming appears to be critical in understanding the resistance of GBM tumors to chemotherapy and radiation therapy [5]. The most commonly used method of treating GBM is tumor resection followed by radiation therapy and/or chemotherapy with temozolomide (TMZ) [6], an alkylating agent that targets cells undergoing intense proliferation. TMZ works by inducing DNA methylation, which in turn arrests the cell cycle and, consequently, induces apoptosis, autophagy and senescence [7]. Since the methylation of the O6 position of guanine caused by TMZ can only be repaired by the enzyme, MGMT [8], tumors expressing MGMT may exhibit a natural resistance to TMZ. However, resistance to TMZ can still develop over time, even in tumors that responded positively to treatment with it. Studies examining the role of hypoxia in TMZ resistance have found that, while hypoxia mediates some important processes that facilitate TMZ resistance in GBMs, the tumors can be resensitized via hyperoxia [9,10,11]. Similarly, anti-angiogenesis-based therapies such as targeted therapy using the vascular endothelial growth factor (VEGF) inhibitor, bevacizumab are also susceptible to the same problem of resistance due to hypoxia. As with TMZ, bevacizumab resistance has also been linked to hypoxia [12,13]. Moreover, GBM tumors are difficult to treat due to their heterogeneous nature. In particular, their concentration of glioma stem-like cells (GSCs) can pose a distinct challenge, as these cells possess properties that allow them to change their cellular phenotypes in response to existing microenvironment conditions. This plasticity has also been linked to hypoxia [14,15]. The key role played by hypoxia in regulating the microenvironments of many different types of tumors has led researchers to focus greater amounts of attention on the potential of therapies targeting hypoxic regions [16].
The metabolomic reprogramming of cancer cells is a well-known phenomenon. The stressful environment created by hypoxia generally impairs oxidative phosphorylation and TCA cycle activity in the intensely proliferating tumor cells and enhances glycolysis and lactic acid production. This phenomenon, also known as the Warburg effect, is indirectly strengthened by HIF-1 expression in hypoxic environments. However, it remains unclear how exactly hypoxia influences the metabolomic reprogramming of tumor cells. As such, the development of models that more accurately represent tumor microenvironment metabolomics is required [17,18,19].
Metabolomics, along with genomics, transcriptomics, and proteomics, comprise the group of sciences known as “Omics.” Metabolomics focuses on the analysis of small molecules (<1.5 kDa) produced as a result of metabolism [20]. It is possible to obtain a relatively full picture of the state of a given cell or tissue by analyzing its endogenous and exogenous metabolites [21]. The great advantage of metabolomics is that the metabolome accurately mirrors the phenotype and influence of factors external to the analyzed cell, which cannot be captured as precisely with genomics or proteomics [22].
Recently, in vitro studies using both established GBM cell lines and primary GBM cells have been gaining in popularity due to rapid developments in 3D in vitro culture techniques. One reason for this surge in popularity is that 3D culture systems provide a more accurate microenvironment, as they capture important cell-matrix and cell-cell interactions that are absent from cells cultured as a two-dimensional monolayer (2D) [23,24]. However, there are many challenges that must be overcome in order to efficiently conduct metabolomic research using in vitro cell cultures, both 2D and 3D. For example, metabolomics requires careful experimental design with regards to cell culture normalization, cell disruption, metabolism quenching, and metabolome extraction [25]. 2D cell culture is a well-known model for in vitro studies that is easier to normalize, opposed to 3D cell cultures, where each cell spheroid can have different cell number, size, and shape. Standard monolayer culture is also easy to conduct, as protocols for culturing and testing 2D cell cultures were well established through the years. In turn, 3D cell culture reflects in vivo tumor complexity better, yet it is a relatively new culture method and standard culturing and testing protocols are yet to be established. Nevertheless, with appropriate experimental design, metabolomics of GBM cell cultures can deliver information about alternate metabolic pathways, potential biomarkers, and with proper in vitro-in vivo extrapolation (IVIVE), drug development and repurposing.
This review provides an overview of the major sample-preparation methods for metabolomics analysis, and analyzes promising metabolomics studies with GBM cell lines within the context of the potential biomarkers, therapeutic targets, and IVIVE.
2. Sample Preparation for In Vitro Studies
Investigations of the metabolomes of various GBM cell lines consist of two parts: extracellular and intracellular. The extracellular investigation is performed using a cell-culture medium that is simply pulled after cell growth, followed by an optional centrifugation step and the addition of an organic solvent for LC-MS and GC analysis (e.g., methanol, acetonitrile) [26,27,28]. An additional derivatization step is required for GC analysis [27,29], while medium filtration with either deuterated water [30], deuterated water with sodium 3-trimethylsilyl [2,2,3,3-2H4] propionate (TMSP), sodium 3-(trimethylsilyl)propionate-2,2,3,3-d4 (TSP), or sodium (2,2-dimethyl-2-silapentane-5-sulfonate) (DSS) is required for nuclear magnetic resonance (NMR) analysis [31]. The extracts are subjected to ultracentrifugation prior to LC and GC analysis in order to remove proteins and debris (e.g., from serum used in medium or cell debris). In one case, extracellular amino acid profiling was performed via protein precipitation with sulfosalicylic acid, followed by labelling with aTRAQTM agent [32].
The first step in most documented intracellular analysis protocols entails washing the sample in cold PBS solution in order to quench the metabolism of cells, which prevents alterations to metabolomics patterns from further manipulation. After this initial metabolism-quenching step one of two major approaches can be employed: examining cell detachment, or directly applying cold organic solvent to the surface of the growing cells. Cell detachment is assessed via trypsinization or manual cell scraping, followed by the addition of a solvent. These two steps are sometimes combined by adding the organic solvent directly onto the cell culture plate/Petri dish, followed by cell scraping. Next, the sample is transferred into tubes and vortexed/shaken, followed by ultracentrifugation in order to remove any debris. After ultracentrifugation, the samples are evaporated and either (1) reconstituted with a solvent that is compatible with liquid chromatography, (2) derivatized and injected on gas chromatography, or (3) reconstituted with deuterated water spiked with TSP [33,34,35], TMSP [31,36,37], DSS [38], and propionic-2,2,3,3,-d4 acid [38] or TMS [39] for nuclear magnetic resonance analysis. Aside from the above-described simple liquid-liquid extraction approach, researchers have also employed a dual-phase extraction approach. Briefly, this protocol entails the sequential addition of methanol, chloroform, and water (adding order varied) to a final ratio of 1:1:1 v/v/v, followed by sample mixing and centrifugation to separate the upper phase, which contains water-soluble polar metabolites, from the lower chloroform phase, which contains non-polar/lipid compounds. After separation, one or both phases are transferred into separate vials, evaporated, and reconstituted. The methanol:water phase can be further cleaned using divalent ions from Chelex-100 resin [40]. Another unique approach was developed by Izquierdo-Garcia et al. [33], wherein U87 and Normal Human Astrocytes (NHA) cells were incubated in a medium containing 1-13C-glucose or L 3-13C-glutamine (Gln) in order to allow these isotopes to be incorporated into low-molecular-mass compounds, which were further determined via 13C-MRS. In addition, Izquierdo-Garcia et al. [32] also used 2-13C-pyruvic acid for their hyperpolarized 13C-MRS experiments. They performed their MRS experiments using a perfusion system, which enabled the medium to circulate from the cells immobilized on the bead and into a 10-mm MR tube [33,41]. Summarizing, sample preparation among described articles is not sophisticated as the extraction is driven by the partitioning of compounds from sample into an organic solvent. Next, a clean-up is performed, in most cases by centrifugation, followed by manipulation needed for particular instrumental platform, e.g., evaporation and resuspension in deuterated water for NMR or derivatization for GC, etc. Despite the simplicity, a high number of compounds were found and described by authors. An updated list of the sample preparation methods for an in vitro extra- and intracellular metabolome are described in Table 1 and Table 2.

Table 1.
Metabolites detected in in vitro GBM by metabolomics.
Table 2.
Sample preparation techniques used for in vitro GBM cell lines.
3. Metabolomics of GBM In Vitro
Many recent studies on the development of tumor malignancy and resistance to treatment have focused on the metabolic reprogramming of cancer cells. Investigations into the metabolomic phenotype of various tumors, including brain tumors, have revealed interesting correlations between a tumor’s mutations, metabolic footprint, and microenvironment [60,61]. Given these correlations, metabolomics and lipidomics may be effective tools in drug development and brain tumor diagnostics, grading, and prognosis [61,62]. Prior studies have successfully detected numerous metabolic alterations, particularly in relation to the metabolism of fatty acids and amino acids, such as Gln, choline (Cho), and cysteine (Cys) [63,64,65,66]. However, these findings represent only a small fraction of the work that has been done in GBM metabolomics and lipidomics—a body of work that is constantly growing, as researchers continue to work to identify important metabolites in GBM development. Generally, studies examining the metabolic reprogramming of cancer have utilized matrices such as blood and serum, urine, tissue samples, and established cell lines and primary cells [60,61]. While all of these matrices have been successfully employed, in vitro studies using both established cell lines and primary cells ensure replicable and strictly controlled conditions between each replicate sample. Furthermore, the analysis of culture media and disintegrated cells, along with careful sample preparation, can provide useful information about both the endo- and exo-metabolome. However, cells growing in vitro as a monolayer do not adequately recreate the tumor microenvironment. As such, researchers have increasingly been exploring the use of three-dimensional (3D) in vitro culture models, as they reflect the actual tumor phenotype more adequately than standard 2D cell cultures [67]. For these reasons, in vitro cell cultures remain of great interest in explorations of metabolic reprogramming in GBM tumors. For the sake of clarity, from now on when discussing metabolic studies on in vitro cell cultures it will refer to the 2D culture model, as it is still considered the standard in in vitro studies, unless specified otherwise.
Metabolic alterations in cancer cells have long been explored for their usefulness in profiling of the phenotypes of many different types of tumors [68]. Prior to the development of the WHO glioma tumor classification method, researchers obtained information about different patterns in the metabolic pathways between normal and malignant cells through simple in vitro studies using established GBM cell lines (U87) and human mesenchymal stem cell lines (hMSC) [46]. In their work on intracellular metabolomes, Juerchott et al. observed alterations in the TCA cycle, with amplified concentrations of fumarate and succinate, and lower concentrations of citrate [46]. In addition, Juerchott et al. also observed that some glycolysis metabolites, such as glucose-6-phosphate (G6P), were upregulated. Many of the metabolites detected in their study would appear in later studies, not only for grading GBMs and determining prognosis, but also for determining drug treatment efficiency.
Findings have also revealed good correlation between mutations found in GBM, e.g., PDGFRA, IDH1, EGFR, and NF1—and the tumor’s metabolic fingerprint. Cuperlovic-Culf et al. conducted metabolic profiling on nine established GBM cell lines and categorized them into four subtypes based on the alterations to their metabolites [30]. Their findings proved that it is necessary to monitor alterations in metabolic pathways instead of focusing on DNA mutations alone. For instance, alterations to Cho—which is known to be present in cancer cells at different concentrations than in normal cells—and its derivatives (phosphocholine (PC) and glycerophosphocholine (GPC)) were only observed in the first group of cell lines [30]. The cells in this group had a genetic profile of PDGFRA+ and EGFR-, as well as significantly higher concentrations of Cho, PC, and GPC. Izquierdo-Garcia et al.’s examination of IDH1-mutated U87 GBM cells found decreased concentrations of PC and increased concentrations of GPC [33]. Since IDH1 mutations are generally more common in low-grade gliomas, the general ratio of PC to GPC could serve as a prediction factor, such that elevated levels of PC and decreased levels of GPC would indicate high-level gliomas, such as GBM [69,70]. Moreover, a low lipids-to-GPC ratio was found to connect patient-derived cell lines and neural progenitor cells; as such, this ratio can be used to characterize the neural phenotype of the tumor, and thus discern a better prognosis [37]. Another study revealed a correlation between the upregulation of GPCs and Cho and the differentiated state of the cells. This finding implies that impaired glycophospholipids metabolism is correlated with the tumor self-renewal and, thus, a worse prognosis [42]. Furthermore, a comparison of PC and GPC levels in pediatric GBM tumors and tumor-derived cells showed a decrease in the levels of both metabolites in both late passage cell lines and the tumor at relapse, indicating that both the tumor and derived cells had transitioned from stem-like cells into differentiated cells [52]. Nonetheless, it remains an open question whether a low PC-to-GPC ratio is a clear indicator of low malignancy grade in gliomas, with research still ongoing to determine the efficacy of these two metabolic markers. However, the ratio of total Cho to total creatine is indeed an indicator of the worse prognosis [38,71].
Inositol and myo-inositol are two additional metabolites that could potentially be useful in GBM diagnostics and prognostics, as they are known to play roles in osmoregulation and phosphatidylinositol lipids synthesis [72]. In a study conducted by Cuperlovic-Culf et al. a correlation was observed between the upregulation of myo-inositol and the PDGFRA+ and EGFR- genotypes in one of these subtypes [30]. Conversely, findings have shown that IDH mutant cells have decreased myo-inositol levels compared to an IDH wild-type cell line [33]. Kahlert et al. reported a high myo-inositol-to-glycine ratio for a U87 cell line grown in neutrospheres, which could be a marker for GBM [38]. Moreover, since myo-inositol plays a role in the metabolism of glycerophospholipids, its high concentration could be explained by the self-renewing properties of GBM tumors [42,73]. On the basis of the research discussed, it can be concluded that elevated levels of myo-inositol could be markers indicating high grade glioma.
Gln, glutamate (Glu), and γ-amniobutyric acid (GABA) each play an extremely important role in brain development. Changes in the metabolism of Gln can cause disturbances in Glu, GABA, and aspartate (Asp), as it is the precursor of these neurotransmitters [74]. Furthermore, Gln can be converted into α-ketoglutarate (α-KG), which subsequently takes part in the TCA cycle [75]. Tardito et al. highlighted GBM’s dependency on Gln. Their findings indicated that synthesized Gln can be used to synthesize AMP [26]. In their study, Cuperlovic-Culf et al. determined that differences in the upregulation of Gln, Glu, Asp, and citrate were dependent on the subtype of the studied cell lines [30]. They found that the levels of these metabolites in each subtype correlated with the expression of genes for some transporters such as SLC38A1, SLC7A8, and SLC1A. Specifically, they found that the overexpression of certain cellular or mitochondrial transporters influenced the levels of these metabolites. In turn, decreases in Gln were associated with IDH1mut status [33], and enforced glutaminolysis was connected to the ASS negative cell lines [29] and the accelerated growth rate of Gln-dependent GBM cells [32]. Glutaminolysis tends to be also overexpressed in relapse tumors and cells grown in nerurospheres [52]. A study on IDH wild-type primary GBM cell cultures yielded similar results, with two clear subtypes emerging: one with increased Gln uptake, and another with low Gln uptake. The findings showed that this high Gln dependency was correlated with a mesenchymal-type tumor and the worst prognosis [32]. In another study, Guidoni et al. compared patient-derived cells to GBM cell line T98G and neural stem/progenitor cells. They observed that the levels of GABA in one of the patient-derived cell lines increased while Glu simultaneously decreased, which could be used to determine the neuronal phenotype, as GABA synthesis mainly takes place in the neurons [37,74]. Moreover, the presence of neuronal metabolic markers is correlated with better prognoses [37].
Glutathione (GSH) is a tripeptide that is composed of Glu, Cys, and glycine (Gly). GSH can take on two forms, namely reduced GSH and oxidized GSSG, which allows it to play an important role in redox regulation and protecting cells from ROS [76]. The up-regulation of GSH has been associated with groups of cell lines from WHO grade IV gliomas, which connects it to the malignant transformation of the tumor [34]. A comparison of stem-like U87MG cells to U87 malignant glioma cells and stem-like cells after induced differentiation revealed a drop in GSSG levels and a high GSH-to-GSSG ratio. Therefore, low levels of ROS metabolites could be associated with worse prognoses, while increased levels of these metabolites could induce the differentiation of stem-like cells in tumors [42]. Similarly, decrease in GSH has been associated with the IDH1mut genotype of the U87 cell line [33]. Low GSH levels have also been observed in cells grown in neurospheres, which show more astrocyte/glioma-like metabolism. This finding indicates that decreased GSH is connected to hypoxia, and thus a worse prognosis, as was confirmed by the study’s patient results [37]. However, one needs to remember that GSH easily undergoes auto-oxidation during the sample preparation step, what makes it easy to get false results [77]. To the best of our knowledge, there is no GBM study which highlights this problem, the solutions proposed based on other cell cultures, i.e., adding N-ethylmaleimid and acetonitrile directly after removing the culture medium form the culture flask, can be considered in the in vitro GBM studies [78].
Studies performed on glioma cell models have successfully connected the widely known glioma marker, 2-hydroxyglutarate (2-HG) with the IDH1 mutation, as IDH-mutated cells gained a new, unique ability to convert α-KG into 2-HG, that IDH-wildtype glioma cells do not possess [30]. Live cell monitoring with 13C-MRS revealed elevated concentrations of 2-HG in the IDH1mut cells, along with a simultaneous drop in Glu concentrations [33]. This correlation was further explored in another study, where it was confirmed that 2-HG requires glucose in addition to Glu [45]. 2-HG is a good oncotarget for use in differentiating low-grade gliomas from GBMs, with Gln and glucose deprivation serving as useful therapeutic targets for such analyses.
Finally, a few other metabolites and altered pathways, such as N-acetyl aspartate (NAA), have been suggested as important for GBM metabolomic diagnostics, prognosis, and drug testing [37,52]. The full scope of important in vitro GBM metabolites analysed is presented in Table 1. Moreover, key metabolites that have been discussed in this paragraph, i.e., α-KG, 2-HG, Gln, Glu, GABA, GSH, and Asp, were analysed with the MetaboAnalyst 5.0 online. The most prevalent metabolic pathways are shown in the Figure 1, where Glu and Gln appear most often, suggesting them as metabolites important for the disease in question, while arginine metabolism and biosynthesis, Asp, D-Gln, and D-Glu metabolism are the most dominant pathways. To summarize metabolites such as Co, PC, GPC, myo-inositol, Gln, Glu, GABA, Asp, α-KG, GSH and 2-HG could be all used for GBM grading. Elevated myo-inositol, high Gln and Glu dependency and decrease in GSH could all indicate high grade glioma, while high 2-HG concentration could be associated with IDH1 mutation and therefore better prognosis. However, the most optimal solution would be to create a panel of key metabolites and analyze not only changes in levels of those, but also ratios between them.
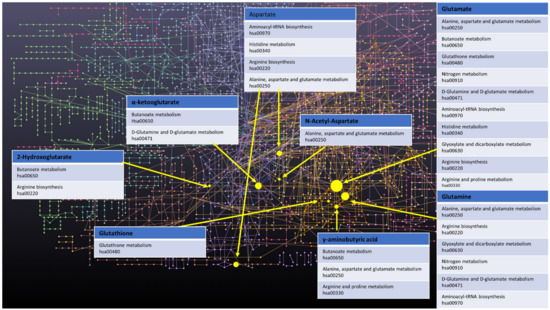
Figure 1.
Network of GBM related oncometabolites. Network generated with the MetaboAnalyst 5.0 online [79], pathways names and codes from Kyoto Encyclopedia of Genes and Genomes database [80].
4. Importance of GBM Microenvironment Reconstruction for In Vitro Metabolomics
GBM is a tumor that is known to have a highly complicated microenvironment, largely due to its heterogeneous nature, intratumor hypoxia, and angiogenesis [14,15]. Therefore, to carry out metabolomic in vitro studies that will translate to an in vivo environment, it is extremely important to consider culture conditions and cell source in metabolomic testing. For patient-derived GBM cells, special culture conditions, such as the use of an FBS-free culture medium supplemented with growth factors, as well as the use of 3D culturing in neurospheres, are recommended in order to acquire cells that actually feature all tumor characteristics [24,81,82]. 3D culture was more favorable for stem-like cells (CD133+). Furthermore, the cells in the 3D culture were also characterized by higher tCho-to-tCre, Gly-to-myo (myo-inositol), and Gly-to-tCho ratios, which are all indicators of high-grade gliomas [38]. In a similar, more recent study, Pexito et al. extended this investigation. They observed significant alterations in arginine metabolism in the cell lines that were cultured in the neurospheres [59]. Moreover, a comparison of patient-derived cells cultured in neutrospheres actually reflected the metabolic fingerprint of relapsed tumors [52]. Notably, neurospheres were used to culture glioma stem-like cells in many of the studies discussed in the current review (Table 1) [27,32,35,37,45,52,54].
Hypoxia is a common phenomenon in cancers, but it remains difficult to replicate hypoxic environments in vitro. Spheroid formation is one method that can be used to create low-oxygen conditions in cultures, as the core of the spheres is naturally hypoxic. However, this approach does not ensure the replicable conditions that are required in certain types of studies. These conditions can be achieved by lowering the O2 content in the culture environment using equipment such as a CO2 incubator. The profiling of U87MG cells grown in both hypoxic and normoxic environments revealed that hypoxia induces the non-glycolytic metabolism of glucose, which suggests that glycoproteins and glycolipids can be used as markers for hypoxia in GBM tumors. Moreover, the authors of the study further observed alterations to the TCA cycle, 2-HG accumulation, the altered metabolism of lipids, and increased catabolism of amino acids in hypoxic GBM cells [57]. A separate analysis of primary cell culture in hypoxic conditions revealed that oxygen deprivation induces changes in the α-KG-to-succinate ratio, as well as the Gly content [56]. Finally, Blandin et al. showed that cells cultured in hypoxic conditions more closely resembled the actual metabolomic profile of a tumor [52]. Therefore, in order to pursue a truly accurate metabolomic analysis of GBM in vitro, it should be taken into account that standard culture conditions established over the years, e.g., 2D cell culture, culture medium supplemented with FBS, and normoxic conditions, do not accurately reflect the complexity of the tumor. When planning the experiment, it is advisable to conduct simultaneous experiment with the use of 3D cell culture, FBS-free medium and under hypoxic conditions.
5. In Vitro-In Vivo Extrapolation of Oncometabolites
To date, several low-molecular-weight compounds have been identified as possible biomarkers of GBM. In particular, the dysregulation of the oncometabolites, 2-HG [83,84,85], NAA [86], Glu [64], and α-KG) [64] has been shown to be connected to the altered enzymatic pathways that occur within cancerous cells. Thus, these low-molecular-mass compounds are potential targets for in vitro-in vivo extrapolation. All of the above-mentioned compounds were identified through a literature search. As mentioned above, 2-HG and Glu were found via live cell monitoring using 13C-MRS, wherein cell culture medium was supplemented with 3-13C-glutamine. This enabled the determination of 13C-Glu and 13C-2-HG in U87IDHmut, and the determination of 13C-Glu only in U87IDHwt cells [45]. Consequently, in terms of IVIVE, Glu and 2-HG can serve not only as GBM biomarkers, but also as markers of IDH1 mutation, which plays key role in chemotherapy treatment optimization. In another study, researchers determined 2-HG through the extraction of intracellular components, followed by NMR analysis [33]. NAA and Glu were successfully found via NMR as the effect of intracellular metabolome investigation within cell cultures established from tissue of pediatric origin derived by NMR cell culture model [52], primary glioblastoma stem-like cells (GSC) [37] and GL261 cell line. Guidoni et al., observed that NAA was not present in the GBM T98G cell line, which suggests that primary GSC is closer to the in vivo state [37]. Glu was also identified in pediatric low-grade glioma using an LC-MS approach, wherein everolimus treatment resulted in glutaminase inhibition, which in turn led to reduced Glu levels [49], as well as result of extracellular metabolome study of U87-MG cell line [32]. Researchers have also utilized LC-MS/MS to analyse and compare Glu secretion and consumption in a medium-based extracellular metabolome and a cell-lysate-based intracellular metabolome [26]. The dual-phase extraction of intracellular components of U87 followed by GC-MS also revealed presence of Glu, which was observed at higher levels compared to normal hMSCs within the U87 cell line [46]. TMZ treatment caused difference in Glu levels between drug resistant and drug sensitive primary GBM cells with increased Glu levels in TMZ-sensitive cells [47]. Glu was also detected in both 2D and 3D cell cultures of established U87 and LN 229 cell lines [38], as well as various self-derived GBM models [35]. Furthermore, researchers have successfully identified Glu in GSC following treatment with a glutaminase inhibitor; as expected glutaminase levels were lower after the administration of the agent [54]. Moreover, an NMR approach has been successfully employed to detect Glu among the intrametabolome of U87 following treatment with TMZ or Cibotium barometz polysaccharides [36], and it has also been detected using astrocytoma cell lines derived from glioma tissue [34] and established cell lines [30,55]. The analysis of rat glioma BT4C cells revealed the presence of Glu and lactic acid within the intracellular metabolome, which suggests that these compounds can be used as a target for relatively easy (compared to human trials) investigations with in vivo rat models [44]. Except for α-KG, all of the well-established oncometabolites related with GBM were found within in vitro cell based studies (Table 3) proving the applicability of such approaches for diagnosis purposes, as well as a convenient and easy way for searching for further biomarkers.
Table 3.
In vivo-in vitro extrapolation of oncometabolites in the reviewed literature.
6. Pharmaco-Metabolomics as a Tool for Glioma Drug Testing In Vitro
Thanks to the extensive work that was conducted to identify potential metabolites for glioma diagnostics and prognostics, cell cultures have emerged as a truly promising model for drug testing and the exploration of tumor resistance to therapy. Knowledge regarding significant pathways and alterations to their metabolism could be used to predict the effectiveness of different therapeutics depending on the phenotype of the cells. For instance, St-Coeur et al. compared TMZ-sensitive and TMZ-resistant U373 cell lines after combined treatment with either TMZ and lomeguatrib (MGMT inhibitor) or TMZ alone and discovered a panel of distinct metabolites that differed among the cell lines. Specifically, they found increased levels of glucose, citrate, and isocitrate in the TMZ-resistant line, and overconcentrations of creatine, PC, Cho and alanine in the TMZ-sensitive GBM cells [47].
Since Gln and glutaminolysis targeting have been previously suggested, Koch et al. examined the influence of glutaminase (GLS) inhibitors on GSC [32,54]. Their pharmaco-metabolomic approach to in vitro studies of the aforementioned inhibitors—in this case, evaluating their effectiveness—allowed for exceptional target specificity. Interestingly, even though both tested inhibitors were found to have a toxic influence on cultured cells, only one of them resulted in actual glutaminolysis suppression [54]. The use of a GLS inhibitor, which can inhibit Glu synthesis in in vitro studies, has also been shown to sensitize gliomas with the IDH1 mutation to oxidative stress by McBrayer et al. [27]. Metabolomics analysis was also successfully used in the study conducted by Shi et al.to evaluate the ability of Cibotium barometz polysaccharides (CBPs) to resensitize TMZ-resistant cells. The findings showed changes in the metabolites involved in GSH metabolism (e.g., Glu, Gly, or taurine) and significant accumulation of ROS, thus proving the effectiveness of used compounds [36]. A similar pharmaco-metabolomic approach was used by D’Alessandro et al., to analyze how the Gli1 inhibitor affected murine glioma cells that overexpressed Gli1. This method was able to provide good target specify for the studied drug and its anti-tumor influence, both in vitro and in vivo [31]. This knowledge regarding alterations to the metabolism of Glu, Cho, and Gly in different types of GBM enabled further study of the Notch inhibitor mode of action and the determination of the Notch blockade as a promising target for GBM therapy [35]. In vitro metabolomics have also been successfully used to monitor the potential effect of various drugs on lipid synthesis for compounds such as FK866 inhibitor, phospholipase D (PLD) inhibitor, or gamma-linoleic acid [39,51,53]. It should be noted that some of the studies reviewed earlier also fit within the pharmacometabolomics approach. The full scope of analyzed literature is reported in Table 1. Moreover, metabolomics can also be used to assess cytotoxicity in in vitro applications, for example, particles for gene transfection [58]. The knowledge gained from the basic research discussed in metabolomic paragraph has been successfully used to select markers to determine the efficiency and target specificity of targeted drugs, making metabolomics in vitro an interesting tool for novel targeted therapies development. Gln, Glu, and GSH metabolism being especially useful in determining the effectiveness of analyzed drugs.
7. Conclusions
The studies reviewed in this paper highlight the importance of careful test planning for the accurate metabolomic profiling of GBM cells. Factors such as culture model, medium composition, established or patient-derived cell lines, and oxygen levels should all be chosen based on desired aspects of a tumor’s particular microenvironment. Moreover, sample preparation should use only the most effective metabolism quenching or extraction methods. In vitro studies face a problem at the level of in vitro-in vivo extrapolation, as metabolic reactions in a living organism are much more complex than in vitro environments are able to capture. However, with careful design, e.g., the use of 3D culture models, hypoxic conditions when conducting a study, or usage of more efficient sample preparation methods, in vitro studies on GBM metabolomics can be extremely useful for the diagnosis and prognosis of brain tumors, as well as for studying new drugs or mechanisms of drug resistance.
Author Contributions
Writing—original draft preparation, P.M. and K.J.; supervision, review, B.B. All authors have read and agreed to the published version of the manuscript.
Funding
The linguistic correction was financed by funds provided by the Doctoral School of Medical Sciences and Health Sciences.
Institutional Review Board Statement
Not applicable.
Informed Consent Statement
Not applicable.
Data Availability Statement
Not applicable.
Acknowledgments
The authors are members of the Toruń Center of Excellence named “Towards Personalized Medicine” operating under the Excellence Initiative—Research University.
Conflicts of Interest
The authors declare no conflict of interest.
References
- Louis, D.N.; Ohgaki, H.; Wiestler, O.D.; Cavenee, W.K.; Burger, P.C.; Jouvet, A.; Scheithauer, B.W.; Kleihues, P. The 2007 WHO classification of tumours of the central nervous system. Acta Neuropathol. 2007, 114, 547, Erratum in 2007, 114, 97–109. [Google Scholar] [CrossRef]
- Louis, D.N.; Perry, A.; Reifenberger, G.; von Deimling, A.; Figarella-Branger, D.; Cavenee, W.K.; Ohgaki, H.; Wiestler, O.D.; Kleihues, P.; Ellison, D.W. The 2016 World Health Organization Classification of Tumors of the Central Nervous System: A summary. Acta Neuropathol. 2016, 131, 803–820. [Google Scholar] [CrossRef] [PubMed]
- Ostrom, Q.T.; Patil, N.; Cioffi, G.; Waite, K.; Kruchko, C.; Barnholtz-Sloan, J.S. CBTRUS Statistical Report: Primary Brain and Other Central Nervous System Tumors Diagnosed in the United States in 2013–2017. Neuro-Oncology 2020, 22, iv1–iv96. [Google Scholar] [CrossRef] [PubMed]
- Cavazos, D.A.; Brenner, A.J. Hypoxia in astrocytic tumors and implications for therapy. Neurobiol. Dis. 2016, 85, 227–233. [Google Scholar] [CrossRef] [PubMed][Green Version]
- Papale, M.; Buccarelli, M.; Mollinari, C.; Russo, M.A.; Pallini, R.; Ricci-Vitiani, L.; Tafani, M. Hypoxia, Inflammation and Necrosis as Determinants of Glioblastoma Cancer Stem Cells Progression. Int. J. Mol. Sci. 2020, 21, 2660. [Google Scholar] [CrossRef] [PubMed]
- Fernandes, C.; Costa, A.; Osorio, L.; Lago, R.C.; Linhares, P.; Carvalho, B.; Caeiro, C. Current Standards of Care in Glioblastoma Therapy. Glioblastoma, Codon Publications, Brisbane, Australia 2017, chapter 11. 197–241. [Google Scholar] [CrossRef]
- Kaina, B. Temozolomide in Glioblastoma Therapy: Role of Apoptosis, Senescence and Autophagy. Comment on Strobel et al., Temozolomide and Other Alkylating Agents in Glioblastoma Therapy. Biomedicines 2019, 7, 69, Erratum in 2019, 7, 90. [Google Scholar] [CrossRef] [PubMed]
- Wick, W.; Platten, M.; Weller, M. New (alternative) temozolomide regimens for the treatment of glioma. Neuro-Oncology 2009, 11, 69–79. [Google Scholar] [CrossRef] [PubMed]
- Ge, X.; Pan, M.H.; Wang, L.; Li, W.; Jiang, C.F.; He, J.; Abouzid, K.; Liu, L.Z.; Shi, Z.M.; Jiang, B.H. Hypoxia-mediated mitochondria apoptosis inhibition induces temozolomide treatment resistance through miR-26a/Bad/Bax axis. Cell Death Dis. 2018, 9, 1128. [Google Scholar] [CrossRef] [PubMed]
- Yin, J.X.; Ge, X.; Shi, Z.M.; Yu, C.; Lu, C.F.; Wei, Y.T.; Zeng, A.L.; Wang, X.F.; Yan, W.; Zhang, J.X.; et al. Extracellular vesicles derived from hypoxic glioma stem-like cells confer temozolomide resistance on glioblastoma by delivering miR-30b-3p. Theranostics 2021, 11, 1763–1779. [Google Scholar] [CrossRef] [PubMed]
- Sun, S.; Lee, D.; Lee, N.P.; Pu, J.K.S.; Wong, S.T.S.; Lui, W.M.; Fung, C.F.; Leung, G.K.K. Hyperoxia resensitizes chemoresistant human glioblastoma cells to temozolomide. J. Neuro-Oncol. 2012, 109, 467–475. [Google Scholar] [CrossRef]
- Keunen, O.; Johansson, M.; Oudin, A.; Sanzey, M.; Rahim, S.A.A.; Fack, F.; Thorsen, F.; Taxt, T.; Bartos, M.; Jirik, R.; et al. Anti-VEGF treatment reduces blood supply and increases tumor cell invasion in glioblastoma. Proc. Natl. Acad. Sci. USA 2011, 108, 3749–3754. [Google Scholar] [CrossRef]
- Sathornsumetee, S.; Cao, Y.; Marcello, J.E.; Ii, J.E.H.; McLendon, R.E.; Desjardins, A.; Friedman, H.S.; Dewhirst, M.W.; Vredenburgh, J.J.; Rich, J.N. Tumor angiogenic and hypoxic profiles predict radiographic response and survival in malignant astrocytoma patients treated with bevacizumab and irinotecan. J. Clin. Oncol. 2008, 26, 271–278. [Google Scholar] [CrossRef]
- Liau, B.B.; Sievers, C.; Donohue, L.K.; Gillespie, S.M.; Flavahan, W.A.; Miller, T.E.; Venteicher, A.S.; Hebert, C.H.; Carey, C.D.; Rodig, S.J.; et al. Adaptive Chromatin Remodeling Drives Glioblastoma Stem Cell Plasticity and Drug Tolerance. Cell Stem Cell 2017, 20, 233–246. [Google Scholar] [CrossRef]
- Colwell, N.; Larion, M.; Giles, A.J.; Seldomridge, A.N.; Sizdahkhani, S.; Gilbert, M.R.; Park, D.M. Hypoxia in the glioblastoma microenvironment: Shaping the phenotype of cancer stem-like cells. Neuro-Oncology 2017, 19, 887–896. [Google Scholar] [CrossRef]
- Jing, X.; Yang, F.; Shao, C.; Wei, K.; Xie, M.; Shen, H.; Shu, Y. Role of hypoxia in cancer therapy by regulating the tumor microenvironment. Mol. Cancer 2019, 18, 157. [Google Scholar] [CrossRef]
- Ullmann, P.; Nurmik, M.; Begaj, R.; Haan, S.; Letellier, E. Hypoxia- and MicroRNA-Induced Metabolic Reprogramming of Tumor-Initiating Cells. Cells 2019, 8, 528. [Google Scholar] [CrossRef]
- Eales, K.L.; Hollinshead, K.E.R.; Tennant, D.A. Hypoxia and metabolic adaptation of cancer cells. Oncogenesis 2016, 5, e190. [Google Scholar] [CrossRef]
- Liberti, M.V.; Locasale, J.W. The Warburg Effect: How Does it Benefit Cancer Cells? Trends Biochem. Sci. 2016, 41, 211–218. [Google Scholar] [CrossRef]
- Wishart, D.S.; Tzur, D.; Knox, C.; Eisner, R.; Guo, A.C.; Young, N.; Cheng, D.; Jewell, K.; Arndt, D.; Sawhney, S.; et al. HMDB: The human metabolome database. Nucleic Acids Res. 2007, 35, D521–D526. [Google Scholar] [CrossRef]
- Johnson, C.H.; Ivanisevic, J.; Siuzdak, G. Metabolomics: Beyond biomarkers and towards mechanisms. Nat. Rev. Mol. Cell Biol. 2016, 17, 451–459. [Google Scholar] [CrossRef]
- Schmidt, C.W. Metabolomics: What’s happening downstream of DNA. Environ. Health Perspect. 2004, 112, A410–A415. [Google Scholar] [CrossRef]
- Hickman, J.A.; Graeser, R.; de Hoogt, R.; Vidic, S.; Brito, C.; Gutekunst, M.; van der Kuip, H.; Consortium, I.P. Three-dimensional models of cancer for pharmacology and cancer cell biology: Capturing tumor complexity in vitro/ex vivo. Biotechnol. J. 2014, 9, 1115–1128. [Google Scholar] [CrossRef]
- Musah-Eroje, A.; Watson, S. A novel 3D in vitro model of glioblastoma reveals resistance to temozolomide which was potentiated by hypoxia. J. Neuro-Oncol. 2019, 142, 231–240. [Google Scholar] [CrossRef]
- Cuperlovic-Culf, M.; Barnett, D.A.; Culf, A.S.; Chute, I. Cell culture metabolomics: Applications and future directions. Drug Discov. Today 2010, 15, 610–621. [Google Scholar] [CrossRef]
- Tardito, S.; Oudin, A.; Ahmed, S.U.; Fack, F.; Keunen, O.; Zhene, L.; Miletic, H.; Sakariassent, P.O.; Weinstock, A.; Wagner, A.; et al. Glutamine synthetase activity fuels nucleotide biosynthesis and supports growth of glutamine-restricted glioblastoma. Nat. Cell Biol. 2015, 17, 1556–1568. [Google Scholar] [CrossRef]
- McBrayer, S.K.; Mayers, J.R.; DiNatale, G.J.; Shi, D.D.; Khanal, J.; Chakraborty, A.A.; Sarosiek, K.A.; Briggs, K.J.; Robbins, A.K.; Sewastianik, T.; et al. Transaminase Inhibition by 2-Hydroxyglutarate Impairs Glutamate Biosynthesis and Redox Homeostasis in Glioma. Cell 2018, 175, 101–116. [Google Scholar] [CrossRef]
- Palanichamy, K.; Thirumoorthy, K.; Kanji, S.; Gordon, N.; Singh, R.; Jacob, J.R.; Sebastian, N.; Litzenberg, K.T.; Patel, D.; Bassett, E.; et al. Methionine and Kynurenine Activate Oncogenic Kinases in Glioblastoma, and Methionine Deprivation Compromises Proliferation. Clin. Cancer Res. 2016, 22, 3513–3523. [Google Scholar] [CrossRef] [PubMed]
- Moren, L.; Perryman, R.; Crook, T.; Langer, J.K.; Oneill, K.; Syed, N.; Antti, H. Metabolomic profiling identifies distinct phenotypes for ASS1 positive and negative GBM. BMC Cancer 2018, 18, 268, Erratum in 2018, 18, 167. [Google Scholar] [CrossRef]
- Cuperlovic-Culf, M.; Ferguson, D.; Culf, A.; Morin, P., Jr.; Touaibia, M. H-1 NMR Metabolomics Analysis of Glioblastoma Subtypes CORRELATION BETWEEN METABOLOMICS AND GENE EXPRESSION CHARACTERISTICS. J. Biol. Chem. 2012, 287, 20164–20175. [Google Scholar] [CrossRef] [PubMed]
- D’Alessandro, G.; Quaglio, D.; Monaco, L.; Lauro, C.; Ghirga, F.; Ingallina, C.; De Martino, M.; Fucile, S.; Porzia, A.; Di Castro, M.A.; et al. H-1-NMR metabolomics reveals the Glabrescione B exacerbation of glycolytic metabolism beside the cell growth inhibitory effect in glioma. Cell Commun. Signal. 2019, 17, 108. [Google Scholar] [CrossRef]
- Oizel, K.; Chauvin, C.; Oliver, L.; Gratas, C.; Geraldo, F.; Jarry, U.; Scotet, E.; Rabe, M.; Alves-Guerra, M.C.; Teusan, R.; et al. Efficient Mitochondrial Glutamine Targeting Prevails Over Glioblastoma Metabolic Plasticity. Clin. Cancer Res. 2017, 23, 6292–6304. [Google Scholar] [CrossRef]
- Izquierdo-Garcia, J.L.; Viswanath, P.; Eriksson, P.; Chaumeil, M.M.; Pieper, R.O.; Phillips, J.J.; Ronen, S.M. Metabolic Reprogramming in Mutant IDH1 Glioma Cells. PLoS ONE 2015, 10, e0118781. [Google Scholar] [CrossRef]
- Shao, W.; Gu, J.; Huang, C.; Liu, D.; Huang, H.; Huang, Z.; Lin, Z.; Yang, W.; Liu, K.; Lin, D.; et al. Malignancy-associated metabolic profiling of human glioma cell lines using H-1 NMR spectroscopy. Mol. Cancer 2014, 13, 197. [Google Scholar] [CrossRef]
- Kahlert, U.D.; Cheng, M.L.; Koch, K.; Marchionni, L.; Fan, X.; Raabe, E.H.; Maciaczyk, J.; Glunde, K.; Eberhart, C.G. Alterations in cellular metabolome after pharmacological inhibition of Notch in glioblastoma cells. Int. J. Cancer 2016, 138, 1246–1255. [Google Scholar] [CrossRef]
- Shi, Y.; Wang, X.; Wang, N.; Li, F.F.; You, Y.L.; Wang, S.Q. The effect of polysaccharides from Cibotium barometz on enhancing temozolomide-induced glutathione exhausted in human glioblastoma U87 cells, as revealed by H-1 NMR metabolomics analysis. Int. J. Biol. Macromol. 2020, 156, 471–484. [Google Scholar] [CrossRef]
- Guidoni, L.; Ricci-Vitiani, L.; Rosi, A.; Palma, A.; Grande, S.; Luciani, A.M.; Pelacchi, F.; di Martino, S.; Colosimo, C.; Biffoni, M.; et al. H-1 NMR detects different metabolic profiles in glioblastoma stem-like cells. NMR Biomed. 2014, 27, 129–145. [Google Scholar] [CrossRef]
- Kahlert, U.D.; Koch, K.; Suwala, A.K.; Hartmann, R.; Cheng, M.; Maciaczyk, D.; Willbold, D.; Eberhart, C.G.; Glunde, K.; Maciaczyk, J. The effect of neurosphere culture conditions on the cellular metabolism of glioma cells. Folia Neuropathol. 2015, 53, 219–225. [Google Scholar] [CrossRef]
- Larion, M.; Dowdy, T.; Ruiz-Rodado, V.; Meyer, M.W.; Song, H.; Zhang, W.; Davis, D.; Gilbert, M.R.; Lita, A. Detection of Metabolic Changes Induced via Drug Treatments in Live Cancer Cells and Tissue Using Raman Imaging Microscopy. Biosensors 2018, 9, 5. [Google Scholar] [CrossRef]
- Tyagi, R.K.; Azrad, A.; Degani, H.; Salomon, Y. Simultaneous extraction of cellular lipids and water-soluble metabolites: Evaluation by NMR spectroscopy. Magn. Reson. Med. 1996, 35, 194–200. [Google Scholar] [CrossRef]
- Ward, C.S.; Venkatesh, H.S.; Chaumeil, M.M.; Brandes, A.H.; VanCriekinge, M.; Dafni, H.; Sukumar, S.; Nelson, S.J.; Vigneron, D.B.; Kurhanewicz, J.; et al. Noninvasive Detection of Target Modulation following Phosphatidylinositol 3-Kinase Inhibition Using Hyperpolarized C-13 Magnetic Resonance Spectroscopy. Cancer Res. 2010, 70, 1296–1305. [Google Scholar] [CrossRef] [PubMed]
- Zhang, R.; Hu, P.; Zang, Q.; Yue, X.; Zhou, Z.; Xu, X.; Xu, J.; Li, S.; Chen, Y.; Qiang, B.; et al. LC-MS-based metabolomics reveals metabolic signatures related to glioma stem-like cell self-renewal and differentiation. RSC Adv. 2017, 7, 24221–24232. [Google Scholar] [CrossRef]
- Gao, W.Q.; Wu, Z.R.; Bohl, C.E.; Yang, J.; Miller, D.D.; Dalton, J.T. Characterization of the in vitro metabolism of selective androgen receptor modulator using human, rat, and dog liver enzyme preparations. Drug Metab. Dispos. 2006, 34, 243–253. [Google Scholar] [CrossRef] [PubMed]
- Mirbahai, L.; Wilson, M.; Shaw, C.S.; McConville, C.; Malcomson, R.D.G.; Griffin, J.L.; Kauppinen, R.A.; Peet, A.C. H-1 magnetic resonance spectroscopy metabolites as biomarkers for cell cycle arrest and cell death in rat glioma cells. Int. J. Biochem. Cell Biol. 2011, 43, 990–1001. [Google Scholar] [CrossRef]
- Izquierdo-Garcia, J.L.; Viswanath, P.; Eriksson, P.; Cai, L.; Radoul, M.; Chaumeil, M.M.; Blough, M.; Luchman, H.A.; Weiss, S.; Cairncross, J.G.; et al. IDH1 Mutation Induces Reprogramming of Pyruvate Metabolism. Cancer Res. 2015, 75, 2999–3009. [Google Scholar] [CrossRef]
- Juerchott, K.; Guo, K.-T.; Catchpole, G.; Feher, K.; Willmitzer, L.; Schichor, C.; Selbig, J. Comparison of metabolite profiles in U87 glioma cells and mesenchymal stem cells. Biosystems 2011, 105, 130–139. [Google Scholar] [CrossRef]
- St-Coeur, P.D.; Poitras, J.J.; Cuperlovic-Culf, M.; Touaibia, M.; Morin, P. Investigating a signature of temozolomide resistance in GBM cell lines using metabolomics. J. Neuro-Oncol. 2015, 125, 91–102. [Google Scholar] [CrossRef]
- Mesti, T.; Savarin, P.; Triba, M.N.; Le Moyec, L.; Ocvirk, J.; Banissi, C.; Carpentier, A.F. Metabolic Impact of Anti-Angiogenic Agents on U87 Glioma Cells. PLoS ONE 2014, 9, e0099198. [Google Scholar] [CrossRef]
- Poore, B.; Yuan, M.; Arnold, A.; Price, A.; Alt, J.; Rubens, J.A.; Slusher, B.S.; Eberhart, C.G.; Raabe, E.H. Inhibition of mTORC1 in pediatric low-grade glioma depletes glutathione and therapeutically synergizes with carboplatin. Neuro-Oncology 2019, 21, 252–263. [Google Scholar] [CrossRef]
- Sterin, M.; Ringel, I.; Lecht, S.; Lelkes, P.I.; Lazarovici, P. 31P Magnetic Resonance Spectroscopy of Endothelial Cells Grown in Three-Dimensional Matrigel Construct as an Enabling Platform Technology: I. The Effect of Glial Cells and Valproic Acid on Phosphometabolite Levels. Endothel. J. Endothel. Cell Res. 2008, 15, 288–298. [Google Scholar] [CrossRef]
- Antal, O.; Peter, M.; Hackler, L.; Man, I.; Szebeni, G.; Ayaydin, F.; Hideghety, K.; Vigh, L.; Kitajka, K.; Balogh, G.; et al. Lipidomic analysis reveals a radiosensitizing role of gamma-linolenic acid in glioma cells. Biochim. Biophys. Acta Mol. Cell Biol. Lipids 2015, 1851, 1271–1282. [Google Scholar] [CrossRef]
- Blandin, A.-F.; Durand, A.; Litzler, M.; Tripp, A.; Guerin, E.; Ruhland, E.; Obrecht, A.; Keime, C.; Fuchs, Q.; Reita, D.; et al. Hypoxic Environment and Paired Hierarchical 3D and 2D Models of Pediatric H3.3-Mutated Gliomas Recreate the Patient Tumor Complexity. Cancers 2019, 11, 1875. [Google Scholar] [CrossRef]
- Mathews, T.P.; Hill, S.; Rose, K.L.; Ivanova, P.T.; Lindsley, C.W.; Brown, H.A. Human Phospholipase D Activity Transiently Regulates Pyrimidine Biosynthesis in Malignant Gliomas. ACS Chem. Biol. 2015, 10, 1258–1268. [Google Scholar] [CrossRef]
- Koch, K.; Hartmann, R.; Tsiampali, J.; Uhlmann, C.; Nickel, A.C.; He, X.L.; Kamp, M.A.; Sabel, M.; Barker, R.A.; Steiger, H.J.; et al. A comparative pharmaco-metabolomic study of glutaminase inhibitors in glioma stem-like cells confirms biological effectiveness but reveals differences in target-specificity. Cell Death Discov. 2020, 6, 20. [Google Scholar] [CrossRef]
- Cuperlovic-Culf, M.; Khieu, N.H.; Surendra, A.; Hewitt, M.; Charlebois, C.; Sandhu, J.K. Analysis and Simulation of Glioblastoma Cell Lines-Derived Extracellular Vesicles Metabolome. Metabolites 2020, 10, 88. [Google Scholar] [CrossRef]
- Heiland, D.H.; Gaebelein, A.; Boerries, M.; Woerner, J.; Pompe, N.; Franco, P.; Heynckes, S.; Bartholomae, M.; Hailin, D.O.; Carro, M.S.; et al. Microenvironment-Derived Regulation of HIF Signaling Drives Transcriptional Heterogeneity in Glioblastoma Multiforme. Mol. Cancer Res. 2018, 16, 655–668. [Google Scholar] [CrossRef]
- Kucharzewska, P.; Christianson, H.C.; Belting, M. Global Profiling of Metabolic Adaptation to Hypoxic Stress in Human Glioblastoma Cells. PLoS ONE 2015, 10, e0116740. [Google Scholar] [CrossRef]
- Zanin, H.; Hollanda, L.M.; Ceragioli, H.J.; Ferreira, M.S.; Machado, D.; Lancellotti, M.; Catharino, R.R.; Baranauskas, V.; Lobo, A.O. Carbon nanoparticles for gene transfection in eukaryotic cell lines. Mater. Sci. Eng. C-Mater. Biol. Appl. 2014, 39, 359–370. [Google Scholar] [CrossRef]
- Peixoto, J.; Janaki-Raman, S.; Schlicker, L.; Schmitz, W.; Walz, S.; Herold-Mende, C.; Soares, P.; Schulze, A.; Lima, J. Integrated Metabolomics and Transcriptomics Analysis of Monolayer and Neurospheres from Glioblastoma Cells. Cancers 2021, 13, 1327. [Google Scholar] [CrossRef]
- Park, J.H.; Pyun, W.Y.; Park, H.W. Cancer Metabolism: Phenotype, Signaling and Therapeutic Targets. Cells 2020, 9, 2308. [Google Scholar] [CrossRef]
- Pandey, R.; Caflisch, L.; Lodi, A.; Brenner, A.J.; Tiziani, S. Metabolomic signature of brain cancer. Mol. Carcinog. 2017, 56, 2355–2371. [Google Scholar] [CrossRef]
- Yu, D.; Xuan, Q.H.; Zhang, C.Q.; Hu, C.X.; Li, Y.L.; Zhao, X.J.; Liu, S.S.; Ren, F.F.; Zhang, Y.; Zhou, L.N.; et al. Metabolic Alterations Related to Glioma Grading Based on Metabolomics and Lipidomics Analyses. Metabolites 2020, 10, 478. [Google Scholar] [CrossRef]
- Heiden, M.G.V.; Cantley, L.C.; Thompson, C.B. Understanding the Warburg Effect: The Metabolic Requirements of Cell Proliferation. Science 2009, 324, 1029–1033. [Google Scholar] [CrossRef]
- Maus, A.; Peters, G.J. Glutamate and alpha-ketoglutarate: Key players in glioma metabolism. Amino Acids 2017, 49, 1143, Erratum in 2017, 49, 21. [Google Scholar] [CrossRef]
- Chung, W.J.; Lyons, S.A.; Nelson, G.M.; Hamza, H.; Gladson, C.L.; Gillespie, G.Y.; Sontheimer, H. Inhibition of cystine uptake disrupts the growth of primary brain tumors. J. Neurosci. 2005, 25, 7101–7110. [Google Scholar] [CrossRef]
- Lee, J.E.; Jeun, S.S.; Kim, S.H.; Yoo, C.Y.; Baek, H.-M.; Yang, S.H. Metabolic profiling of human gliomas assessed with NMR. J. Clin. Neurosci. 2019, 68, 275–280. [Google Scholar] [CrossRef]
- Imamura, Y.; Mukohara, T.; Shimono, Y.; Funakoshi, Y.; Chayahara, N.; Toyoda, M.; Kiyota, N.; Takao, S.; Kono, S.; Nakatsura, T.; et al. Comparison of 2D-and 3D-culture models as drug-testing platforms in breast cancer. Oncol. Rep. 2015, 33, 1837–1843. [Google Scholar] [CrossRef]
- Denkert, C.; Budczies, J.; Kind, T.; Weichert, W.; Tablack, P.; Sehouli, J.; Niesporek, S.; Koensgen, D.; Dietel, M.; Fiehn, O. Mass spectrometry-based metabolic profiling reveals different metabolite patterns in invasive ovarian carcinomas and ovarian borderline tumors. Cancer Res. 2006, 66, 10795–10804. [Google Scholar] [CrossRef]
- Righi, V.; Roda, J.M.; Paz, J.; Mucci, A.; Tugnoli, V.; Rodriguez-Tarduchy, G.; Barrios, L.; Schenetti, L.; Cerdan, S.; Garcia-Martin, M.L. H-1 HR-MAS and genomic analysis of human tumor biopsies discriminate between high and low grade astrocytomas. NMR Biomed. 2009, 22, 629–637. [Google Scholar] [CrossRef]
- Qi, S.; Yu, L.; Gui, S.; Ding, Y.; Han, H.; Zhang, X.; Wu, L.; Yao, F. IDH mutations predict longer survival and response to temozolomide in secondary glioblastoma. Cancer Sci. 2012, 103, 269–273. [Google Scholar] [CrossRef]
- McKnight, T.R.; Smith, K.J.; Chu, P.W.; Chiu, K.S.; Cloyd, C.P.; Chang, S.M.; Phillips, J.J.; Berger, M.S. Choline Metabolism, Proliferation, and Angiogenesis in Nonenhancing Grades 2 and 3 Astrocytoma. J. Magn. Reson. Imaging 2011, 33, 808–816. [Google Scholar] [CrossRef] [PubMed]
- Kallenberg, K.; Bock, H.C.; Helms, G.; Jung, K.; Wrede, A.; Buhk, J.-H.; Giese, A.; Frahm, J.; Strik, H.; Dechent, P.; et al. Untreated Glioblastoma Multiforme: Increased Myo-inositol and Glutamine Levels in the Contralateral Cerebral Hemisphere at Proton MR Spectroscopy. Radiology 2009, 253, 805–812. [Google Scholar] [CrossRef] [PubMed]
- Benjamin, D.I.; Louie, S.M.; Mulvihill, M.M.; Kohnz, R.A.; Li, D.S.; Chan, L.G.; Sorrentino, A.; Bandyopadhyay, S.; Cozzo, A.; Ohiri, A.; et al. Inositol Phosphate Recycling Regulates Glycolytic and Lipid Metabolism That Drives Cancer Aggressiveness. ACS Chem. Biol. 2014, 9, 1340–1350. [Google Scholar] [CrossRef] [PubMed]
- Albrecht, J.; Sidoryk-Wegrzynowicz, M.; Zielinska, M.; Aschner, M. Roles of glutamine in neurotransmission. Neuron Glia Biol. 2010, 6, 263–276. [Google Scholar] [CrossRef]
- Seyfried, T.N.; Kiebish, M.A.; Marsh, J.; Shelton, L.M.; Huysentruyt, L.C.; Mukherjee, P. Metabolic management of brain cancer. Biochim. Biophys. Acta-Bioenerg. 2011, 1807, 577–594. [Google Scholar] [CrossRef]
- Aquilano, K.; Baldelli, S.; Ciriolo, M.R. Glutathione: New roles in redox signaling for an old antioxidant. Front. Pharmacol. 2014, 5. [Google Scholar] [CrossRef]
- Giustarini, D.; Galvagni, F.; Tesei, A.; Farolfi, A.; Zanoni, M.; Pignatta, S.; Milzani, A.; Marone, I.M.; Dalle-Donne, I.; Nassini, R.; et al. Glutathione, glutathione disulfide, and S-glutathionylated proteins in cell cultures. Free Radic. Biol. Med. 2015, 89, 972–981. [Google Scholar] [CrossRef]
- Herzog, K.; Ijlst, L.; van Cruchten, A.G.; van Roermund, C.W.T.; Kulik, W.; Wanders, R.J.A.; Waterham, H.R. An UPLC-MS/MS Assay to Measure Glutathione as Marker for Oxidative Stress in Cultured Cells. Metabolites 2019, 9, 45. [Google Scholar] [CrossRef]
- MetaboAnalyst 5.0. Available online: https://www.metaboanalyst.ca (accessed on 18 April 2021).
- Kanehisa, M.; Furumichi, M.; Sato, Y.; Ishiguro-Watanabe, M.; Tanabe, M. KEGG: Integrating viruses and cellular organisms. Nucleic Acids Res. 2021, 49, D545–D551. [Google Scholar] [CrossRef]
- Lee, J.; Kotliarova, S.; Kotliarov, Y.; Li, A.G.; Su, Q.; Donin, N.M.; Pastorino, S.; Purow, B.W.; Christopher, N.; Zhang, W.; et al. Tumor stem cells derived from glioblastomas cultured in bFGF and EGF more closely mirror the phenotype and genotype of primary tumors than do serum-cultured cell lines. Cancer Cell 2006, 9, 391–403. [Google Scholar] [CrossRef]
- Hasselbach, L.A.; Irtenkauf, S.M.; Lemke, N.W.; Nelson, K.K.; Berezovsky, A.D.; Carlton, E.T.; Transou, A.D.; Mikkelsen, T.; de Carvalho, A.C. Optimization of High Grade Glioma Cell Culture from Surgical Specimens for Use in Clinically Relevant Animal Models and 3D Immunochemistry. JoVE-J. Vis. Exp. 2014, 83, e51088. [Google Scholar] [CrossRef]
- An, Z.X.; Ganji, S.K.; Tiwari, V.; Pinho, M.C.; Patel, T.; Barnett, S.; Pan, E.; Mickey, B.E.; Maher, E.A.; Choi, C.H. Detection of 2-hydroxyglutarate in brain tumors by triple-refocusing MR spectroscopy at 3T in vivo. Magn. Reson. Med. 2017, 78, 40–48. [Google Scholar] [CrossRef]
- Sciacovelli, M.; Frezza, C. Oncometabolites: Unconventional triggers of oncogenic signalling cascades. Free Radic. Biol. Med. 2016, 100, 175–181. [Google Scholar] [CrossRef]
- Yang, M.; Soga, T.; Pollard, P.J. Oncometabolites: Linking altered metabolism with cancer. J. Clin. Investig. 2013, 123, 3652–3658. [Google Scholar] [CrossRef]
- Zand, B.; Previs, R.A.; Zacharias, N.M.; Rupaimoole, R.; Mitamura, T.; Nagaraja, A.S.; Guindani, M.; Dalton, H.J.; Yang, L.F.; Baddour, J.; et al. Role of Increased n-acetylaspartate Levels in Cancer. JNCI-J. Natl. Cancer Inst. 2016, 108, djv426. [Google Scholar] [CrossRef]
- Alfaro, C.M.; Pirro, V.; Keating, M.F.; Hattab, E.M.; Cooks, R.G.; Cohen-Gadol, A.A. Intraoperative assessment of isocitrate dehydrogenase mutation status in human gliomas using desorption electrospray ionization-mass spectrometry. J. Neurosurg. 2020, 132, 180–187. [Google Scholar] [CrossRef]
- Jarmusch, A.K.; Pirro, V.; Baird, Z.; Hattab, E.M.; Cohen-Gadol, A.A.; Cooks, R.G. Lipid and metabolite profiles of human brain tumors by desorption electrospray ionization-MS. Proc. Natl. Acad. Sci. USA 2016, 113, 1486–1491. [Google Scholar] [CrossRef]
- Brown, H.M.; Pu, F.; Dey, M.; Miller, J.; Shah, M.V.; Shapiro, S.A.; Ouyang, Z.; Cohen-Gadol, A.A.; Cooks, R.G. Intraoperative detection of isocitrate dehydrogenase mutations in human gliomas using a miniature mass spectrometer. Anal. Bioanal. Chem. 2019, 411, 7929–7933. [Google Scholar] [CrossRef]
- Pirro, V.; Llor, R.S.; Jarmusch, A.K.; Alfaro, C.M.; Cohen-Gadol, A.A.; Hattabd, E.M.; Cooks, R.G. Analysis of human gliomas by swab touch spray-mass spectrometry: Applications to intraoperative assessment of surgical margins and presence of oncometabolites. Analyst 2017, 142, 4058–4066. [Google Scholar] [CrossRef]
- Santagata, S.; Eberlin, L.S.; Norton, I.; Calligaris, D.; Feldman, D.R.; Ide, J.L.; Liu, X.H.; Wiley, J.S.; Vestal, M.L.; Ramkissoon, S.H.; et al. Intraoperative mass spectrometry mapping of an onco-metabolite to guide brain tumor surgery. Proc. Natl. Acad. Sci. USA 2014, 111, 11121–11126. [Google Scholar] [CrossRef]
- Pu, F.; Alfaro, C.M.; Pirro, V.; Xie, Z.E.; Ouyang, Z.; Cooks, R.G. Rapid determination of isocitrate dehydrogenase mutation status of human gliomas by extraction nanoelectrospray using a miniature mass spectrometer. Anal. Bioanal. Chem. 2019, 411, 1503–1508. [Google Scholar] [CrossRef]
- Navis, A.C.; Niclou, S.P.; Fack, F.; Stieber, D.; van Lith, S.; Verrijp, K.; Wright, A.; Stauber, J.; Tops, B.; Otte-Holler, I.; et al. Increased mitochondrial activity in a novel IDH1-R132H mutant human oligodendroglioma xenograft model: In situ detection of 2-HG and alpha-KG. Acta Neuropathol. Commun. 2013, 1, 18. [Google Scholar] [CrossRef]
- Yannell, K.E.; Smith, K.; Alfaro, C.M.; Jarmusch, A.K.; Pirro, V.; Cooks, R.G. N-Acetylaspartate and 2-Hydroxyglutarate Assessed in Human Brain Tissue by Mass Spectrometry as Neuronal Markers of Oncogenesis. Clin. Chem. 2017, 63, 1766–1767. [Google Scholar] [CrossRef]
- Kononikhin, A.; Zhvansky, E.; Shurkhay, V.; Popov, I.; Bormotov, D.; Kostyukevich, Y.; Karchugina, S.; Indeykina, M.; Bugrova, A.; Starodubtseva, N.; et al. A novel direct spray-from-tissue ionization method for mass spectrometric analysis of human brain tumors. Anal. Bioanal. Chem. 2015, 407, 7797–7805. [Google Scholar] [CrossRef]
- Jarmusch, A.K.; Alfaro, C.M.; Pirro, V.; Hattab, E.M.; Cohen-Gadol, A.A.; Cooks, R.G. Differential Lipid Profiles of Normal Human Brain Matter and Gliomas by Positive and Negative Mode Desorption Electrospray Ionization—Mass Spectrometry Imaging. PLoS ONE 2016, 11, e016318. [Google Scholar] [CrossRef]
- Ferey, J.; Marguet, F.; Laquerriere, A.; Marret, S.; Schmitz-Afonso, I.; Bekri, S.; Afonso, C.; Tebani, A. A new optimization strategy for MALDI FTICR MS tissue analysis for untargeted metabolomics using experimental design and data modeling. Anal. Bioanal. Chem. 2019, 411, 3891–3903. [Google Scholar] [CrossRef]
- Eberlin, L.S.; Dill, A.L.; Golby, A.J.; Ligon, K.L.; Wiseman, J.M.; Cooks, R.G.; Agar, N.Y.R. Discrimination of Human Astrocytoma Subtypes by Lipid Analysis Using Desorption Electrospray Ionization Imaging Mass Spectrometry. Angew. Chem. -Int. Ed. 2010, 49, 5953–5956. [Google Scholar] [CrossRef]
- Eberlin, L.S.; Norton, I.; Dill, A.L.; Golby, A.J.; Ligon, K.L.; Santagata, S.; Cooks, R.G.; Agar, N.Y.R. Classifying Human Brain Tumors by Lipid Imaging with Mass Spectrometry. Cancer Res. 2012, 72, 645–654. [Google Scholar] [CrossRef]
- Eberlin, L.S.; Norton, I.; Orringer, D.; Dunn, I.F.; Liu, X.H.; Ide, J.L.; Jarmusch, A.K.; Ligon, K.L.; Jolesz, F.A.; Golby, A.J.; et al. Ambient mass spectrometry for the intraoperative molecular diagnosis of human brain tumors. Proc. Natl. Acad. Sci. USA 2013, 110, 1611–1616. [Google Scholar] [CrossRef]
Publisher’s Note: MDPI stays neutral with regard to jurisdictional claims in published maps and institutional affiliations. |
© 2021 by the authors. Licensee MDPI, Basel, Switzerland. This article is an open access article distributed under the terms and conditions of the Creative Commons Attribution (CC BY) license (https://creativecommons.org/licenses/by/4.0/).