Article

13C Metabolic Flux Analysis Indicates Endothelial Cells Attenuate Metabolic Perturbations by Modulating TCA Activity

1
Fischell Department of Bioengineering, University of Maryland, College Park, MD 20742, USA
2
School of Bioengineering, Science, and Heath Systems, Drexel University, Philadelphia, PA 19104, USA
3
Department of Biological Chemistry, Chao Family Comprehensive Cancer Center, University of California Irvine, Irvine, CA 92697, USA
4
Department of Chemical and Biomolecular Engineering, University of Maryland, College Park, MD 20742, USA
*
Author to whom correspondence should be addressed.
Metabolites 2021, 11(4), 226; https://doi.org/10.3390/metabo11040226
Submission received: 13 January 2021 / Revised: 30 March 2021 / Accepted: 1 April 2021 / Published: 7 April 2021
(This article belongs to the Special Issue Metabolites and Signaling Pathways)

Abstract

:
Disrupted endothelial metabolism is linked to endothelial dysfunction and cardiovascular disease. Targeted metabolic inhibitors are potential therapeutics; however, their systemic impact on endothelial metabolism remains unknown. In this study, we combined stable isotope labeling with 13C metabolic flux analysis (13C MFA) to determine how targeted inhibition of the polyol (fidarestat), pentose phosphate (DHEA), and hexosamine biosynthetic (azaserine) pathways alters endothelial metabolism. Glucose, glutamine, and a four-carbon input to the malate shuttle were important carbon sources in the baseline human umbilical vein endothelial cell (HUVEC) 13C MFA model. We observed two to three times higher glutamine uptake in fidarestat and azaserine-treated cells. Fidarestat and DHEA-treated HUVEC showed decreased 13C enrichment of glycolytic and TCA metabolites and amino acids. Azaserine-treated HUVEC primarily showed 13C enrichment differences in UDP-GlcNAc. 13C MFA estimated decreased pentose phosphate pathway flux and increased TCA activity with reversed malate shuttle direction in fidarestat and DHEA-treated HUVEC. In contrast, 13C MFA estimated increases in both pentose phosphate pathway and TCA activity in azaserine-treated cells. These data show the potential importance of endothelial malate shuttle activity and suggest that inhibiting glycolytic side branch pathways can change the metabolic network, highlighting the need to study systemic metabolic therapeutic effects.

1. Introduction

Endothelial cells play an important role in pathologies ranging from atherosclerosis to cancer to Alzheimer’s disease. Endothelial glucose metabolism is disrupted in many of these diseases. Recent efforts demonstrate that manipulating endothelial metabolism can alter cell signaling pathways and thereby cell function [1,2,3]. Many of these studies increased or decreased the activity of a single metabolic enzyme, often focused on glycolysis [4,5,6]. However, glucose metabolism involves a complex metabolic network, and disturbing one enzyme can potentially have effects on seemingly unrelated metabolic pathways. Glycolytic side branch pathways, including polyol, pentose phosphate, and hexosamine biosynthetic pathways, have been implicated in endothelial dysfunction in hyperglycemia; however, manipulating one of these side branch pathways could have unexpected effects on glycolysis, the tricarboxylic acid (TCA) cycle, or other glycolytic side branch pathways [7,8,9].
Excess glucose enters the polyol pathway from glycolysis when hexokinase becomes saturated (Figure 1) [10]. Aldose reductase then catalyzes glucose reduction to sorbitol, oxidizing NADPH to NADP+ in the reaction. Sorbitol, a hydrophilic alcohol, cannot readily diffuse through the cell membrane, and its accumulation inside the cell potentially causes osmotic stress [11]. Sorbitol can also be oxidized to fructose, reducing NAD+ to NADH in this reaction. Fructose can then be converted to 3-deoxyglucosone (3-DG), which promotes formation of damaging advanced glycation end products (AGE) [12]. Increased polyol pathway activity can thereby alter the redox balance inside a cell by both decreasing the NAD+/NADH ratio and increasing the NADP+/NADPH ratio [13]. The polyol pathway has been implicated in diabetic retinopathy and neuropathy, endothelial cell dysfunction, and myocardial ischemia-reperfusion injury among others through activating proliferative signaling pathways and enhancing oxidative stress [7,14,15]. However, clinical trials of aldose reductase inhibitors showed modest effects on diabetic retinopathy and neuropathy [16,17].
Hyperglycemia can alter metabolic flux in the pentose phosphate pathway (PPP), which consists of oxidative and non-oxidative branches (Figure 1) [18]. The unidirectional oxidative branch consumes glucose 6-phosphate (G6P) following the first step of glycolysis. G6P is catalyzed to 6-phosphogluconolactone by G6P dehydrogenase (G6PD) and eventually to ribulose 5-phosphate, creating two NADPH from NADP+. Thus, the PPP oxidative branch produces NADPH, an essential reducing agent for fatty acid, sterol, nucleotide, and non-essential amino acid synthesis. The bidirectional non-oxidative branch converts ribulose 5-phosphate to ribose 5-phosphate, a nucleic acid building block, and xylulose 5-phosphate. These metabolites can then be converted into fructose 6-phosphate or glyceraldehyde 3-phosphate, re-entering glycolysis [19]. Oxidative PPP flux increases under oxidative stress, and overexpressing G6PD decreased reactive oxygen species and diabetic cardiomyopathy [20,21]. Non-oxidative PPP flux increases during cell proliferation. Both PPP branches are important in cancer and interact with oncogenic pathways (e.g., p53, HIF-1) [22].
Increased endothelial glucose flux also affects the hexosamine biosynthetic pathway (HBP), which is important in the post-translational protein modification O-GlcNAcylation (Figure 1) [23,24]. In the HBP, fructose-6-phosphate (F6P) is converted to glucosamine-6-phosphate (Glc6P) by the rate-limiting enzyme glutamine:fructose 6-phosphate amidotransferase (GFAT). Alternatively, exogenous glucosamine can enter the HBP at this step after conversion to Glc6P by hexokinase. Three subsequent reactions use acetyl-CoA and UTP to form UDP-N-acetylglucosamine (UDP-GlcNAc). UDP-GlcNAc then serves as a substrate for the O-linked β-N-acetylglucosamine (O-GlcNAc) modification of protein serine/threonine residues [25]. Protein O-GlcNAcylation is important in physiologic cell processes such as transcription, stress response, calcium cycling, and signaling, as well as in pathology [26,27]. Proteins are often O-GlcNAcylated at the same site where they are phosphorylated [28]. Thus, increased or decreased O-GlcNAcylation can impact intracellular signaling pathways.
The goal of this work was to study how inhibiting glycolytic side branch pathways using established chemical inhibitors would affect other parts of the metabolic network. Fidarestat, an aldose reductase inhibitor that has shown some promise in clinical trials of diabetic neuropathy, was used to inhibit the polyol pathway [29]. Dehydroepiandrosterone (DHEA), a sex hormone precursor that may also increase and activate endothelial nitric oxide synthase to regulate vascular function, was used to inhibit the PPP [30,31]. Azaserine, a structural glutamine analog that competitively inhibits reactions that involve glutamine, was used to inhibit the HBP (Figure 1) [32]. We analyzed the effects of these inhibitors on endothelial glucose metabolism via extracellular flux measurements and mass spectrometry. We then used metabolic flux analysis to estimate changes in metabolic fluxes with each inhibitor. We now show that these metabolic inhibitors can have systemic effects on endothelial cell metabolism, which we speculate may be due to either compensatory mechanisms or signaling pathway activation. This study thus suggests that the entire metabolic network should be analyzed when developing metabolic therapies.

2. Results

2.1. 13C Metabolic Flux Analysis of Baseline Endothelial Cell Metabolism

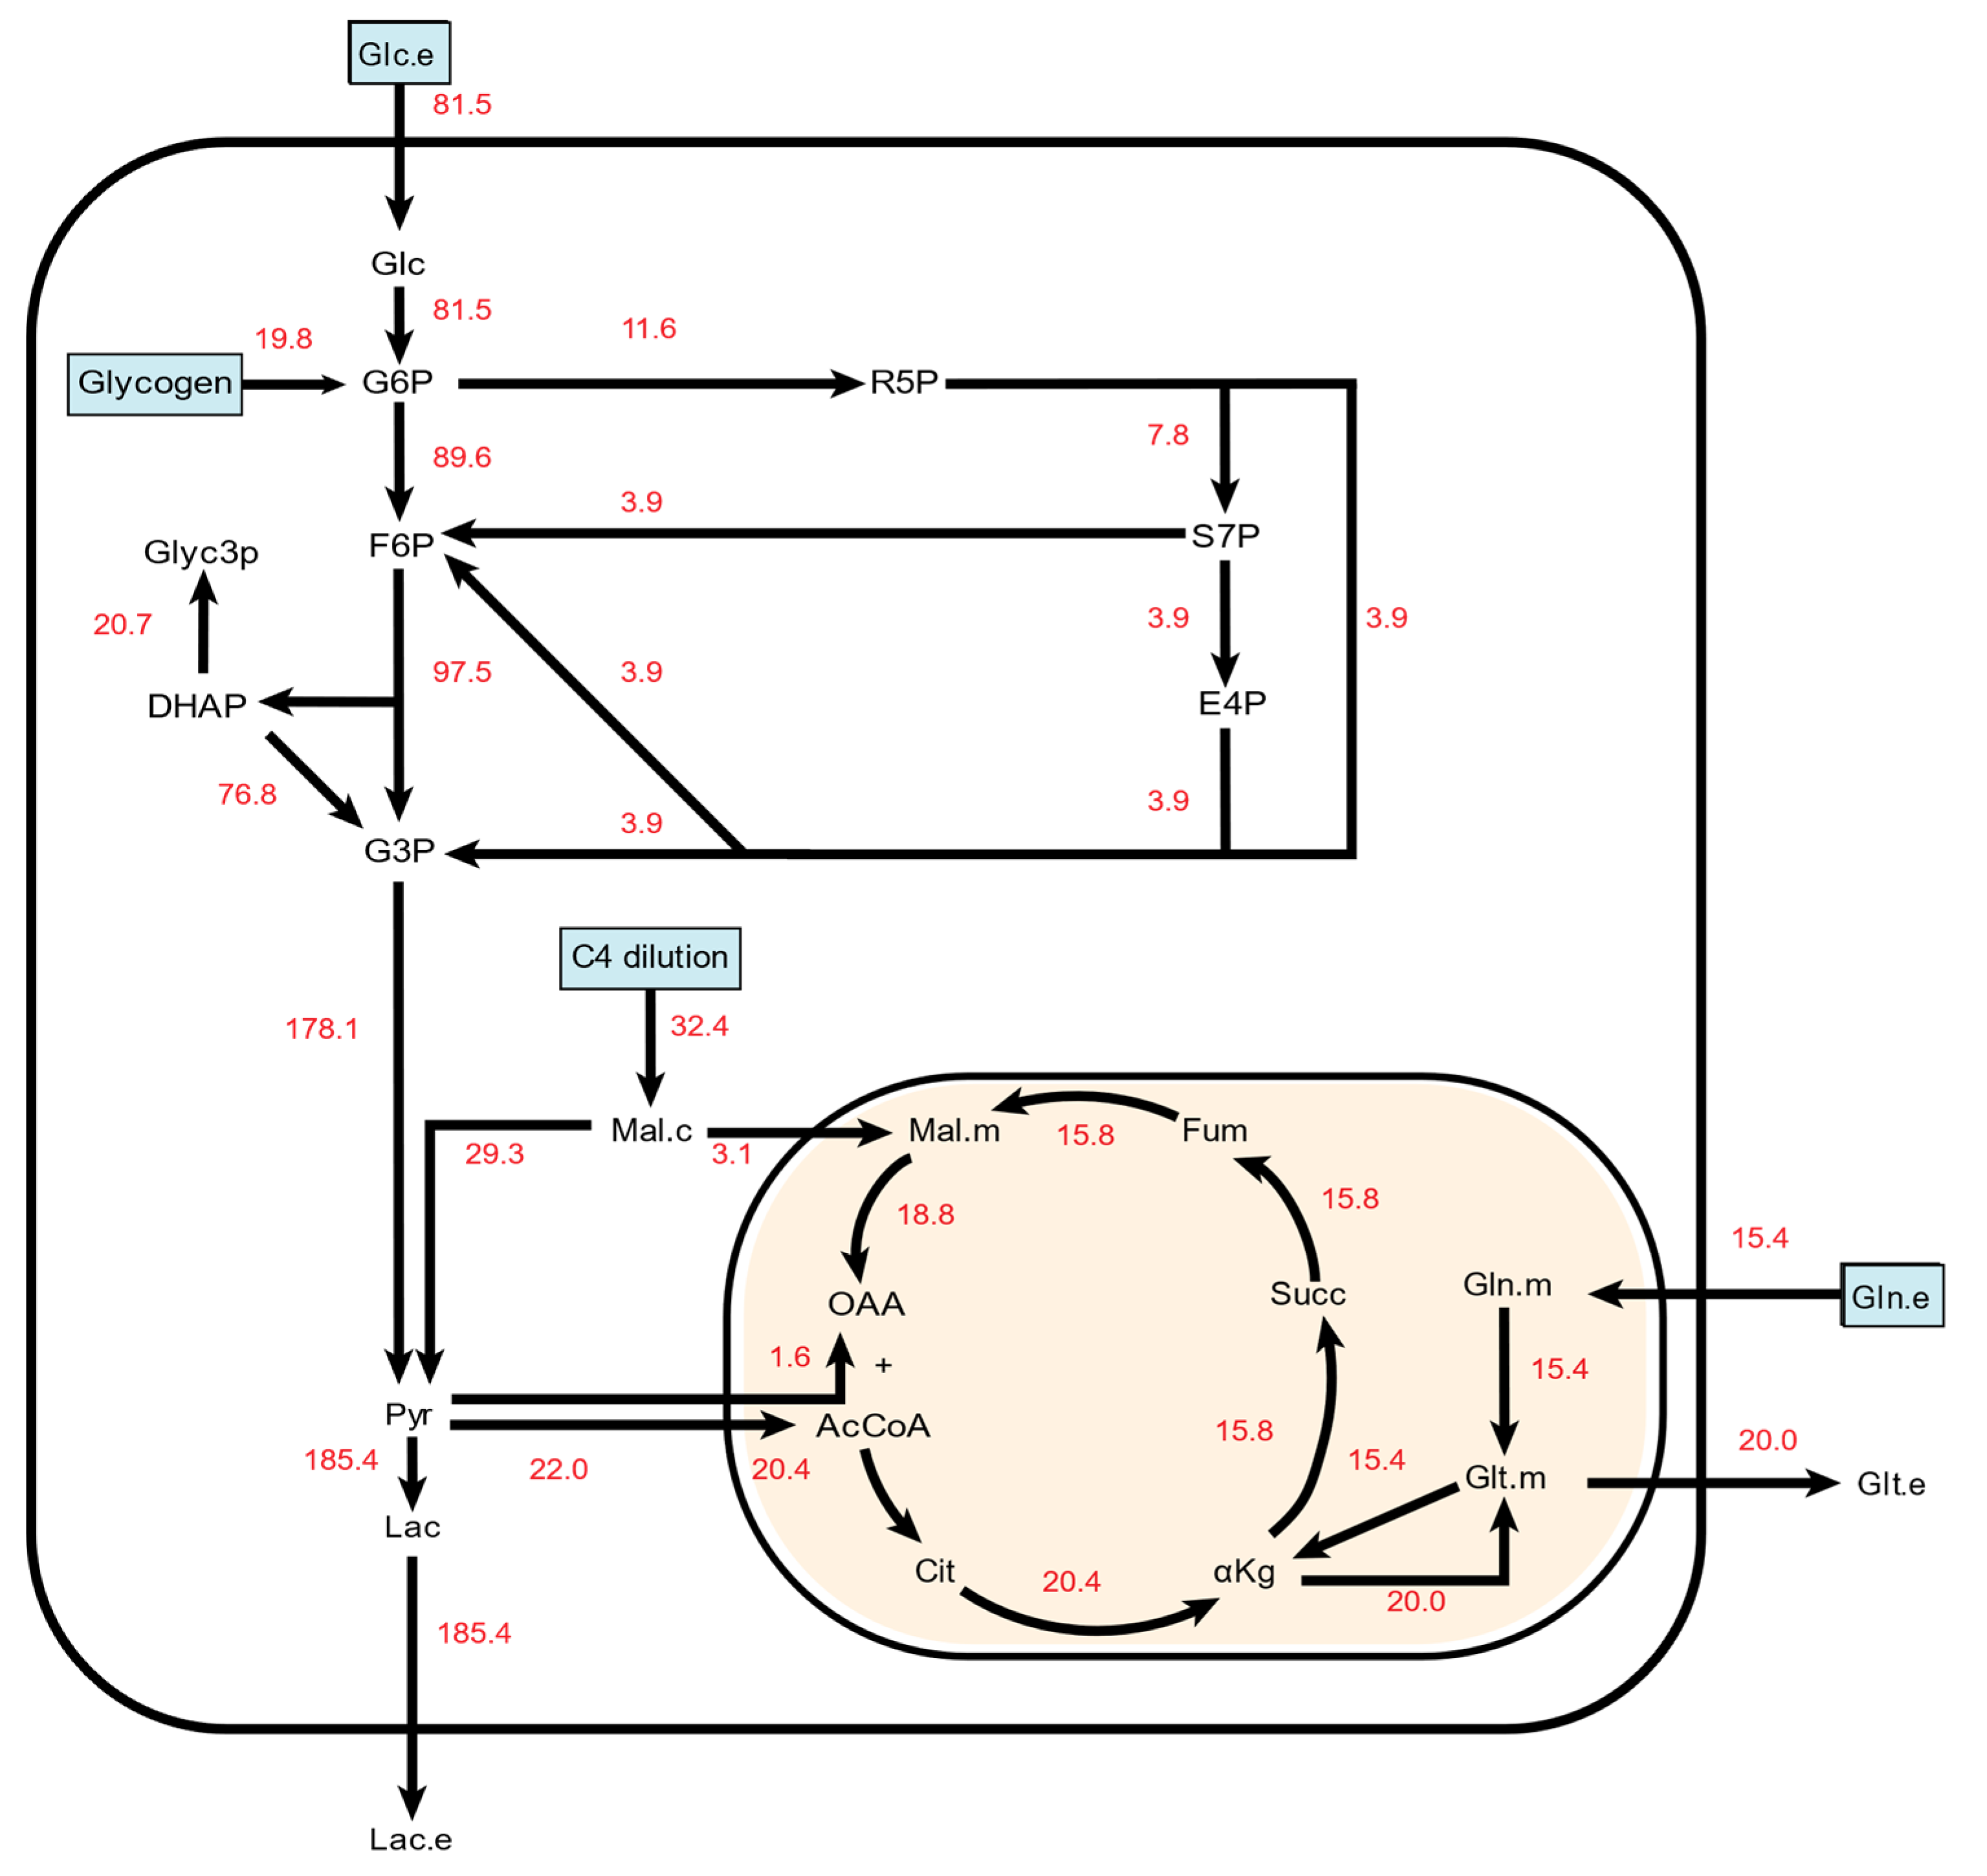
We started by creating a 13C metabolic flux analysis (13C MFA) model to enhance our analytic capabilities (Supplemental File S1). Through an iterative process, we modified model parameters until we achieved a satisfactory fit for the untreated endothelial cell mass spectrometry data. This allowed us to estimate metabolic flux values and gain unique insights into HUVEC metabolism that could not have been obtained from analyzing the input and output fluxes and metabolic isotopomer distributions alone. In the final baseline HUVEC 13C MFA model (Figure 2), TCA flux rates were estimated to be around 20% of the incoming glucose flux rate. The model also predicted influx of a four-carbon compound that fed into the malate shuttle and diluted cytosolic malate. The rate of this flux was approximately 40% of the glucose influx rate in the untreated cells. In comparison, the rate of glutamine intake was 19% of the glucose influx rate. Glutamate outflow from the TCA cycle was equivalent to pyruvate-derived acetyl-CoA influx into the mitochondria. The model also predicted net malate shuttle activity from the cytoplasm into the mitochondria. 86% of pyruvate was derived from G3P, which is sourced by glucose influx, glycogen breakdown, and the PPP. The remaining 14% was derived from malate. Approximately 11% of pyruvate entered the mitochondria, while the remainder was secreted as lactate. Roughly 11% of G6P was estimated to enter the PPP.

2.2. Inhibitor Effects on Endothelial Cell Glucose Metabolism

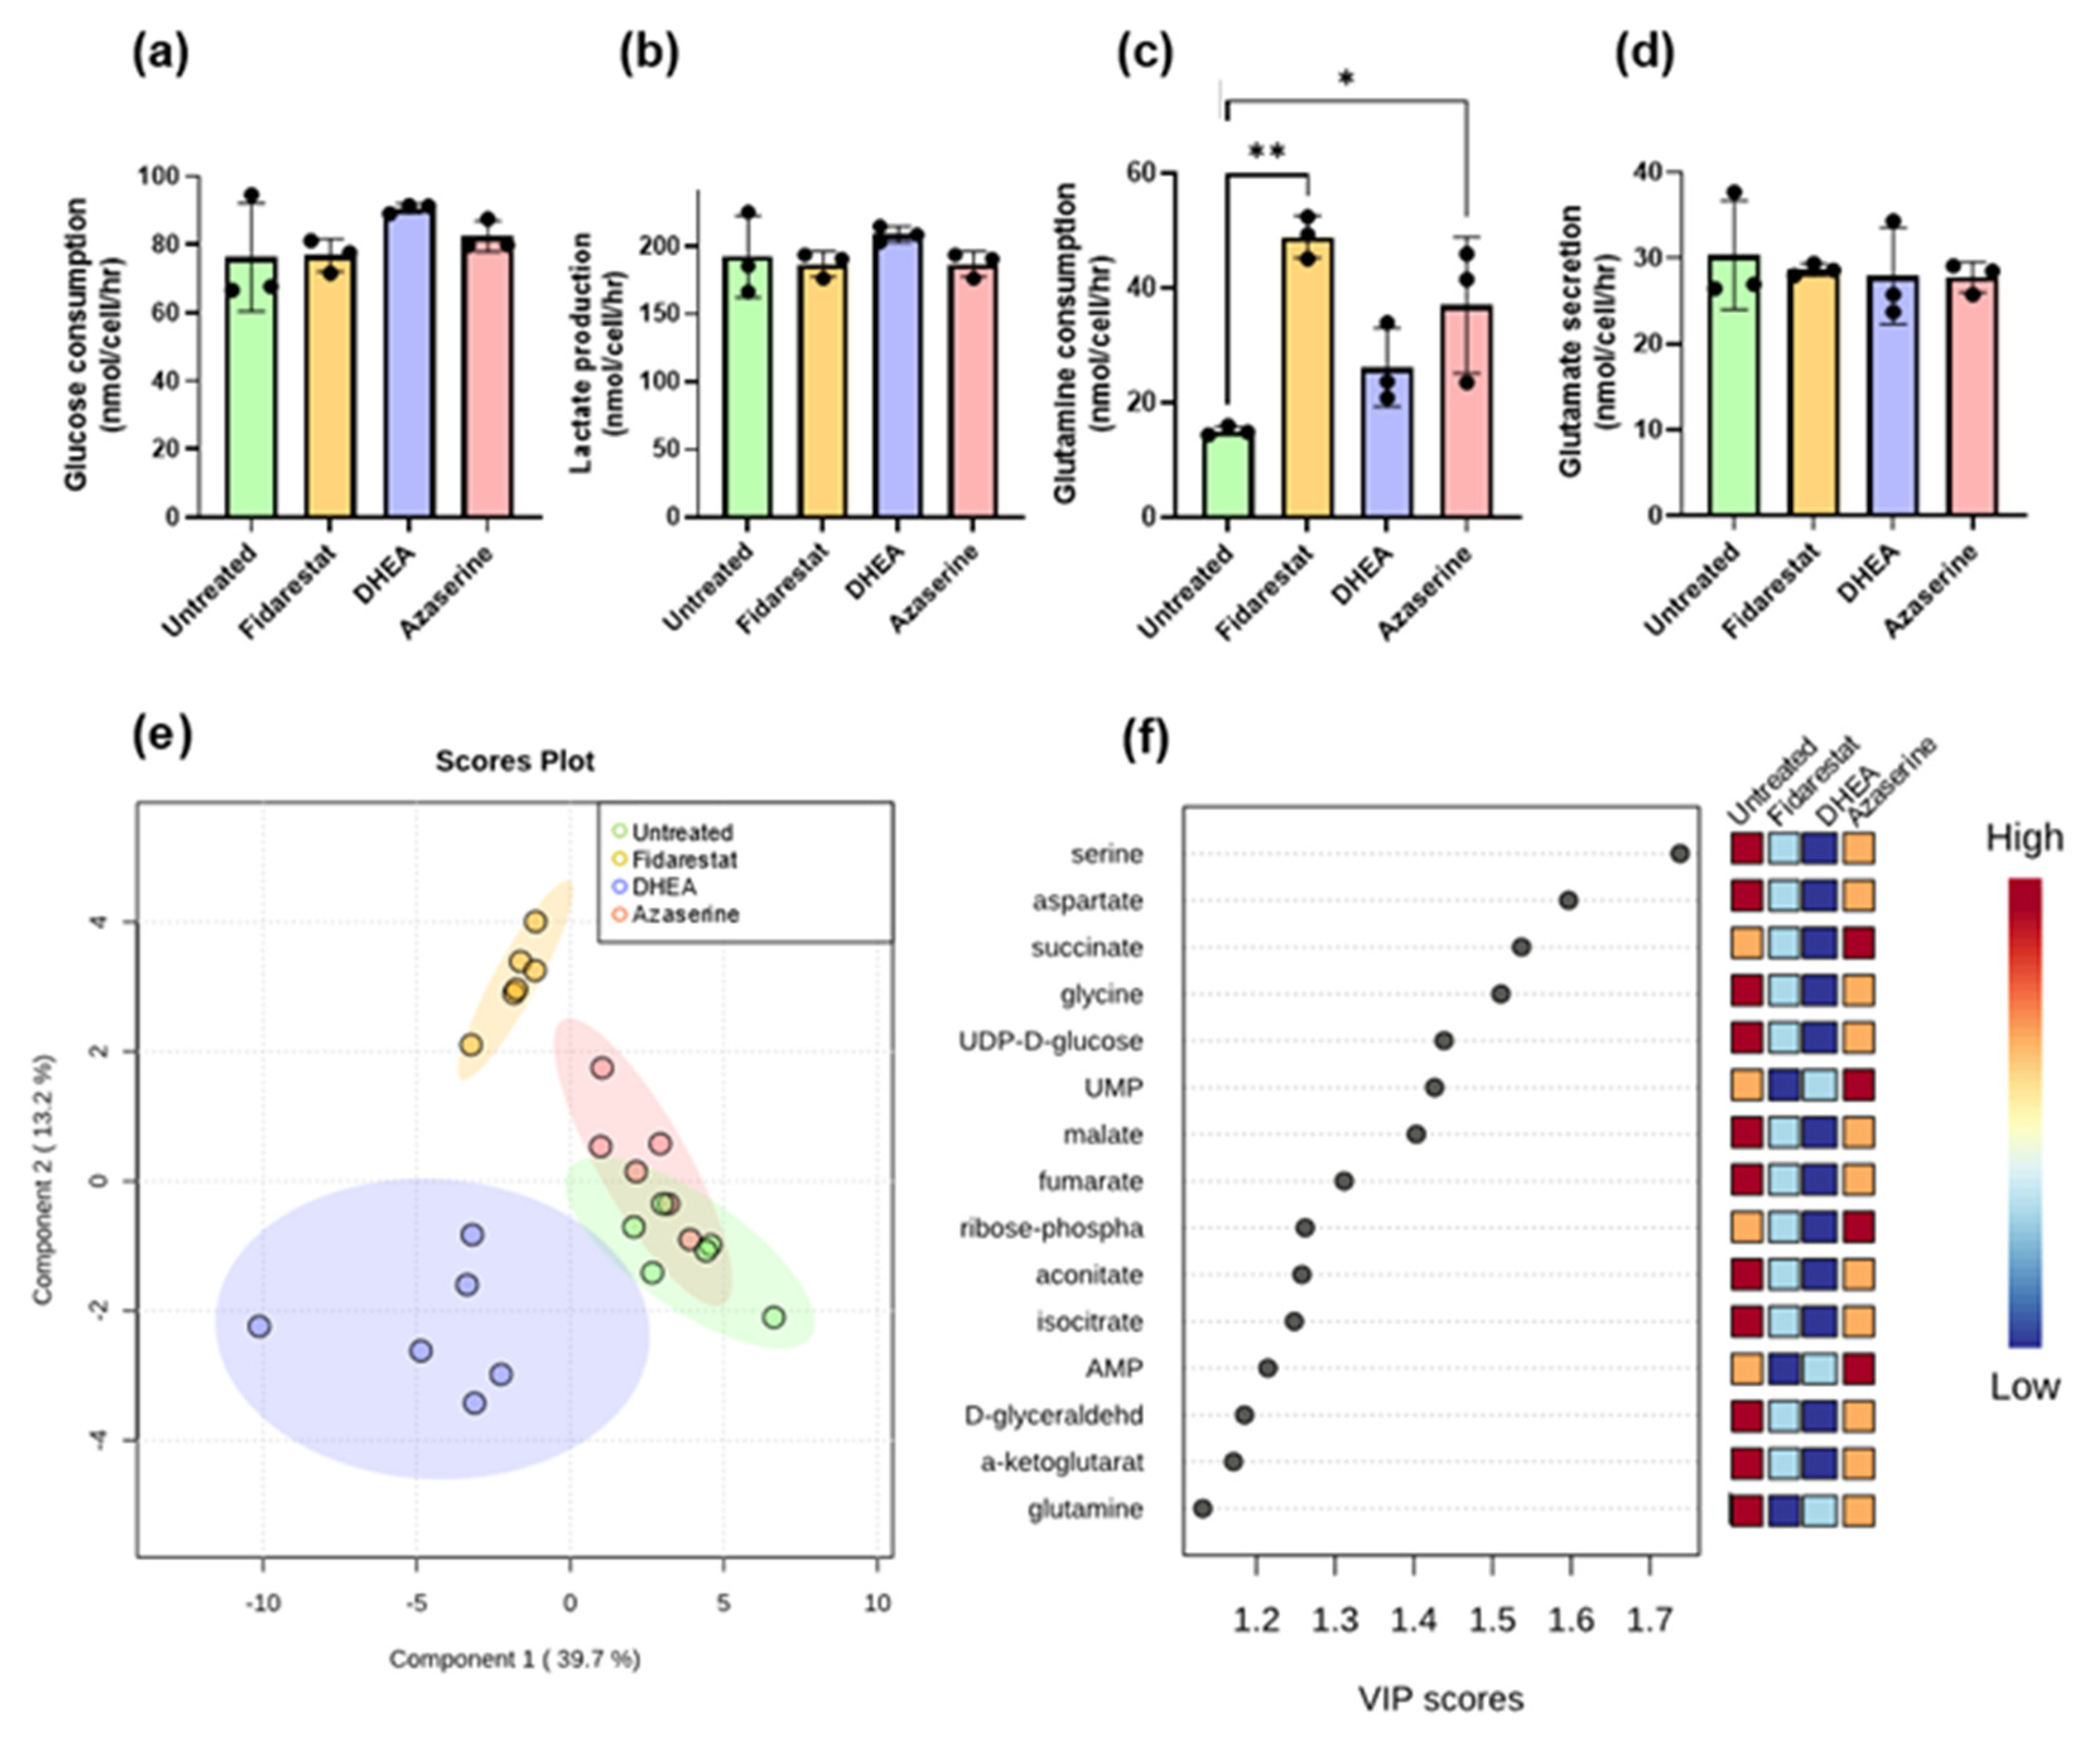
We then examined the metabolite inputs (glucose, glutamine) and outputs (lactate, glutamine) for endothelial cells that were either untreated (vehicle control) or treated with each glycolytic side branch pathway inhibitor (Figure 3a–d, Supplemental File S2). Glucose consumption and lactate production both increased by 18% in endothelial cells treated with DHEA, and while this change was consistent across repeated experiments, high variability in untreated endothelial cell measurements prevented these differences from being statistically significant. The lactate/glucose ratio also decreased by 6–11% with all of the inhibitors, which again was consistent but not statistically significant (Supplemental Figure S2). Glutamine uptake more than tripled in endothelial cells treated with fidarestat and more than doubled in endothelial cells treated with azaserine. Glutamate secretion did not change, which meant that the glutamate/glutamine ratio decreased while the glutamine/glucose ratio increased (Supplemental Figure S2) in endothelial cells treated with azaserine and fidarestat.
We next used partial least squares discriminant analysis (PLS-DA) to reduce the dimensionality of the mass spectrometry dataset (Supplemental File S2) and select for metabolites and isotopomers that maximized differences among the treatment groups. Fidarestat- and DHEA-treated endothelial cells formed distinct clusters from untreated cells, whereas azaserine-treated endothelial cells overlapped with untreated cells (Figure 3e). The VIP scores showed that non-essential amino acids (serine, aspartate, glycine, glutamine) and TCA metabolites (succinate, malate, fumarate, aconitate, isocitrate, α-ketoglutarate) explained most of the variation among the samples (Figure 3f). PLS-DA analysis of individual isotopomers and subsequent VIP scores highlighted differential labeling among serine, glycine, succinate, and aspartate isotopomers (Supplemental Figure S3). UDP/UMP were also frequently represented among the top 50 scoring isotopomers (Supplemental File S3). On examining the total pools, the sizes of the HBP and PPP metabolite total pools were consistently lower in all treated samples, whereas TCA metabolite total pools were largely similar among untreated and treated samples (Supplemental Figure S8).

2.3. Fidarestat: Polyol Pathway Inhibition

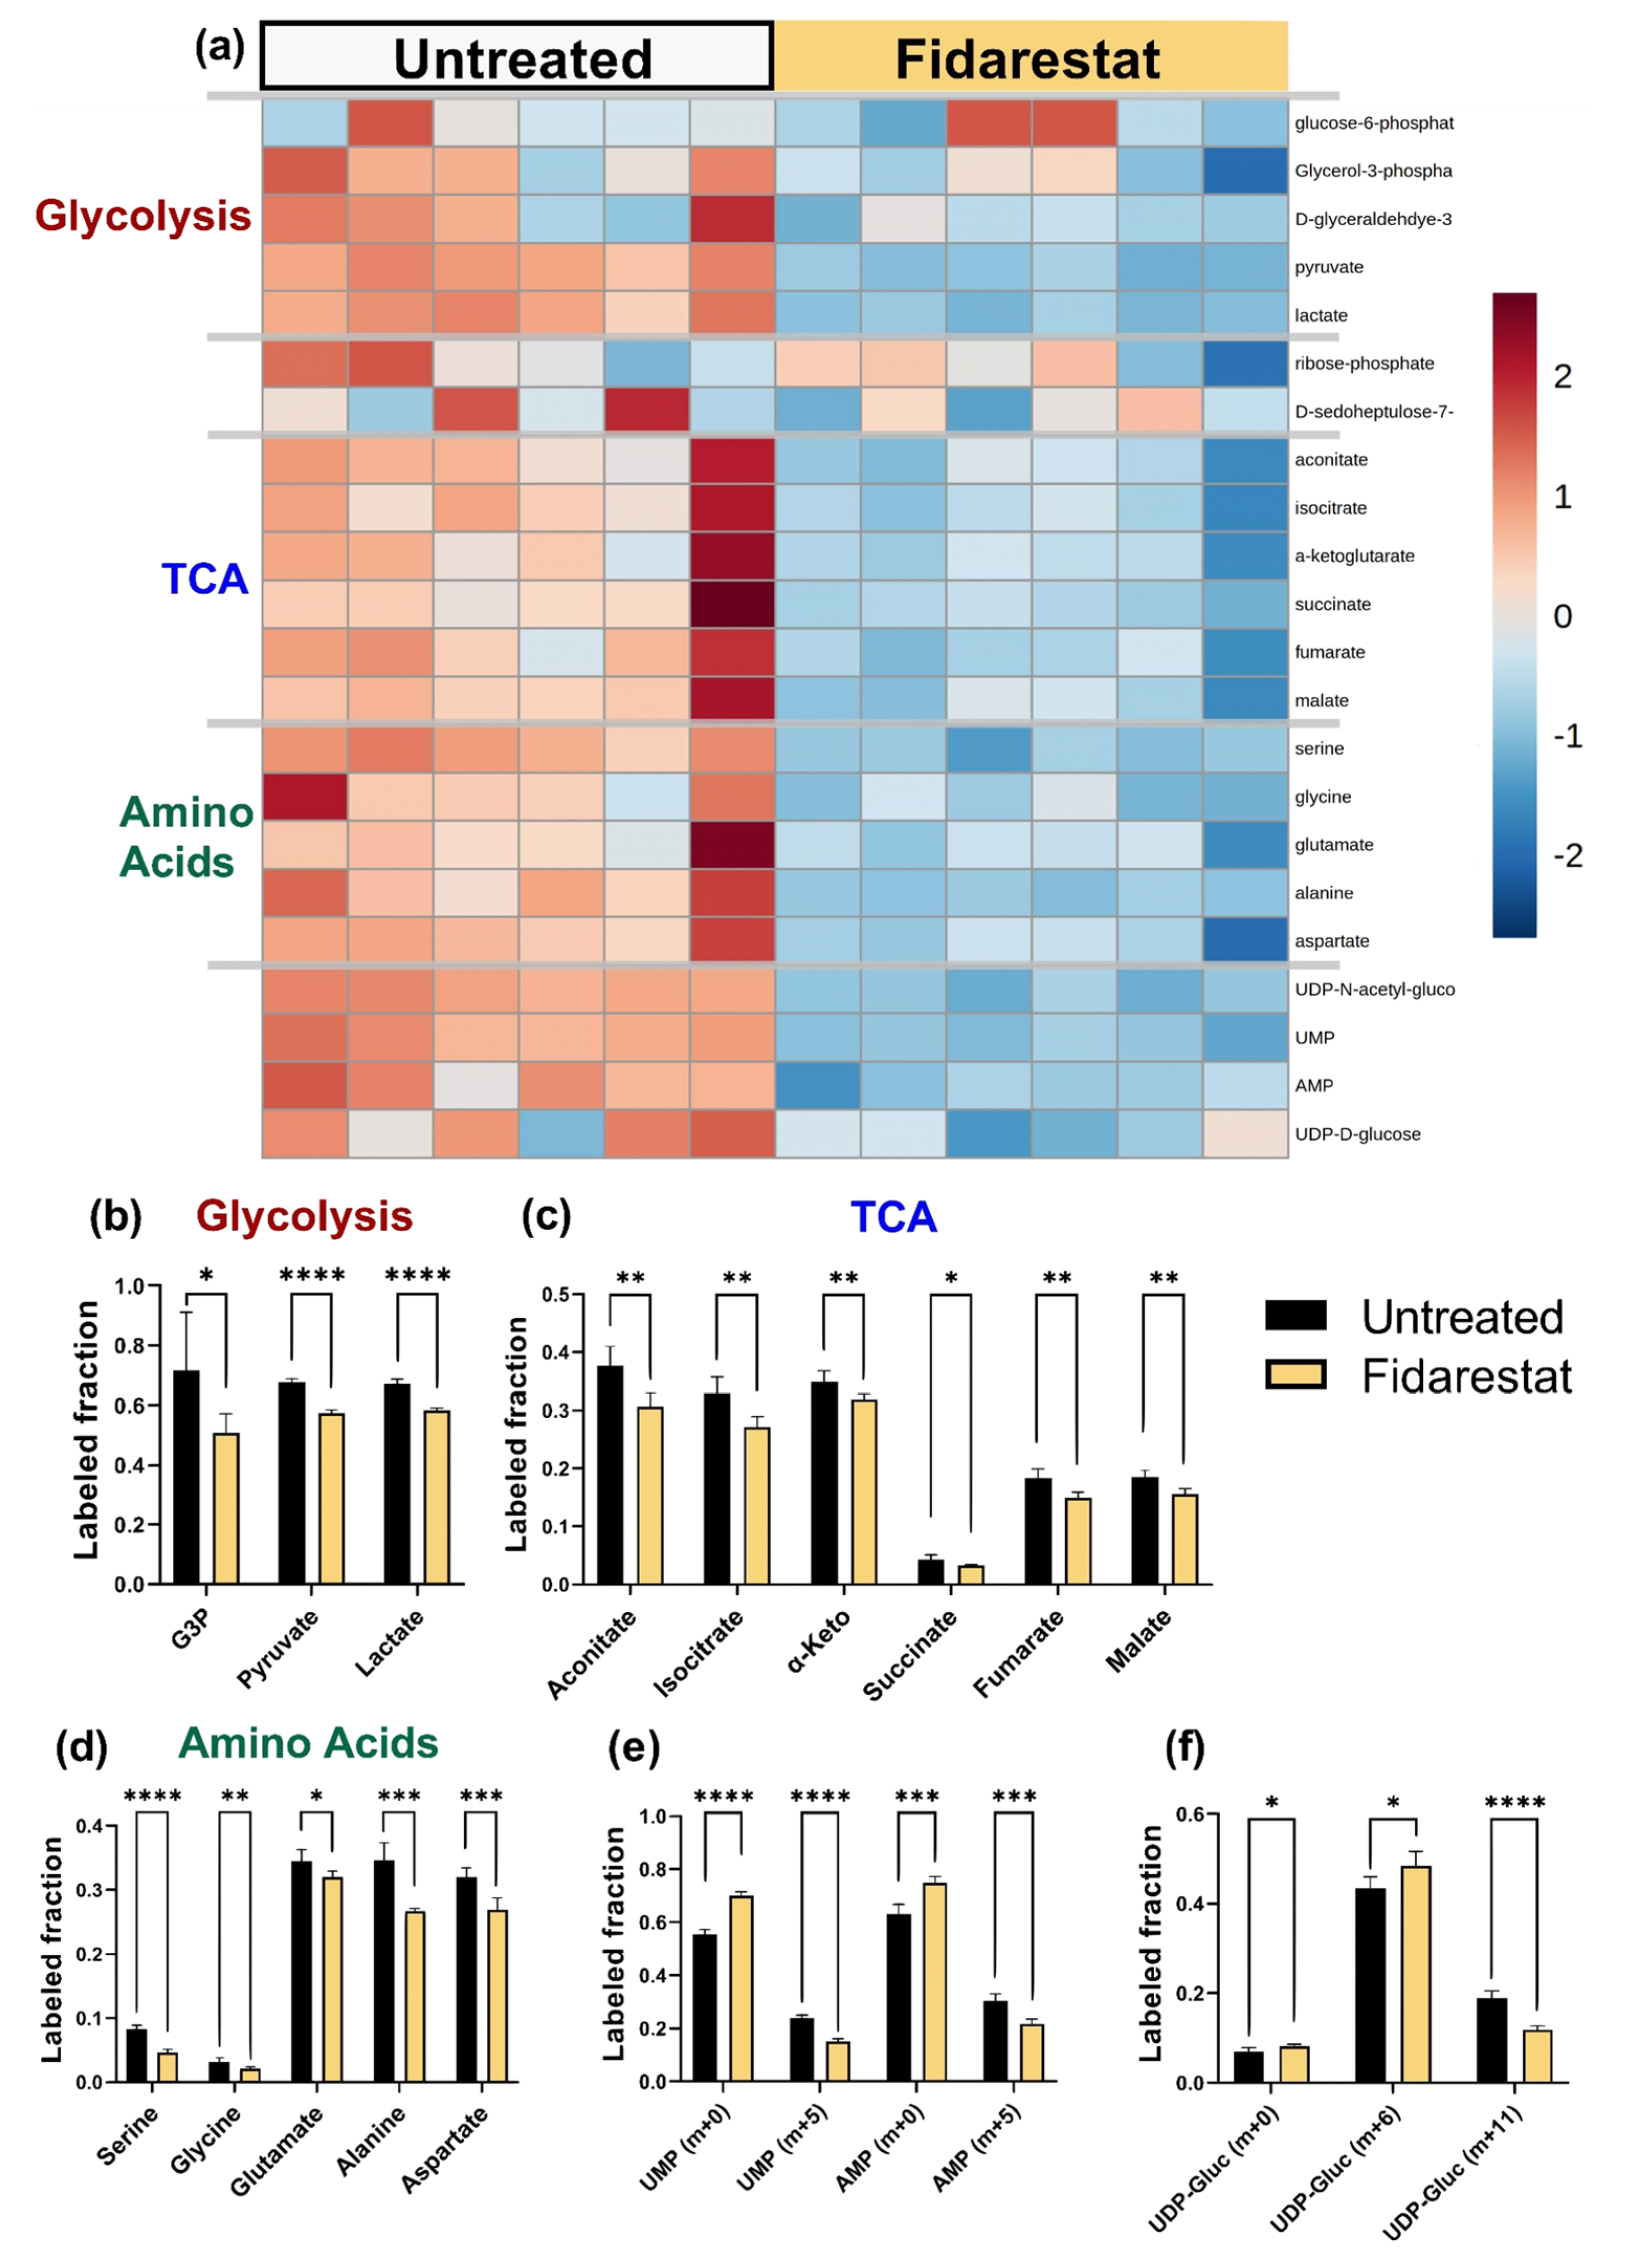
We then analyzed each inhibitor individually by examining labeled metabolite distributions followed by 13C MFA. While fidarestat has been widely shown to inhibit the polyol pathway, we could not detect polyol pathway inhibition directly since our mass spectrometry data did not include sorbitol and we were unable to detect sorbitol using a colorimetric assay. Fidarestat treatment decreased the total 13C enrichment of glycolytic and TCA metabolites, the amino acids serine, glycine, aspartate, and alanine, as well as UDP-D-glucose and UDP-GlcNAc (Figure 4a; full heatmap in Supplemental Figure S4a). Upon closer examination of glycolytic metabolites, we observed that 13C enrichment of pyruvate decreased by about 10% with fidarestat treatment (p < 0.001) while 13C enrichment of lactate decreased by about 8% (p < 0.001; Figure 4b). The 13C enrichment of all measured TCA metabolites decreased by 3–7% (p < 0.01 for all but succinate for which p < 0.05) with fidarestat treatment. The 13C enrichment of fumarate and malate was around half that of the other TCA metabolites (Figure 4c), and succinate was more than 90% unlabeled. While amino acid 13C enrichment was low, the 13C enrichment of serine decreased by 43% (p < 0.001) and glycine by 34% (p < 0.01). Glutamate enrichment decreased by 7%, alanine by 22%, and aspartate by 16% (Figure 4d).
Overall 13C enrichment of nucleotides UMP and AMP decreased in fidarestat-treated cells (Figure 4e), with most of this accounted for by a 9% reduction in UMP [m + 5] and AMP [m + 5]. Fidarestat further altered the isotopomer distribution of UDP-glucose, a nucleotide sugar that is a precursor to glycogen, sucrose, lipopolysaccharides, and glycosphingolipids. The overall 13C enrichment of UDP-glucose did not change significantly; however, UDP-glucose [m + 6] increased while UDP-glucose [m + 11] decreased with fidarestat treatment (Figure 4f).
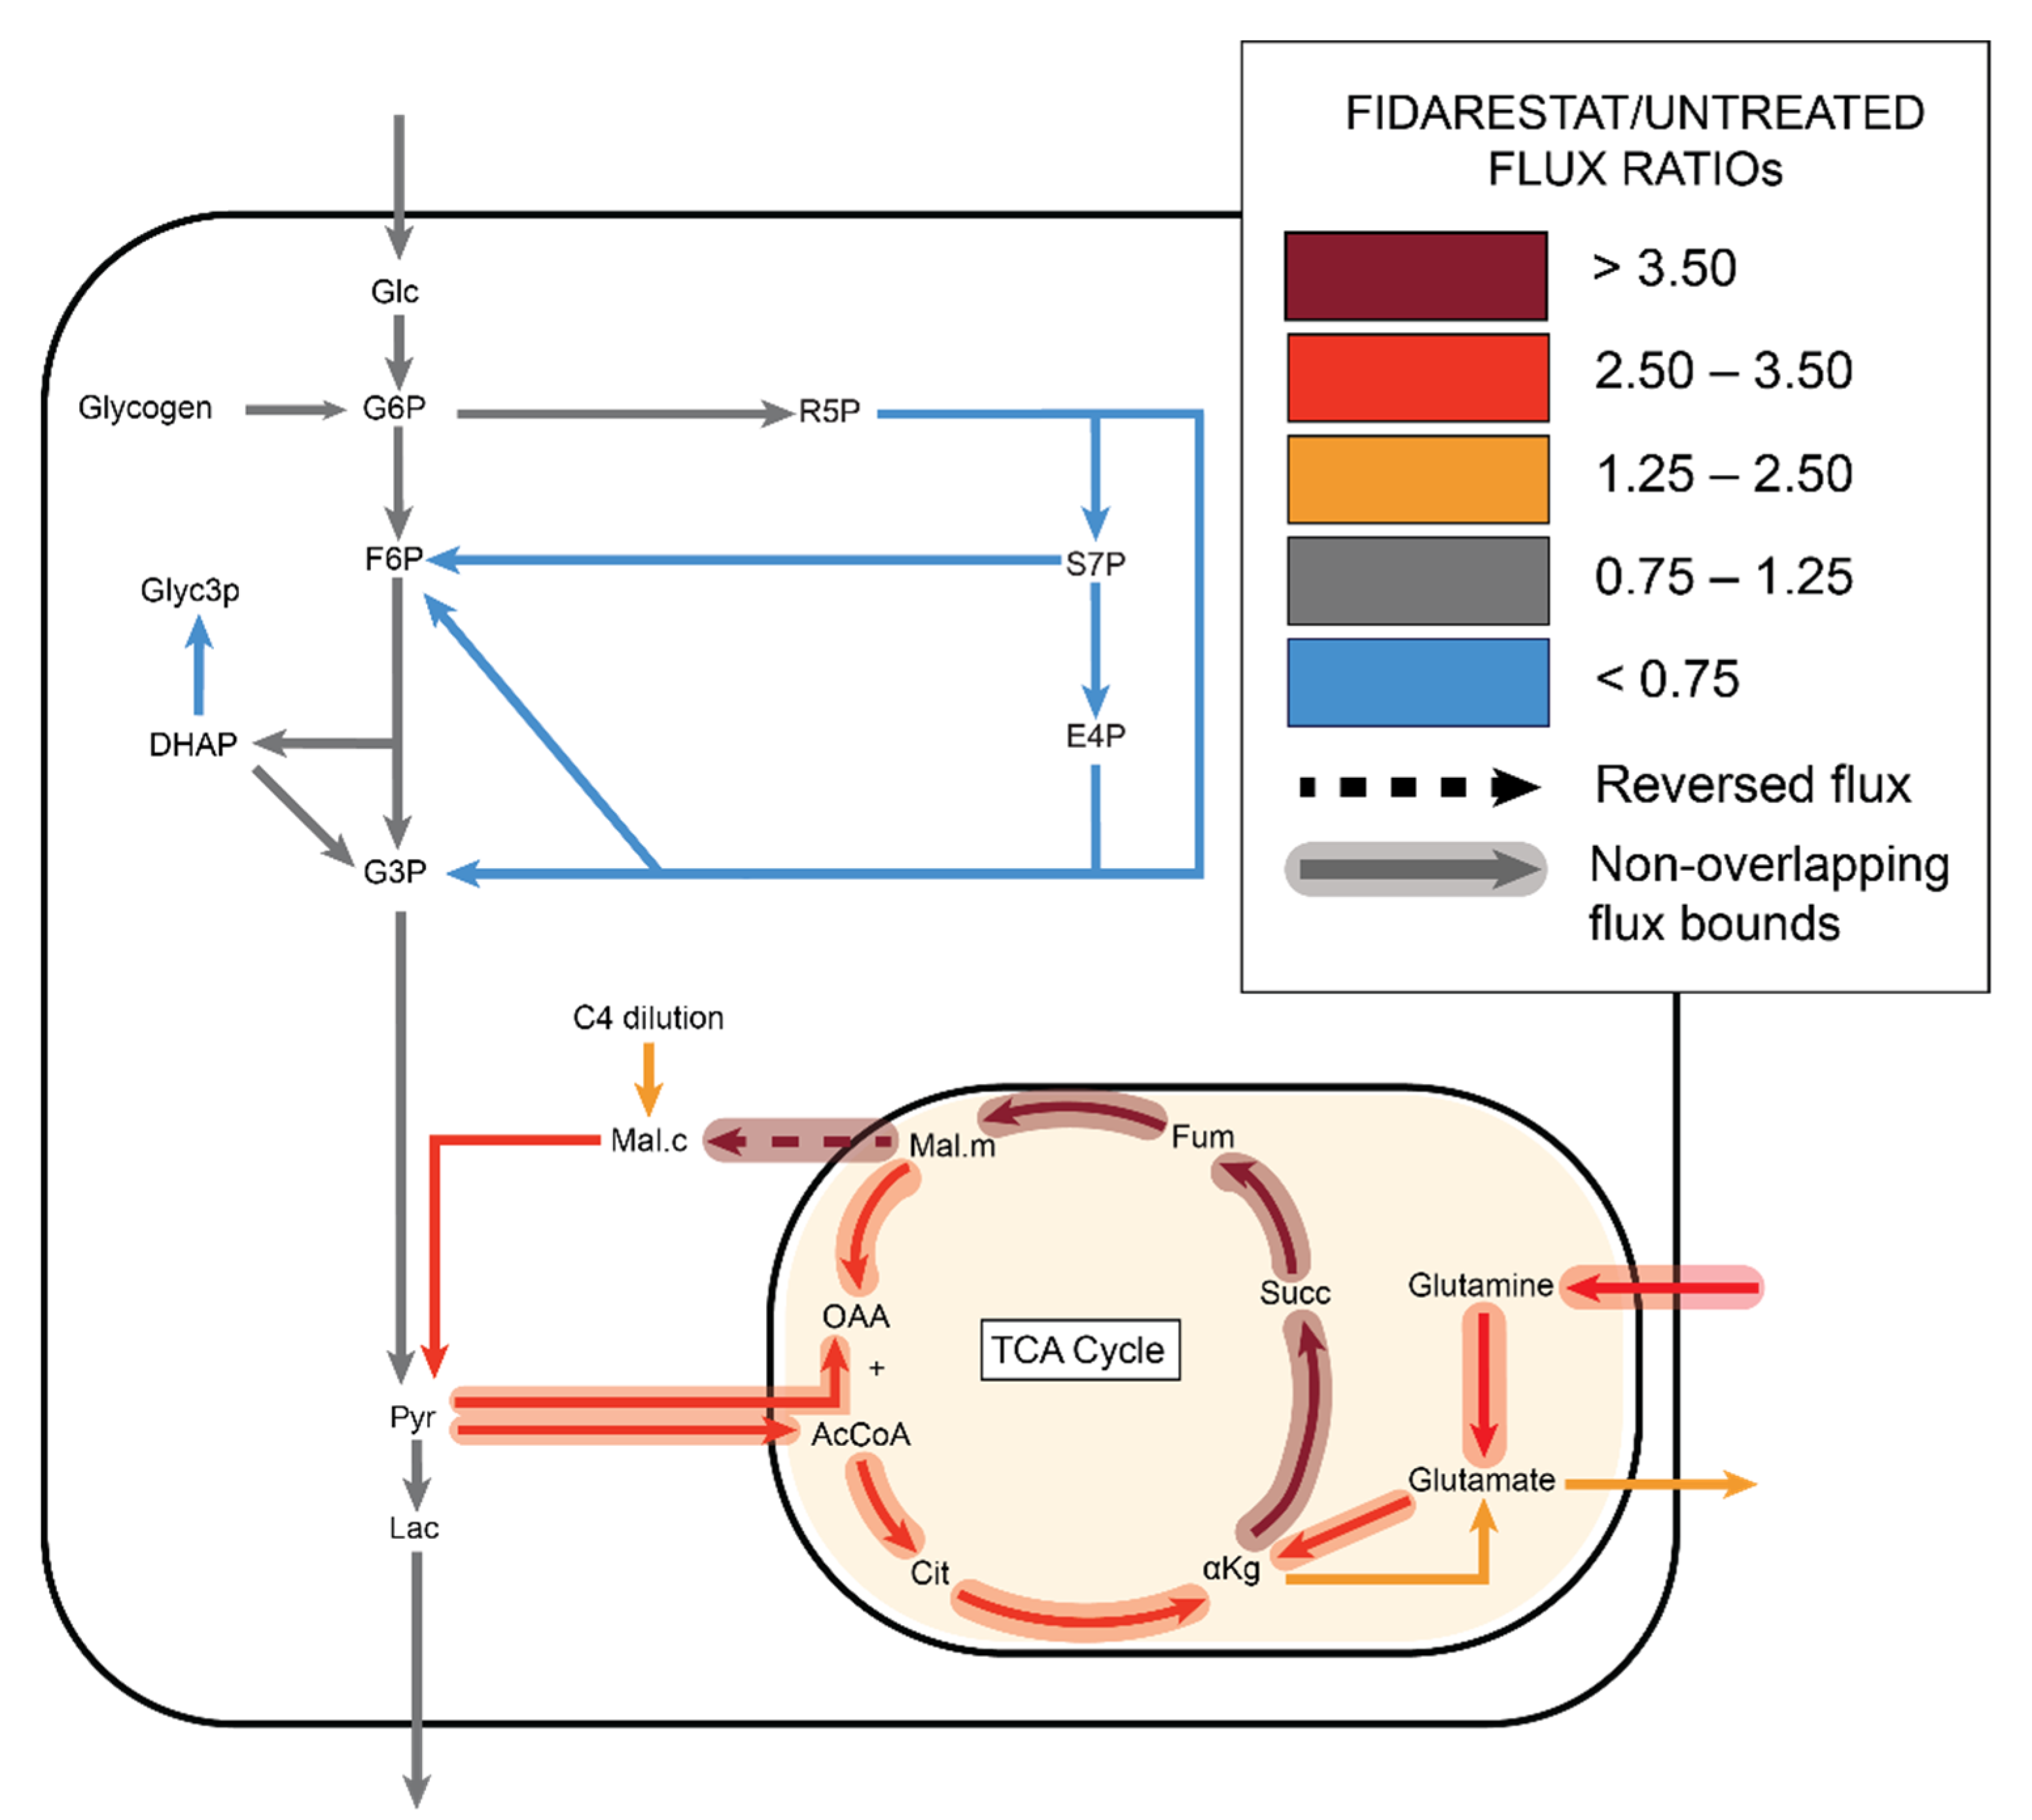
13C MFA of the fidarestat-treated endothelial cells predicted several changes in metabolic fluxes (Figure 5, Supplemental File S4). While glycolytic fluxes were estimated to be similar to the untreated group, the model predicted a decrease in non-oxidative PPP fluxes in the fidarestat treated group, although the 95% confidence intervals of these fluxes overlapped with the untreated group (Supplemental File S5). Fidarestat-treated cells were predicted to take in 31% more carbon than untreated cells, with 21% of the total carbon intake from glutamine and another 25% from the malate dilution flux. All TCA fluxes were predicted to increase significantly in fidarestat-treated cells, with no overlap in the 95% confidence intervals for the forward TCA fluxes between the treated and untreated groups. High glutamine intake in fidarestat-treated cells led to nearly four-fold increases in alphaketoglutarate dehydrogenase (AKG ➔ succinate), succinate dehydrogenase (succinate ➔ fumarate), and fumarase (fumarate ➔ malate) fluxes. Notably, the malate shuttle direction reversed from mitochondrial import to export with fidarestat treatment.

2.4. DHEA: Pentose Phosphate Pathway Inhibition

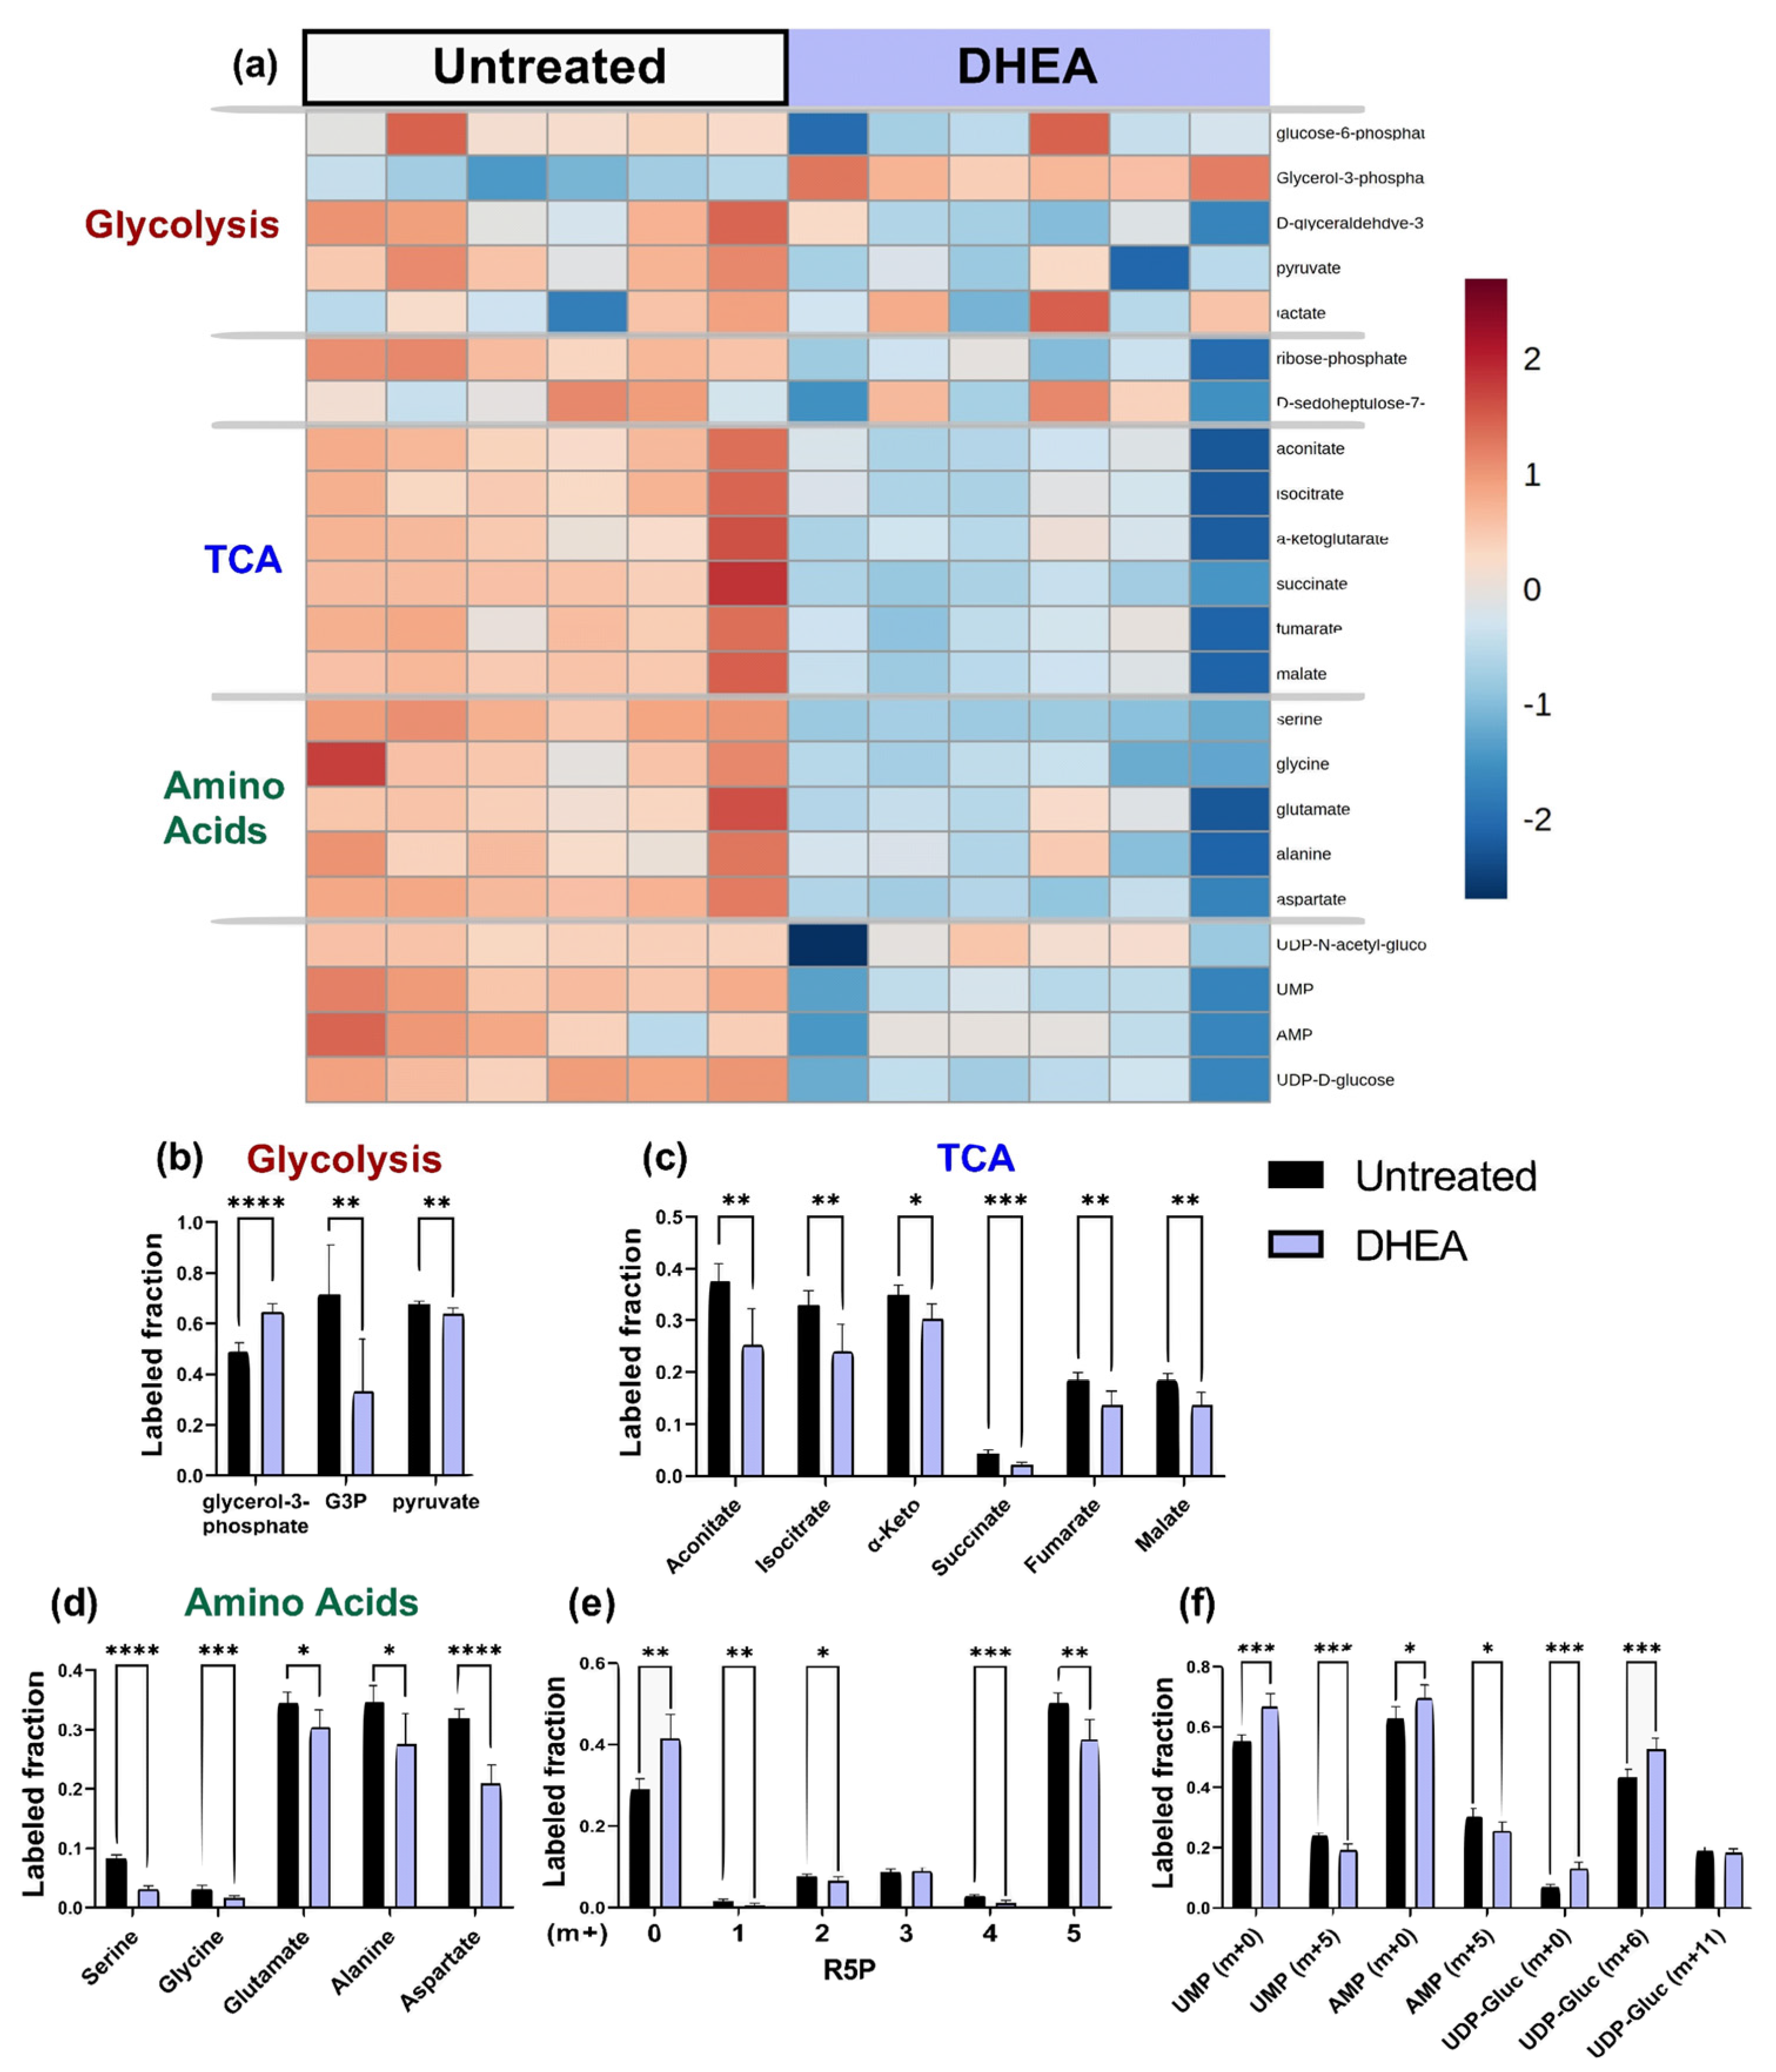
We first confirmed that DHEA treatment of endothelial cells successfully reduced the activity of G6PD, the first and rate-limiting enzyme of the PPP, by 40% (Supplemental Figure S5a). DHEA had mixed effects on 13C enrichment of glycolytic metabolites; however, DHEA treatment consistently decreased 13C enrichment of TCA metabolites, amino acids, UDP-D-glucose, NAD, UMP, AMP, and the PPP metabolite ribose-5-phosphate (Figure 6a, full heatmap in Supplemental Figure S4b). When the 13C enrichment of glycolytic metabolites from DHEA-treated endothelial cells was examined in more detail, there was a 53% reduction in 13C enrichment of G3P (p < 0.001), as well as a slight decrease in pyruvate (Figure 6b). DHEA-treated cells showed 32% increased labeling of glycerol-3-phosphate, a dihydroxyacetone phosphate (DHAP) derivative. 13C enrichment of all measured TCA metabolites decreased by 10–32% with DHEA treatment (Figure 6c). 13C enrichment of serine decreased by more than 50% (p < 0.001) and 13C enrichment of glycine, glutamate, alanine, and aspartate also decreased in DHEA-treated cells (Figure 6d). In the PPP, the R5P isotopomer distribution changed in endothelial cells treated with DHEA. R5P [m + 0] increased by roughly 10%, while R5P [m + 5] decreased by nearly the same amount (Figure 6e). Finally, the unlabeled fractions of nucleotides UMP and AMP increased significantly, while the [m + 5] isotopes of these compounds decreased. UDP-glucose [m + 6] increased with DHEA treatment (Figure 6f).
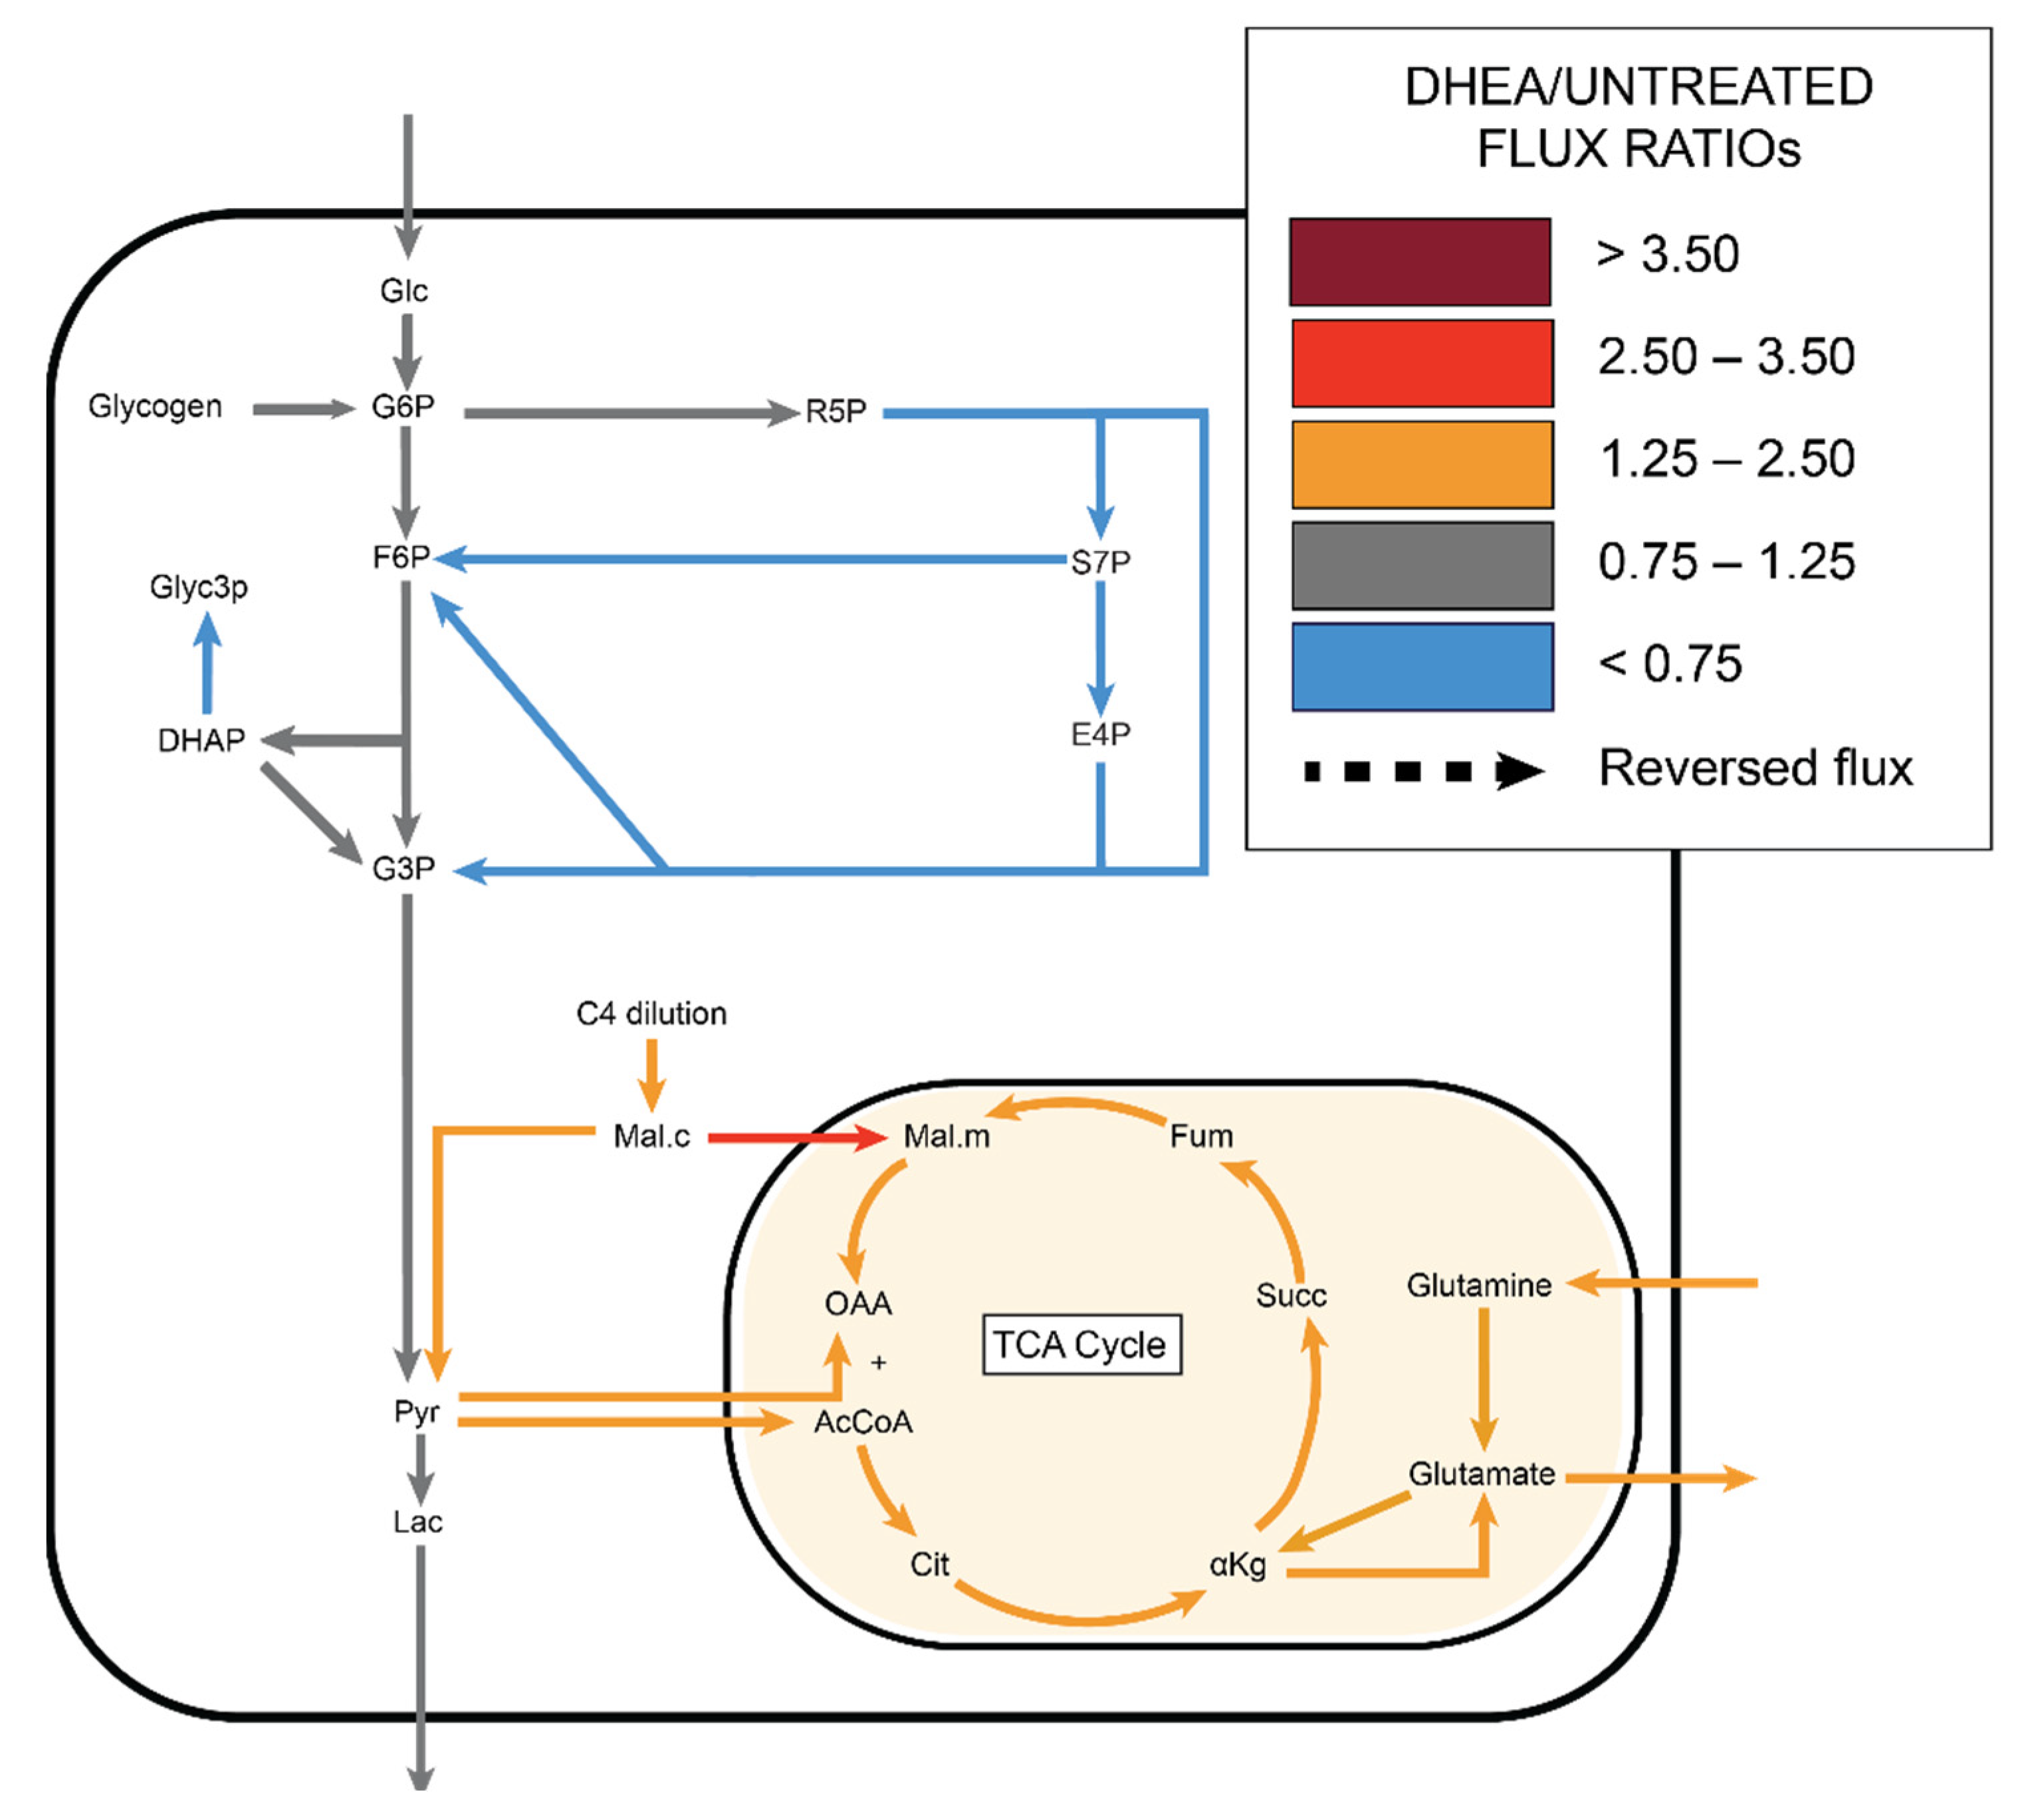
13C MFA predicted no change in glycolytic activity with DHEA. In the PPP, although the G6PDH reaction flux (G6P ➔ R5P) did not change, other PPP fluxes were estimated to decrease by 32%; however, they remained within the confidence interval of the untreated group. TCA cycle activity increased in endothelial cells treated with DHEA, although the lower bound of 95% confidence intervals for many of these fluxes slightly overlapped with the untreated group (Figure 7). Malate transport into the mitochondria increased by a factor of 3 (Supplemental File S4, Supplemental File S5).

2.5. Azaserine: Hexosamine Biosynthetic Pathway Inhibition

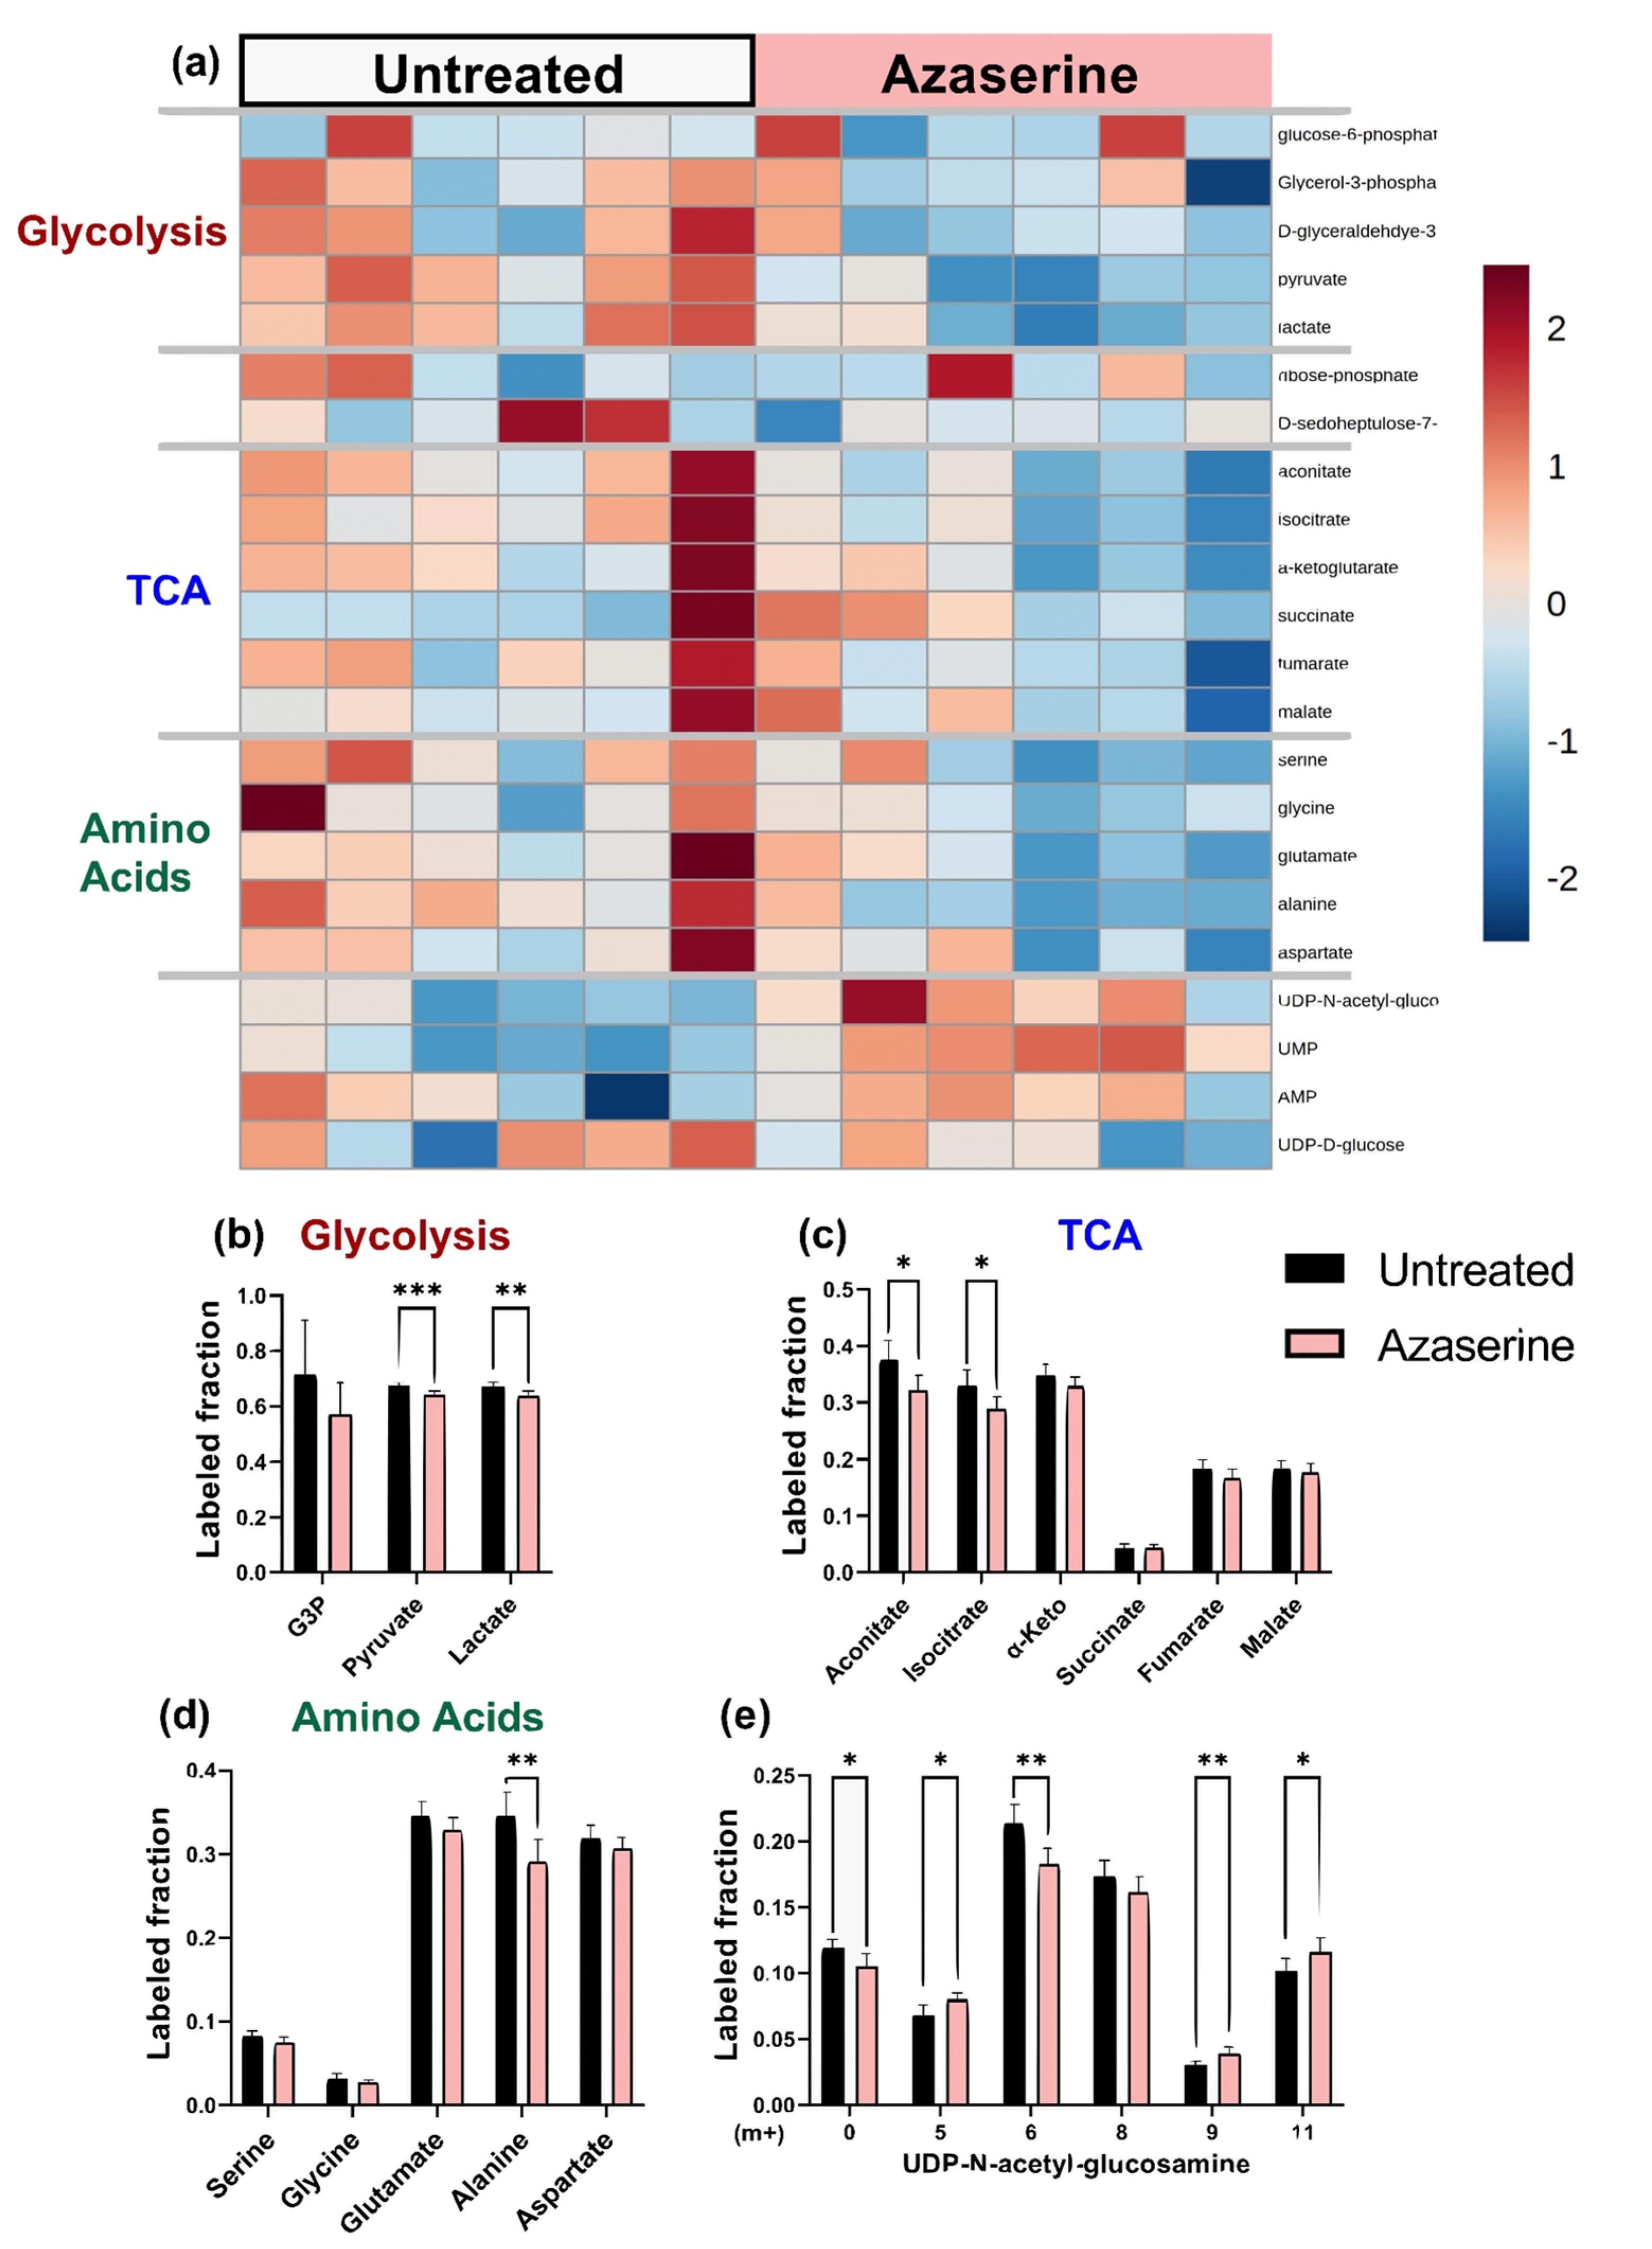
Azaserine-treated endothelial cells, which should have decreased HBP flux, showed decreased UDP-GlcNAc in the total pool data (Supplemental Figure S8) and 30% lower protein O-GlcNAcylation by Western blot (Supplemental Figure S5b). Azaserine-treated cells appeared similar to untreated cells on the 13C enrichment heat map. Total glycolytic and TCA intermediate metabolites decreased slightly with azaserine treatment, while amino acids and nucleotides did not change consistently (Figure 8a, full heatmap in Supplemental Figure S4c). When 13C enrichments were analyzed in additional detail, 13C enrichment of glycolytic metabolites pyruvate and lactate decreased by 5% with azaserine treatment (p < 0.001 and p < 0.01, respectively; Figure 8b). Similarly, TCA metabolite 13C enrichment decreased by 4–15% with azaserine treatment, with only acotinate and isocitrate statistically significant (p < 0.05; Figure 8c). 13C enrichment of amino acids was similar between azaserine treated and untreated cells, except for alanine, which showed a 15% lower 13C enrichment in azaserine treated cells (Figure 8d). The isotopomer distribution of UDP-GlcNAc showed a different pattern with azaserine treatment, with UDP-GlcNAc [m + 0], [m + 6], and [m + 8] decreasing and UDP-GlcNAc [m + 5], [m + 9], and [m + 11] increasing for azaserine treated cells (Figure 8e). The largest change was in UDP-GlcNAc [m + 6], which decreased by 15% (p < 0.01).
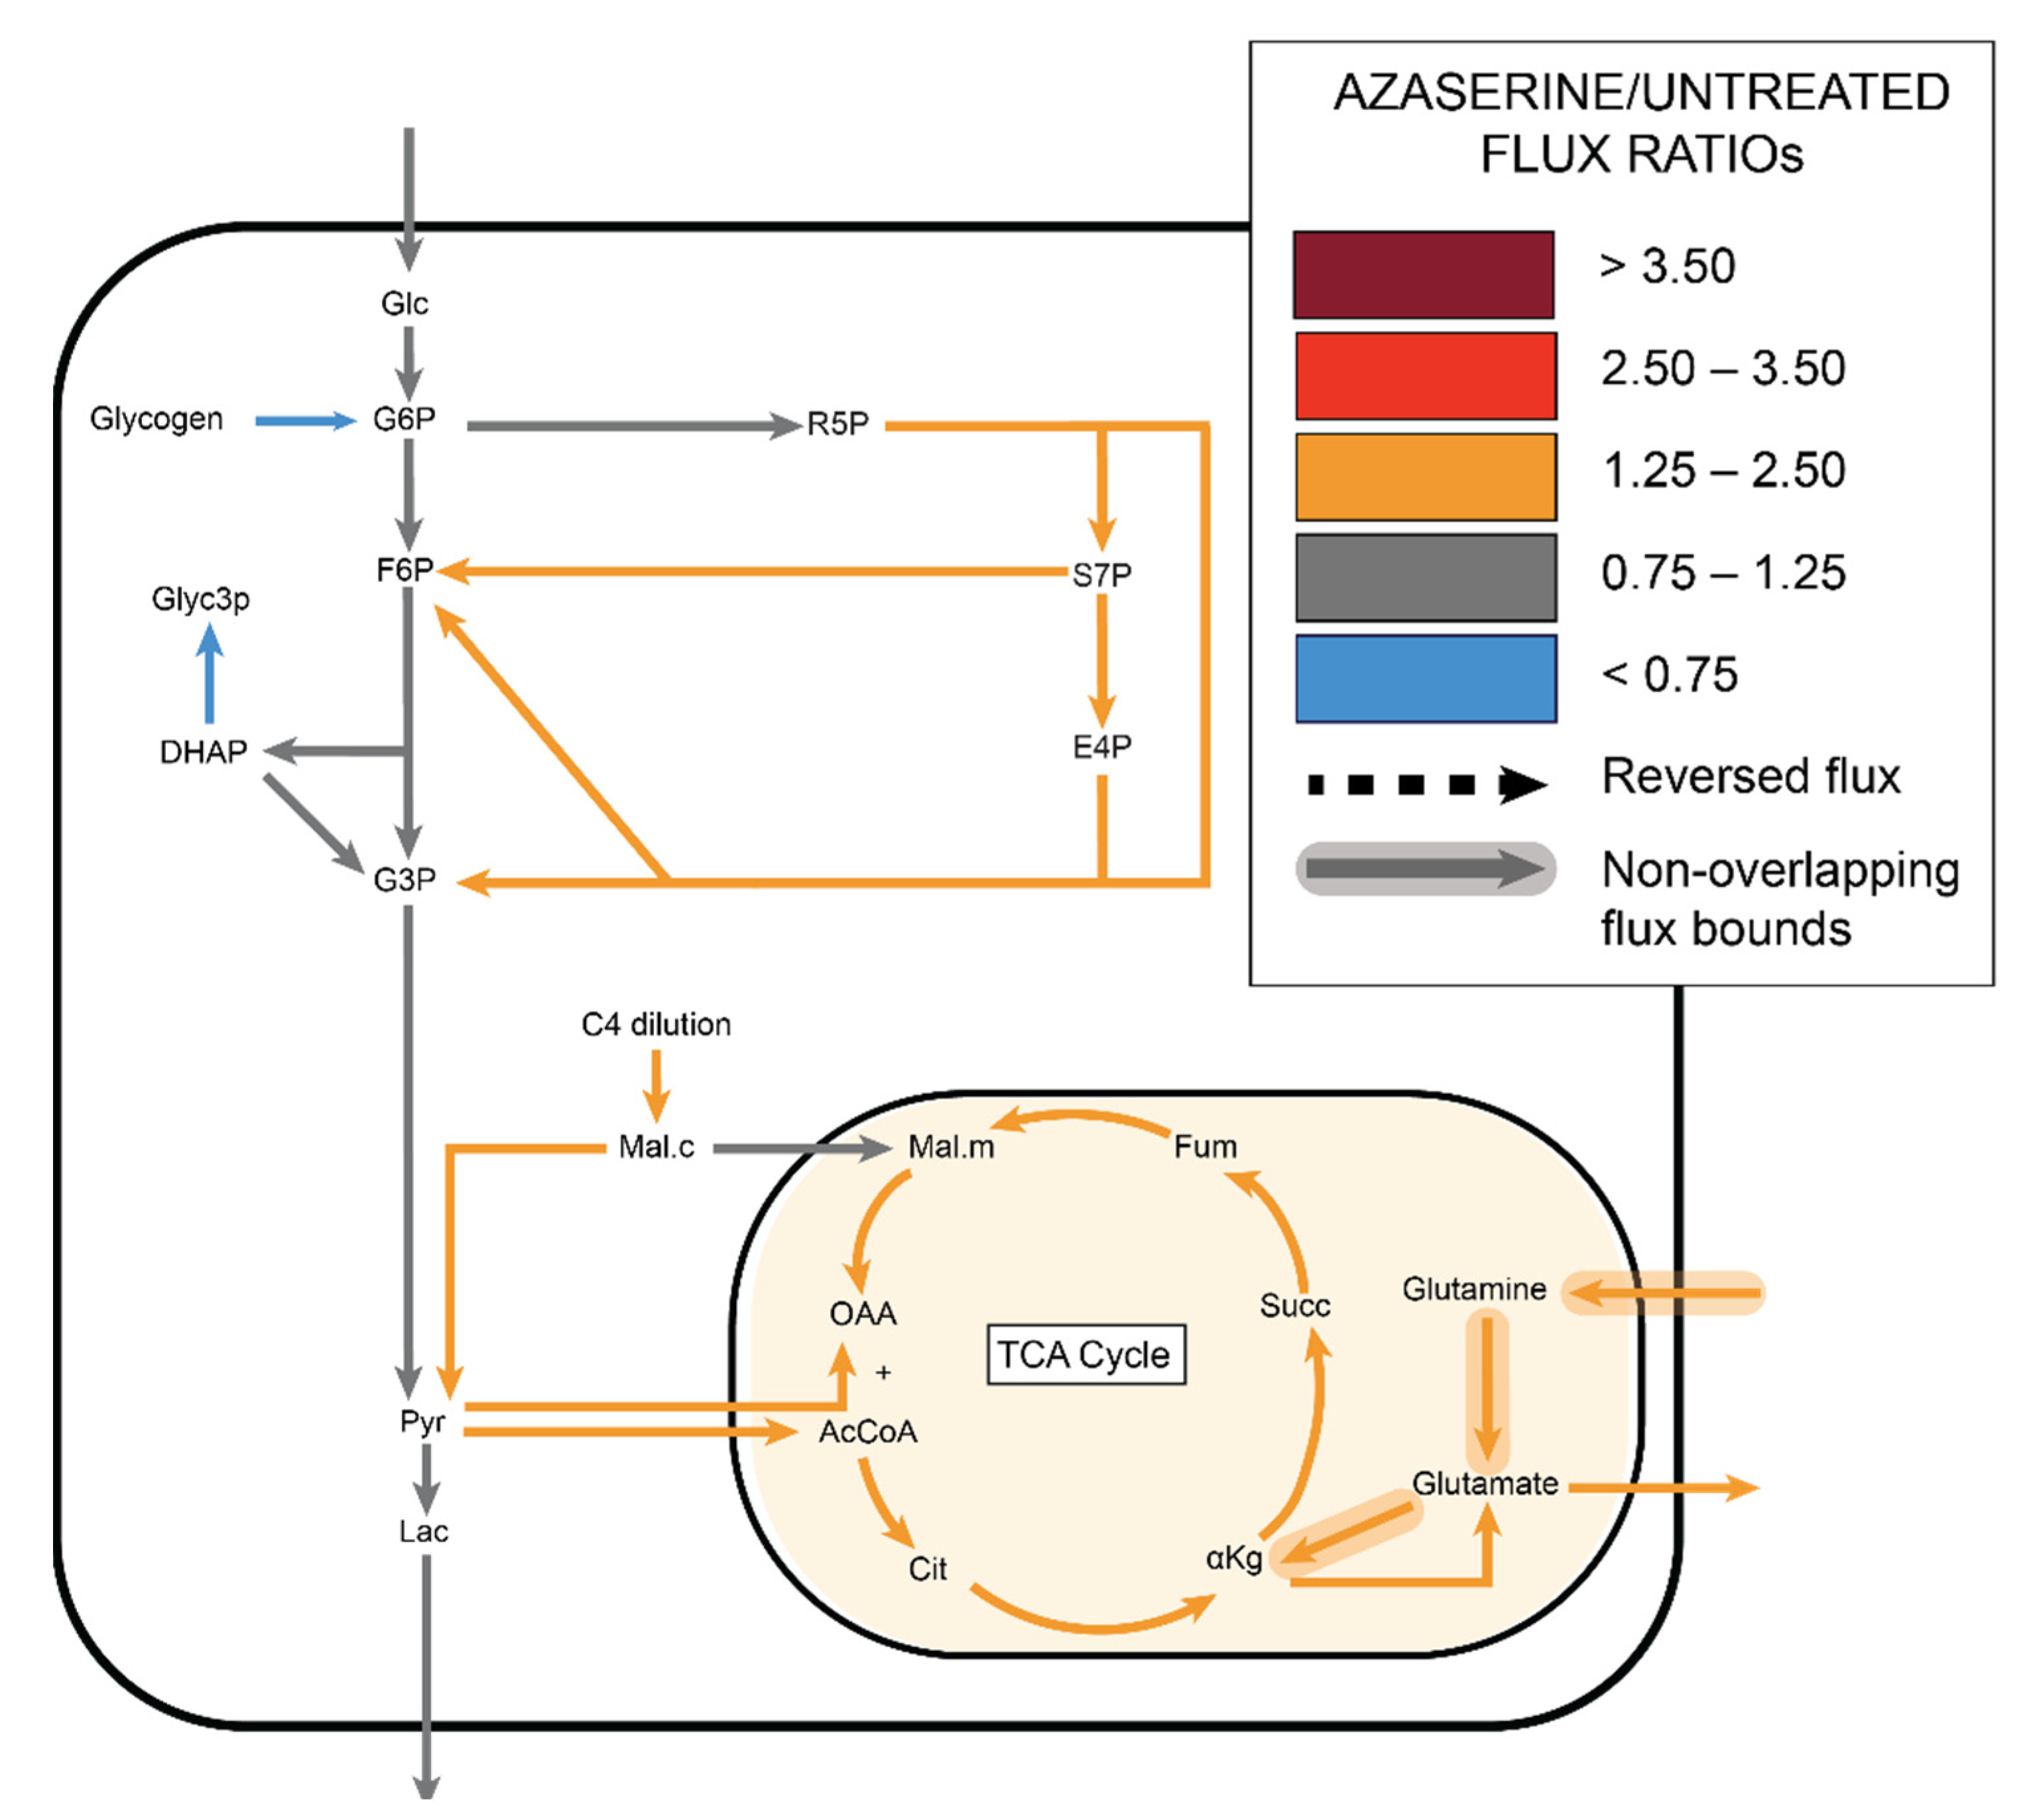
Similar to the other groups, 13C MFA predicted no change in glycolytic flux with azaserine. However, in contrast to the other groups, MFA predicted that PPP flux would increase by 1.4–1.7 over fluxes in untreated cells, although the confidence intervals for these fluxes overlapped. 13C MFA further predicted increased flux throughout the TCA cycle, driven by a combination of increased pyruvate shuttling into the mitochondria, glutamine influx, and malate influx (Figure 9, Supplemental File S4, Supplemental File S5).

3. Discussion

Endothelial metabolic perturbations are implicated in vascular dysfunction and disease [2]. Understanding the systemic impact of metabolic inhibitors is crucial to characterizing their therapeutic efficacy and safety. In this study, we analyzed the effects of fidarestat (polyol pathway), DHEA (PPP), and azaserine (HBP) on the endothelial metabolic network. We now demonstrate that the impact of these metabolic inhibitors extends beyond their intended targets and may significantly perturb other metabolic pathways, particularly the TCA cycle. These analyses highlight the importance of integrated experimental and computational studies of the effects of pathway-specific inhibitors on the entire metabolic network.
Several unique metabolic characteristics of endothelial cells became evident in the baseline 13C MFA model [2]. An unlabeled four-carbon (C4) source flux was required to fit the 13C MFA model for all four treatment groups. We propose several possible explanations for the unlabeled C4 source (Supplemental Figure S6). First, the C4 compound could come from media proteins or amino acids. Glutamine (2 mmol/L) is the most concentrated media amino acid. When we simulated glutamine entry and cytosolic conversion to oxaloacetate in our model, we obtained a satisfactory fit (data not shown). However, these reactions typically occur in mitochondria and to our knowledge, there is limited evidence of that they occur in cytosol. Furthermore, this model predicted increased PPP flux in fidarestat-treated cells, which contradicts isotope labeling data.
An alternative unlabeled C4 source may be malate drawn from preexisting intracellular carbon pools such as cytoplasmic succinate or succinyl-CoA. Succinate accumulates in mitochondria when succinate dehydrogenase is inhibited [33]. Excess mitochondrial succinate is then transported into the cytosol by the dicarboxylate transporter SLC25A10 [34]. Succinyl-CoA could also be produced outside mitochondria [35]. In support of this hypothesis, succinate was 95–97% unlabeled in all samples whereas other TCA metabolites were 60–80% unlabeled. Our 13C MFA metabolic model predicted that 85–91% of succinate is in the cytoplasm. Cytosolic succinate is known to affect cell signaling by promoting protein succinylation and impact the epigenetic landscape by inhibiting histone and DNA methylases [36,37]. Thus, high cytosolic succinate may identify an important connection between endothelial cell metabolism and signaling pathways. However, the amount of preexisting unlabeled succinate may be too small to account for the substantive C4 influx predicted by 13C MFA.
Finally, the arginine/citrulline cycle may also be an unlabeled C4 source. Arginine, which is present in the medium, is converted to citrulline by endothelial nitric oxide synthase (eNOS) to generate nitric oxide (NO). When citrulline and aspartate react to form fumarate and recycled arginine, the cytosolic fumarate can then be converted into malate [38]. The reaction requires aspartate import or synthesis, which may come from degradation of media threonine or other aspartate-family amino acids. This hypothesis is supported by the increased dilution of fumarate and malate as compared to other TCA metabolites in the isotopomer data. In addition, endothelial cells have several arginine transporters and retain high cytoplasmic arginine for continuous NO production [39]. Glutamine, succinate, and arginine are likely not mutually exclusive but rather their combination provides the additional C4 sources.
Fidarestat significantly impacted core metabolic pathways, even though the polyol pathway is considered primarily active in hyperglycemia [7]. Our 13C MFA model suggests that increased glutamine rather than glucose uptake provides carbons for the higher TCA activity, leading to TCA metabolite dilution [40]. This prediction is supported by our observation that mitochondrial potential increases in fidarestat-treated HUVEC (Supplemental Figure S10). Fidarestat may affect glutamine uptake and TCA activity via sirtuin 1 (SIRT1), an NAD+-dependent deacetylase that regulates metabolic gene expression and may be protective in vascular tissue [41,42]. SIRT1 promotes glutamine uptake by enhancing reductive carboxylation through increased glutamine transporter SLC1A5 and mitochondrial glutaminase isoform 1 (GLS1) expression [43]. Fidarestat increased SIRT1 expression in both HUVEC in vitro and diabetic mice in vivo [44]. Since SIRT1 activity also depends on the NAD+/NADH ratio, fidarestat may also increase SIRT1 activity since less NAD+ is converted to NADH when the polyol pathway is inhibited [45,46]. Alternatively, fidarestat may regulate glutamine uptake and TCA activity via nuclear factor erythroid 2-related factor 2 (Nrf-2), a transcription factor important in oxidative stress response. An aldose reductase inhibitor increased Nrf-2 activity in colon cancer cells [47], and Nrf-2 increased glutamine uptake and metabolism in murine cells [48,49].
Fidarestat may decrease PPP flux through the intracellular NADP+/NADPH balance. We measured a lower NADP+/NADPH ratio in fidarestat-treated as compared to untreated cells (Supplemental Figure S9), likely since aldose reductase inhibition reduced NADPH oxidation to NADP+. Increased cytosolic malate in fidarestat-treated endothelial cells can be converted into pyruvate and NADPH via malic enzyme. We hypothesize that increased TCA activity with fidarestat also increased malic enzyme activity, resulting in increased cytosolic NADPH production [22,50]. The malic enzyme-produced NADPH, along with decreased NAPDH consumption in the polyol pathway, may then increase NADPH to allosterically inhibit PPP flux [51]. An effect of decreased non-oxidative PPP activity in fidarestat-treated endothelial cells is reduced formation of the five-carbon ribose-5-phosphate (R5P), which is observed in decreased 13C enrichment of UMP [m + 5], AMP [m + 5], and amino acids. Endothelial cells synthesize or take up serine for nucleotide synthesis; thus, decreased nucleotide synthesis via the PPP may require increased serine import from the media [52,53]. Increased serine influx would decrease 13C enrichment of serine and its derivative, glycine, as well as G3P and pyruvate. In addition, decreased PPP flux may increase G6P [m + 6] in the cytosol and thus route G6P down alternate pathways such as UDP-glucose synthesis from G6P-derived G1P and UMP. Increased G6P [m + 6] combined with decreased UMP [m + 5] could lead to the observed increased UDP-glucose [m + 6] and decreased UDP-glucose [m + 11] (Supplemental Figure S7a).
Although endothelial cells treated with the PPP inhibitor DHEA were similar to fidarestat-treated cells, these changes likely occurred through a reversal of the same mechanism. We measured an increased NADP+/NADPH ratio in DHEA-treated as compared to untreated cells (Supplemental Figure S9), which fits with decreased NADPH reduction to NADP+ when G6PD is inhibited. To compensate for decreased PPP activity and therefore reduced NADPH production, DHEA-treated endothelial cells may have increased glutamine intake and malic enzyme activity to restore NADPH. These cells may have also increased serine consumption to drive nucleotide synthesis. Studies in mouse oocytes suggest that DHEA inhibition of PPP may motivate citrate conversion to malate to produce NADPH and thereby restore reduction as well as fatty acid, cholesterol, and steroid hormone production [54]. DHEA treatment in primary corneal fibroblasts increased isocitrate, fumarate, and malate [55]. Endothelial cells have also been shown to sustain TCA activity for nucleotide synthesis [2]. TMRM staining demonstrated increased mitochondrial potential in DHEA-treated cells (Supplemental Figure S10). Increase TCA cycle activity in our study may indicate a compensatory mechanism in DHEA-treated endothelial cells.
Azaserine inhibition of the HBP slightly increased PPP activity, which could be due to cytosolic F6P and hence G6P accumulation. Another possibility is that azaserine decreases PPP inhibition [56]. Glucosamine-6-phosphate (GlcN6P), which is produced in the first HBP reaction, inhibited the PPP via G6PD inhibition in bovine venular endothelial cells and human embryonic stem cells [57,58]. Thus, reduced GlcN6P in azaserine-treated cells may in turn reduce G6PD inhibition and increase PPP flux. However, we measured an increased NADP+/NADPH ratio in azaserine-treated as compared to untreated cells (Supplemental Figure S9). Since azaserine inhibits reactions that involve glutamine, it is possible that there is another inhibited reaction that is causing this effect. We also observed increased mitochondrial potential in azaserine-treated cells (Supplemental Figure S10). Increased TCA activity with decreased TCA metabolite 13C enrichment with azaserine treatment could relate to increased glutamine uptake as the endothelial cells tried to overcome azaserine competitive inhibition of glutamine reactions. Interestingly, azaserine treatment did not change the overall 13C enrichment of UDP-GlcNAc, the primary HBP endpoint, but instead shifted isotopomer labeling. Azaserine reduced UDP-GlcNAc [m + 6] and [m + 8], which represent decreased labeled F6P incorporation into UDP-GlcNAc through the HBP. UDP-GlcNAc [m + 5] and UDP-GlcNAc [m + 11] increased, likely due to increased UDP [m + 5] (Supplemental Figure S7b).
While to the best of our knowledge this is the first application of 13C MFA to study HUVEC metabolism, our study is not without limitations. We present hypotheses supported by the model, along with some validation studies; however, further in vitro and in vivo studies are needed to validate these hypotheses. We did not consider the impact of insulin, which may have been present in our culture medium since endothelial cells primarily use the insulin-independent glucose transporter GLUT1. All of the inhibitors in our studies have off-target effects which may or may not relate to metabolism [59]. 13C MFA quantified fluxes in core metabolic pathways; however, the model could not resolve fluxes in peripheral pathways such as HBP and UDP-glucose since these pathways terminated in sink nodes that did not tie back to core metabolic pathways.
Together, our combined experimental and computational approach highlights potential systemic effects of metabolic inhibitors on endothelial metabolism. We show that all three inhibitors increased TCA activity, suggesting that the TCA cycle attenuates perturbed endothelial metabolism. In addition, carbon influx prior to malate or oxaloacetate appears to be a crucial aspect of HUVEC metabolism. Metabolic therapeutics are increasingly explored as treatments for cancer [60] and cardiovascular disease [61] among others. However, the interconnected nature of metabolism means that these therapeutics need to be closely examined to reduce off-target effects prior to clinical implementation.

4. Materials and Methods

4.1. Cell Culture and Pathway Inhibition

Human umbilical vein endothelial cells (HUVEC, Cell Applications) were cultured in a 37 °C, 5% CO2 incubator in Endothelial Growth Medium-2 (EGM-2; Lonza) supplemented with 10% fetal bovine serum (FBS; HyClone), 1% penicillin-streptomycin, and 1% L-glutamine (Gibco). Media was changed every two days, and HUVEC were used between passages 4 and 8.
The polyol pathway, PPP, and HBP were inhibited using fidarestat, DHEA, and azaserine respectively. For inhibitor studies, HUVEC were seeded near confluence and incubated for 48 h until cells formed a confluent monolayer. Media was then changed to Endothelial Basal Medium-2 (EBM-2; Lonza) supplemented with 10% FBS, 1% penicillin-streptomycin, and 1% L-glutamine (Gibco) and either 18 µM fidarestat; 5 µM DHEA; or 25 µM azaserine (Cayman Chemical) was added for 24 h. Untreated cells were cultured in 0.1% dimethylsulfoxide (DMSO) as a vehicle control. Dose-response studies confirmed that 50 µM DHEA inhibited G6PDH activity (Abcam) in HUVECs by about 40% (Supplemental Figure S5a), and 25 µM azaserine significantly reduced protein O-GlcNAcylation by Western blot (Supplemental Figure S5b). No significant cell death was observed at these inhibitor concentrations.

4.2. Isotope Labeling and Mass Spectrometry

Endothelial glucose metabolism was measured via YSI bioanalysis and liquid chromatography mass spectrometry (LC-MS). YSI was used to measure glucose uptake and lactate output, as well as glutamine uptake and glutamate output. For YSI, 200 μL conditioned media was collected from each replicate and pipetted into a 96-well plate for analysis by a YSI Bioanalyzer 2950.
For mass spectrometry, HUVEC were cultured with 5 mM U-13C6-glucose (Cambridge Isotope Laboratories) in DMEM without glucose, glutamine, and pyruvate (ThermoFisher Scientific) supplemented with 10% dialyzed FBS, 1% penicillin-streptomycin, and 1% L-glutamine for 24 h, as prior studies indicated that cells reached isotopic steady-state by this time. The medium was then removed and 80:20 methanol:water (−80 °C, extraction solvent) was added to cells for 15 min at −80 °C. Cells were scraped in the extraction solvent and cell lysates pipetted into Eppendorf tubes. Samples were centrifuged at 16,000 g for 10 min at 4 °C to pellet debris. The supernatant was transferred to a new tube, desiccated under nitrogen gas flow, and re-dissolved in LC-MS grade water. Metabolites were analyzed via reverse-phase ion-pairing chromatography coupled to an Exactive Orbitrap mass spectrometer (ThermoFisher, San Jose, CA, USA) following an established protocol [62]. Correction for natural abundance was performed using previously described protocols [63].

4.3. Metabolic Flux Analysis (MFA)

Metabolic flux analysis (MFA) combines experimental measurements and mathematical modeling to predict intracellular metabolic fluxes [64]. MFA requires a metabolic map that includes all reactions of interest, as well as experimental external metabolite rates and isotope-labeled metabolite distributions [64,65]. MFA then integrates these inputs to infer metabolic fluxes.
First, a metabolic network map was manually constructed to include relevant metabolic reactions, including glycolysis, the TCA cycle, and glycolytic side branches of interest (polyol pathway, PPP, HBP; Supplemental File S1) [66,67]. The metabolic network included dilution and pseudo reactions to account for unlabeled carbon sources and compartmentalization, respectively. Next, external metabolite rates (ri; nmol/106 cells/h) for each metabolite (glucose, glutamine, lactate, glutamate) were calculated for non-proliferating cells from the YSI data as [64]:
r i = 1000 *   C i * V t * N x
where V is volume (mL); ∆Ci is metabolite concentration change between the two measurement times; ∆t is time (hours); and Nx is cell number (2.2 million cells for a confluent 6-well plate). Finally, the isotope-labeled metabolite distributions from the mass spectrometry data were incorporated into the mass distribution vector (MDV), which describes the fractional abundance of each potential labeled isotope (from m + 0 with no labeled carbons to m + n with fully labeled carbons) [65,68]. The experimental standard deviation was selected as the maximum value between the actual experimental error or 1%, the standard error rate for LC-MS experiments [64].
Steady-state metabolic fluxes were then predicted using the MATLAB-based software package INCA [69], which uses optimization to identify a flux distribution that minimizes the sum of squared residuals (SSR) between simulated and experimentally derived MDVs. Flux values were determined using a Levenberg–Marquardt gradient descent algorithm. To improve the odds of finding the global optimum, simulations were repeated 100 times, each time beginning from a random initial point. The goodness of fit is based on the assumption that the minimized SSR follows a chi-square distribution. An acceptable fit is based on the n–p degrees of freedom, where n is the number of independent measurements and p is the number of fitted parameters. The formula for the expected SSR range is χ α / 2   2 (n − p), χ 1 α / 2   2 (n − p)). The metabolic network map was iteratively modified, and the map and flux values that resulted in the minimum SSR were retained as the most likely flux distribution.
Reactions from glycolysis, TCA cycle, PPP, and HBP were used to build the model. Metabolites with missing or poor-quality mass spectrometry data were either (i) excluded from the model or (ii) lumped with adjacent metabolites if there were no changes in carbon arrangement. Both glucose and glutamine were essential carbon inputs to the model. However, we were not able achieve a satisfactory fit with these carbon sources alone (SSR = 220). A G6P dilution term representing glycogen breakdown was added to the model to account for unlabeled G6P. The glycogen source reaction improved model fit, but the overall SSR of 178 did not satisfy the acceptable range of [27.6, 64.2]. However, additional unlabeled carbons were needed to fit m + 0 and m + 2 malate, alpha ketoglutarate, and glutamate as well as the absence of m + 1 and m + 2 pyruvate and lactate in the experimental data. We therefore added an unlabeled three-carbon source to dilute pyruvate and a four-carbon source to dilute malate. Incorporating the three-carbon dilution to pyruvate slightly decreased the SSR value to 166, while the four-carbon dilution to malate reduced the SSR to 42, which was considered an acceptable fit (Supplemental Figure S1).
The final 13C MFA HUVEC model consisted of 79 reactions, 105 fluxes, 39 metabolites, and 45 degrees of freedom (Supplemental Figure S1). Labeled glucose accounted for 60% of incoming carbon, while glutamine (9%), glycogen (15%), and C4 dilution (16%) accounted for the remaining unlabeled carbon. Several assumptions were made during model construction. Mitochondrial and cytoplasmic malate, succinate, alpha ketoglutarate, pyruvate, citrate, glutamate, and aspartate pools were assumed to mix during metabolite extraction. HBP reactions and data were successfully fitted in the final model. However, estimated values for HBP fluxes were close to zero (<10−6) in the untreated group and were associated with large uncertainty in all groups, likely due to the number of unbounded dilution reactions tied into this pathway. For this reason, HBP fluxes were excluded from our flux ratio analysis. The metabolic model, confidence intervals, and MFA results can be found in Supplemental File S1.

4.4. Statistical Analysis

Supervised partial least-square discriminant analysis, principal component analysis, and variable importance projection (VIP) scores were obtained using MetaboAnalyst [70]. Statistical analysis and visualization of external flux and isotope labeling experiments were performed with GraphPad Prism v9.0.0. Each treatment group in the mass spectrometry dataset consists of n = 6 biological replicates from one experiment. External flux measurements quantified by YSI were repeated 3 times and a representative dataset is shown. All error bars represent SD. Statistical tests for experimental data are specified under each figure. For 13C MFA, 95% confidence intervals were calculated using parameter continuation, which varies all parameters upward and downward one at a time until the chi-square distributions are reached.

Supplementary Materials

The following are available online at https://www.mdpi.com/article/10.3390/metabo11040226/s1. Figure S1: A C4 dilution was needed to fit the model to the isotopomer data. Malate and α-ketoglutarate were major sources of error, particularly in the m + 0 and m + 2 isotopomers. After adding the C4 dilution, the model was able to reach a satisfactory fit. Figure S2: External flux rate ratios show changes in both glutamine/glucose and glutamate/glutamine ratios with inhibitors. (a) Lactate secretion/glucose consumption ratio, (b) glutamine/glucose ratio, and (c) glutamate/glutamine ratio. Mean +/− s.d. with n = 3 biological replicates. Statistical significance was determined with one-way ANOVA followed by Dunnett’s multiple comparison test; *, p < 0.05; **, p < 0.01; *** p < 0.001. Figure S3: PLS-DA of individual isotopomers confirmed that fidarestat and DHEA-treated cells clustered separately from untreated cells. (a) PLS-DA clustering of individual isotopomers and (b) VIP score plot showing top 25 isotopomers that significantly contribute to class discrimination. Figure S4: Heatmap comparing total enrichment of all metabolites in untreated HUVECs and HUVECs treated with (a) fidarestat (b) DHEA or (c) azaserine. Figure S5: Preliminary experiments demonstrated that the inhibitors affected the PPP and HBP. (a) G6PD activity in DHEA-treated HUVEC and (b) protein O-GlcNAcylation in azaserine-treated HUVEC. Figure S6: Potential pathways that explain the C4 influx predicted by the 13C MFA model. One possibility is that amino acids such as glutamine contribute carbons that directly form malate or indirectly form malate by first forming aspartate that is consumed in the arginine-citrulline-NO cycle. Another possibility is that the unlabeled succinate pool observed in our study may be metabolized to fumarate and malate. Figure S7: Changes in isotopomer distributions of (a) UDP-Glucose following NADPH allosteric inhibition of G6PD and (b) UDP-GlcNAc following azaserine inhibition. Isotopomer fractions are not independent. As labeled fractions increase, unlabeled fractions must decrease. Red arrows designated increased representation of isotopomer in mass distribution vector, while blue arrows designated decreased representation of isotopomer in mass distribution vector. Dotted lines represent isotopomers generated from unlabeled sources, such as glycogen-derived G1P or removed O-GlcNAc residues which can also act as a source. If flux towards a labeled isotopomer increases, the relation ratio of its unlabeled counterpart will decrease. Figure S8: Total pool data for (a) isocitrate, (b) α ketoglutarate, (c) succinate, (d) fumarate, (e) malate, (f) aspartate, (g) ribose-5-phosphate, (h) sedoheptulose-7-phosphate, (i) UDP-GlcNAc, (j) AMP, and (k) UMP in HUVEC treated with fidarestat, DHEA, or azaserine. Statistical significance was determined using ANOVA and Dunnett’s multiple comparison test to compare treated groups to control with significance shown as *** p < 0.001; ** p < 0.01; * p < 0.05. n = 6 biological replicates. Figure S9: Comparison of NADP+/NADPH ratio in HUVEC treated with fidarestat, DHEA, or azaserine. Statistical significance was determined using student’s t-test to compare treated groups to control with significance shown as *** p < 0.001; ** p < 0.01; * p < 0.05. n = 6 biological replicates. Figure S10: Comparison of TMRM/Mitotracker colocalization in HUVECs treated with fidarestat, DHEA, or azaserine. B) Colocalization was quantified with ImageJ and the JACoP software package. Statistical significance was determined by using student’s t-test to compare treated groups to control with significance shown as *** p < 0.001; ** p < 0.01; * p < 0.05. File S1: Baseline HUVEC 13C MFA model reaction schemes, atom transition specifications, and fluxes. File S2: External flux rates, raw and INCA formatted mass spectrometry data. File S3: Isotopomer scores from PLS-DA. File S4: 13C MFA flux values, ratios, and compartmentalization for untreated and DHEA-, fidarestat, and azaserine-treated cells. File S5: 13C MFA 95% confidence intervals for untreated and DHEA-, fidarestat, and azaserine-treated cells.

Author Contributions

Conceptualization, B.M., J.G., S.B., A.M.C. and G.S.; Data curation, B.M.; Formal analysis, B.M., J.G., A.S. and A.L.; Funding acquisition, A.M.C.; Investigation, B.M., J.G., S.B., A.S., A.L., S.P., K.A., C.J., A.M.C. and G.S.; Methodology, B.M., J.G., S.B., C.J., A.M.C. and G.S.; Project administration, A.M.C.; Resources, C.J. and A.M.C.; Software, B.M., J.G., A.S. and A.L.; Supervision, A.M.C. and G.S.; Validation, B.M., A.S., A.L. and S.P.; Visualization, B.M., A.S., A.L. and S.P.; Writing—original draft, B.M., A.M.C. and G.S.; Writing—review & editing, B.M., A.M.C. and G.S. All authors have read and agreed to the published version of the manuscript.

Funding

This research was funded by NIH 1R01HL140239 to AC and NSF DGE-1632976 to BM.

Institutional Review Board Statement

Not applicable.

Informed Consent Statement

Not applicable.

Data Availability Statement

The data presented in this study are available in Supplemental Files S1–S5.

Acknowledgments

The authors would like to thank Jamey Young for providing advice about INCA, as well as Gurneet Sangha for helpful comments on the manuscript.

Conflicts of Interest

The authors declare no conflict of interest.

References

  1. Eelen, G.; de Zeeuw, P.; Simons, M.; Carmeliet, P. Endothelial cell metabolism in normal and diseased vasculature. Circ. Res. 2015, 116, 1231–1244. [Google Scholar] [CrossRef]
  2. Li, X.; Sun, X.; Carmeliet, P. Hallmarks of Endothelial Cell Metabolism in Health and Disease. Cell Metab. 2019, 30, 414–433. [Google Scholar] [CrossRef] [PubMed]
  3. Zecchin, A.; Brajic, A.; Carmeliet, P. Targeting endothelial cell metabolism: New therapeutic prospects? Front. Biol. 2015, 10, 125–140. [Google Scholar] [CrossRef]
  4. Cantelmo, A.R.; Conradi, L.C.; Brajic, A.; Goveia, J.; Kalucka, J.; Pircher, A.; Chaturvedi, P.; Hol, J.; Thienpont, B.; Teuwen, L.A.; et al. Inhibition of the Glycolytic Activator PFKFB3 in Endothelium Induces Tumor Vessel Normalization, Impairs Metastasis, and Improves Chemotherapy. Cancer Cell 2016, 30, 968–985. [Google Scholar] [CrossRef] [Green Version]
  5. De Bock, K.; Georgiadou, M.; Schoors, S.; Kuchnio, A.; Wong, B.W.; Cantelmo, A.R.; Quaegebeur, A.; Ghesquière, B.; Cauwenberghs, S.; Eelen, G.; et al. Role of PFKFB3-driven glycolysis in vessel sprouting. Cell 2013, 154, 651–663. [Google Scholar] [CrossRef] [Green Version]
  6. Schoors, S.; De Bock, K.; Cantelmo, A.R.; Georgiadou, M.; Ghesquiere, B.; Cauwenberghs, S.; Kuchnio, A.; Wong, B.W.; Quaegebeur, A.; Goveia, J.; et al. Partial and transient reduction of glycolysis by PFKFB3 blockade reduces pathological angiogenesis. Cell Metab. 2014, 19, 37–48. [Google Scholar] [CrossRef] [Green Version]
  7. Lorenzi, M. The polyol pathway as a mechanism for diabetic retinopathy: Attractive, elusive, and resilient. J. Diabetes Res. 2007, 2007. [Google Scholar] [CrossRef]
  8. Peiro, C.; Romacho, T.; Azcutia, V.; Villalobos, L.; Fernandez, E.; Bolanos, J.P.; Moncada, S.; Sanchez-Ferrer, C.F. Inflammation, glucose, and vascular cell damage: The role of the pentose phosphate pathway. Cardiovasc. Diabetol. 2016, 15, 82. [Google Scholar] [CrossRef] [PubMed] [Green Version]
  9. Du, X.-L.; Edelstein, D.; Rossetti, L.; Fantus, I.G.; Goldberg, H.; Ziyadeh, F.; Wu, J.; Brownlee, M. Hyperglycemia-induced mitochondrial superoxide overproduction activates the hexosamine pathway and induces plasminogen activator inhibitor-1 expression by increasing Sp1 glycosylation. Proc. Natl. Acad. Sci. USA 2000, 97, 12222–12226. [Google Scholar] [CrossRef] [PubMed] [Green Version]
  10. Gonzalez, R.G.; Barnett, P.; Cheng, H.M.; Chylack, L.T., Jr. Altered phosphate metabolism in the intact rabbit lens under high glucose conditions and its prevention by an aldose reductase inhibitor. Exp. Eye Res. 1984, 39, 553–562. [Google Scholar] [CrossRef]
  11. Gabbay, K.H. The sorbitol pathway and the complications of diabetes. N. Engl. J. Med. 1973, 288, 831–836. [Google Scholar] [CrossRef] [PubMed]
  12. Hamada, Y.; Araki, N.; Koh, N.; Nakamura, J.; Horiuchi, S.; Hotta, N. Rapid formation of advanced glycation end products by intermediate metabolites of glycolytic pathway and polyol pathway. Biochem. Biophys. Res. Commun. 1996, 228, 539–543. [Google Scholar] [CrossRef] [PubMed]
  13. Obrosova, I.G.; Stevens, M.J.; Lang, H.J. Diabetes-induced changes in retinal NAD-redox status: Pharmacological modulation and implications for pathogenesis of diabetic retinopathy. Pharmacology 2001, 62, 172–180. [Google Scholar] [CrossRef] [PubMed]
  14. Hwang, Y.C.; Sato, S.; Tsai, J.Y.; Yan, S.; Bakr, S.; Zhang, H.; Oates, P.J.; Ramasamy, R. Aldose reductase activation is a key component of myocardial response to ischemia. FASEB J. Off. Publ. Fed. Am. Soc. Exp. Biol. 2002, 16, 243–245. [Google Scholar] [CrossRef] [PubMed] [Green Version]
  15. Cameron, N.E.; Cotter, M.A. Impaired contraction and relaxation in aorta from streptozotocin-diabetic rats: Role of polyol pathway. Diabetologia 1992, 35, 1011–1019. [Google Scholar] [CrossRef] [Green Version]
  16. Hotta, N.; Kawamori, R.; Fukuda, M.; Shigeta, Y.; Aldose Reductase Inhibitor–Diabetes Complications Trial Study Group. Long-term clinical effects of epalrestat, an aldose reductase inhibitor, on progression of diabetic neuropathy and other microvascular complications: Multivariate epidemiological analysis based on patient background factors and severity of diabetic neuropathy. Diabet Med. 2012, 29, 1529–1533. [Google Scholar] [CrossRef] [PubMed]
  17. Arauz-Pacheco, C.; Ramirez, L.C.; Pruneda, L.; Sanborn, G.E.; Rosenstock, J.; Raskin, P. The effect of the aldose reductase inhibitor, ponalrestat, on the progression of diabetic retinopathy. J. Diabetes Complicat. 1992, 6, 131–137. [Google Scholar] [CrossRef]
  18. Xu, Y.; Osborne, B.W.; Stanton, R.C. Diabetes causes inhibition of glucose-6-phosphate dehydrogenase via activation of PKA, which contributes to oxidative stress in rat kidney cortex. Am. J. Physiol. Ren. Physiol 2005, 289, F1040–F1047. [Google Scholar] [CrossRef] [Green Version]
  19. Stincone, A.; Prigione, A.; Cramer, T.; Wamelink, M.M.; Campbell, K.; Cheung, E.; Olin-Sandoval, V.; Gruning, N.M.; Kruger, A.; Tauqeer Alam, M.; et al. The return of metabolism: Biochemistry and physiology of the pentose phosphate pathway. Biol. Rev. Camb. Philos. Soc. 2015, 90, 927–963. [Google Scholar] [CrossRef] [Green Version]
  20. Knapp, M.; Tu, X.; Wu, R. Vascular endothelial dysfunction, a major mediator in diabetic cardiomyopathy. Acta Pharm. Sin. 2019, 40, 1–8. [Google Scholar] [CrossRef]
  21. Kuehne, A.; Emmert, H.; Soehle, J.; Winnefeld, M.; Fischer, F.; Wenck, H.; Gallinat, S.; Terstegen, L.; Lucius, R.; Hildebrand, J.; et al. Acute Activation of Oxidative Pentose Phosphate Pathway as First-Line Response to Oxidative Stress in Human Skin Cells. Mol. Cell 2015, 59, 359–371. [Google Scholar] [CrossRef] [PubMed] [Green Version]
  22. Ge, T.; Yang, J.; Zhou, S.; Wang, Y.; Li, Y.; Tong, X. The Role of the Pentose Phosphate Pathway in Diabetes and Cancer. Front. Endocrinol. 2020, 11, 365. [Google Scholar] [CrossRef]
  23. Clark, R.J.; McDonough, P.M.; Swanson, E.; Trost, S.U.; Suzuki, M.; Fukuda, M.; Dillmann, W.H. Diabetes and the accompanying hyperglycemia impairs cardiomyocyte calcium cycling through increased nuclear O-GlcNAcylation. J. Biol. Chem. 2003, 278, 44230–44237. [Google Scholar] [CrossRef] [Green Version]
  24. Masaki, N.; Feng, B.; Breton-Romero, R.; Inagaki, E.; Weisbrod, R.M.; Fetterman, J.L.; Hamburg, N.M. O-GlcNAcylation Mediates Glucose-Induced Alterations in Endothelial Cell Phenotype in Human Diabetes Mellitus. J. Am. Heart Assoc. 2020, 9, e014046. [Google Scholar] [CrossRef]
  25. Ngoh, G.A.; Facundo, H.T.; Zafir, A.; Jones, S.P. O-GlcNAc signaling in the cardiovascular system. Circ. Res. 2010, 107, 171–185. [Google Scholar] [CrossRef] [PubMed] [Green Version]
  26. Banerjee, P.S.; Lagerlöf, O.; Hart, G.W. Roles of O-GlcNAc in chronic diseases of aging. Mol. Asp. Med. 2016, 51, 1–15. [Google Scholar] [CrossRef] [PubMed]
  27. Marsh, S.A.; Collins, H.E.; Chatham, J.C. Protein O-GlcNAcylation and cardiovascular (patho)physiology. J. Biol. Chem. 2014, 289, 34449–34456. [Google Scholar] [CrossRef] [Green Version]
  28. Du, X.L.; Edelstein, D.; Dimmeler, S.; Ju, Q.D.; Sui, C.; Brownlee, M. Hyperglycemia inhibits endothelial nitric oxide synthase activity by posttranslational modification at the Akt site. J. Clin. Investig. 2001, 108, 1341–1348. [Google Scholar] [CrossRef]
  29. Hotta, N.; Toyota, T.; Matsuoka, K.; Shigeta, Y.; Kikkawa, R.; Kaneko, T.; Takahashi, A.; Sugimura, K.; Koike, Y.; Ishii, J.; et al. Clinical efficacy of fidarestat, a novel aldose reductase inhibitor, for diabetic peripheral neuropathy: A 52-week multicenter placebo-controlled double-blind parallel group study. Diabetes Care 2001, 24, 1776–1782. [Google Scholar] [CrossRef] [Green Version]
  30. Liu, D.; Dillon, J.S. Dehydroepiandrosterone stimulates nitric oxide release in vascular endothelial cells: Evidence for a cell surface receptor. Steroids 2004, 69, 279–289. [Google Scholar] [CrossRef]
  31. McNelis, J.C.; Manolopoulos, K.N.; Gathercole, L.L.; Bujalska, I.J.; Stewart, P.M.; Tomlinson, J.W.; Arlt, W. Dehydroepiandrosterone exerts antiglucocorticoid action on human preadipocyte proliferation, differentiation, and glucose uptake. Am. J. Physiol. Endocrinol. Metab. 2013, 305, E1134–E1144. [Google Scholar] [CrossRef] [Green Version]
  32. Rajapakse, A.G.; Ming, X.F.; Carvas, J.M.; Yang, Z. The hexosamine biosynthesis inhibitor azaserine prevents endothelial inflammation and dysfunction under hyperglycemic condition through antioxidant effects. Am. J. Physiol. Heart Circ. Physiol. 2009, 296, H815–H822. [Google Scholar] [CrossRef] [Green Version]
  33. Chouchani, E.T.; Pell, V.R.; Gaude, E.; Aksentijevic, D.; Sundier, S.Y.; Robb, E.L.; Logan, A.; Nadtochiy, S.M.; Ord, E.N.J.; Smith, A.C.; et al. Ischaemic accumulation of succinate controls reperfusion injury through mitochondrial ROS. Nature 2014, 515, 431–435. [Google Scholar] [CrossRef] [PubMed] [Green Version]
  34. Zhou, X.; Paredes, J.A.; Krishnan, S.; Curbo, S.; Karlsson, A. The mitochondrial carrier SLC25A10 regulates cancer cell growth. Oncotarget 2015, 6, 9271–9283. [Google Scholar] [CrossRef] [PubMed] [Green Version]
  35. Tretter, L.; Patocs, A.; Chinopoulos, C. Succinate, an intermediate in metabolism, signal transduction, ROS, hypoxia, and tumorigenesis. Biochim. Biophys. Acta 2016, 1857, 1086–1101. [Google Scholar] [CrossRef] [PubMed]
  36. Laukka, T.; Mariani, C.J.; Ihantola, T.; Cao, J.Z.; Hokkanen, J.; Kaelin, W.G., Jr.; Godley, L.A.; Koivunen, P. Fumarate and Succinate Regulate Expression of Hypoxia-inducible Genes via TET Enzymes. J. Biol. Chem. 2016, 291, 4256–4265. [Google Scholar] [CrossRef] [Green Version]
  37. Salminen, A.; Kauppinen, A.; Kaarniranta, K. 2-Oxoglutarate-dependent dioxygenases are sensors of energy metabolism, oxygen availability, and iron homeostasis: Potential role in the regulation of aging process. Cell Mol. Life Sci. 2015, 72, 3897–3914. [Google Scholar] [CrossRef] [PubMed]
  38. Hou, E.; Sun, N.; Zhang, F.; Zhao, C.; Usa, K.; Liang, M.; Tian, Z. Malate and Aspartate Increase L-Arginine and Nitric Oxide and Attenuate Hypertension. Cell Rep. 2017, 19, 1631–1639. [Google Scholar] [CrossRef] [PubMed] [Green Version]
  39. Chen, F.; Lucas, R.; Fulton, D. The subcellular compartmentalization of arginine metabolizing enzymes and their role in endothelial dysfunction. Front. Immunol. 2013, 4, 184. [Google Scholar] [CrossRef] [Green Version]
  40. Kim, B.; Li, J.; Jang, C.; Arany, Z. Glutamine fuels proliferation but not migration of endothelial cells. EMBO J. 2017, 36, 2321. [Google Scholar] [CrossRef]
  41. Kitada, M.; Ogura, Y.; Koya, D. The protective role of Sirt1 in vascular tissue: Its relationship to vascular aging and atherosclerosis. Aging (Albany NY) 2016, 8, 2290–2307. [Google Scholar] [CrossRef] [PubMed] [Green Version]
  42. German, N.J.; Haigis, M.C. Sirtuins and the Metabolic Hurdles in Cancer. Curr. Biol. 2015, 25, R569–R583. [Google Scholar] [CrossRef] [PubMed] [Green Version]
  43. Corbet, C.; Draoui, N.; Polet, F.; Pinto, A.; Drozak, X.; Riant, O.; Feron, O. The SIRT1/HIF2alpha axis drives reductive glutamine metabolism under chronic acidosis and alters tumor response to therapy. Cancer Res. 2014, 74, 5507–5519. [Google Scholar] [CrossRef] [Green Version]
  44. Pal, P.B.; Sonowal, H.; Shukla, K.; Srivastava, S.K.; Ramana, K.V. Aldose reductase regulates hyperglycemia-induced HUVEC death via SIRT1/AMPK-alpha1/mTOR pathway. J. Mol. Endocrinol. 2019, 63, 11–25. [Google Scholar] [CrossRef] [PubMed]
  45. Bai, P.; Canto, C.; Oudart, H.; Brunyanszki, A.; Cen, Y.; Thomas, C.; Yamamoto, H.; Huber, A.; Kiss, B.; Houtkooper, R.H.; et al. PARP-1 inhibition increases mitochondrial metabolism through SIRT1 activation. Cell Metab. 2011, 13, 461–468. [Google Scholar] [CrossRef] [Green Version]
  46. Tang, B.L. Sirt1 and the Mitochondria. Mol Cells 2016, 39, 87–95. [Google Scholar] [CrossRef] [Green Version]
  47. Tammali, R.; Srivastava, S.K.; Ramana, K.V. Targeting aldose reductase for the treatment of cancer. Curr. Cancer Drug Targets 2011, 11, 560–571. [Google Scholar] [CrossRef] [Green Version]
  48. Holmstrom, K.M.; Baird, L.; Zhang, Y.; Hargreaves, I.; Chalasani, A.; Land, J.M.; Stanyer, L.; Yamamoto, M.; Dinkova-Kostova, A.T.; Abramov, A.Y. Nrf2 impacts cellular bioenergetics by controlling substrate availability for mitochondrial respiration. Biol. Open 2013, 2, 761–770. [Google Scholar] [CrossRef] [Green Version]
  49. Mitsuishi, Y.; Taguchi, K.; Kawatani, Y.; Shibata, T.; Nukiwa, T.; Aburatani, H.; Yamamoto, M.; Motohashi, H. Nrf2 redirects glucose and glutamine into anabolic pathways in metabolic reprogramming. Cancer Cell 2012, 22, 66–79. [Google Scholar] [CrossRef] [Green Version]
  50. Chen, L.; Zhang, Z.; Hoshino, A.; Zheng, H.D.; Morley, M.; Arany, Z.; Rabinowitz, J.D. NADPH production by the oxidative pentose-phosphate pathway supports folate metabolism. Nat. Metab. 2019, 1, 404–415. [Google Scholar] [CrossRef]
  51. Yoshida, A.; Lin, M. Regulation of glucose-6-phosphate dehydrogenase activity in red blood cells from hemolytic and nonhemolytic variant subjects. Blood 1973, 41, 877–891. [Google Scholar] [CrossRef]
  52. Vandekeere, S.; Dubois, C.; Kalucka, J.; Sullivan, M.R.; Garcia-Caballero, M.; Goveia, J.; Chen, R.; Diehl, F.F.; Bar-Lev, L.; Souffreau, J.; et al. Serine Synthesis via PHGDH Is Essential for Heme Production in Endothelial Cells. Cell Metab. 2018, 28, 573–587.e513. [Google Scholar] [CrossRef] [Green Version]
  53. Reid, M.A.; Allen, A.E.; Liu, S.; Liberti, M.V.; Liu, P.; Liu, X.; Dai, Z.; Gao, X.; Wang, Q.; Liu, Y.; et al. Serine synthesis through PHGDH coordinates nucleotide levels by maintaining central carbon metabolism. Nat. Commun. 2018, 9, 5442. [Google Scholar] [CrossRef]
  54. Jimenez, P.T.; Frolova, A.I.; Chi, M.M.; Grindler, N.M.; Willcockson, A.R.; Reynolds, K.A.; Zhao, Q.; Moley, K.H. DHEA-mediated inhibition of the pentose phosphate pathway alters oocyte lipid metabolism in mice. Endocrinology 2013, 154, 4835–4844. [Google Scholar] [CrossRef] [Green Version]
  55. McKay, T.B.; Hjortdal, J.; Sejersen, H.; Karamichos, D. Differential Effects of Hormones on Cellular Metabolism in Keratoconus In Vitro. Sci. Rep. 2017, 7, 42896. [Google Scholar] [CrossRef]
  56. Verdegem, D.; Moens, S.; Stapor, P.; Carmeliet, P. Endothelial cell metabolism: Parallels and divergences with cancer cell metabolism. Cancer Metab. 2014, 2, 19. [Google Scholar] [CrossRef] [Green Version]
  57. Wu, D.; Huang, R.T.; Hamanaka, R.B.; Krause, M.; Oh, M.J.; Kuo, C.H.; Nigdelioglu, R.; Meliton, A.Y.; Witt, L.; Dai, G.; et al. HIF-1alpha is required for disturbed flow-induced metabolic reprogramming in human and porcine vascular endothelium. eLife 2017, 6. [Google Scholar] [CrossRef]
  58. Tsai, J.H.; Schulte, M.; O’Neill, K.; Chi, M.M.; Frolova, A.I.; Moley, K.H. Glucosamine inhibits decidualization of human endometrial stromal cells and decreases litter sizes in mice. Biol. Reprod. 2013, 89, 16. [Google Scholar] [CrossRef] [PubMed]
  59. Ghergurovich, J.M.; Garcia-Canaveras, J.C.; Wang, J.; Schmidt, E.; Zhang, Z.; TeSlaa, T.; Patel, H.; Chen, L.; Britt, E.C.; Piqueras-Nebot, M.; et al. A small molecule G6PD inhibitor reveals immune dependence on pentose phosphate pathway. Nat. Chem. Biol. 2020, 16, 731–739. [Google Scholar] [CrossRef]
  60. Luengo, A.; Gui, D.Y.; Vander Heiden, M.G. Targeting Metabolism for Cancer Therapy. Cell Chem. Biol. 2017, 24, 1161–1180. [Google Scholar] [CrossRef] [PubMed] [Green Version]
  61. Hadj, A.; Pepe, S.; Marasco, S.; Rosenfeldt, F. The principles of metabolic therapy for heart disease. Heart Lung Circ. 2003, 12 (Suppl. 2), S55–S62. [Google Scholar] [CrossRef]
  62. Jang, C.; Hui, S.; Lu, W.; Cowan, A.J.; Morscher, R.J.; Lee, G.; Liu, W.; Tesz, G.J.; Birnbaum, M.J.; Rabinowitz, J.D. The Small Intestine Converts Dietary Fructose into Glucose and Organic Acids. Cell Metab. 2018, 27, 351–361.e353. [Google Scholar] [CrossRef] [PubMed] [Green Version]
  63. Su, X.; Lu, W.; Rabinowitz, J.D. Metabolite Spectral Accuracy on Orbitraps. Anal. Chem. 2017, 89, 5940–5948. [Google Scholar] [CrossRef]
  64. Antoniewicz, M.R. A guide to (13)C metabolic flux analysis for the cancer biologist. Exp. Mol. Med. 2018, 50, 19. [Google Scholar] [CrossRef] [PubMed] [Green Version]
  65. Buescher, J.M.; Antoniewicz, M.R.; Boros, L.G.; Burgess, S.C.; Brunengraber, H.; Clish, C.B.; DeBerardinis, R.J.; Feron, O.; Frezza, C.; Ghesquiere, B.; et al. A roadmap for interpreting (13)C metabolite labeling patterns from cells. Curr. Opin. Biotechnol. 2015, 34, 189–201. [Google Scholar] [CrossRef]
  66. Caspi, R.; Billington, R.; Keseler, I.M.; Kothari, A.; Krummenacker, M.; Midford, P.E.; Ong, W.K.; Paley, S.; Subhraveti, P.; Karp, P.D. The MetaCyc database of metabolic pathways and enzymes-a 2019 update. Nucleic Acids Res. 2020, 48, D445–D453. [Google Scholar] [CrossRef] [PubMed] [Green Version]
  67. Noronha, A.; Modamio, J.; Jarosz, Y.; Guerard, E.; Sompairac, N.; Preciat, G.; Danielsdottir, A.D.; Krecke, M.; Merten, D.; Haraldsdottir, H.S.; et al. The Virtual Metabolic Human database: Integrating human and gut microbiome metabolism with nutrition and disease. Nucleic Acids Res. 2019, 47, D614–D624. [Google Scholar] [CrossRef] [PubMed]
  68. Zhang, A.; Sun, H.; Han, Y.; Yuan, Y.; Wang, P.; Song, G.; Yuan, X.; Zhang, M.; Xie, N.; Wang, X. Exploratory urinary metabolic biomarkers and pathways using UPLC-Q-TOF-HDMS coupled with pattern recognition approach. Analyst 2012, 137, 4200–4208. [Google Scholar] [CrossRef]
  69. Young, J.D. INCA: A computational platform for isotopically non-stationary metabolic flux analysis. Bioinformatics 2014, 30, 1333–1335. [Google Scholar] [CrossRef] [Green Version]
  70. Pang, Z.; Chong, J.; Li, S.; Xia, J. MetaboAnalystR 3.0: Toward an Optimized Workflow for Global Metabolomics. Metabolites 2020, 10, 186. [Google Scholar] [CrossRef]
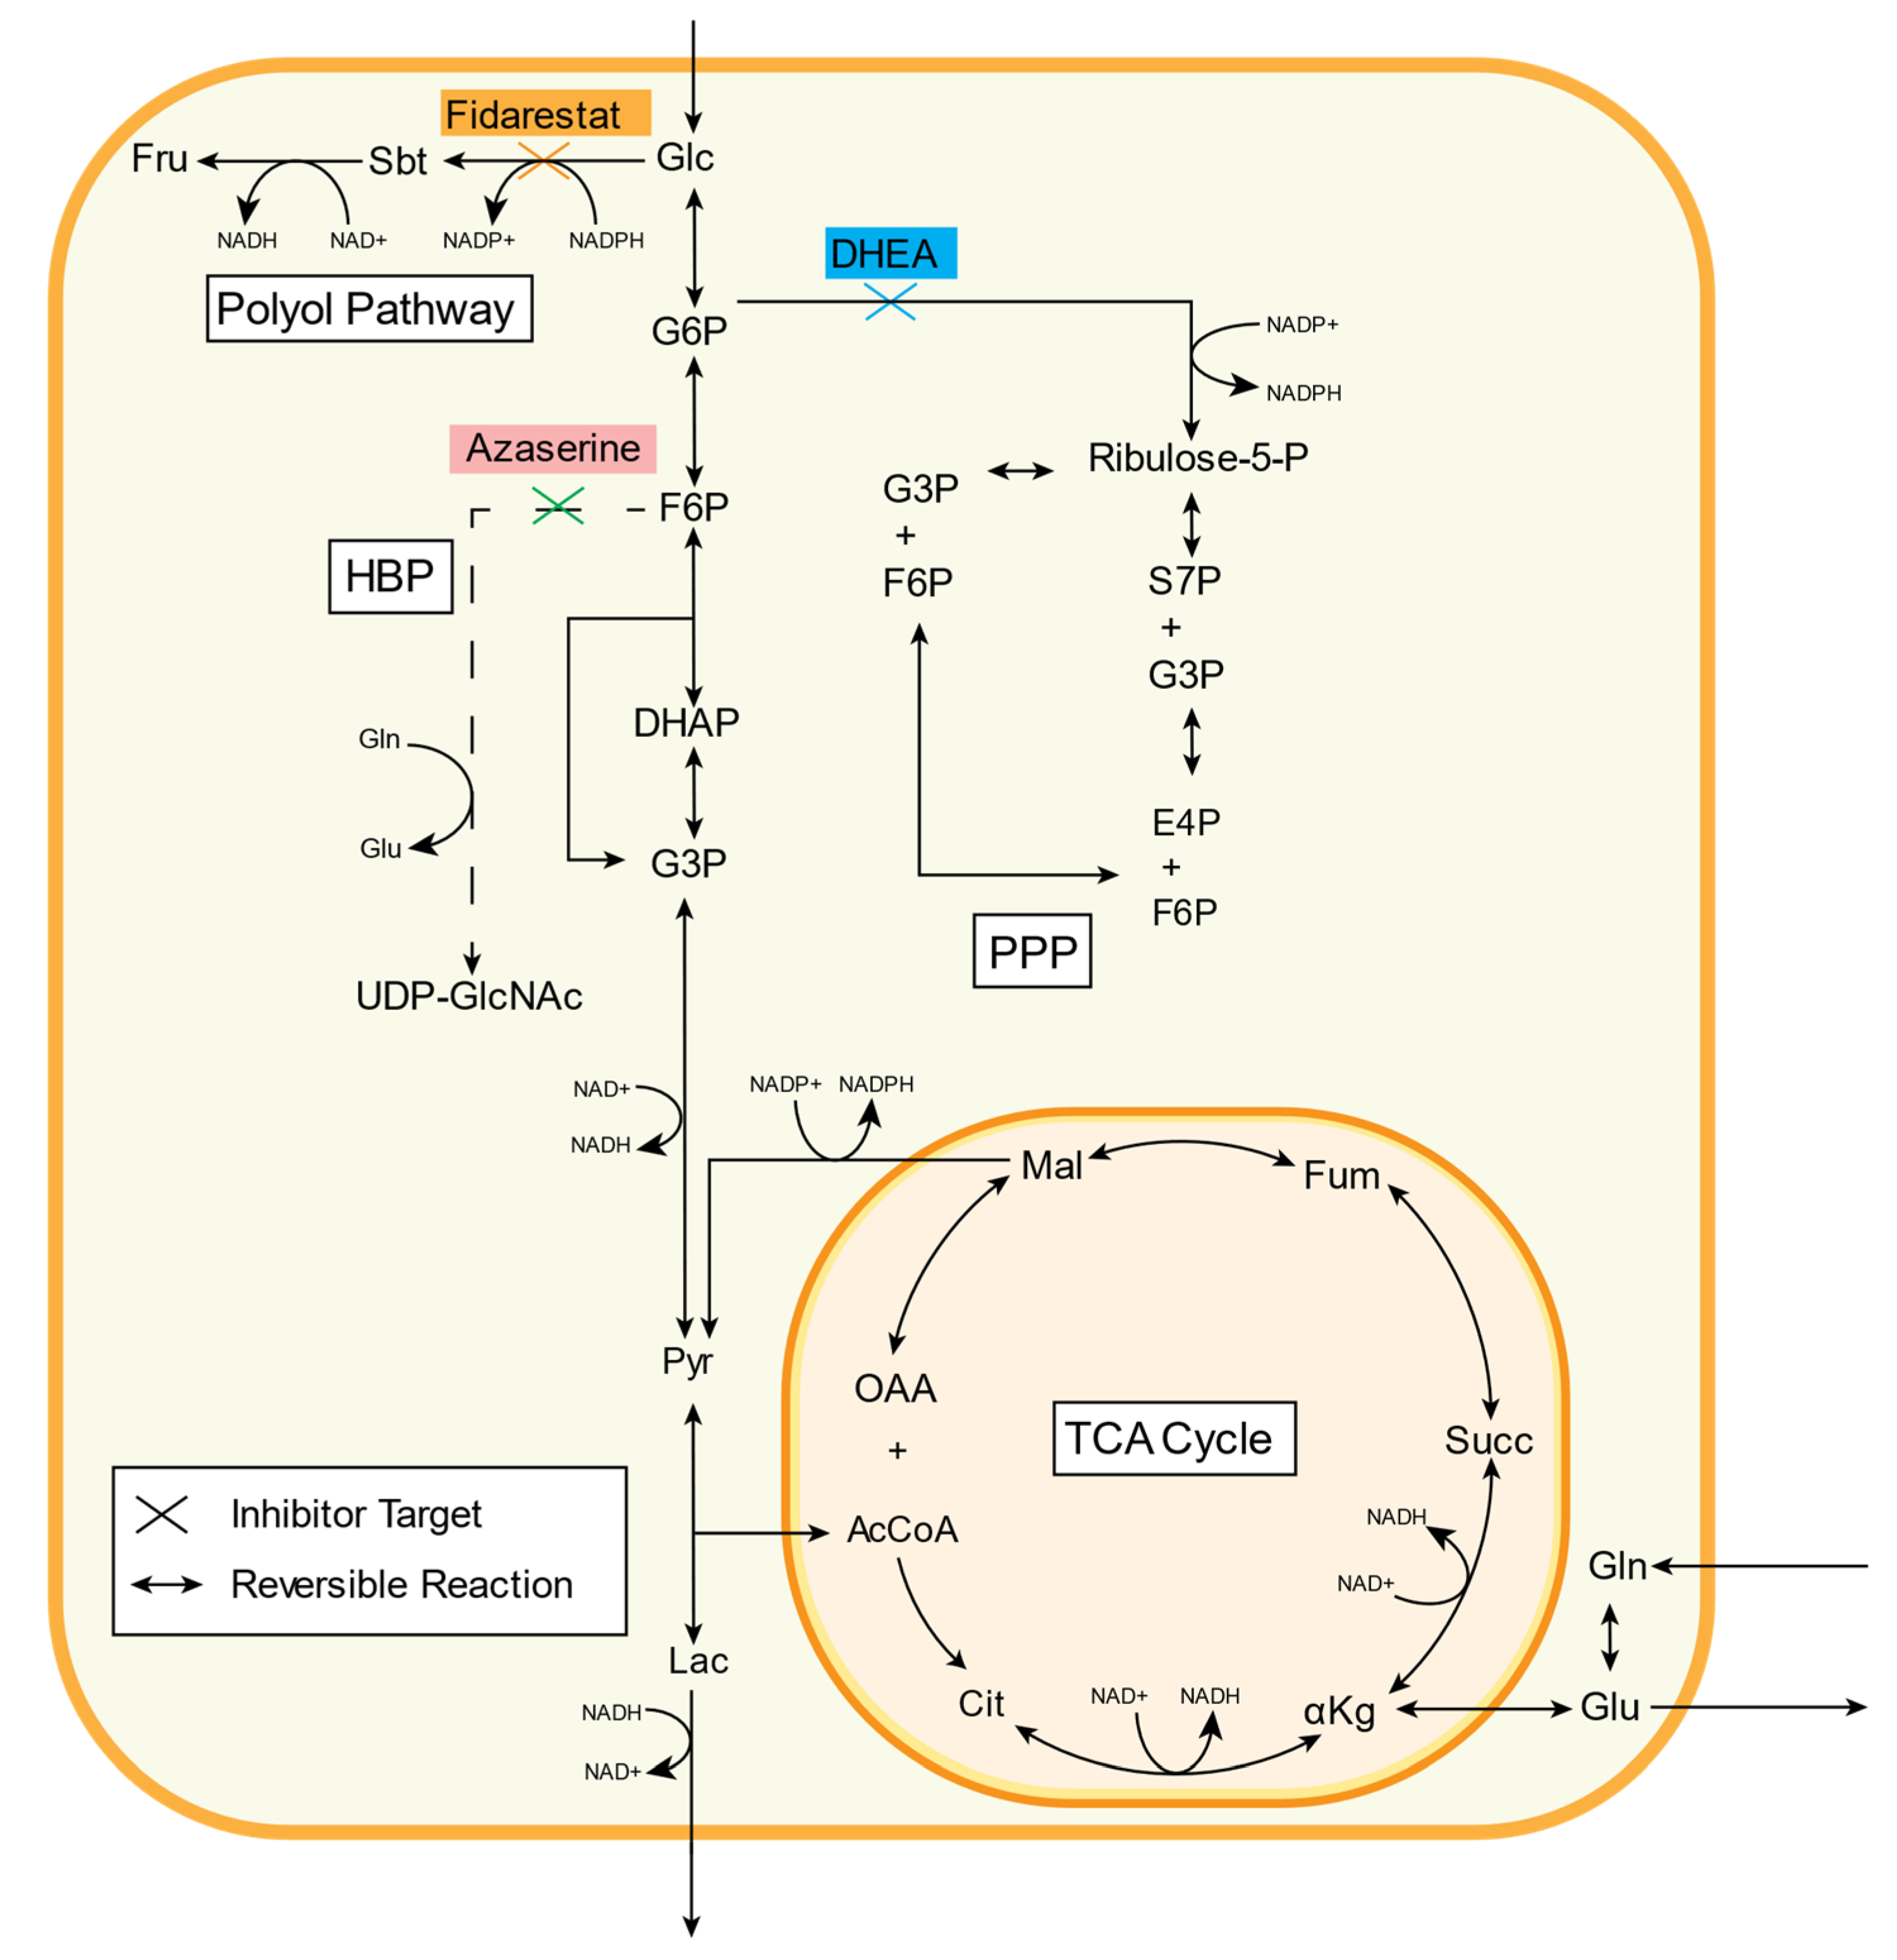
Figure 1. Three inhibitors (fidarestat, dehydroepiandrosterone (DHEA), and azaserine) were used to decrease glucose flux down glycolytic side branch pathways (polyol, PPP, and HBP, respectively). Fidarestat inhibits aldose reductase, an enzyme that catalyzes the first rate-limiting step of the polyol pathway and reduces glucose to sorbitol. DHEA inhibits glucose-6-phosphate dehydrogenase (G6PD), an enzyme involved in converting glucose-6P into 6P-glucolactone in the PPP. Azaserine inhibits the rate-limiting enzyme GFAT in the HBP, a pathway responsible for producing UDP-GlcNAc. See Table 1 for metabolite abbreviations.
Metabolites 11 00226 g001
Figure 2. A simplified metabolic flux map depicting net metabolic fluxes in untreated HUVECs. All numbers are given in nmol/cells/hr. Carbon sources in the final model are indicated in light blue boxes. To simplify PPP pathway visualization, only the unique metabolites formed in each reaction are depicted along with the net PPP-based production of F6P and G3P. Full information on reaction schemes, atom transition specifications, and fluxes can be found in Supplemental File S1.
Metabolites 11 00226 g002
Figure 3. Fidarestat (aldose reductase inhibitor), DHEA (G6PD inhibitor), and azaserine (GFAT inhibitor) only changed external fluxes for glutamine consumption; however, fidarestat and DHEA-treated cells clustered separately from untreated cells by PLS-DA, with amino acids and TCA metabolites explaining most of the differences. (a) glucose consumption, (b) lactate secretion, (c) glutamine consumption, and (d) glutamate secretion all measured by YSI bioanalyzer after 24 h of inhibitor treatment. (e) PLS-DA clustering of total enrichment data. (f) VIP scores plot showing metabolites that significantly contributed to PLS-DA class discrimination. Results in (ad) are mean +/− s.d. with n = 3 biological replicates. Results in e and f are n = 6 biological replicates. Statistical significance was determined with one-way ANOVA followed by Dunnett’s multiple comparison test. * p < 0.05; ** p < 0.01
Metabolites 11 00226 g003
Figure 4. Fidarestat (aldose reductase inhibitor) decreased the 13C enrichments of HUVEC glycolytic and TCA metabolites, as well as amino acids, nucleotide precursors, and UDP-glucose. (a) Heatmap comparing 13C metabolite enrichment of untreated HUVECs and fidarestat-treated HUVECs. 13C enrichment of (b) glycolytic metabolites, (c) TCA metabolites, (d) amino acids, (e) AMP and UMP, and (f) UDP-glucose. Statistical significance for (bf) determined through Welch’s unequal variances t-test; * p < 0.05; ** p < 0.01; *** p < 0.001; **** p < 0.0001. n = 6 biological replicates.
Metabolites 11 00226 g004
Figure 5. 13C MFA estimated decreased non-oxidative PPP flux with increased TCA flux in fidarestat (aldose reductase inhibitor) treated cells, with the malate shuttle exporting malate from mitochondria to cytoplasm.
Metabolites 11 00226 g005
Figure 6. DHEA (G6PD inhibitor) decreased the 13C enrichments of HUVEC glycolytic and TCA metabolites, as well as amino acids, R5P, and nucleotide precursors UMP and AMP. (a) Heatmap comparing 13C metabolite enrichment of untreated HUVECs and DHEA-treated HUVECs. 13C enrichment of (b) glycolytic metabolites, (c) TCA metabolites, (d) amino acids, (e) R5P, and (f) UMP, AMP, and UDP-glucose. Statistical significance for (bf) determined through Welch’s unequal variances t-test; * p < 0.05; ** p < 0.01; *** p < 0.001, **** p < 0.0001. n = 6 biological replicates.
Metabolites 11 00226 g006
Figure 7. 13C MFA estimated decreased non-oxidative PPP flux with increased TCA flux in DHEA (G6PD inhibitor) treated cells, with the malate shuttle importing malate from cytoplasm to mitochondria.
Metabolites 11 00226 g007
Figure 8. Azaserine (GFAT inhibitor) decreased the 13C enrichments of HUVEC glycolytic metabolites and had varied effects on TCA metabolites, amino acids, and UDP-GlcNAc. (a) Heatmap comparing 13C metabolite enrichment of untreated HUVECs and azaserine-treated HUVECs. 13C enrichment of (b) glycolytic metabolites, (c) TCA metabolites, (d) amino acids, and (e) UDP-GlcNAc. Statistical significance for (bf) determined through Welch’s unequal variances t-test; * p < 0.05; ** p < 0.01; *** p < 0.001. n = 6 biological replicates.
Metabolites 11 00226 g008
Figure 9. 13C MFA estimated increased non-oxidative PPP flux with increased TCA flux in azaserine (GFAT inhibitor) treated cells.
Metabolites 11 00226 g009
Table 1. Metabolite abbreviations.
AbbreviationFull Name
GlcGlucose
SbtSorbitol
FruFructose
G6PGlucose-6-phosphate
R5PRibose 5-phosphate
S7PSedoheptulose
G3PGlyceraldehyde
E4PErythrose 4-phosphate
F6PFructose 6-phosphate
Xu5PXylulose 5-phosphate
UDP-GlcNAcUridine diphosphate-N-acetylglucosamine
FDPFructose 1,6-bisphosphate
DHAPDihydroxyacetone phosphate
PEPPhosphoenolpyruvate
PyrPyruvate
LacLactate
OAAOxaloacetate
AcCoAAcetyl-CoA
CitCitrate
CisCis-Aconitrate
IsoIsocitrate
αKgA-Ketoglutarate
GluGlutamate
GlnGlutamine
SuccSuccinate
FumFumarate
MalMalate
Publisher’s Note: MDPI stays neutral with regard to jurisdictional claims in published maps and institutional affiliations.