
Exercise Training Increases Resting Calf Muscle Oxygen Metabolism in Patients with Peripheral Artery Disease

 , , , and
Abstract
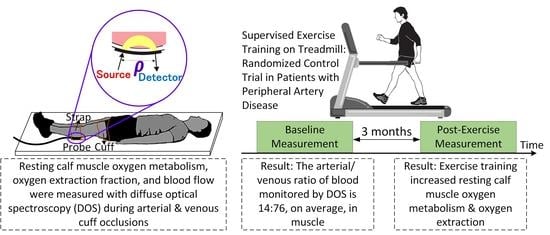
1. Introduction
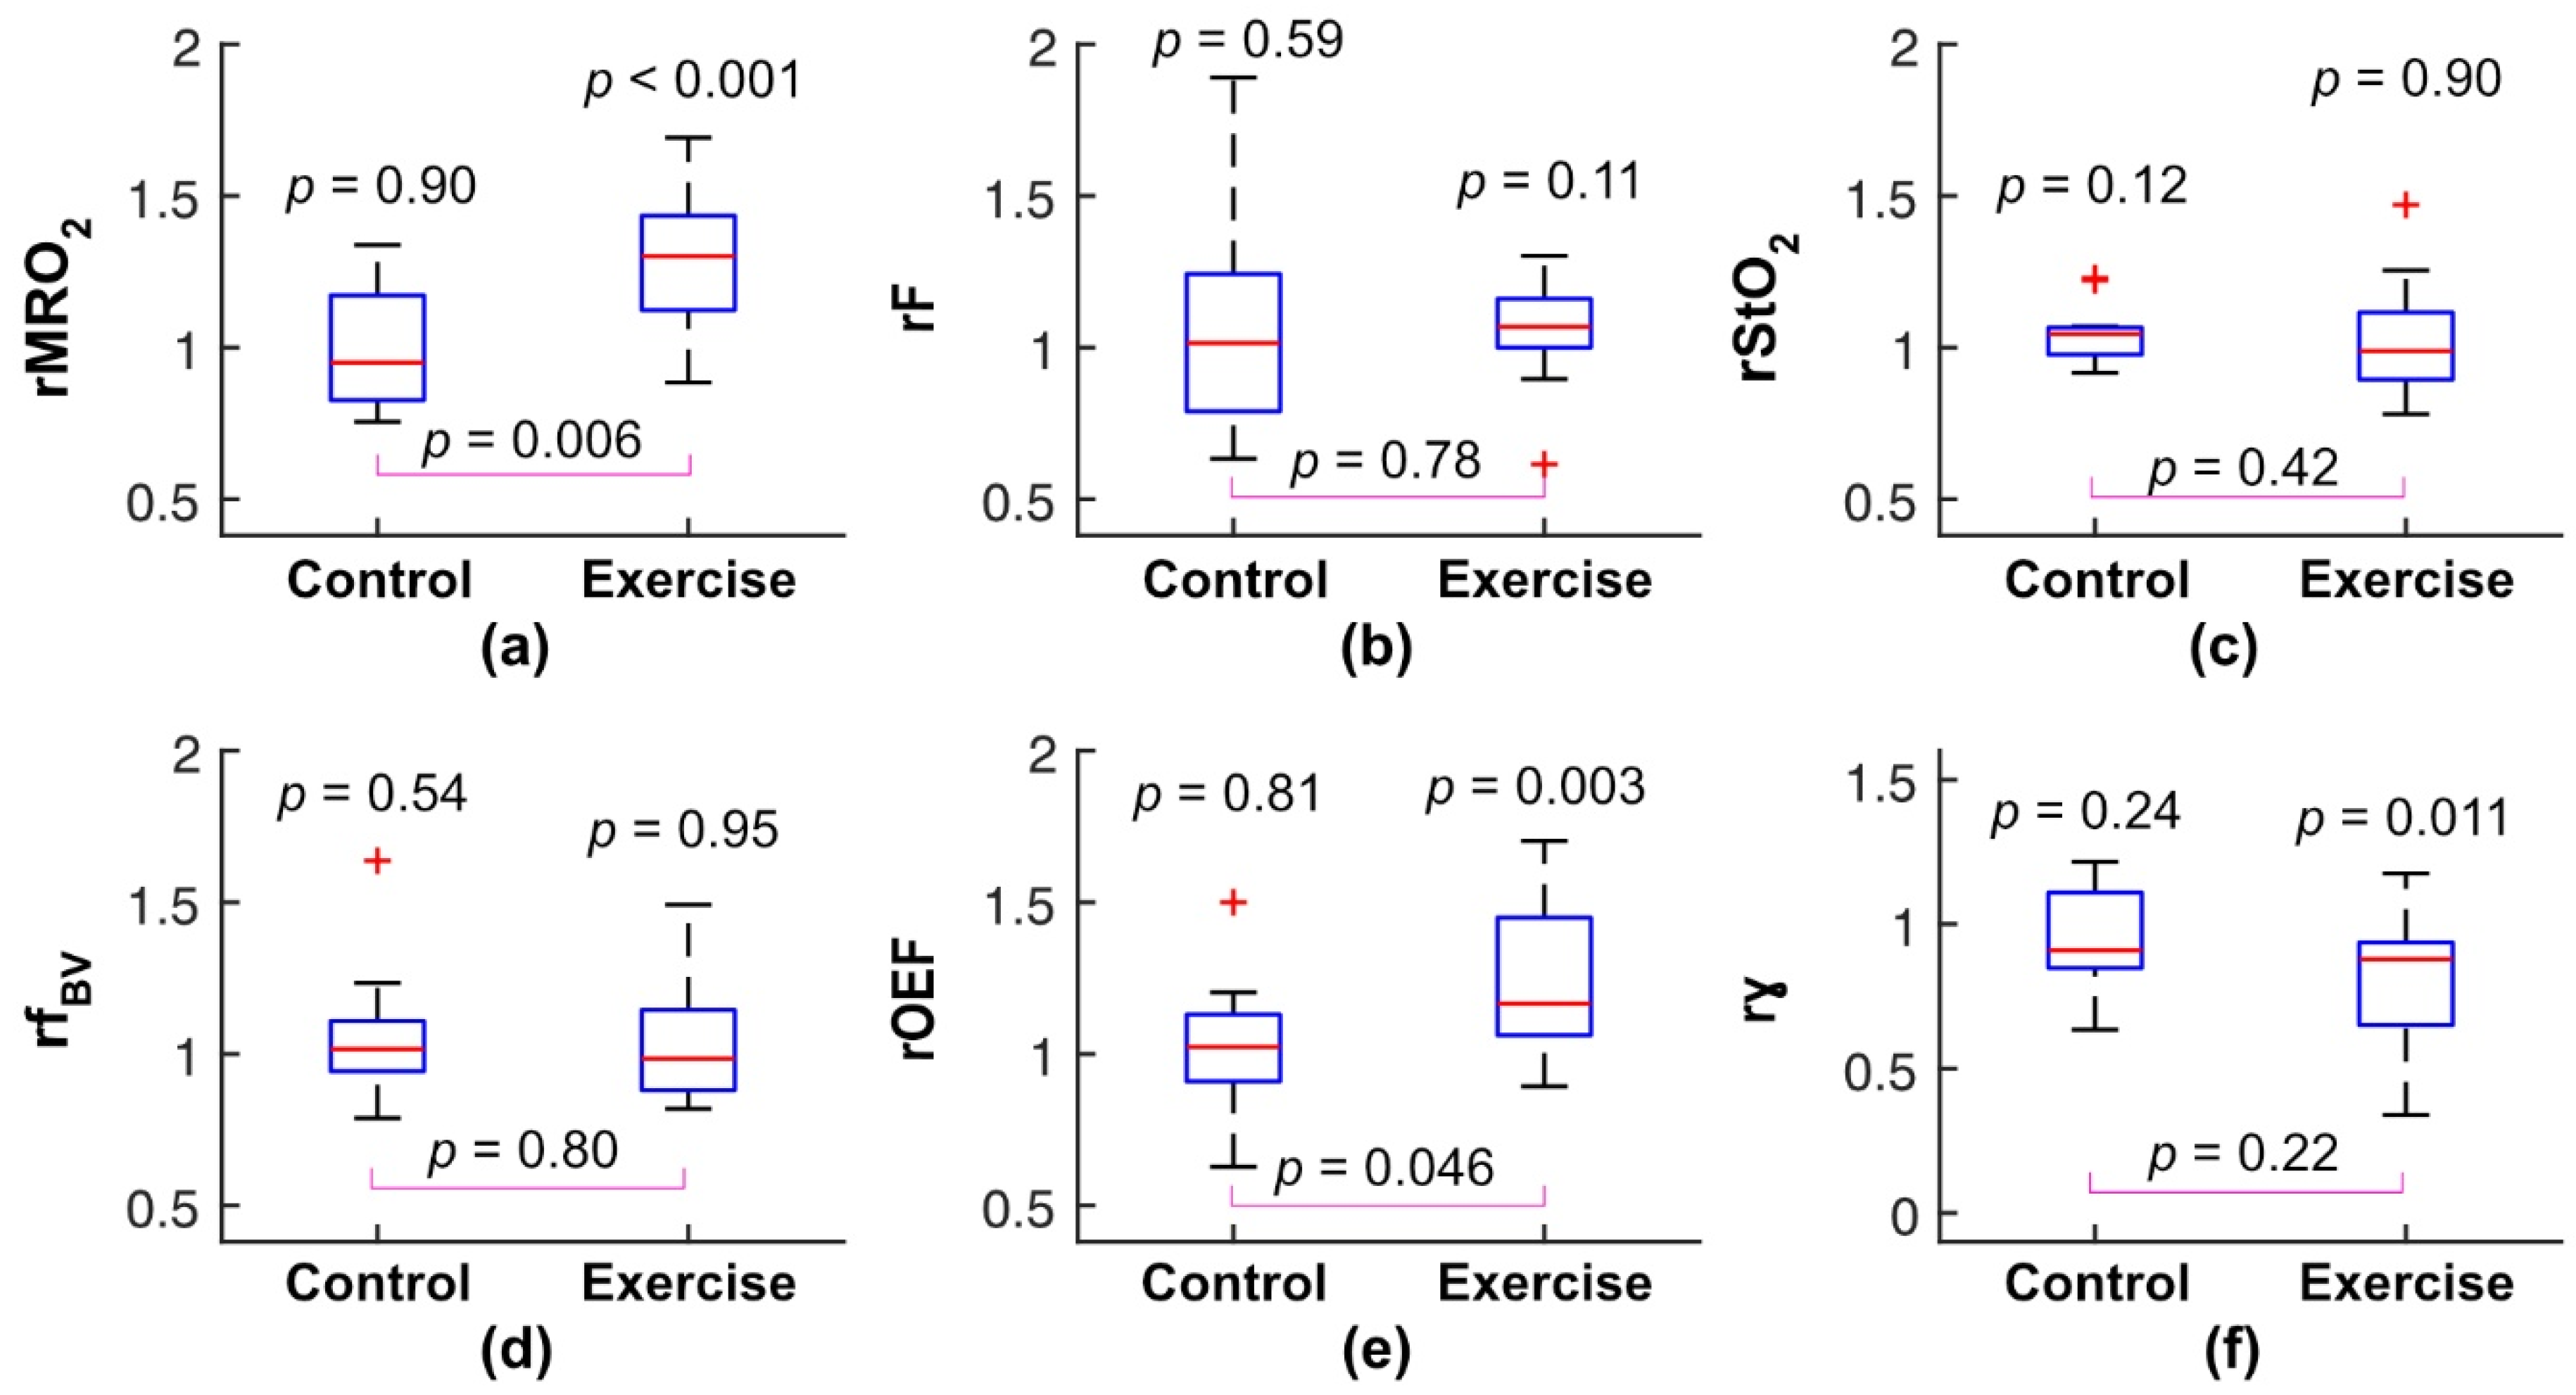
2. Results
3. Discussion
4. Materials and Methods
4.1. Diffuse Optical Measurements
4.2. Statistical Analyses
5. Conclusions
Author Contributions
Funding
Institutional Review Board Statement
Informed Consent Statement
Data Availability Statement
Acknowledgments
Conflicts of Interest
References
- Shu, J.; Santulli, G. Update on peripheral artery disease: Epidemiology and evidence-based facts. Atherosclerosis 2018, 275, 379–381. [Google Scholar] [CrossRef]
- Fowkes, F.G.; Aboyans, V.; Fowkes, F.J.; McDermott, M.M.; Sampson, U.K.; Criqui, M.H. Peripheral artery disease: Epidemiology and global perspectives. Nat. Rev. Cardiol. 2017, 14, 156–170. [Google Scholar] [CrossRef]
- Hamburg, N.M.; Creager, M.A. Pathophysiology of Intermittent Claudication in Peripheral Artery Disease. Circ. J. Off. J. Jpn. Circ. Soc. 2017, 81, 281–289. [Google Scholar] [CrossRef] [PubMed]
- Saratzis, A.; Paraskevopoulos, I.; Patel, S.; Donati, T.; Biasi, L.; Diamantopoulos, A.; Zayed, H.; Katsanos, K. Supervised Exercise Therapy and Revascularization for Intermittent Claudication: Network Meta-Analysis of Randomized Controlled Trials. JACC Cardiovasc. Interv. 2019, 12, 1125–1136. [Google Scholar] [CrossRef] [PubMed]
- Parmenter, B.J.; Dieberg, G.; Smart, N.A. Exercise training for management of peripheral arterial disease: A systematic review and meta-analysis. Sports Med. 2015, 45, 231–244. [Google Scholar] [CrossRef]
- Stewart, K.J.; Hiatt, W.R.; Regensteiner, J.G.; Hirsch, A.T. Exercise training for claudication. N. Engl. J. Med. 2002, 347, 1941–1951. [Google Scholar] [CrossRef] [PubMed]
- Harwood, A.E.; Cayton, T.; Sarvanandan, R.; Lane, R.; Chetter, I. A Review of the Potential Local Mechanisms by Which Exercise Improves Functional Outcomes in Intermittent Claudication. Ann. Vasc. Surg. 2016, 30, 312–320. [Google Scholar] [CrossRef]
- McDermott, M.M.; Dayanidhi, S.; Kosmac, K.; Saini, S.; Slysz, J.; Leeuwenburgh, C.; Hartnell, L.; Sufit, R.; Ferrucci, L. Walking Exercise Therapy Effects on Lower Extremity Skeletal Muscle in Peripheral Artery Disease. Circ. Res. 2021, 128, 1851–1867. [Google Scholar] [CrossRef]
- McDermott, M.M.; Ferrucci, L.; Gonzalez-Freire, M.; Kosmac, K.; Leeuwenburgh, C.; Peterson, C.A.; Saini, S.; Sufit, R. Skeletal Muscle Pathology in Peripheral Artery Disease: A Brief Review. Arterioscler. Thromb. Vasc. Biol. 2020, 40, 2577–2585. [Google Scholar] [CrossRef]
- Cornelis, N.; Chatzinikolaou, P.; Buys, R.; Fourneau, I.; Claes, J.; Cornelissen, V. The Use of Near Infrared Spectroscopy to Evaluate the Effect of Exercise on Peripheral Muscle Oxygenation in Patients with Lower Extremity Artery Disease: A Systematic Review. Eur. J. Vasc. Endovasc. Surg. Off. J. Eur. Soc. Vasc. Surg. 2021, 61, 837–847. [Google Scholar] [CrossRef]
- McDermott, M.M.; Ferrucci, L.; Tian, L.; Guralnik, J.M.; Lloyd-Jones, D.; Kibbe, M.R.; Polonsky, T.S.; Domanchuk, K.; Stein, J.H.; Zhao, L.; et al. Effect of Granulocyte-Macrophage Colony-Stimulating Factor with or without Supervised Exercise on Walking Performance in Patients with Peripheral Artery Disease: The PROPEL Randomized Clinical Trial. JAMA 2017, 318, 2089–2098. [Google Scholar] [CrossRef]
- McDermott, M.M.; Spring, B.; Tian, L.; Treat-Jacobson, D.; Ferrucci, L.; Lloyd-Jones, D.; Zhao, L.; Polonsky, T.; Kibbe, M.R.; Bazzano, L.; et al. Effect of Low-Intensity vs. High-Intensity Home-Based Walking Exercise on Walk Distance in Patients with Peripheral Artery Disease: The LITE Randomized Clinical Trial. JAMA 2021, 325, 1266–1276. [Google Scholar] [CrossRef]
- Van Schaardenburgh, M.; Wohlwend, M.; Rognmo, Ø.; Mattsson, E.J.R. Exercise in claudicants increase or decrease walking ability and the response relates to mitochondrial function. J. Transl. Med. 2017, 15, 1–10. [Google Scholar] [CrossRef]
- Hiatt, W.R.; Regensteiner, J.G.; Hargarten, M.E.; Wolfel, E.E.; Brass, E.P. Benefit of exercise conditioning for patients with peripheral arterial disease. Circulation 1990, 81, 602–609. [Google Scholar] [CrossRef]
- Hiatt, W.R.; Regensteiner, J.G.; Wolfel, E.E.; Carry, M.R.; Brass, E.P. Effect of exercise training on skeletal muscle histology and metabolism in peripheral arterial disease. J. Appl. Physiol. 1996, 81, 780–788. [Google Scholar] [CrossRef] [PubMed]
- Baker, W.B.; Li, Z.; Schenkel, S.S.; Chandra, M.; Busch, D.R.; Englund, E.K.; Schmitz, K.H.; Yodh, A.G.; Floyd, T.F.; Mohler, E.R., 3rd. Effects of exercise training on calf muscle oxygen extraction and blood flow in patients with peripheral artery disease. J. Appl. Physiol. 2017, 123, 1599–1609. [Google Scholar] [CrossRef] [PubMed]
- Gardner, A.W.; Parker, D.E.; Montgomery, P.S.; Blevins, S.M. Step-monitored home exercise improves ambulation, vascular function, and inflammation in symptomatic patients with peripheral artery disease: A randomized controlled trial. J. Am. Heart Assoc. 2014, 3, e001107. [Google Scholar] [CrossRef]
- Collins, E.G.; O’connell, S.; McBurney, C.; Jelinek, C.; Butler, J.; Reda, D.; Gerber, B.S.; Hurt, C.; Grabiner, M. Comparison of walking with poles and traditional walking for peripheral arterial disease rehabilitation. J. Cardiopulm. Rehabil. Prev. 2012, 32, 210–218. [Google Scholar] [CrossRef] [PubMed]
- Tew, G.; Nawaz, S.; Zwierska, I.; Saxton, J.M. Limb-specific and cross-transfer effects of arm-crank exercise training in patients with symptomatic peripheral arterial disease. Clin. Sci. 2009, 117, 405–413. [Google Scholar] [CrossRef]
- Monteiro, D.P.; Ribeiro-Samora, G.A.; Britto, R.R.; Pereira, D.A.G. Effects of modified aerobic training on muscle metabolism in individuals with peripheral arterial disease: A randomized clinical trial. Sci. Rep. 2019, 9, 1–9. [Google Scholar] [CrossRef]
- Culver, J.P.; Durduran, T.; Furuya, D.; Cheung, C.; Greenberg, J.H.; Yodh, A.G. Diffuse optical tomography of cerebral blood flow, oxygenation, and metabolism in rat during focal ischemia. J. Cereb. Blood Flow Metab. Off. J. Int. Soc. Cereb. Blood Flow Metab. 2003, 23, 911–924. [Google Scholar] [CrossRef]
- Ko, T.S.; Mavroudis, C.D.; Baker, W.B.; Morano, V.C.; Mensah-Brown, K.; Boorady, T.W.; Schmidt, A.L.; Lynch, J.M.; Busch, D.R.; Gentile, J.; et al. Non-invasive optical neuromonitoring of the temperature-dependence of cerebral oxygen metabolism during deep hypothermic cardiopulmonary bypass in neonatal swine. J. Cereb. Blood Flow Metab. Off. J. Int. Soc. Cereb. Blood Flow Metab. 2020, 40, 187–203. [Google Scholar] [CrossRef]
- Watzman, H.M.; Kurth, C.D.; Montenegro, L.M.; Rome, J.; Steven, J.M.; Nicolson, S.C. Arterial and venous contributions to near-infrared cerebral oximetry. Anesthesiology 2000, 93, 947–953. [Google Scholar] [CrossRef]
- Yu, G.; Durduran, T.; Lech, G.; Zhou, C.; Chance, B.; Mohler, E.R., 3rd; Yodh, A.G. Time-dependent blood flow and oxygenation in human skeletal muscles measured with noninvasive near-infrared diffuse optical spectroscopies. J. Biomed. Opt. 2005, 10, 024027. [Google Scholar] [CrossRef]
- Gardner, A.W.; Katzel, L.I.; Sorkin, J.D.; Bradham, D.D.; Hochberg, M.C.; Flinn, W.R.; Goldberg, A.P. Exercise rehabilitation improves functional outcomes and peripheral circulation in patients with intermittent claudication: A randomized controlled trial. J. Am. Geriatr. Soc. 2001, 49, 755–762. [Google Scholar] [CrossRef] [PubMed]
- Kety, S.S.; Schmidt, C.F. The nitrous oxide method for the quantitative determination of cerebral blood flow in man: Theory, procedure and normal values. J. Clin. Investig. 1948, 27, 476–483. [Google Scholar] [CrossRef]
- Chance, B.; Dait, M.T.; Zhang, C.; Hamaoka, T.; Hagerman, F. Recovery from exercise-induced desaturation in the quadriceps muscles of elite competitive rowers. Am. J. Physiol. 1992, 262, C766–C775. [Google Scholar] [CrossRef] [PubMed]
- Malagoni, A.M.; Felisatti, M.; Mandini, S.; Mascoli, F.; Manfredini, R.; Basaglia, N.; Zamboni, P.; Manfredini, F. Resting muscle oxygen consumption by near-infrared spectroscopy in peripheral arterial disease: A parameter to be considered in a clinical setting? Angiology 2010, 61, 530–536. [Google Scholar] [CrossRef]
- Cheatle, T.R.; Potter, L.A.; Cope, M.; Delpy, D.T.; Smith, P.D.C.; Scurr, J.H. Near-infrared spectroscopy in peripheral vascular disease. Br. J. Surg. 1991, 78, 405–408. [Google Scholar] [CrossRef] [PubMed]
- Boebinger, S.E.; Brothers, R.O.; Bong, S.; Sanders, B.; McCracken, C.; Ting, L.H.; Buckley, E.M. Diffuse Optical Spectroscopy Assessment of Resting Oxygen Metabolism in the Leg Musculature. Metabolites 2021, 11, 496. [Google Scholar] [CrossRef]
- Henry, B.; Zhao, M.; Shang, Y.; Uhl, T.; Thomas, D.T.; Xenos, E.S.; Saha, S.P.; Yu, G. Hybrid diffuse optical techniques for continuous hemodynamic measurement in gastrocnemius during plantar flexion exercise. J. Biomed. Opt. 2015, 20, 125006. [Google Scholar] [CrossRef]
- Wallace, D.J.; Michener, B.; Choudhury, D.; Levi, M.; Fennelly, P.; Hueber, D.M.; Barbieri, B.B. Results of a 95-subject human clinical trial for the diagnosis of peripheral vascular disease using a near-infrared frequency domain hemoglobin spectrometer. In Proceedings of the Optical Tomography and Spectroscopy of Tissue III, San Jose, CA, USA, 15 July 1999; pp. 300–316. [Google Scholar]
- Mesquita, R.C.; Putt, M.; Chandra, M.; Yu, G.; Xing, X.; Han, S.W.; Lech, G.; Shang, Y.; Durduran, T.; Zhou, C.; et al. Diffuse optical characterization of an exercising patient group with peripheral artery disease. J. Biomed. Opt. 2013, 18, 57007. [Google Scholar] [CrossRef]
- Quaresima, V.; Farzam, P.; Anderson, P.; Farzam, P.Y.; Wiese, D.; Carp, S.A.; Ferrari, M.; Franceschini, M.A. Diffuse correlation spectroscopy and frequency-domain near-infrared spectroscopy for measuring microvascular blood flow in dynamically exercising human muscles. J. Appl. Physiol. 2019, 127, 1328–1337. [Google Scholar] [CrossRef]
- Benni, P.B.; MacLeod, D.; Ikeda, K.; Lin, H.M. A validation method for near-infrared spectroscopy based tissue oximeters for cerebral and somatic tissue oxygen saturation measurements. J. Clin. Monit. Comput. 2018, 32, 269–284. [Google Scholar] [CrossRef]
- Ryan, T.E.; Erickson, M.L.; Brizendine, J.T.; Young, H.J.; McCully, K.K. Noninvasive evaluation of skeletal muscle mitochondrial capacity with near-infrared spectroscopy: Correcting for blood volume changes. J. Appl. Physiol. 2012, 113, 175–183. [Google Scholar] [CrossRef] [PubMed]
- Criqui, M.H.; Denenberg, J.O.; Bird, C.E.; Fronek, A.; Klauber, M.R.; Langer, R.D. The correlation between symptoms and non-invasive test results in patients referred for peripheral arterial disease testing. Vasc. Med. 1996, 1, 65–71. [Google Scholar] [CrossRef]
- Gardner, A.W.; Skinner, J.S.; Cantwell, B.W.; Smith, L.K. Progressive vs single-stage treadmill tests for evaluation of claudication. Med. Sci. Sports Exerc. 1991, 23, 402–408. [Google Scholar] [CrossRef] [PubMed]
- Aboyans, V.; Criqui, M.H.; Abraham, P.; Allison, M.A.; Creager, M.A.; Diehm, C.; Fowkes, F.G.; Hiatt, W.R.; Jönsson, B.; Lacroix, P.; et al. Measurement and interpretation of the ankle-brachial index: A scientific statement from the American Heart Association. Circulation 2012, 126, 2890–2909. [Google Scholar] [CrossRef] [PubMed]
- Bronas, U.G.; Hirsch, A.T.; Murphy, T.; Badenhop, D.; Collins, T.C.; Ehrman, J.K.; Ershow, A.G.; Lewis, B.; Treat-Jacobson, D.J.; Walsh, M.E.; et al. Design of the multicenter standardized supervised exercise training intervention for the claudication: Exercise vs. endoluminal revascularization (CLEVER) study. Vasc. Med. 2009, 14, 313–321. [Google Scholar] [CrossRef]
- Baker, W.B. Optical Cerebral Blood Flow Monitoring of Mice to Men; University of Pennsylvania: Philadelphia, PA, USA, 2015. [Google Scholar]
- Durduran, T.; Choe, R.; Baker, W.B.; Yodh, A.G. Diffuse Optics for Tissue Monitoring and Tomography. Rep. Prog. Phys. 2010, 73, 076701. [Google Scholar] [CrossRef]
- Arridge, S.R.; Cope, M.; Delpy, D.T. The theoretical basis for the determination of optical pathlengths in tissue: Temporal and frequency analysis. Phys. Med. Biol. 1992, 37, 1531–1560. [Google Scholar] [CrossRef]
- Fantini, S.; Hueber, D.; Franceschini, M.A.; Gratton, E.; Rosenfeld, W.; Stubblefield, P.G.; Maulik, D.; Stankovic, M.R. Non-invasive optical monitoring of the newborn piglet brain using continuous-wave and frequency-domain spectroscopy. Phys. Med. Biol. 1999, 44, 1543–1563. [Google Scholar] [CrossRef] [PubMed]
- Boas, D.A.; Franceschini, M.A. Haemoglobin oxygen saturation as a biomarker: The problem and a solution. Philos. Trans. Ser. A Math. Phys. Eng. Sci. 2011, 369, 4407–4424. [Google Scholar] [CrossRef] [PubMed]
- De Blasi, R.A.; Ferrari, M.; Natali, A.; Conti, G.; Mega, A.; Gasparetto, A. Noninvasive measurement of forearm blood flow and oxygen consumption by near-infrared spectroscopy. J. Appl. Physiol. 1994, 76, 1388–1393. [Google Scholar] [CrossRef] [PubMed]
- Casavola, C.; Paunescu, L.A.; Fantini, S.; Gratton, E. Blood flow and oxygen consumption with near-infrared spectroscopy and venous occlusion: Spatial maps and the effect of time and pressure of inflation. J. Biomed. Opt. 2000, 5, 269–276. [Google Scholar] [CrossRef] [PubMed][Green Version]


| Exercise | Control | p Value | |
|---|---|---|---|
| Number of patients | 14 | 14 | |
| Male sex, n (%) | 11 (79) | 6 (43) | 0.12 |
| Ankle Brachial Index | 0.60 (0.44, 0.76) | 0.59 (0.52, 0.72) | 0.93 |
| Peak Walking Time, s | 558 (318, 731) | 350 (254, 470) | 0.26 |
| Age, years | 66 (62, 70) | 65 (60, 69) | 0.63 |
| BMI, kg/m2 | 28.9 (25.8, 29.6) | 26.8 (22.8, 29.2) | 0.22 |
| Race, n (%) | |||
| White | 8 (57) | 5 (36) | 0.45 |
| Black | 5 (36) | 9 (64) | 0.26 |
| Hispanic | 1 (7) | 0 (0) | >0.99 |
| Risk factor history, n (%) | |||
| Diabetes mellitus | 6 (43) | 3 (21) | 0.42 |
| Hypertensive | 12 (86) | 10 (71) | 0.65 |
| Former smoker (quit > 3 mo) | 10 (71) | 10 (71) | >0.99 |
| Former smoker (quit < 3 mo) | 1 (7) | 0 (0) | >0.99 |
| Current smoker | 0 (0) | 3 (21) | 0.22 |
| Medication use, n (%) | |||
| Statin | 10 (71) | 11 (79) | >0.99 |
| Cilostazol | 5 (36) | 2 (14) | 0.38 |
| Thickness of near-surface layer (skin and adipose tissue), mm | 4.4 (3.8, 5.2) | 3.7 (2.9, 4.6) | 0.07 |
| Median (25th %, 75th %) | |
|---|---|
| MRO2, µmol/100 mL/min | 2.74 (2.24, 3.40) |
| F, mL/100 mL/min | 0.77 (0.64, 0.90) |
| OEF, % | 43 (37, 50) |
| StO2, % | 66 (60, 72) |
| THC, µM | 112 (80, 131) |
| C, g/dL | 13.8 (12.5, 14.8) |
| fBV, % | 6.7 (4.7, 7.6) |
| γ | 0.76 (0.61, 0.89) |
| Recovery half-time of Hb, s | 77 (55, 119) |
| µs’ (685 nm), 1/cm | 6.50 (5.78, 7.08) |
| µs’ (785 nm), 1/cm | 5.88 (5.30, 6.68) |
| µs’ (830 nm), 1/cm | 5.31 (5.01, 6.26) |
| L (685 nm), cm | 9.64 (8.99, 11.30) |
| L (785 nm), cm | 9.73 (8.65, 10.56) |
| L (830 nm), cm | 8.96 (7.93, 9.71) |
Publisher’s Note: MDPI stays neutral with regard to jurisdictional claims in published maps and institutional affiliations. |
© 2021 by the authors. Licensee MDPI, Basel, Switzerland. This article is an open access article distributed under the terms and conditions of the Creative Commons Attribution (CC BY) license (https://creativecommons.org/licenses/by/4.0/).
Share and Cite
Li, Z.; Englund, E.K.; Langham, M.C.; Feng, J.; Jia, K.; Floyd, T.F.; Yodh, A.G.; Baker, W.B. Exercise Training Increases Resting Calf Muscle Oxygen Metabolism in Patients with Peripheral Artery Disease. Metabolites 2021, 11, 814. https://doi.org/10.3390/metabo11120814
Li Z, Englund EK, Langham MC, Feng J, Jia K, Floyd TF, Yodh AG, Baker WB. Exercise Training Increases Resting Calf Muscle Oxygen Metabolism in Patients with Peripheral Artery Disease. Metabolites. 2021; 11(12):814. https://doi.org/10.3390/metabo11120814
Chicago/Turabian StyleLi, Zhe, Erin K. Englund, Michael C. Langham, Jinchao Feng, Kebin Jia, Thomas F. Floyd, Arjun G. Yodh, and Wesley B. Baker. 2021. "Exercise Training Increases Resting Calf Muscle Oxygen Metabolism in Patients with Peripheral Artery Disease" Metabolites 11, no. 12: 814. https://doi.org/10.3390/metabo11120814
APA StyleLi, Z., Englund, E. K., Langham, M. C., Feng, J., Jia, K., Floyd, T. F., Yodh, A. G., & Baker, W. B. (2021). Exercise Training Increases Resting Calf Muscle Oxygen Metabolism in Patients with Peripheral Artery Disease. Metabolites, 11(12), 814. https://doi.org/10.3390/metabo11120814