1. Introduction
The field of spatial proteomics has the potential to provide further understanding to fields such as biology, pharmacology, and medicine. Mass spectrometry imaging (MSI) is a technology that in the last couple of decades has been enabling mapping of molecules directly in tissue sections [
1]. One of the major advantages of MSI is its compatibility with histologic annotations [
1]. Because of that, and its ease of integration with the current diagnostic sample preparation processes, MSI has been moving in the direction of clinical applications [
2,
3]. Since its development, this technology has been addressing some unanswered questions from a clinical point of view. However, aiming to translate years of pathology investigation and experience into a more automated approach—based on mass spectrometry data collection, and data interpretation using machine learning algorithms—is a daring feat.
The different tissues in the human body have distinct histology. Despite working together, they present defined cellular and molecular compositions. The unique array of proteins, the specificity of the cell type and its location, accurately define the tissue and the organ behavior. Regarding tumor environment, its composition can also be very heterogeneous, depending on the tumor location and development, there are innumerous variables to be taken into consideration when evaluating the tissue. On top of that, in the regions neighboring tumors, other structures or other tissues can often be found, that can challenge the tissue classification. Namely, different inflammatory cells, necrotic tissue, connective tissue, blood vessels, and adipose tissue are commonly found in the vicinity of the tumors and have very different molecular profiles than the tumor [
4]. That is why tumor diagnosis is a scrupulous process, which entails the identification of tumor entity and subentity, recognition of the tumor origin, analysis of predictive biomarkers, and druggable targets. This process is a responsibility usually undertaken by pathologists, where the tissue is thoroughly analyzed, through a series of staining procedures, followed by exhaustive microscopic analysis [
5]. Cell type, cell density, cellular morphology, tissue origin, tissue integrity, functional state, reactive changes, and neoplastic alterations are some of the information pathologists use for the assessment of the tissue. While conveying all that information to a machine learning approach has been proven for particular diagnostic applications (e.g., detection of prostate cancer in needle core biopsies by Paige Prostate, an FDA-approved artificial intelligence-based software solution (
www.paige.ai, accessed on 28 October 2021)) [
6], it might still be some years away for most applications, or might not even be feasible.
To build reliable predictors for all given tumors and reactive conditions, the input information has to be premeditated. For instance, to distinguish tumor tissue from healthy tissue, we need to teach the model instructing what is tumor and what is healthy tissue by providing accurate information on those tissue regions. However, at this point that is the only information the model has. Thus, it cannot determine the tumor origin or prognosis because it simply does not possess that information to make the decision. On the other hand, if we teach the machine to distinguish between tumor types, we cannot expect the outcome to tell us about the normal tissue. Different models need to be built according to the information we would like to obtain. This applies to all fields of machine learning including image analysis. For instance, Campanella et al. used the same convolutional neural network (Resnet34) for the task of detecting prostate cancer infiltrates in needle core biopsies of the prostate, basal cell carcinoma in skin resection specimens and breast cancer infiltrates in axillary lymph nodes based on histopathological slide images [
6]. Nevertheless, the neural network had to be trained separately for the specific cancer type to generate unique models for the detection of prostate cancer, basal cell carcinoma and breast cancer, respectively. However, even the restriction to the tumor entity might be too imprecise considering tumor subtypes, grading, and also the tumor environment (primary vs. metastasis). This illustrates that an algorithm must be tailored specifically to the task at hand.
Similar to image analysis, MSI, measuring hundreds of spectra per single tumor core, originates large datasets, with information that amounts to the whole proteome, which possibly cannot be fully interpreted. For that reason, the more specific and well thought our hypothesis is, the more likely we are to find answers. To that extent, histopathological annotation, meaning the process of evaluation of detailed images of stained tissue sections by a trained pathologist and marking the regions of interest, is crucial. This reflects the assessment of morphological and architectural features that characterize the tissue and its pathological changes and entails a complex mixture of visual motifs and cellular properties that allow the pathologist to infer about the disease. The accuracy of this process is essential for diagnostic as well as research purposes. That is why histological annotations can help narrow down the obtained answers to more meaningful results. The importance of histological annotations has been previously acknowledged, but its relevance for tissue classification using machine learning algorithms has never been quantified [
7,
8,
9].
To quantitatively compare the classification accuracy with and without histological annotations, we have measured the peptide/protein content of trypsin digested samples of five different patient cohorts using matrix-assisted laser desorption/ ionization time of flight (MALDI-TOF) MSI. The measured cohorts were then used to train three of the most commonly employed classification algorithms (LDA—linear discriminant analysis, RF—random forest, and SVM—support vector machine) before and after histological annotations. These classification algorithms are all based on supervised learning, hence the input information, which is required for building the model, is subsequently used in the decision making in the classification process.
As tumor heterogeneity differs depending on the tissue origin, we have investigated different entities. Renal tumor samples (including clear cell renal cell carcinoma—ccRCC, papillary renal cell carcinoma—pRCC, chromophobe renal cell carcinoma—chRCC, renal oncocytoma—RO, and angiomyolipoma—AML), which present a more uniform tissue composition, colon cancer (CC) which presents a medium tissue complexity, pancreatic ductal adenocarcinoma (PDAC), and cholangiocarcinoma (CCC), which are usually more heterogeneously composed. The models were then employed for the classification of a subset of the data, and accuracy values were compared.
3. Discussion
As MSI is a rapidly evolving technology, it becomes essential to develop fast and reliable methods to further its applications. Using machine learning approaches to analyze the vast data from on-tissue measurements does not only provide quicker answers but also allows for deeper scrutiny of the data. However, the analysis outcome is unequivocally connected to the input data, which should be carefully curated in order to achieve meaningful results. Here we have weighed the effect of histological annotations of the measured tissue in the classification accuracy of different datasets. For that, we have utilized the very same tissue section, which after matrix removal was stained with H&E and scanned for evaluation and annotation by a pathologist.
As tissues have different cellular compositions depending on their origin and function, also tumor tissues can differ in their composition and complexity. For that reason, we have evaluated specimens with different degrees of heterogeneity (tissue heterogeneity is illustrated in more detail in the
Supplementary Materials, in Figures S1–S5). From what we can see from the classification results (
Table 1,
Table 2,
Table 3,
Table 4 and
Table 5), classification accuracies do not show a consistent improvement across all tumor types. Perhaps not surprisingly, tissue heterogeneity also dictates different needs when it comes to tissue annotation. More homogeneous tumor samples, such as kidney tumors (
Figures S1 and S2), only benefit slightly from meticulous histological annotations, with an overall improvement of 0.4% for LDA and RF and approximately 1% for SVM. More heterogeneous tumor samples (such as the PDAC), have a more pronounced benefit from precise annotation of the histological features, with an improvement of classification accuracy of over 20%. Additionally, CCC, with a heterogeneous tissue distribution, shows an impactful improvement on the classification accuracy after detailed histological annotation.
Often datasets have more than one TMA, or different measurements need to be compared, which also introduces inter-measurement variabilities that impact the classification. Considering that, we have also tested the impact of histological annotations on a dataset composed of two mixed TMAs. By attempting to differentiate PDAC and CCC (
Figure S4), we achieved an improvement comparable to the CCC (tumor vs. normal), proving once again the relevance of this step in the data preparation. We have also posed seemingly impossible questions, to challenge the hypothesis and provide deeper insight into the impact of the histological annotations. We compared CC samples with different patient outcomes, to assist in prognosis prediction, which is currently lacking for UICC stage I/II CC patients. However, only 22% of the patients had been diagnosed with stage II colon cancer, making the cohort classes unbalanced. Despite the inequality, also here we see an improvement due to histological annotations for two of the three tested models, indicating that even in most challenging cases, the use of annotated structures still benefits the accuracy of the model. Overall, we can objectively state that annotation of the histological features benefited the datasets included in this study, and therefore should be considered an integral step of data curation with the purpose of building more accurate classification models.
It is also important to stress that all samples were collected from donor blocks, where only tumor enriched regions had been pre-selected for building the TMAs. However, this does not always translate in cores only harboring tumor for two main reasons. One of the reasons can be explained by the way TMAs are constructed. In the first step, areas of interest (e.g., tumor and adjacent normal) are annotated on a stained H&E section from each donor block. These annotations are transferred to the matching area on the donor tissue block, and subsequently, cores are punched out of the donor block and placed into the preformed hole within the recipient block. Cores might not harbor the intended tissue type due to errors during annotation transfer from section to block or TMA construction itself. Another reason lies in the fact that tissue blocks are three-dimensional, and a section only captures one plane in a three-dimensional space. Thus, a TMA section might initially harbor the tissue type of interest, but as sections are cut from the block this might no longer be the case for deeper sections. The second reason is based on the tissue of interest itself. If the tissue of interest is heterogeneous, it will be heterogeneous no matter the size of the investigated area.
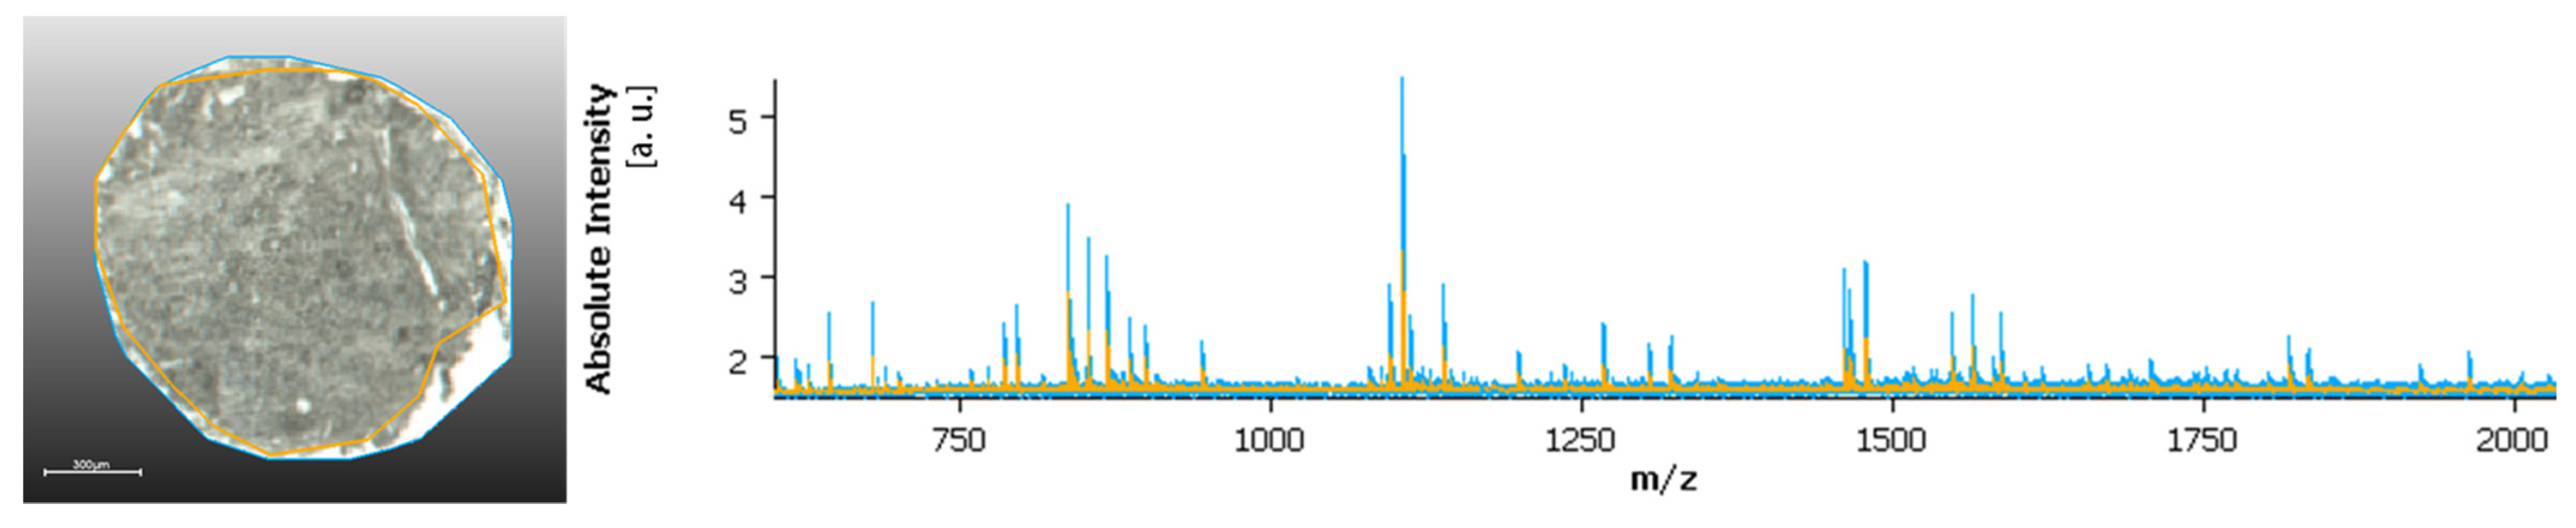
Another relevant note is that areas without tissue or with very low tissue content, which are often included in the measurement regions, in particular at the edge between tissue and the glass slide, can also impact the classification. These areas usually produce higher ion intensity than tissue regions, as shown in
Figure 1, which can result in suppression of lower signals and further challenge the data analysis process. Histological annotation also addresses this issue, removing non-tissue areas from the data analysis, considering only tissue regions, and avoiding border regions, and where the tissue might have poorly adhered to the glass slides (thus, for example, resulting in changes in tissue height). Additionally, sample preparation can alter the shape and size of the samples, and some difficulties might arise when co-registering the measurement regions and the H&E scan. This has higher impact in more heterogeneous tissue, where more detailed annotations are required, and also in larger TMAs. To solve this predicament, software that can accommodate those changes, and provide a good overlay of the measurement regions and the annotated H&Es is required to maximize the accuracy of the analysis process. A perfect overlay is, as we see it, essential for the evaluation of more heterogeneous tissue structures. Additionally, the measurement resolution is of high relevance to the topic especially in relation to more heterogeneous samples. Routine MSI, usually carried at 30–50 µm pixel size, might not provide enough detail to accommodate smaller tissue structures. Especially when considering smaller samples, such as biopsies, where tumor content can be significantly less and therefore, a higher measurement resolution must be considered.
As spatial resolution increases towards single cell level, it will become very time consuming, especially for routine measurements, to carry out manual annotation. In such cases, employing digital pathology, that can facilitate and expedite the annotation of samples, could be the solution for further advancement of the technology.
MSI is setting itself to solve the most challenging conundrums in pathology, there are, however, a few things that the scientific and medical community need to establish before the technology leaps to standard practice. Gathering vast sample pools that include adequate diversity per tumor type/ subtype, collect detailed patient data, treatment and outcome information, and thoroughly annotated specific tumor regions are some of the steps required to achieve highly accurate classification models.
Author Contributions
Conceptualization, J.P.L.G., C.B. and K.S.; methodology, J.P.L.G.; software, J.P.L.G.; validation, J.P.L.G. and K.S.; visualization, J.P.L.G.; formal analysis, J.P.L.G.; investigation, J.P.L.G.; resources, all authors; data curation, all authors; writing—original draft preparation, J.P.L.G.; writing—review and editing, all authors.; supervision, K.S.; project administration, K.S.; funding acquisition, W.W. and K.S. All authors have read and agreed to the published version of the manuscript.
Funding
This research received no external funding.
Institutional Review Board Statement
The study was conducted in accordance with the Declaration of Helsinki. PDAC vs. CCC, CCC tumor vs. normal protocol has been approved by the ethics committee of the Medical University Charité Berlin (application EA1/06/2004). Renal tumors protocol and PDAC primary vs. metastasis has been approved by the review board of ethical committee of the School of Medicine of the Technical University of Munich (Approval 403/17S). CC protocol of was approved by the Institutional Review Board of the University Hospital of Augsburg (Approval 25.09.2018—BKF 2018-18) and performed according to the national rules.
Informed Consent Statement
Patient consent was waived due to the use of archival data of anonymous nature that does not disclose patients’ identity. The patient consent can be waived, as it is contemplated by the Bavarian state law (available only in German), in the Bavarian Hospital Act (BayKrG) section, published on 28 March 2007 (
https://www.gesetze-bayern.de/Content/Document/BayKrG/true, accessed on 28 October 2021), on the article 27 of Data protection,
Section 4.
Data Availability Statement
The data presented in this study are available on request from the corresponding author. The data are not publicly available due to current project restrictions.
Acknowledgments
The authors would like to acknowledge the core facility for Comparative Experimental Pathology (CEP) from the Institute of Pathology of the Technical University of Munich for the assistance in sample preparation. The authors also would like to thank Anne Jacobsen and Rudolf Jung for technical assistance in the sample preparation. The appreciation is also extended to the School of Oncology of the German Cancer Consortium (DKTK) for the support in material acquisition.
Conflicts of Interest
The RapifleX MALDI Tissuetyper TOF mass spectrometer was provided by Bruker Daltonik GmbH as part of a collaboration agreement between Bruker Daltonik GmbH and the Technical University of Munich. A.M.S. served as speaker for Novartis and MSD and is part-time employee of BioNTech SE Mainz. B.M. (Bruno Märkl) has attended Advisory Boards and served as speaker for Roche, BMS, MSD, and Merck. K.U. has attended Advisory Boards for BMS. W.W. has attended Advisory Boards and served as speaker for Roche, MSD, BMS, AstraZeneca, Pfizer, Merck, Lilly, Boehringer, Novartis, Takeda, Bayer, Amgen, Astellas, Eisai, Illumina, Siemens, Agilent, ADC, GSK and Molecular Health. W.W. receives research funding from Roche, MSD, BMS and AstraZeneca. K.S. has attended Advisory Boards and served as speaker for Roche, BMS, MSD and Merck. All other authors declare that no conflict of interests exists.
References
- Schwamborn, K. The Importance of Histology and Pathology in Mass Spectrometry Imaging. In Advances in Cancer Research; Academic Press Inc.: Cambridge, MA, USA, 2017; Volume 134, pp. 1–26. [Google Scholar] [CrossRef]
- Gonçalves, J.P.L.; Bollwein, C.; Weichert, W.; Schwamborn, K. Implementation of Mass Spectrometry Imaging in Pathology: Advances and Challenges. Clin. Lab. Med. 2021, 41, 173–184. [Google Scholar] [CrossRef] [PubMed]
- Arentz, G.; Mittal, P.; Zhang, C.; Ho, Y.-Y.; Briggs, M.; Winderbaum, L.; Hoffmann, M.K.; Hoffmann, P. Applications of Mass Spectrometry Imaging to Cancer. In Advances in Cancer Research; Academic Press Inc.: Cambridge, MA, USA, 2017; Volume 134, pp. 27–66. [Google Scholar] [CrossRef]
- Tlsty, T.D.; Coussens, L.M. Tumor stroma and regulation of cancer development. Annu. Rev. Pathol. Mech. Dis. 2006, 1, 119–150. [Google Scholar] [CrossRef] [PubMed]
- Lakhani, S.R.; Ashworth, A. Microarray and histopathological analysis of tumours: The future and the past? Nat. Rev. Cancer 2001, 1, 151–157. [Google Scholar] [CrossRef] [PubMed]
- Campanella, G.; Hanna, M.G.; Geneslaw, L.; Miraflor, A.; Silva, V.W.K.; Busam, K.J.; Brogi, E.; Reuter, V.E.; Klimstra, D.S.; Fuchs, T.J. Clinical-grade computational pathology using weakly supervised deep learning on whole slide images. Nat. Med. 2019, 25, 1301–1309. [Google Scholar] [CrossRef] [PubMed]
- Ščupáková, K.; Balluff, B.; Tressler, C.; Adelaja, T.; Heeren, R.M.; Glunde, K.; Ertaylan, G. Cellular resolution in clinical MALDI mass spectrometry imaging: The latest advancements and current challenges. Clin. Chem. Lab. Med. 2020, 58, 914–929. [Google Scholar] [CrossRef] [PubMed]
- Mascini, N.E.; Teunissen, J.; Noorlag, R.; Willems, S.M.; Heeren, R.M.A. Tumor classification with MALDI-MSI data of tissue microarrays: A case study. Methods 2018, 151, 21–27. [Google Scholar] [CrossRef] [PubMed]
- Greco, F.; Quercioli, L.; Pucci, A.; Rocchiccioli, S.; Ferrari, M.; Recchia, F.A.; McDonnell, L.A. Mass Spectrometry Imaging as a Tool to Investigate Region Specific Lipid Alterations in Symptomatic Human Carotid Atherosclerotic Plaques. Metabolites 2021, 11, 250. [Google Scholar] [CrossRef] [PubMed]
- Houg, D.S.; Bijlsma, M.F. The hepatic pre-metastatic niche in pancreatic ductal adenocarcinoma. Mol. Cancer 2018, 17, 95. [Google Scholar] [CrossRef] [PubMed]
- Le Faouder, J.; Laouirem, S.; Alexandrov, T.; Ben-Harzallah, S.; Léger, T.; Albuquerque, M.; Bedossa, P.; Paradis, V. Tumoral heterogeneity of hepatic cholangiocarcinomas revealed by MALDI imaging mass spectrometry. Proteomics 2014, 14, 965–972. [Google Scholar] [CrossRef] [PubMed]
- Banales, J.M.; Marin, J.J.G.; Lamarca, A.; Rodrigues, P.M.; Khan, S.A.; Roberts, L.R.; Cardinale, V.; Carpino, G.; Andersen, J.B.; Braconi, C.; et al. Cholangiocarcinoma 2020: The next horizon in mechanisms and management. Nat. Rev. Gastroenterol. Hepatol. 2020, 17, 557–588. [Google Scholar] [CrossRef] [PubMed]
- Benson, A.B.I.; Schrag, D.; Somerfield, M.R.; Cohen, A.M.; Figueredo, A.T.; Krzyzanowska, P.J.F.K.; Maroun, J.; McAllister, P.; van Cutsem, E.; Brouwers, M.; et al. American Society of Clinical Oncology Recommendations on Adjuvant Chemotherapy for Stage II Colon Cancer. J. Clin. Oncol. 2004, 22, 3408–3419. [Google Scholar] [CrossRef] [PubMed]
- Padden, J.; Ahrens, M.; Kälsch, J.; Bertram, S.; Megger, D.A.; Bracht, T.; Eisenacher, M.; Kocabayoglu, P.; Meyer, H.E.; Sipos, B.; et al. Immunohistochemical Markers Distinguishing Cholangiocellular Carcinoma (CCC) from Pancreatic Ductal Adenocarcinoma (PDAC) Discovered by Proteomic Analysis of Microdissected Cells. Mol. Cell. Proteom. 2016, 15, 1072–1082. [Google Scholar] [CrossRef] [PubMed] [Green Version]
- Ly, A.; Buck, A.; Balluff, B.; Sun, N.; Gorzolka, K.; Feuchtinger, A.; Janssen, K.P.; Kuppen, P.J.K.; van de Velde, C.J.H.; Weirich, G.; et al. High-mass-resolution MALDI mass spectrometry imaging of metabolites from formalin-fixed paraffin-embedded tissue. Nat. Protoc. 2016, 11, 1428–1443. [Google Scholar] [CrossRef] [PubMed]
- Ly, A.; Longuespée, R.; Casadonte, R.; Wandernoth, P.; Schwamborn, K.; Bollwein, C.; Marsching, C.; Kriegsmann, K.; Hopf, C.; Weichert, W.; et al. Site-to-Site Reproducibility and Spatial Resolution in MALDI–MSI of Peptides from Formalin-Fixed Paraffin-Embedded Samples. PROTEOM. Clin. Appl. 2019, 13, 1800029. [Google Scholar] [CrossRef] [PubMed] [Green Version]
- Bankhead, P.; Loughrey, M.B.; Fernández, J.A.; Dombrowski, Y.; McArt, D.G.; Dunne, P.D.; McQuaid, S.; Gray, R.T.; Murray, L.J.; Coleman, H.G.; et al. QuPath: Open source software for digital pathology image analysis. Sci. Rep. 2017, 7, 1–7. [Google Scholar] [CrossRef] [PubMed] [Green Version]
- Boskamp, T.; Lachmund, D.; Casadonte, R.; Hauberg-Lotte, L.; Kobarg, J.H.; Kriegsmann, J.; Maass, P. Using the Chemical Noise Background in MALDI Mass Spectrometry Imaging for Mass Alignment and Calibration. Anal. Chem. 2019, 92, 1301–1308. [Google Scholar] [CrossRef] [PubMed]
- Boskamp, T.; Casadonte, R.; Hauberg-Lotte, L.; Deininger, S.; Kriegsmann, J.; Maass, P. Cross-Normalization of MALDI Mass Spectrometry Imaging Data Improves Site-to-Site Reproducibility. Anal. Chem. 2021, 93, 10584–10592. [Google Scholar] [CrossRef] [PubMed]
- R: The R Project for Statistical Computing. Available online: https://www.r-project.org/ (accessed on 2 September 2021).
- RStudio. Open Source & Professional Software for Data Science Teams—RStudio. Available online: https://www.rstudio.com/ (accessed on 2 September 2021).
- Xanthopoulos, P.; Pardalos, P.M.; Trafalis, T.B. Linear Discriminant Analysis. In Robust Data Mining; Springer Briefs in Optimization; Springer: New York, NY, USA, 2013. [Google Scholar] [CrossRef]
- Breiman, L. Random Forests—Random Features; Technical Report 567; Statistics Department, University of California: Berkeley, CA, USA, 1999; Available online: https://www.stat.berkeley.edu/~breiman/random-forests.pdf (accessed on 26 October 2021).
- Adankon, M.; Cheriet, M. Support Vector Machine. In Encyclopedia of Biometrics; Li, S.Z., Jain, A., Eds.; Springer: Boston, MA, USA, 2009. [Google Scholar] [CrossRef]
| Publisher’s Note: MDPI stays neutral with regard to jurisdictional claims in published maps and institutional affiliations. |
© 2021 by the authors. Licensee MDPI, Basel, Switzerland. This article is an open access article distributed under the terms and conditions of the Creative Commons Attribution (CC BY) license (https://creativecommons.org/licenses/by/4.0/).


 ,
, 


