1. Introduction
The microbial production of various useful compounds has been actively studied. With the recent development of synthetic biotechnology, the production of useful compounds that microorganisms do not naturally produce can be made possible by introducing biosynthetic pathways (synthetic metabolic pathways), designed by combining heterologous and modified (mutant) enzymes. In addition, active research on the use of metabolic models has contributed to an effective improvement in the yield of useful compounds [
1,
2,
3,
4]. In such studies that often involve a genome-scale metabolic model (GSM), Flux Balance Analysis (FBA) is frequently used for metabolic simulations [
5].
FBA is a method that assumes a steady state in which the concentration of a metabolite does not change with time. An FBA solution (the distribution of metabolic fluxes) that maximizes or minimizes the objective function is searched, using a stoichiometric matrix composed of stoichiometric coefficients of reactions that constitute the metabolic model [
6]. In the FBA-based method, a simulation can be performed relatively easily, using a large-scale GSM, and the analyses have provided various metabolic engineering strategies for the improved production of useful compounds. FBA is also used for analyzing the steady state obtained by continuous culture and the snapshot of a time-varying system [
7].
In addition, the theoretical maximum yield under given constraints (conditions) can be obtained with FBA, although this is usually different from the actual yield in a dynamic production process with growth. From this point of view, dynamic FBA (dFBA) has been developed, which is an extension of FBA applicable to dynamic production processes, such as batch and fed-batch cultures with growth [
8]. The dFBA method expresses time-dependent changes in the substrates, the products, oxygen, and cell concentrations in the culture medium by ordinary differential equations (ODEs), and expresses the intracellular metabolic reactions by GSM for FBA.
The dynamic FBA function in the COBRA Toolbox implements the method of Mahadevan et al. [
9], DyMMM [
10] and DFBAlab [
11]. A plurality of kinetic parameters is included in dFBA, to express the substrate/oxygen concentration by the differential equations in the medium. Therefore, it is necessary to estimate values of the arameters to reproduce experimental time-course data. For parameter estimation, manual tuning [
12], and the nonlinear least squares method are used. The dFBA method has been used for the optimization of substrate feeding profiles and simulation in ethanol production by fed-batch cultures of yeast [
13], and for the co-culture of yeasts
Saccharomyces cerevisiae and
Scheffersomyces stipitis [
14], as well as
S. cerevisiae and
Escherichia coli [
12]. In these studies, dFBA was performed, based on the cultural time-course data of each bacterium, and the parameters for reproducing the experimental data were estimated. After that, dFBA simulation of co-culture was carried out to inform culture engineering strategies, such as initial cell ratios and aeration conditions [
12,
14]. Furthermore, dFBA has been extended to integrated dFBA (idFBA) by the integration of signaling, metabolic, and regulatory networks [
15], and to integrated FBA (iFBA) by the integration of ODEs and regulatory Boolean logic [
16] for more detailed analyses. Another example of dFBA using time-course data is the improved production of valuable compounds by green algae [
17].
Thus, dFBA has made various contributions to non-steady-state systems, such as batch and fed-batch cultures. Moreover, since dFBA is applied to systems involving cell growth, such as batch and fed-batch cultures, the theoretical maximum production concentrations and yields can be estimated under conditions closer to the production process than FBA. By comparing these maximum production concentrations and yields with the experimental values, it was also possible to estimate the differences between the simulated maximum values and the experimental results, and to evaluate production performance in the target compound production of the strain, which could provide useful information as to whether there is room for improvement in the production of the target compound. However, to our knowledge, although seen as part of the lexicographic optimization in DFBAlab [
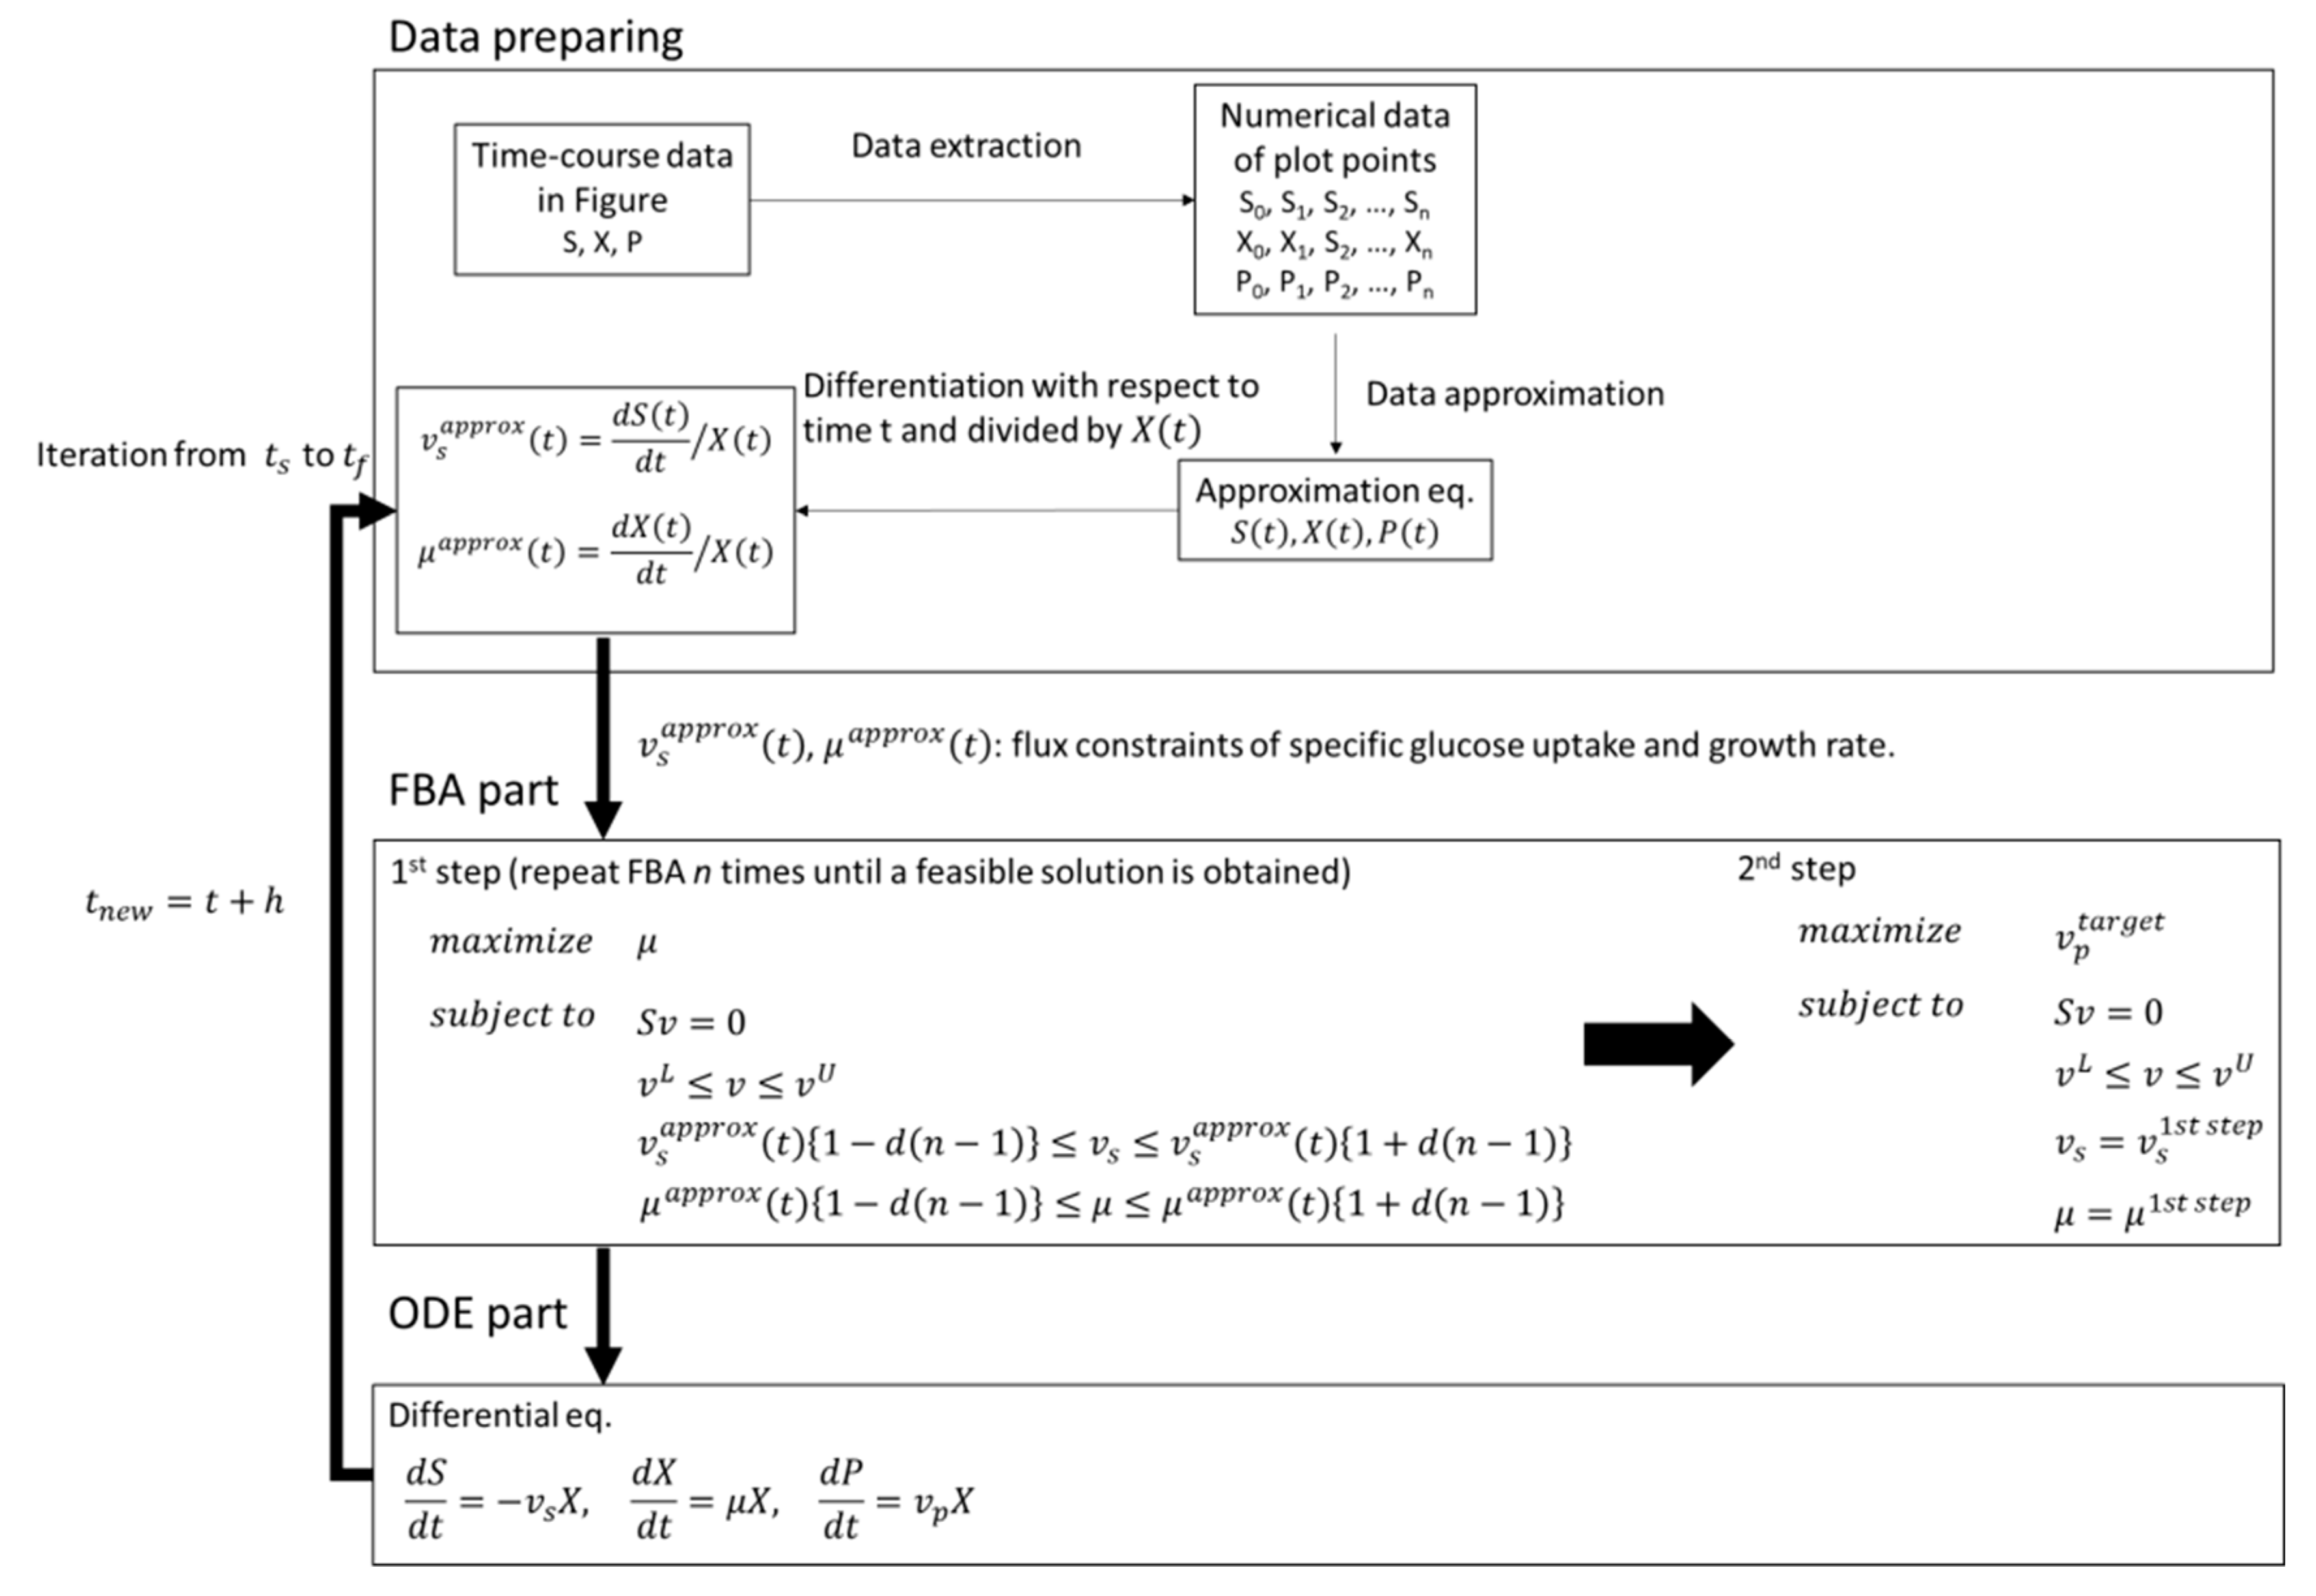
11], simulation and analysis are rarely performed in non-steady-state systems with the objective function of maximizing the production of the target substance like FBA. In this study, therefore, we applied dFBA to estimate the difference between the simulated maximum production concentration of the target compound and the experimental value under the same constraints, such as substrate consumption and cell growth, and to evaluate production performance in the experimental strain. In the dFBA part of this study, instead of estimating the kinetic parameters of the differential equations, the approximate values of the time-course data were converted and used in FBA constraints. In the FBA part, we performed a two-step optimization with different objective functions. The obtained fluxes for substrates, growth, and products were converted into concentrations by numerical integration and used to estimate the difference between the simulated maximum production concentration of the target compound and the experimental values, and for the evaluation of production performance in the experimental strain.
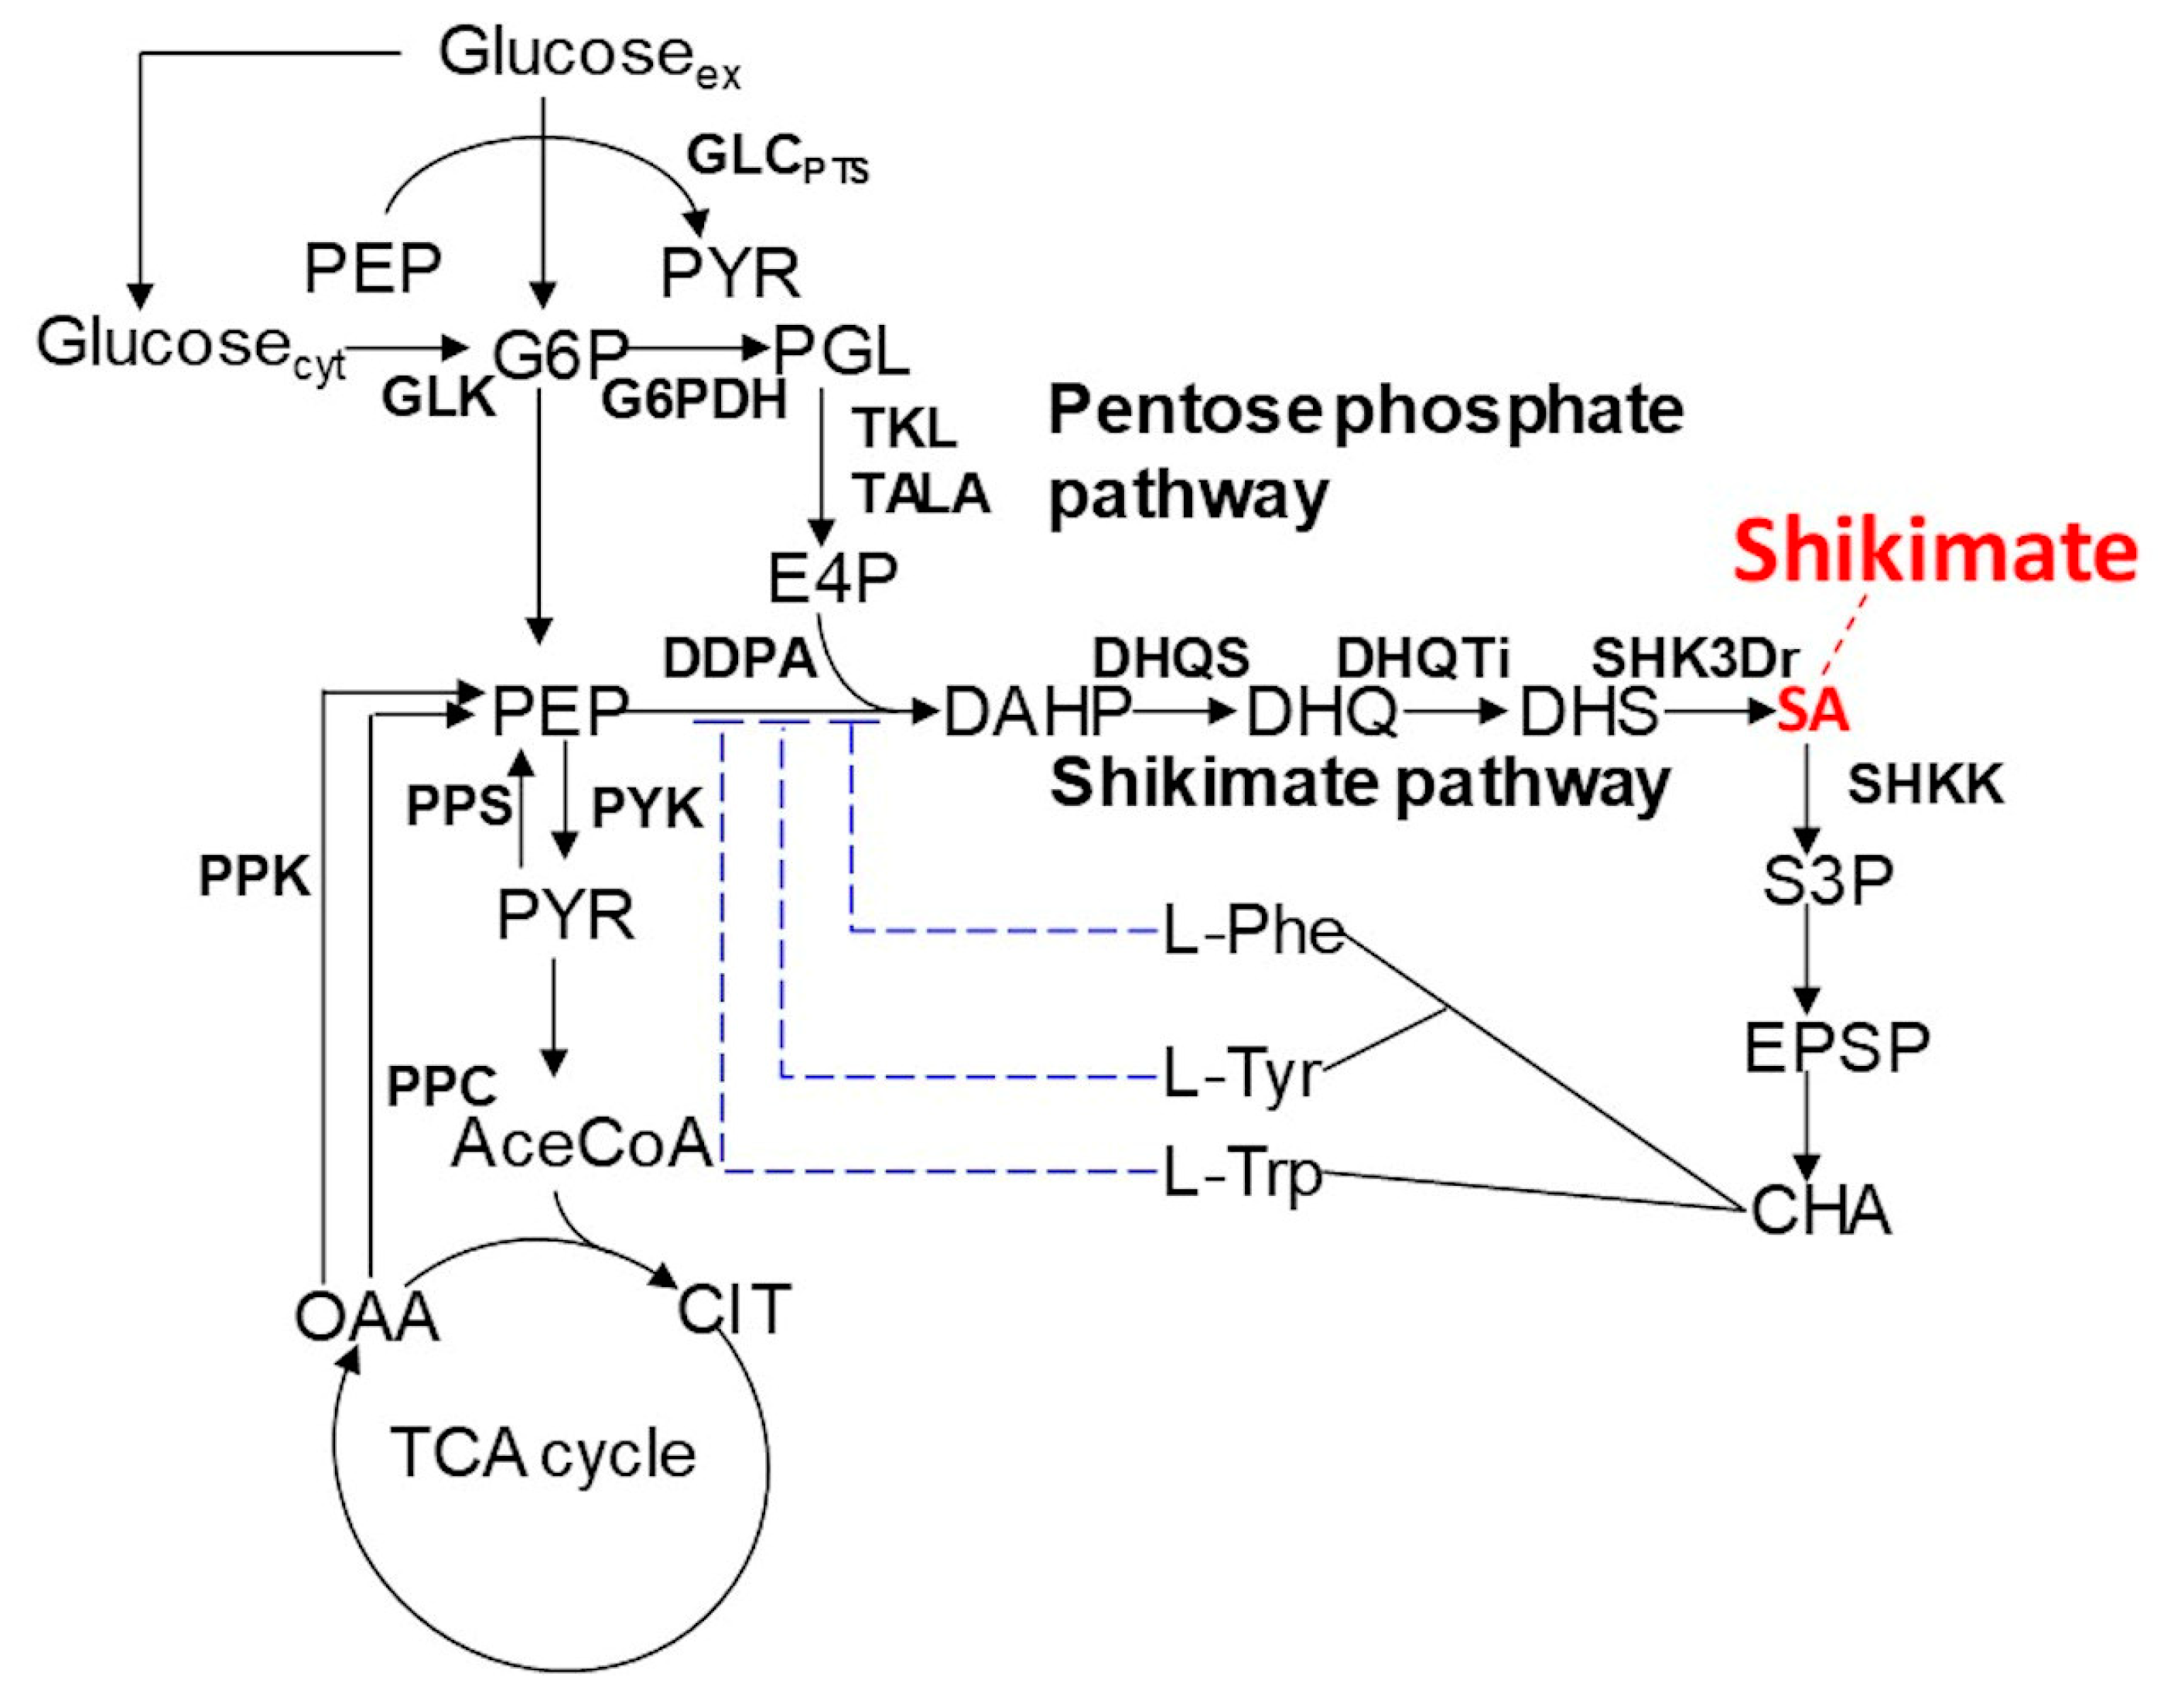
In this study, we applied dFBA to shikimic acid production in
E. coli (
Figure 1) as a case study and verified its effectiveness.
E. coli was selected as the host, because there is considerable knowledge of this model, it has been actively used and researched as a production host, and there are many studies on metabolic simulations using it as the metabolic model [
18,
19,
20,
21,
22,
23]. In addition, shikimic acid was selected as the target compound because shikimic acid is a hub compound with known effects of its derivation on various useful compounds such as alkaloids, opioid compounds and other aromatic compounds. Improved production of shikimic acid is therefore desirable [
24,
25]. Furthermore, many genetic modifications have been made [
26].
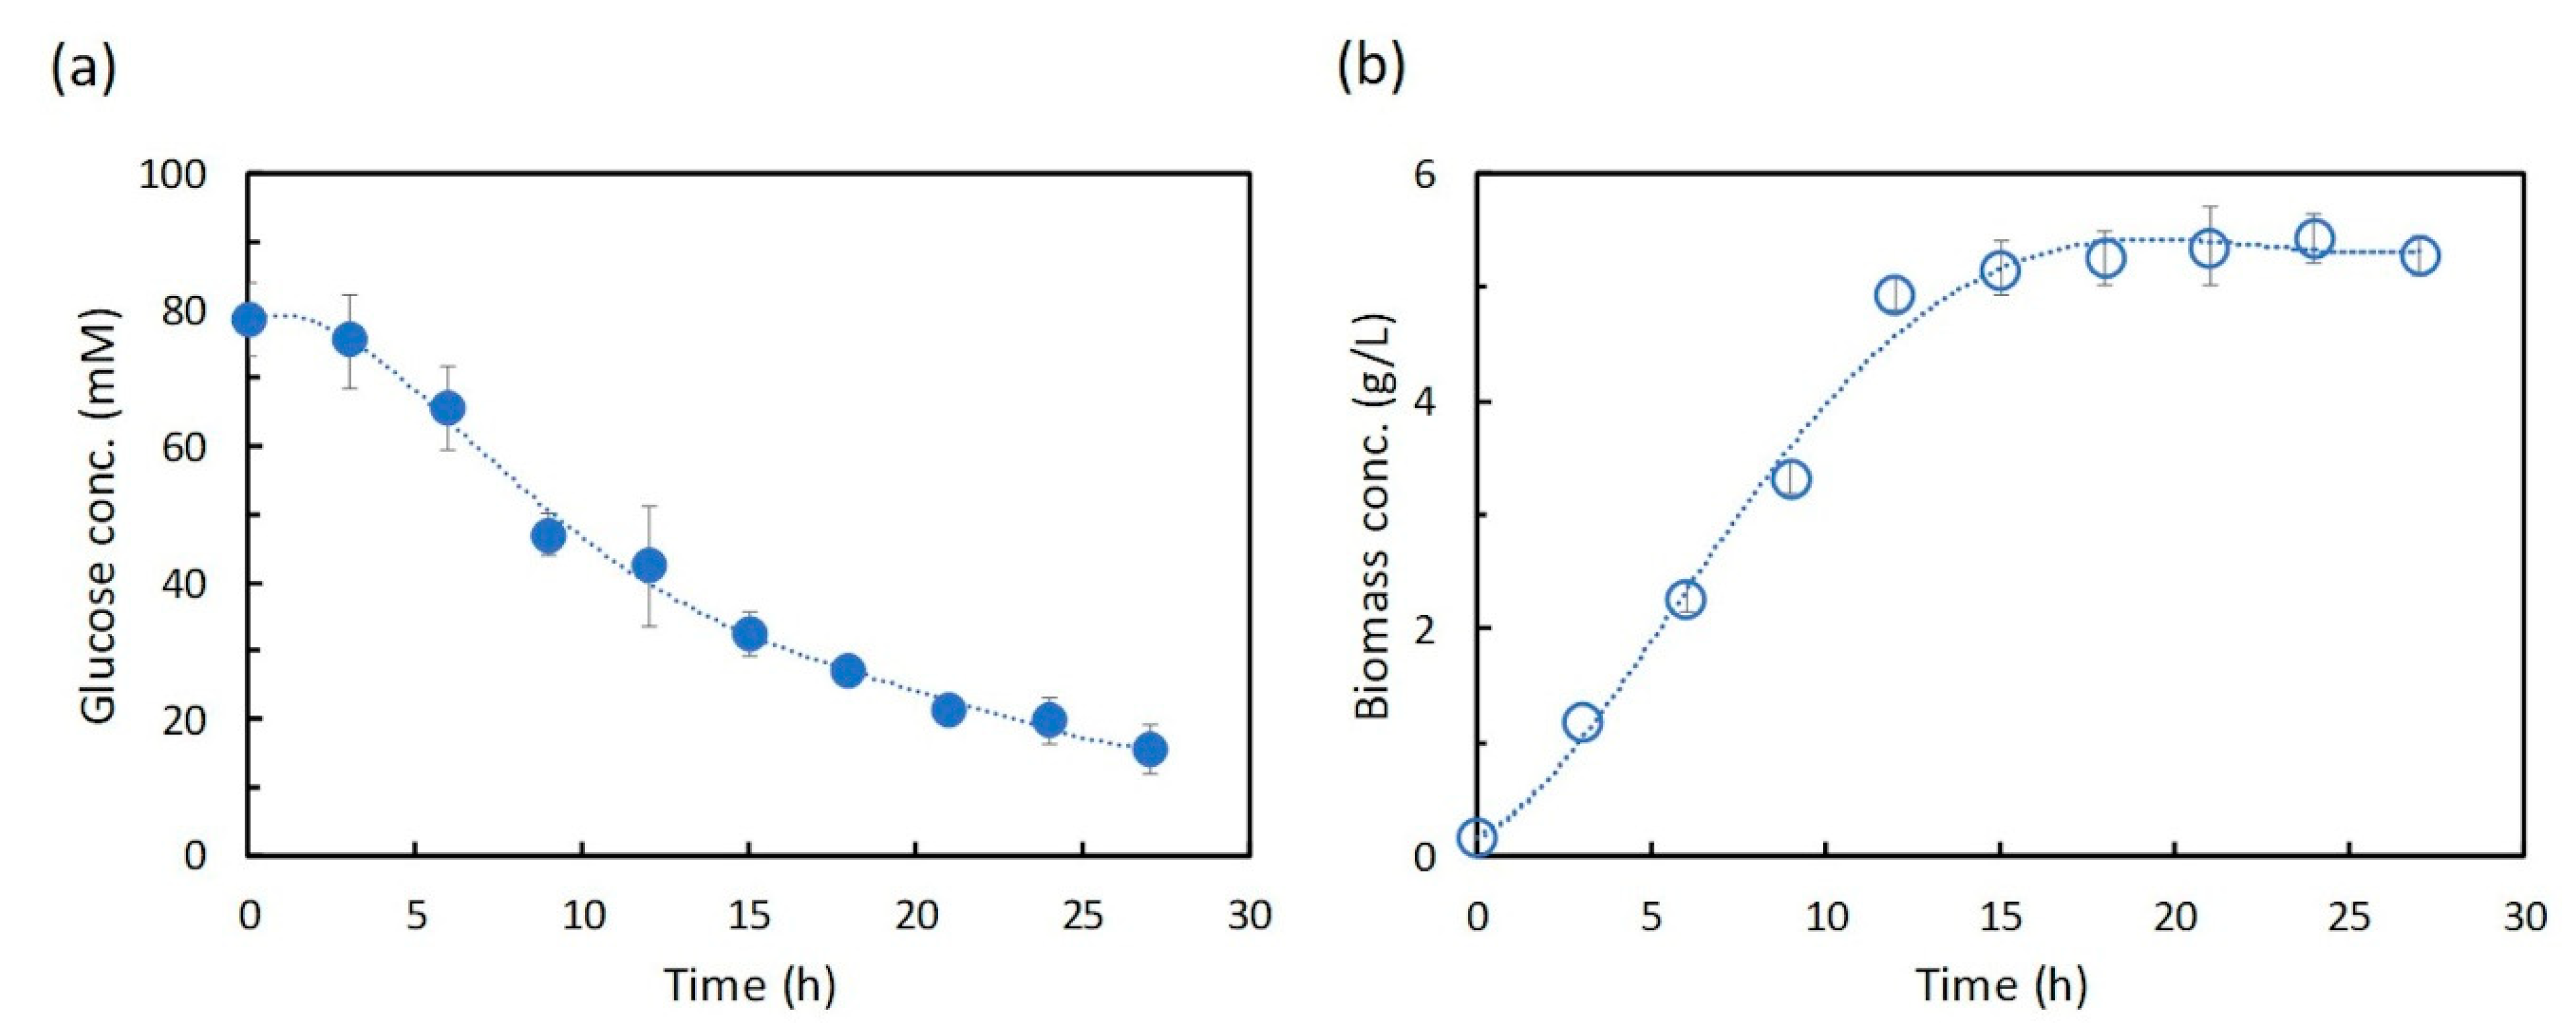
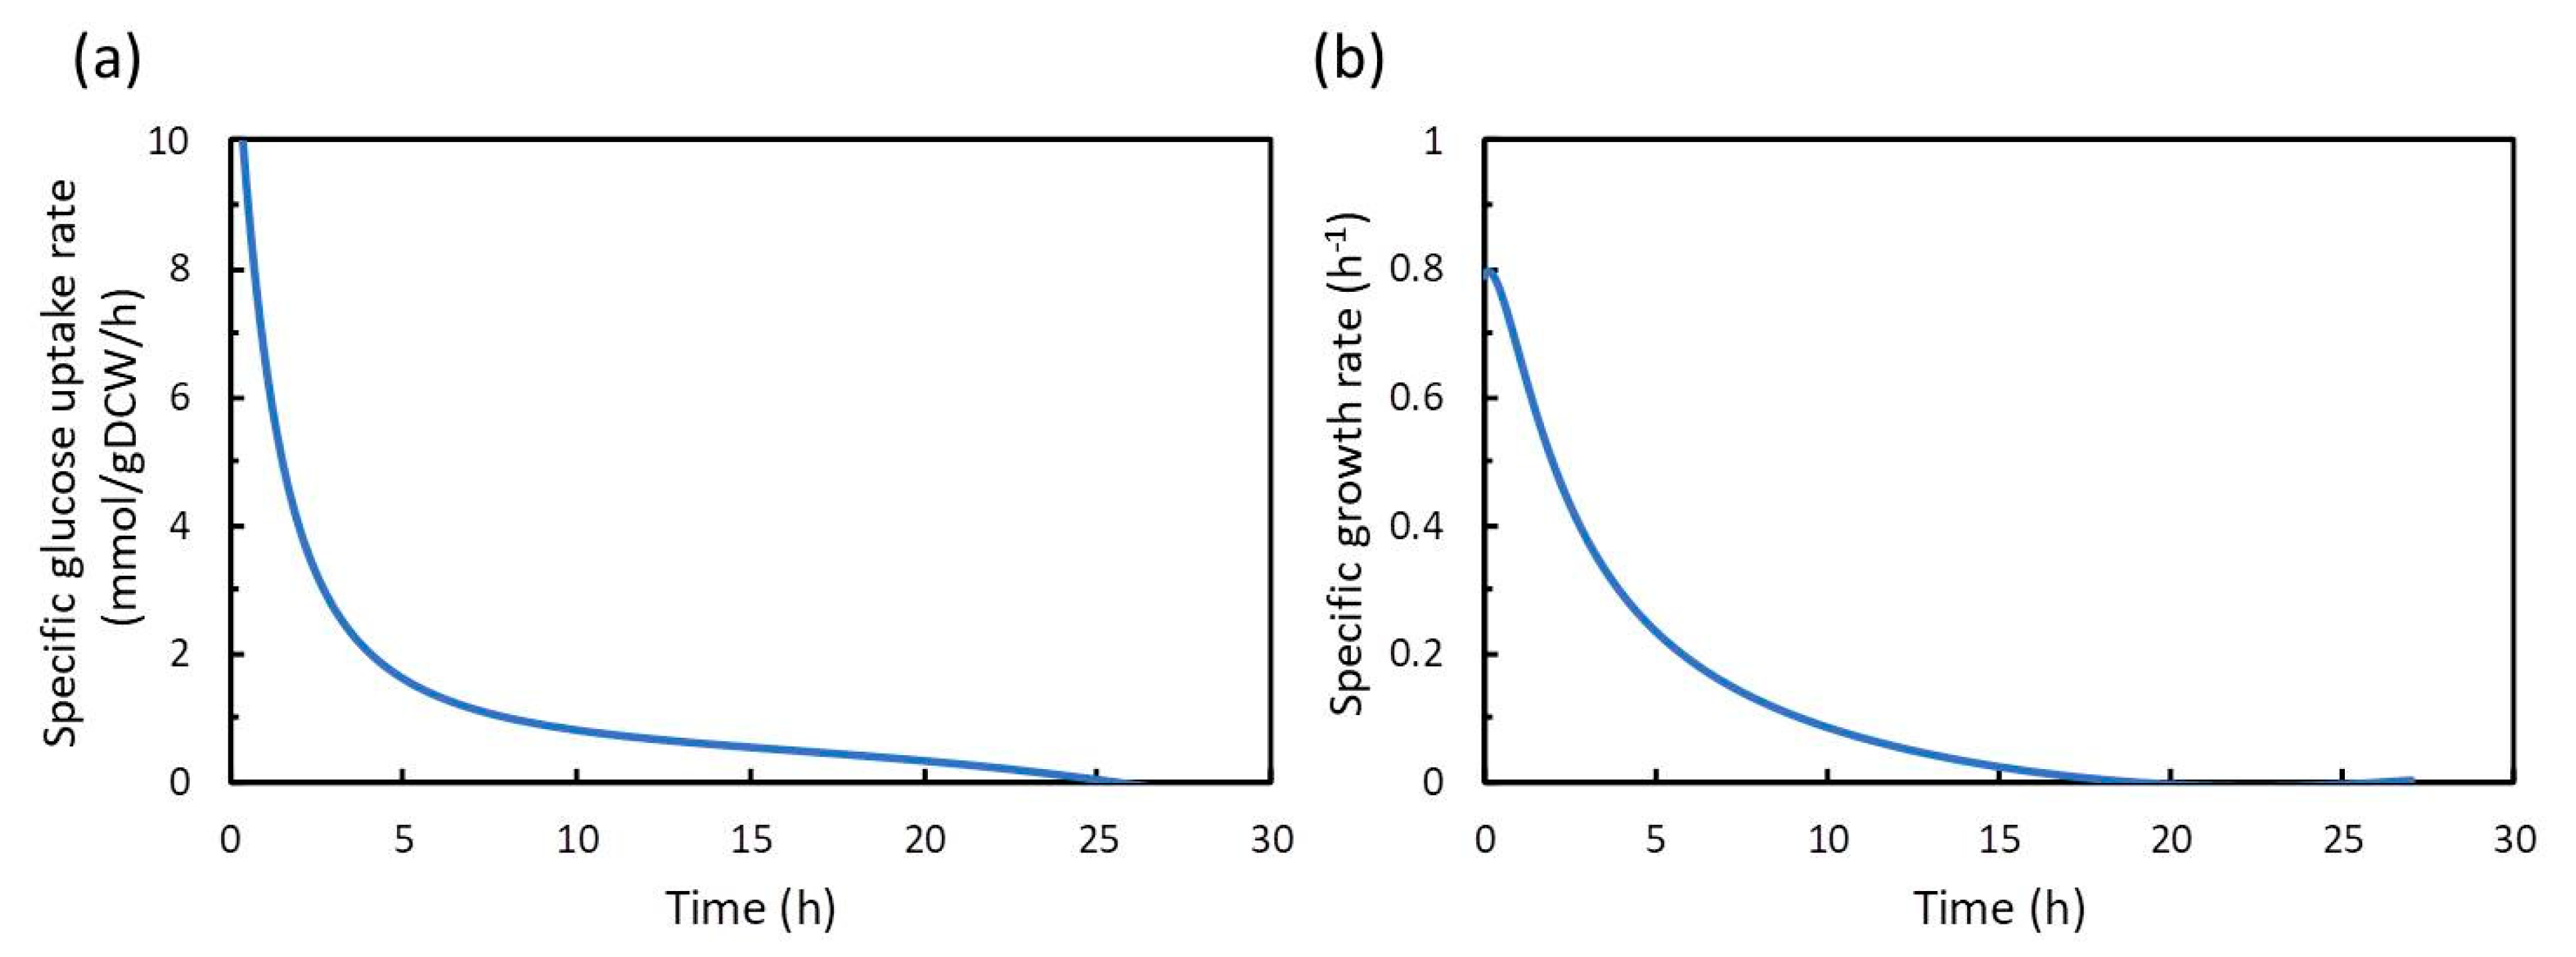
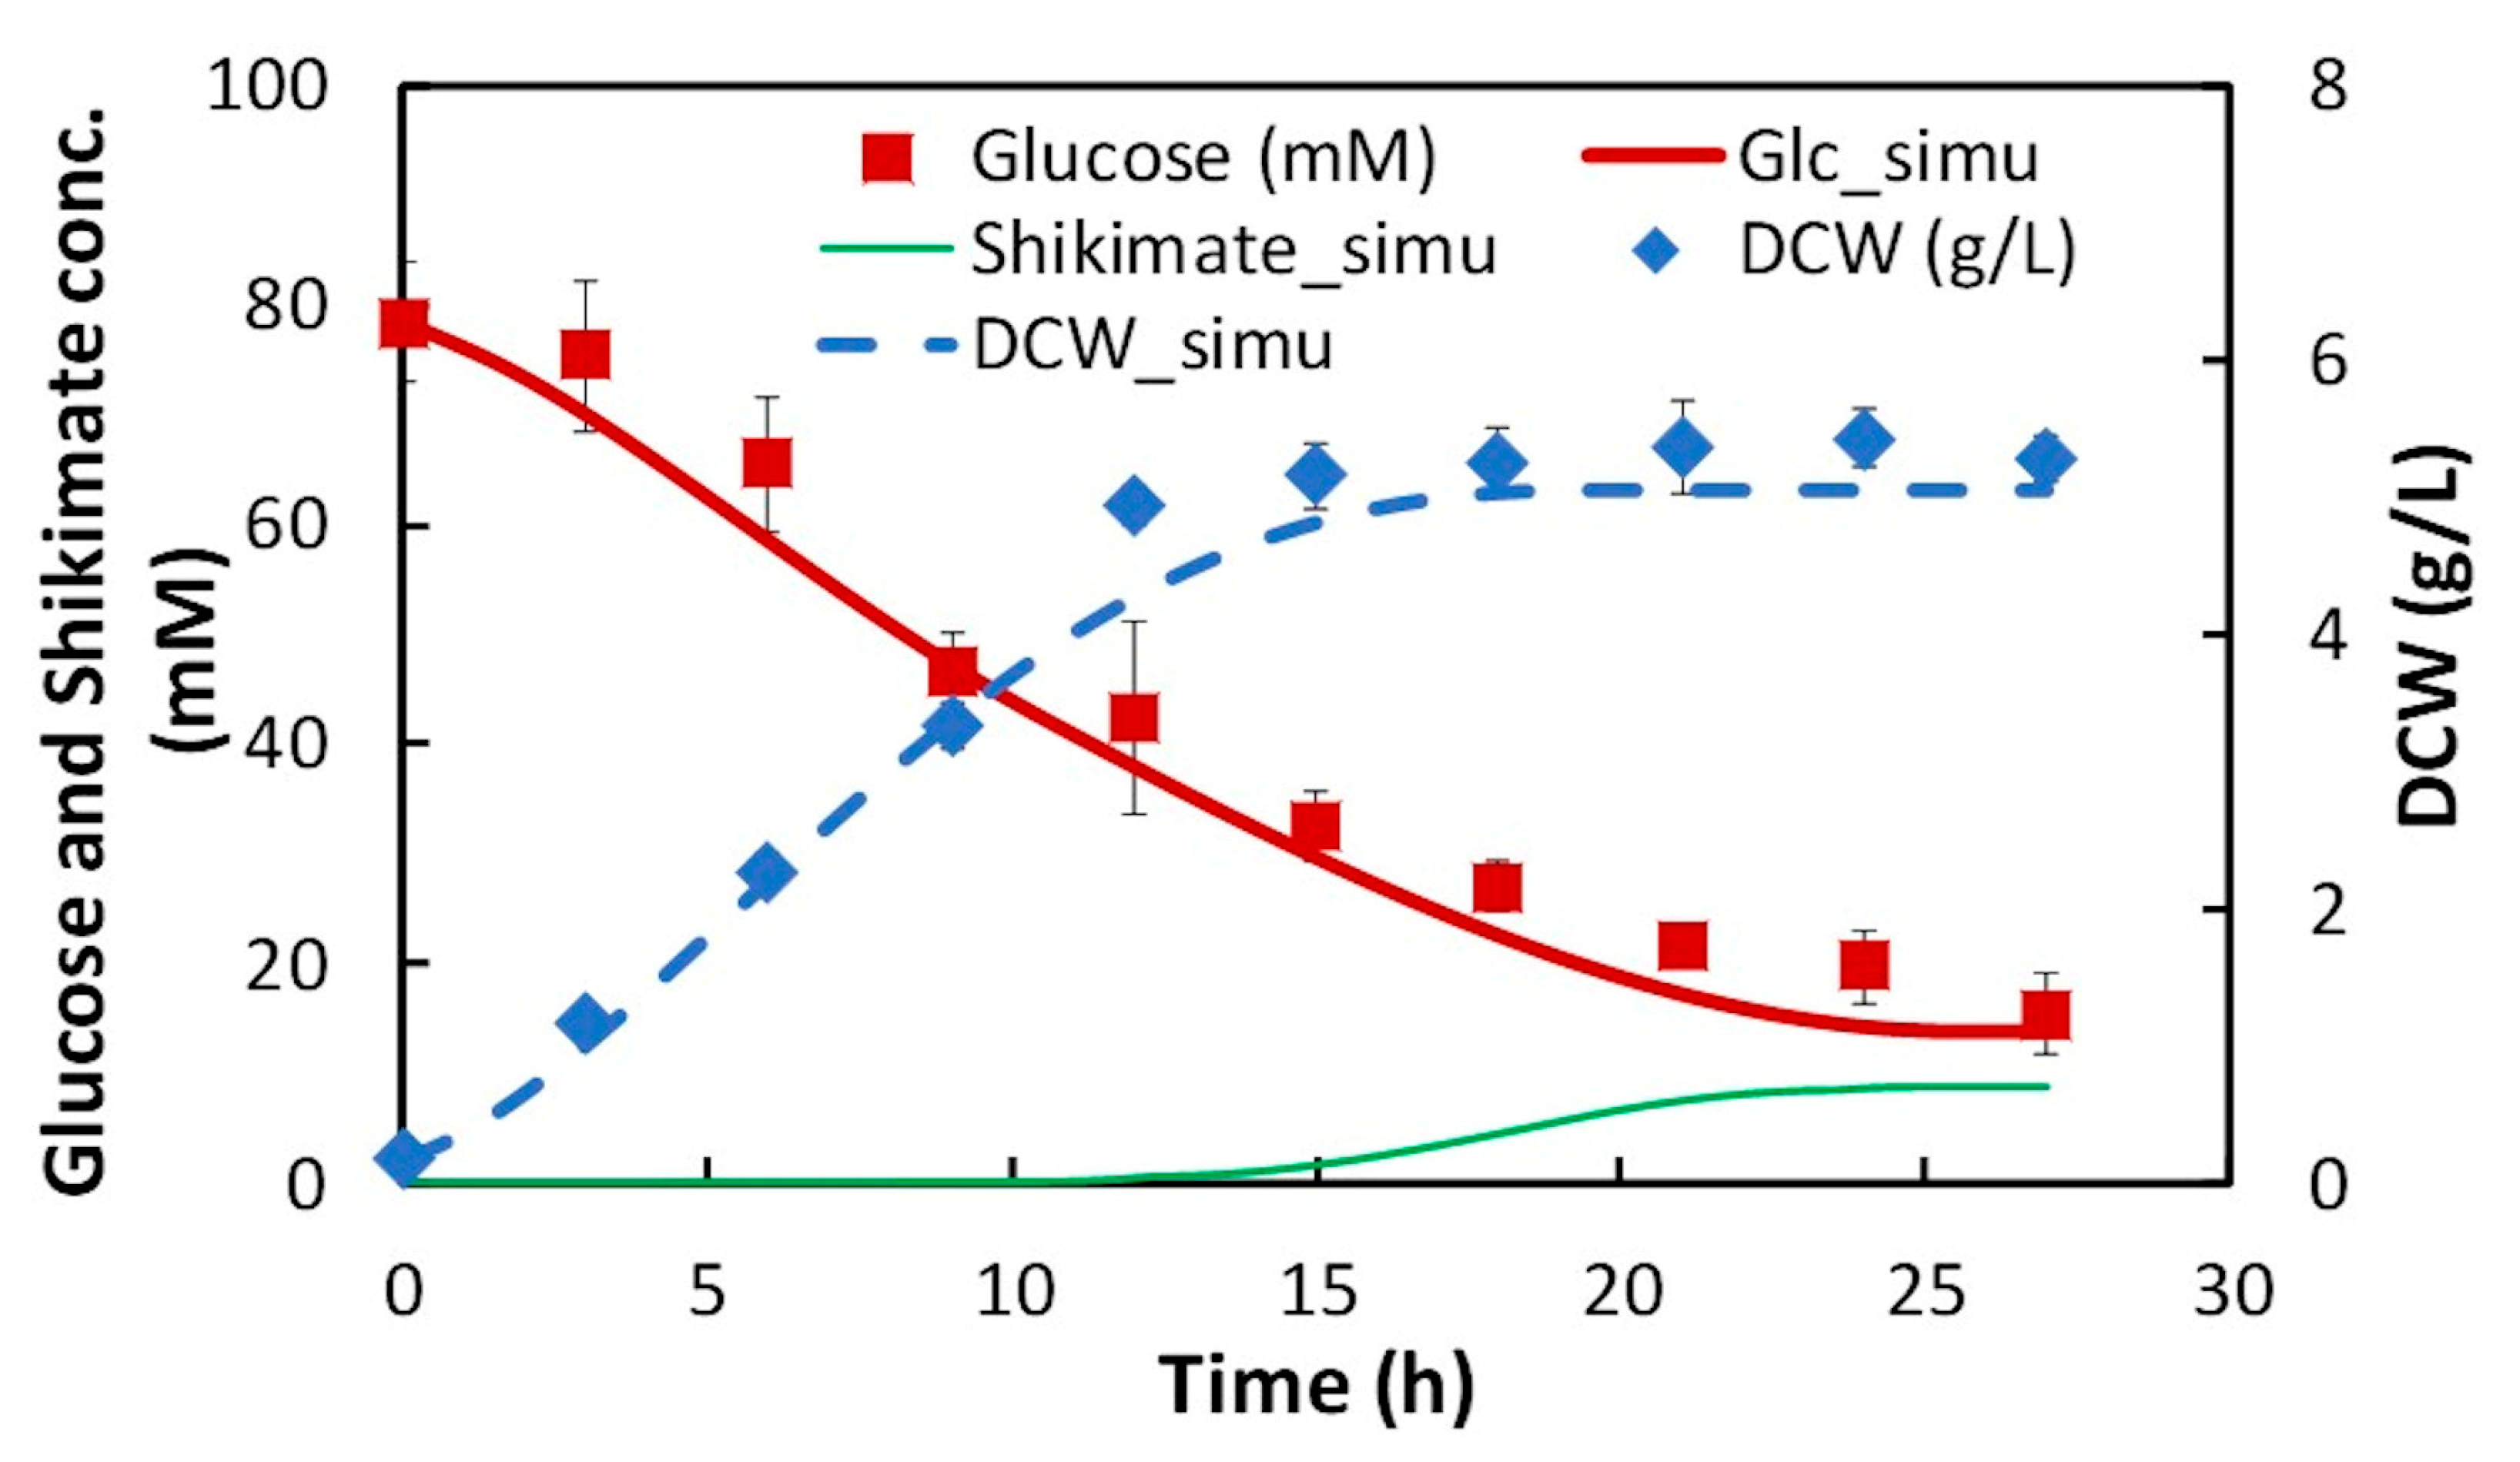
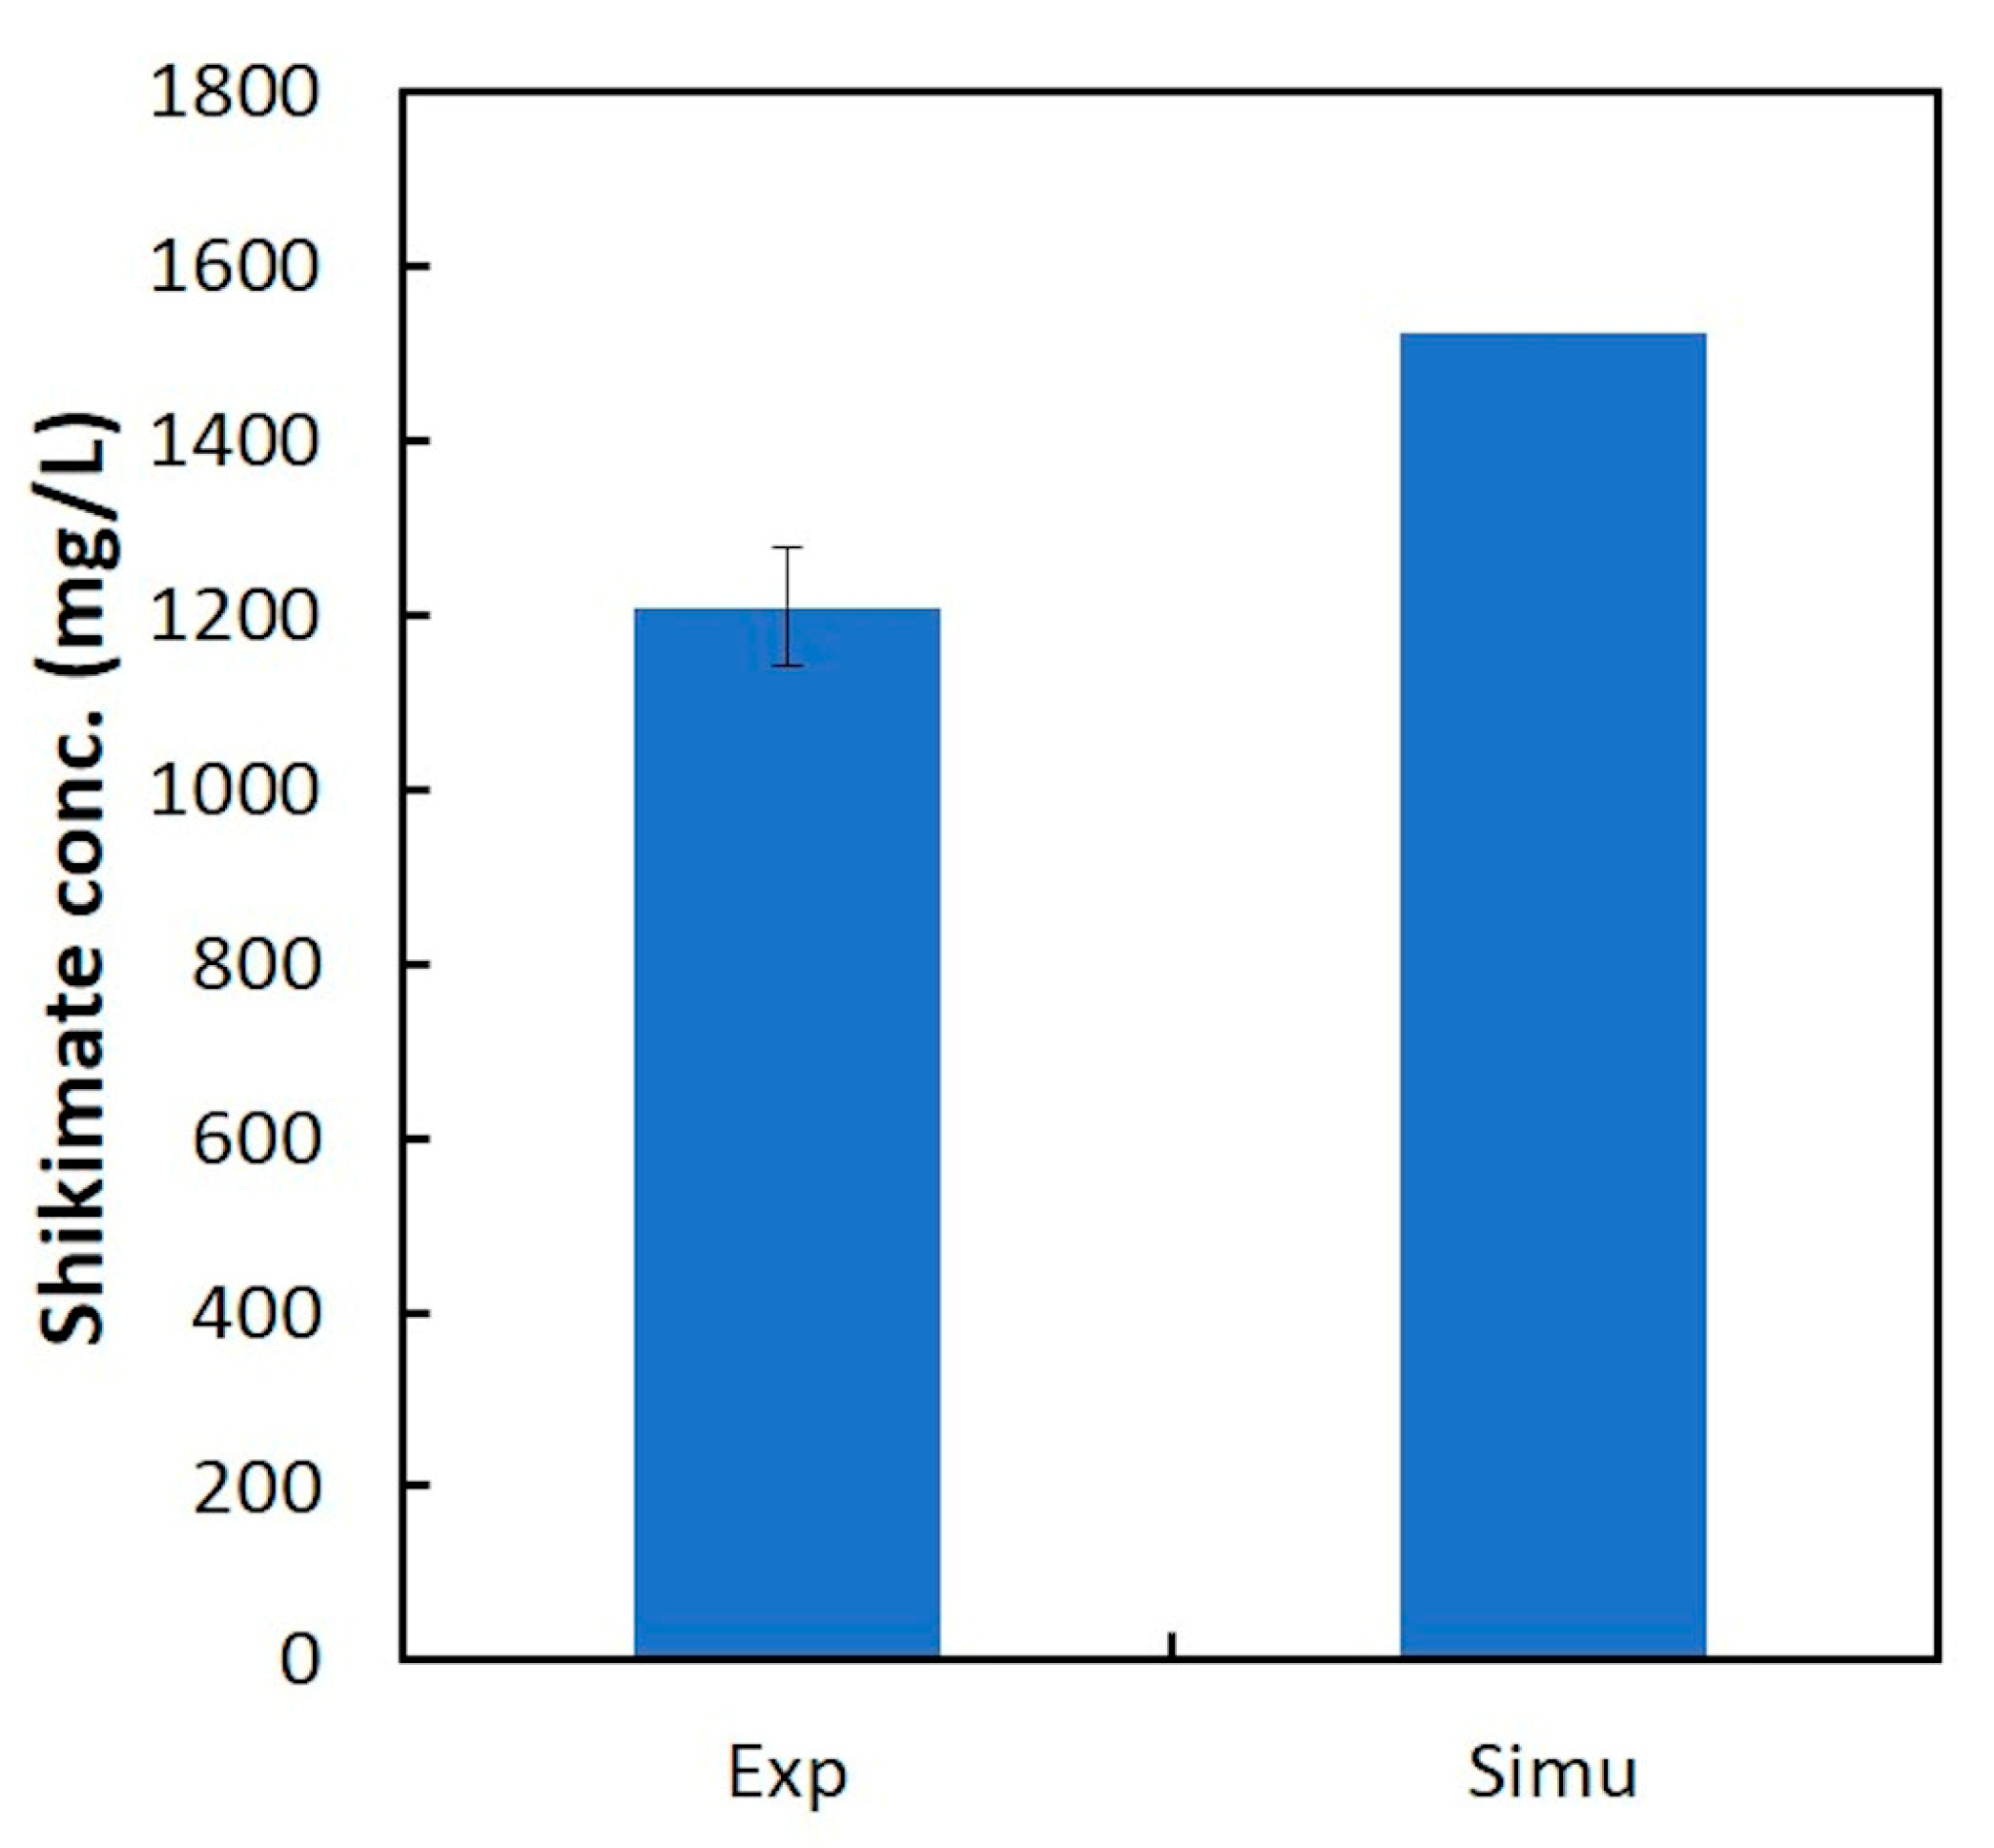
In this study, dFBA, which repeats FBA sequentially without estimating kinetic parameters in differential equations, was applied to the production of shikimic acid in E. coli using polynomial approximation of the time-course data of the experiment. The results suggested that the shikimic acid production concentration of the experimental strain was about 84% of the theoretical value under the same constraints of substrate consumption and bacterial growth. Thus, this method could be an indicator of the attainment of the productivity of experimental strains in the production of useful compounds.
3. Discussion
In this study, we applied dFBA for estimating the difference between the simulated maximum concentration and the experimental value of the target compound, and for evaluating the production performance of the experimental strain under the same constraints of substrate consumption and cell growth as those in the experiment. The dFBA method is used to estimate and obtain the time courses of metabolic fluxes in the metabolic model by repeatedly performing FBA at each time using the time-course data of the substrate, cell growth, and product concentrations from the experiment. As a case study, we applied dFBA to shikimic acid production from glucose by E. coli to verify its usefulness in microbial production of useful compounds.
In this study, dFBA was the method for obtaining a set of time courses of metabolic fluxes using data polynomial approximation. In addition, in two-step FBA, the specific rates of the substrate uptake and the growth of bacterial cells are used as constraints in first step FBA, and the maximization of the production flux of the target compound is used as the objective function in the second FBA. As a result, the difference between the simulated maximum concentration and the experimental value of the target production can be estimated. Furthermore, the production performance of the target compound in the experimental strain can be compared to the theoretical maximum value obtained by dFBA, which provides useful information on the production of compounds by microorganisms.
In this study, the FBA is repeatedly performed at each time point. However, unlike basic dFBA, the dFBA in this study uses a polynomial approximation of the time-course data obtained from the experiment. There is no need to estimate the parameters in the differential equations. Therefore, the time courses of the metabolic fluxes in the metabolic model can be acquired more easily. Further, as in the case of basic dFBA, when a sudden change in the metabolic fluxes, such as a phase shift, is observed in the time course of the obtained metabolic flux, information on dynamic control, such as switching, can be provided by dFBA. In addition, the flux of oxygen uptake can be used as culture engineering strategies, such as the optimization of aeration conditions. However, unlike basic dFBA, the ODE part composed of differential equations is not formulated in the Michaelis-Menten or Monod type, and those kinetic parameters are not estimated, so it is difficult to use it to simulate co-culture performed in the previous publication [
13,
14]. Also, unlike basic dFBA, it is not possible to simulate when changing the parameters of substrate and oxygen uptake. Another technique similar to dFBA in this study using polynomial approximation of experimental time-course data is the dynamic metabolic flux analysis (DMFA) [
30,
31]. Compared to dFBA, the purpose of using data approximation and interpolation is the same, but the linear approximation and B-spline are used in DMFA. Furthermore, metabolic flux analysis is used instead of FBA in metabolic simulations. In this study, polynomial approximation was used; but in DMFA, changing linear interpolation to B-spline improved the results [
31]. Therefore, depending on the data to be approximated or interpolated, the results of the approximation or interpolation are expected to be improved by using a different method, and the effect can be expanded to the results of dFBA.
Since the dFBA, in this study, performs the simulation using the polynomial approximation of the experimental time-course data, there is a drawback, in that the simulation cannot proceed unless the approximation is successful. In addition, if the metabolic model used for the simulation is not accurate, the experimental results cannot be reproduced. The dFBA simulated dynamic systems that change with time, such as batch or fed-batch cultures. However, unlike the simulation using a dynamic (kinetic) model, FBA assuming a steady state is used for the intracellular simulation. Therefore, it is impossible to express the limitation of metabolic flux or the accumulation of intermediate metabolites, due to some factors such as imbalance of enzyme amounts and cofactor supply, feedback regulations.
Therefore, in this study, the dFBA can more easily acquire the time courses of the metabolic fluxes in the metabolic model using time-course data approximation. Additionally, in compound production, by using the fluxes of specific substrate uptake and growth obtained by approximation as FBA constraints, it is possible to estimate the difference between the current strain and the theoretical maximum values, and to estimate the room of improvement.
In a more detailed analysis, such as pathway optimization, dFBA does not reach simulation and analysis using a dynamic (kinetic) model. In the construction of a dynamic model, parameter estimation is a very costly operation, which is a barrier to the construction of a large-scale dynamic model. It has been suggested that combining flux time-course data with metabolome-based intracellular metabolite concentration time-course data facilitates parameter estimation [
32,
33,
34,
35,
36,
37]. Therefore, estimation of the time courses of metabolic fluxes using dFBA is expected to reduce the burden of constructing a dynamic model.
Author Contributions
Conceptualization, Y.K. and M.A.; Data curation, Y.K.; Formal analysis, Y.K.; Funding acquisition, M.A.; Investigation, Y.K.; Methodology, Y.K. and M.A.; Project administration, M.A.; Resources, Y.K.; Software, Y.K.; Supervision, M.A.; Validation, Y.K.; Visualization, Y.K.; Writing—Original draft, Y.K.; Writing—Review & Editing, Y.K. and M.A. All authors have read and agreed to the published version of the manuscript.
Funding
This article is based on results obtained from a project commissioned by the New Energy and Industrial Technology Development Organization (NEDO).
Conflicts of Interest
The authors declare no conflict of interests.
References
- Boghigian, B.; Seth, G.; Kiss, R.; Pfeifer, B.A. Metabolic flux analysis and pharmaceutical production. Metab. Eng. 2010, 12, 81–95. [Google Scholar] [CrossRef] [PubMed]
- Curran, K.A.; Crook, N.C.; Alper, H.S. Using Flux Balance Analysis to Guide Microbial Metabolic Engineering. In Microbial Metabolic Engineering. Methods in Molecular Biology (Methods and Protocols); Cheng, Q., Ed.; Springer: New York, NY, USA, 2012; Volume 834. [Google Scholar]
- Patil, K.R.; Åkesson, M.; Nielsen, J. Use of genome-scale microbial models for metabolic engineering. Curr. Opin. Biotechnol. 2004, 15, 64–69. [Google Scholar] [CrossRef] [PubMed]
- Kim, H.U.; Kim, T.Y.; Lee, S.Y. Metabolic flux analysis and metabolic engineering of microorganisms. Mol. Biosyst. 2008, 4, 113–120. [Google Scholar] [CrossRef]
- Simeonidis, E.; Price, N.D. Genome-scale modeling for metabolic engineering. J. Ind. Microbiol. Biotechnol. 2015, 42, 327–338. [Google Scholar] [CrossRef]
- Orth, J.D.; Thiele, I.; Palsson, B.Ø. What is flux balance analysis? Nat. Biotechnol. 2010, 28, 245–248. [Google Scholar] [CrossRef]
- Shinto, H.; Tashiro, Y.; Yamashita, M.; Kobayashi, G.; Sekiguchi, T.; Hanai, T.; Kuriya, Y.; Okamoto, M.; Sonomoto, K. Kinetic modeling and sensitivity analysis of acetone-butanol-ethanol production. J. Biotechnol. 2007, 131, 45–56. [Google Scholar] [CrossRef]
- Mahadevan, R.; Edwards, J.S.; Doyle, F.J., III. Dynamic flux balance analysis of diauxic growth in Escherichia coli. Biophys. J. 2002, 83, 1331–1340. [Google Scholar] [CrossRef]
- Schellenberger, J.; Que, R.; Fleming, R.M.; Thiele, I.; Orth, J.D.; Feist, A.M.; Zielinski, D.C.; Bordbar, A.; Lewis, N.E.; Rahmanian, S.; et al. Quantitative prediction of cellular metabolism with constraint-based models: The COBRA Toolbox v2.0. Nat. Protoc. 2011, 6, 1290–1307. [Google Scholar] [CrossRef]
- Zhuang, K.; Izallalen, M.; Mouser, P.; Richter, H.; Risso, C.; Mahadevan, R.; Lovley, D.R. Genome-scale dynamic modeling of the competition between rhodoferax and geobacter in anoxic subsurface environments. ISME J. 2011, 5, 305–316. [Google Scholar] [CrossRef]
- Gomez, J.A.; Höffner, K.; Barton, P.I. DFBAlab: A fast and reliable MATLAB code for dynamic flux balance analysis. BMC Bioinform. 2014, 15, 409. [Google Scholar] [CrossRef] [PubMed]
- Hanly, T.J.; Henson, M.A. Dynamic flux balance modeling of microbial co-cultures for efficient batch fermentation of glucose and xylose mixtures. Biotechnol. Bioeng. 2011, 108, 376–385. [Google Scholar] [CrossRef] [PubMed]
- Hjersted, J.L.; Henson, M.A. Optimization of fed-batch Saccharomyces cerevisiae fermentation using dynamic flux balance models. Biotechnol. Prog. 2006, 22, 1239–1248. [Google Scholar] [CrossRef] [PubMed]
- Hanly, T.J.; Henson, M.A. Dynamic metabolic modeling of a microaerobic yeast co-culture: Predicting and optimizing ethanol production from glucose/xylose mixtures. Biotechnol. Biofuels 2013, 6, 44. [Google Scholar] [CrossRef] [PubMed]
- Lee, J.M.; Gianchandani, E.P.; Eddy, J.A.; Papin, J.A. Dynamic analysis of integrated signaling, metabolic, and regulatory networks. PLoS Comput. Biol. 2008, 4, e1000086. [Google Scholar] [CrossRef]
- Covert, M.W.; Xiao, N.; Chen, T.J.; Karr, J.R. Integrating metabolic, transcriptional regulatory and signal transduction models in Escherichia coli. Bioinformatics 2008, 24, 2044–2050. [Google Scholar] [CrossRef]
- Flassig, R.J.; Fachet, M.; Höffner, K.; Barton, P.I.; Sundmacher, K. Dynamic flux balance modeling to increase the production of high-value compounds in green microalgae. Biotechnol. Biofuels 2016, 9, 165. [Google Scholar] [CrossRef]
- Fong, S.S.; Burgard, A.P.; Herring, C.D.; Knight, E.M.; Blattner, F.R.; Maranas, C.D.; Palsson, B.Ø. In silico design and adaptive evolution of Escherichia coli for production of lactic acid. Biotechnol. Bioeng. 2005, 91, 643–648. [Google Scholar] [CrossRef]
- Park, J.H.; Lee, K.H.; Kim, T.Y.; Lee, S.Y. Metabolic engineering of Escherichia coli for the production of L-valine based on transcriptome analysis and in silico gene knockout simulation. Proc. Natl. Acad. Sci. USA 2007, 104, 7797–7802. [Google Scholar] [CrossRef]
- Wang, Q.; Chen, X.; Yang, Y.; Zhao, X. Genome-scale in silico aided metabolic analysis and flux comparisons of Escherichia coli to improve succinate production. Appl. Microbiol. Biotechnol. 2006, 73, 887–894. [Google Scholar] [CrossRef] [PubMed]
- Alper, H.; Jin, Y.S.; Moxley, J.F.; Stephanopoulos, G. Identifying gene targets for the metabolic engineering of lycopene biosynthesis in Escherichia coli. Metab. Eng. 2005, 7, 155–164. [Google Scholar] [CrossRef]
- Alper, H.; Miyaoku, K.; Stephanopoulos, G. Construction of lycopene-overproducing E. coli strains by combining systematic and combinatorial gene knockout targets. Nat. Biotechnol. 2005, 23, 612–616. [Google Scholar] [CrossRef] [PubMed]
- Meng, H.; Wang, Y.; Hua, Q.; Zhang, S.; Wang, X. In silico analysis and experimental improvement of taxadiene heterologous biosynthesis in Escherichia coli. Biotechnol. Bioprocess Eng. 2011, 16, 205–215. [Google Scholar] [CrossRef]
- Averesch, N.J.H.; Krömer, J.O. Metabolic Engineering of the Shikimate Pathway for Production of Aromatics and Derived Compounds-Present and Future Strain Construction Strategies. Front. Bioeng. Biotechnol. 2018, 6, 32. [Google Scholar] [CrossRef] [PubMed]
- Tohge, T.; Watanabe, M.; Hoefgen, R.; Fernie, A. Shikimate and Phenylalanine Biosynthesis in the Green Lineage. Front. Plant Sci. 2013, 4, 62. [Google Scholar] [CrossRef]
- Gu, P.; Fan, X.; Liang, Q.; Qi, Q.; Li, Q. Novel technologies combined with traditional metabolic engineering strategies facilitate the construction of shikimate-producing Escherichia coli. Microb. Cell Fact. 2017, 16, 167. [Google Scholar] [CrossRef]
- Chen, X.; Li, M.; Zhou, L.; Shen, W.; Algasan, G.; Fan, Y.; Wang, Z. Metabolic eingineering of Escherichia coli for improving shikimate synthesis from glucose. Bioresour. Technol. 2014, 166, 64–71. [Google Scholar] [CrossRef]
- WebPlotDigitizer 4.2. Available online: https://automeris.io/WebPlotDigitizer/ (accessed on 14 June 2019).
- Orth, J.D.; Conrad, T.M.; Na, J.; Lerman, J.A.; Nam, H.; Feist, A.M.; Palsson, B.Ø. A comprehensive genome-scale reconstruction of Escherichia coli metabolism--2011. Mol. Syst. Biol. 2011, 7, 535. [Google Scholar] [CrossRef]
- Leighty, R.W.; Antoniewicz, M.R. Dynamic metabolic flux analysis (DMFA): A framework for determining fluxex at metabolic non-steady state. Metab. Eng. 2011, 13, 745–755. [Google Scholar] [CrossRef]
- Martínez, V.S.; Buchsteiner, M.; Gray, P.; Nielsen, L.K.; Quek, L.E. Dynamic metabolic flux analysis using B-splines to study the effects of temperature shift on CHO cell metabolism. Metab. Eng. Commun. 2015, 2, 46–57. [Google Scholar] [CrossRef]
- Sands, P.J.; Voit, E.O. Flux-based estimation of parameters in S-systems. Ecolog. Modell. 1996, 93, 75–88. [Google Scholar] [CrossRef]
- Goel, G.; Chou, I.C.; Voit, E.O. System estimation from metabolic time-series data. Bioinformatics 2008, 24, 2505–2511. [Google Scholar] [CrossRef]
- Chou, I.C.; Voit, E.O. Estimation of dynamic flux profiles from metabolic time series data. BMC Syst. Biol. 2012, 6, 84. [Google Scholar] [CrossRef]
- Iwata, M.; Sriyudthsak, K.; Hirai, M.Y.; Shiraishi, F. Estimation of kinetic parameters in an S-system equation model for a metabolic reaction system using the Newton-Raphson method. Math. Biosci. 2014, 248, 11–21. [Google Scholar] [CrossRef]
- Miyawaki, A.; Sriydthsak, K.; Hirai, M.Y.; Shiraishi, F. A new parametric method to smooth time-seriese data of metabolites in metabolic networks. Math. Biosci. 2016, 282, 21–33. [Google Scholar] [CrossRef]
- Iwata, M.; Miyawaki-Kuwakado, A.; Yoshida, E.; Komori, S.; Shiraishi, F. Evaluation of an S-system root-finding method for estimating parameters in a metabolic reaction model. Math. Biosci. 2018, 301, 21–31. [Google Scholar] [CrossRef]
- Sauer, U.; Lasko, D.R.; Fiaux, J.; Hochuli, M.; Glaser, R.; Szyperski, T.; Wüthrich, K.; Bailey, J.E. Metabolic flux ratio analysis of genetic and environmental modulations of Escherichia coli central carbon metabolism. J. Bacteriol. 1999, 181, 6679–6688. [Google Scholar] [CrossRef]
© 2020 by the authors. Licensee MDPI, Basel, Switzerland. This article is an open access article distributed under the terms and conditions of the Creative Commons Attribution (CC BY) license (http://creativecommons.org/licenses/by/4.0/).


