An Integrated Multi-Omics Analysis Defines Key Pathway Alterations in a Diet-Induced Obesity Mouse Model

 ,
,  , ,
, ,
Abstract
1. Introduction
2. Results
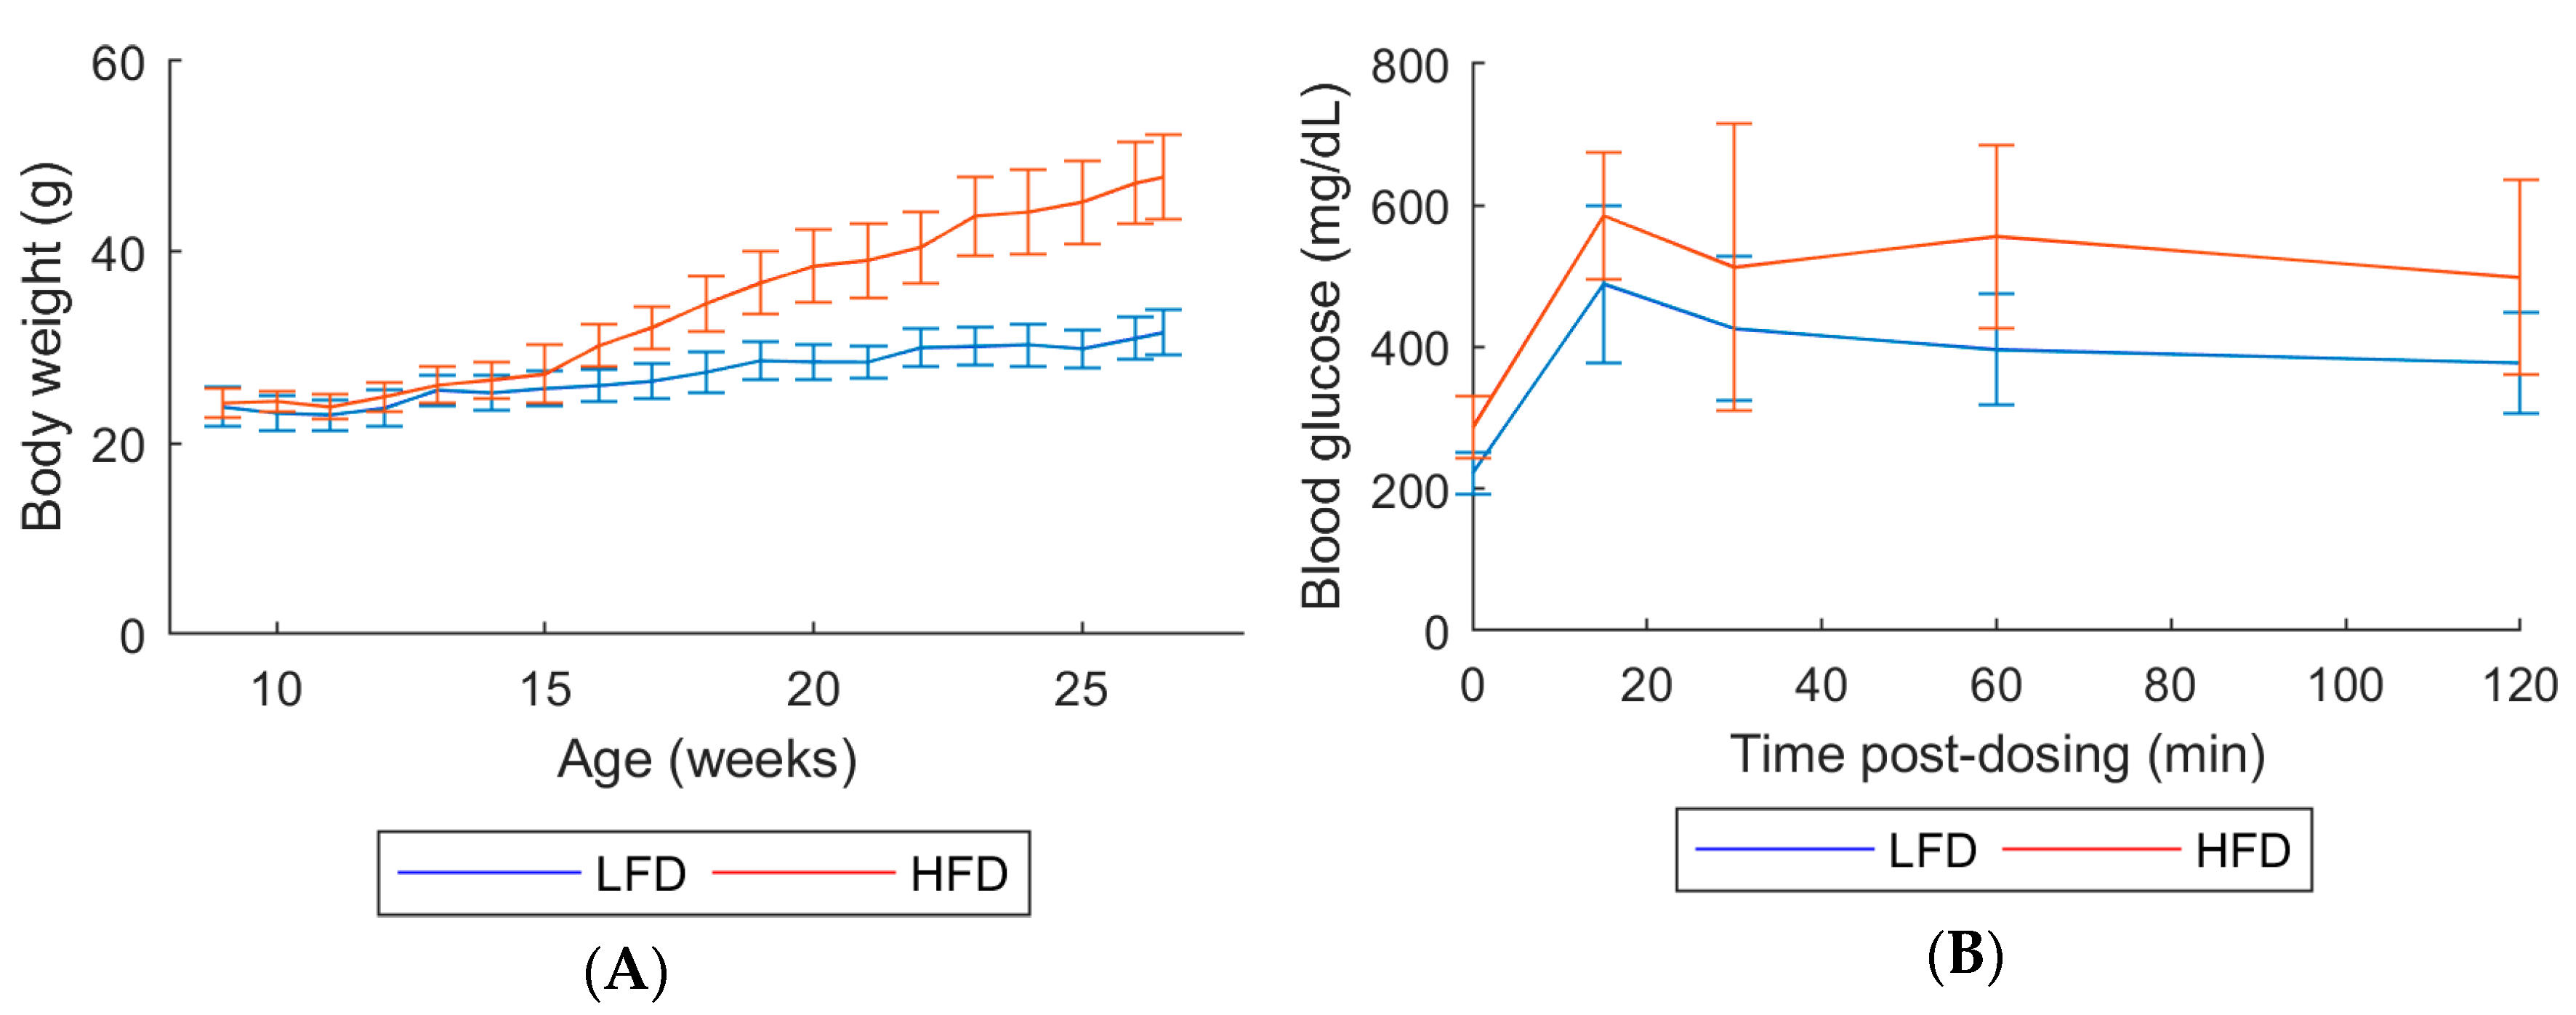
2.1. In-Life Parameters and Organ Weights
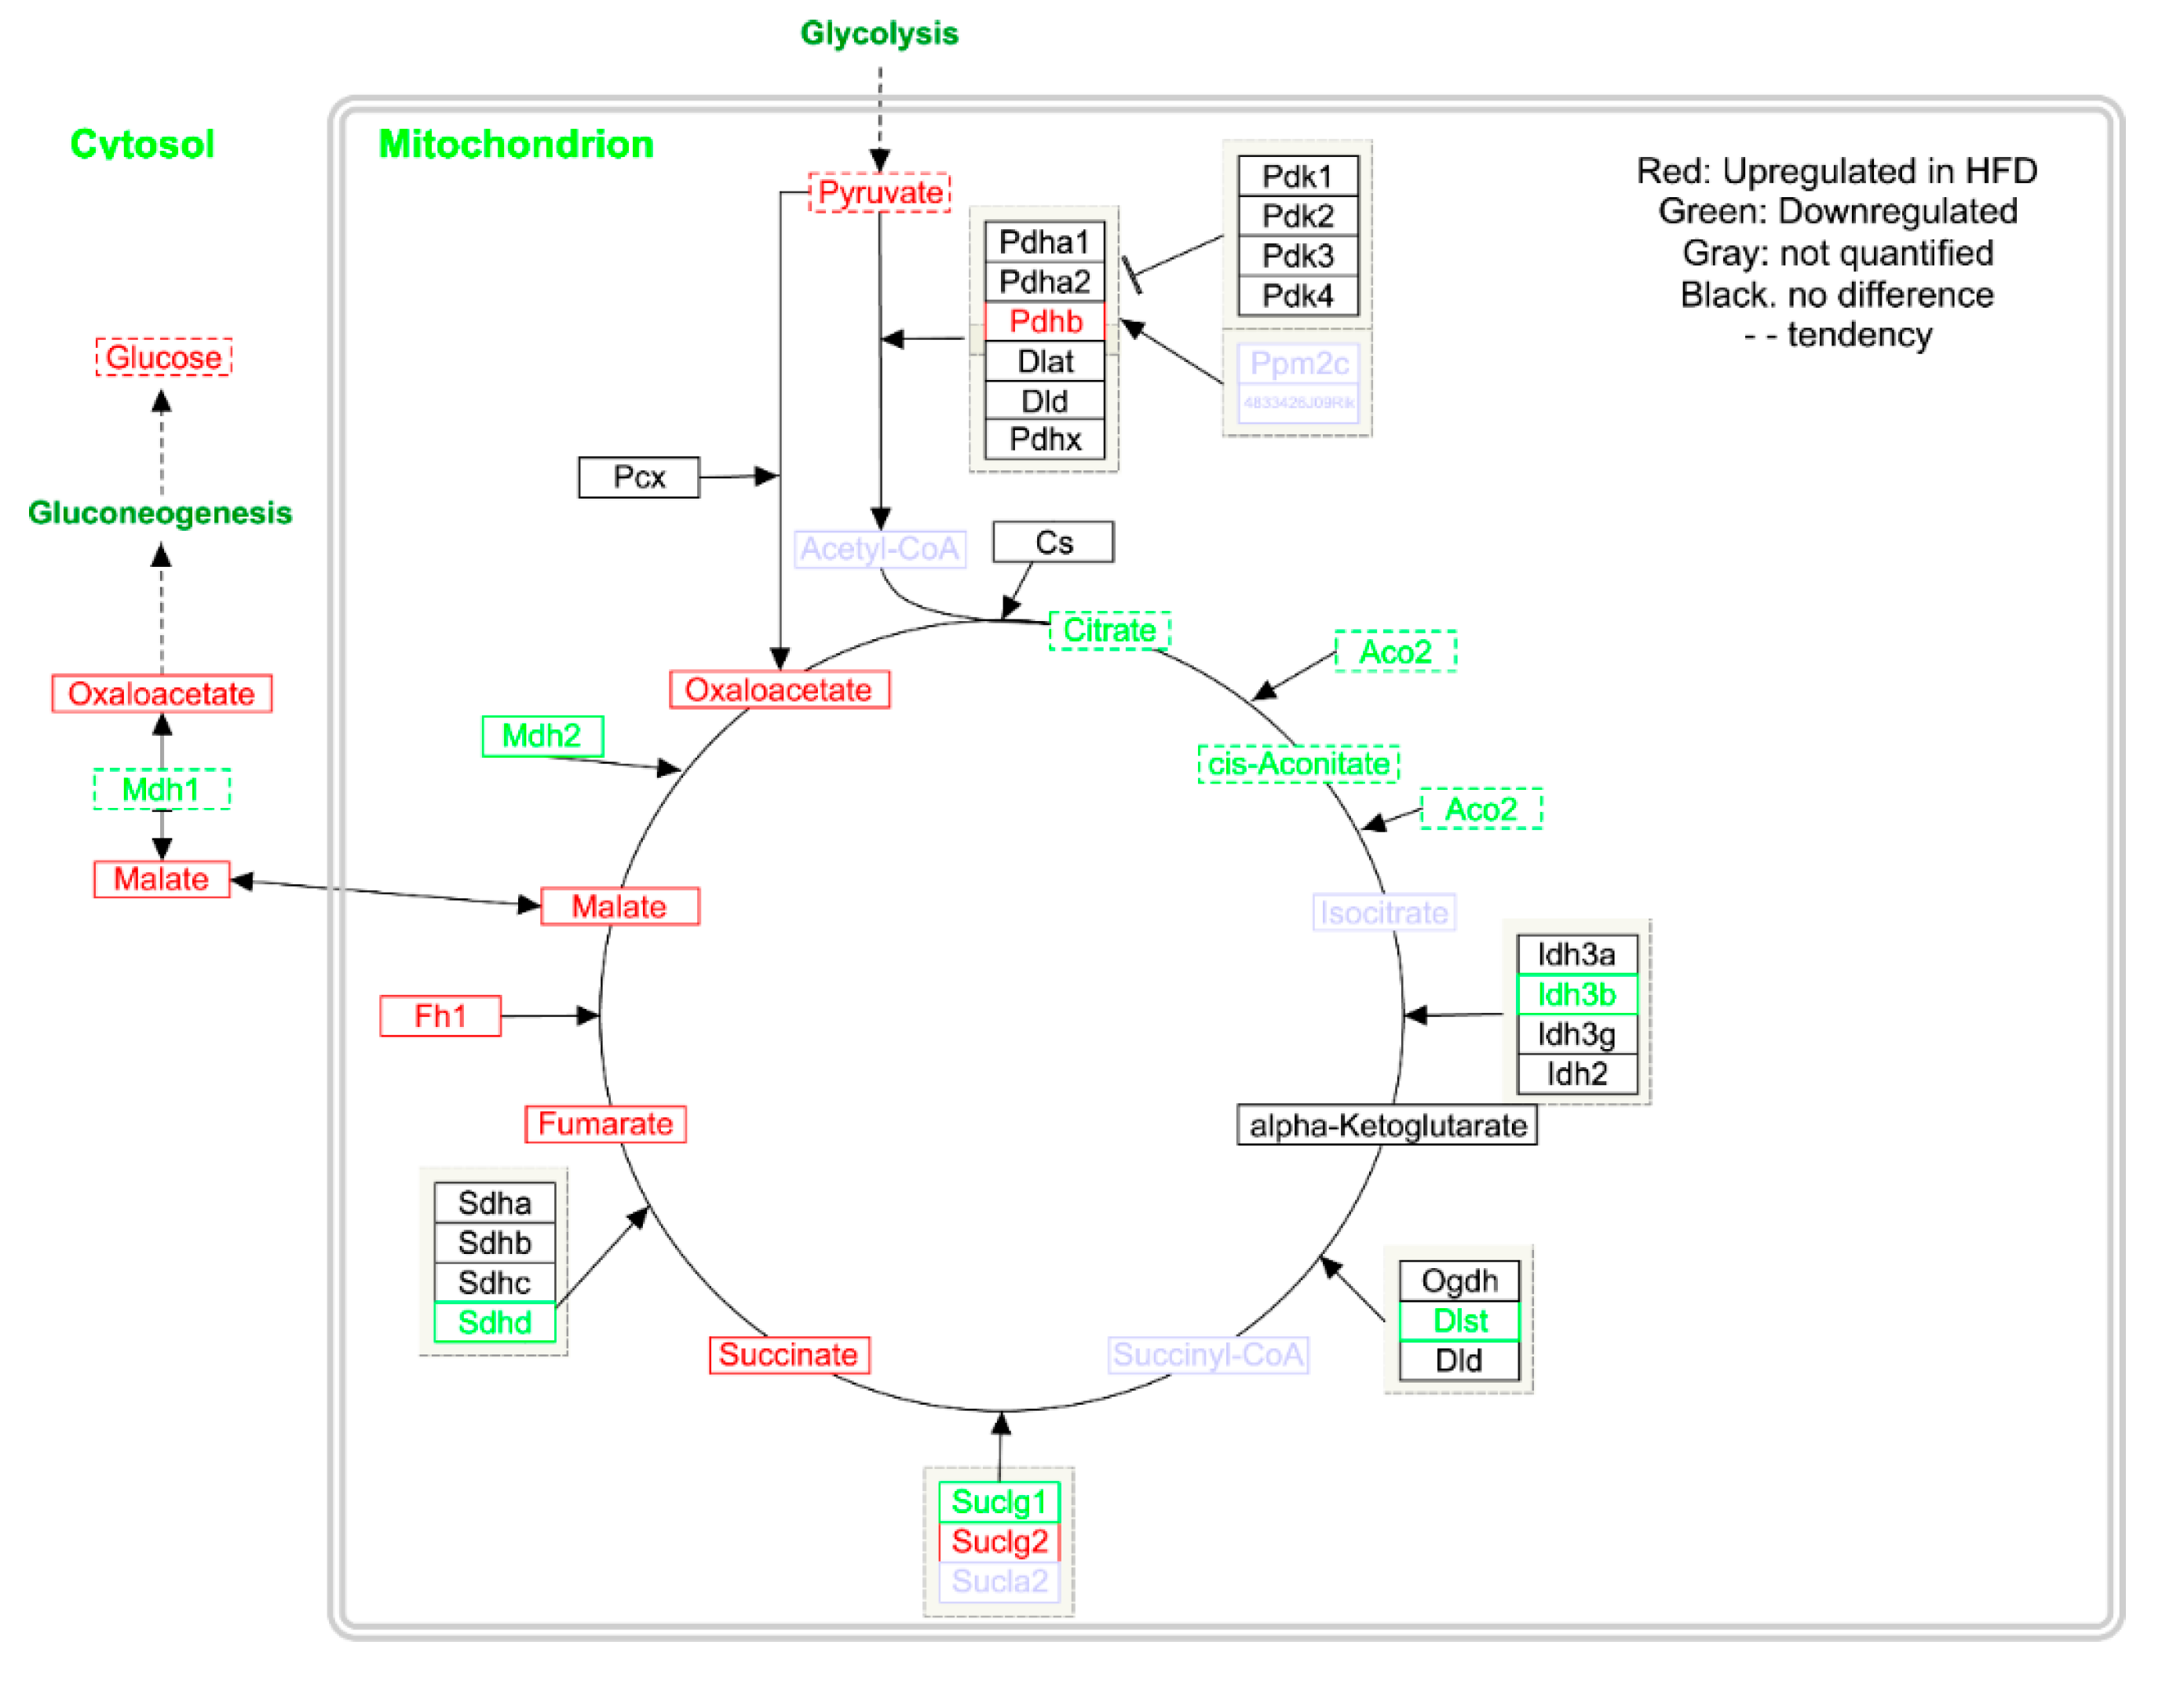
2.2. Gene Expression
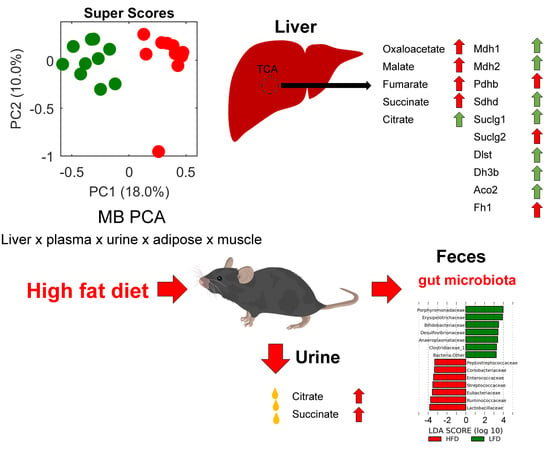
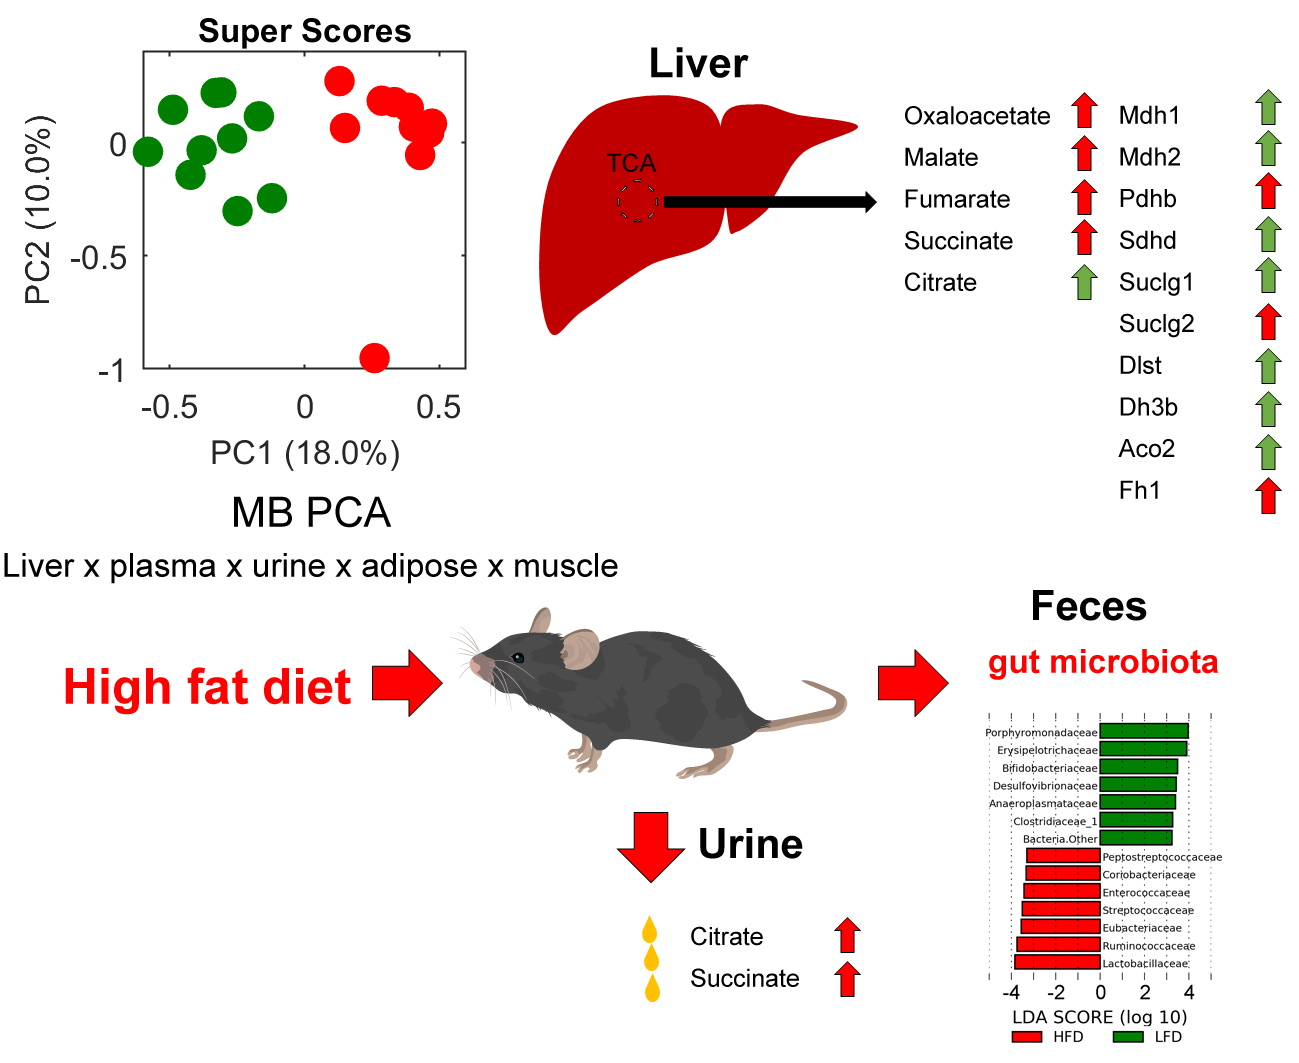
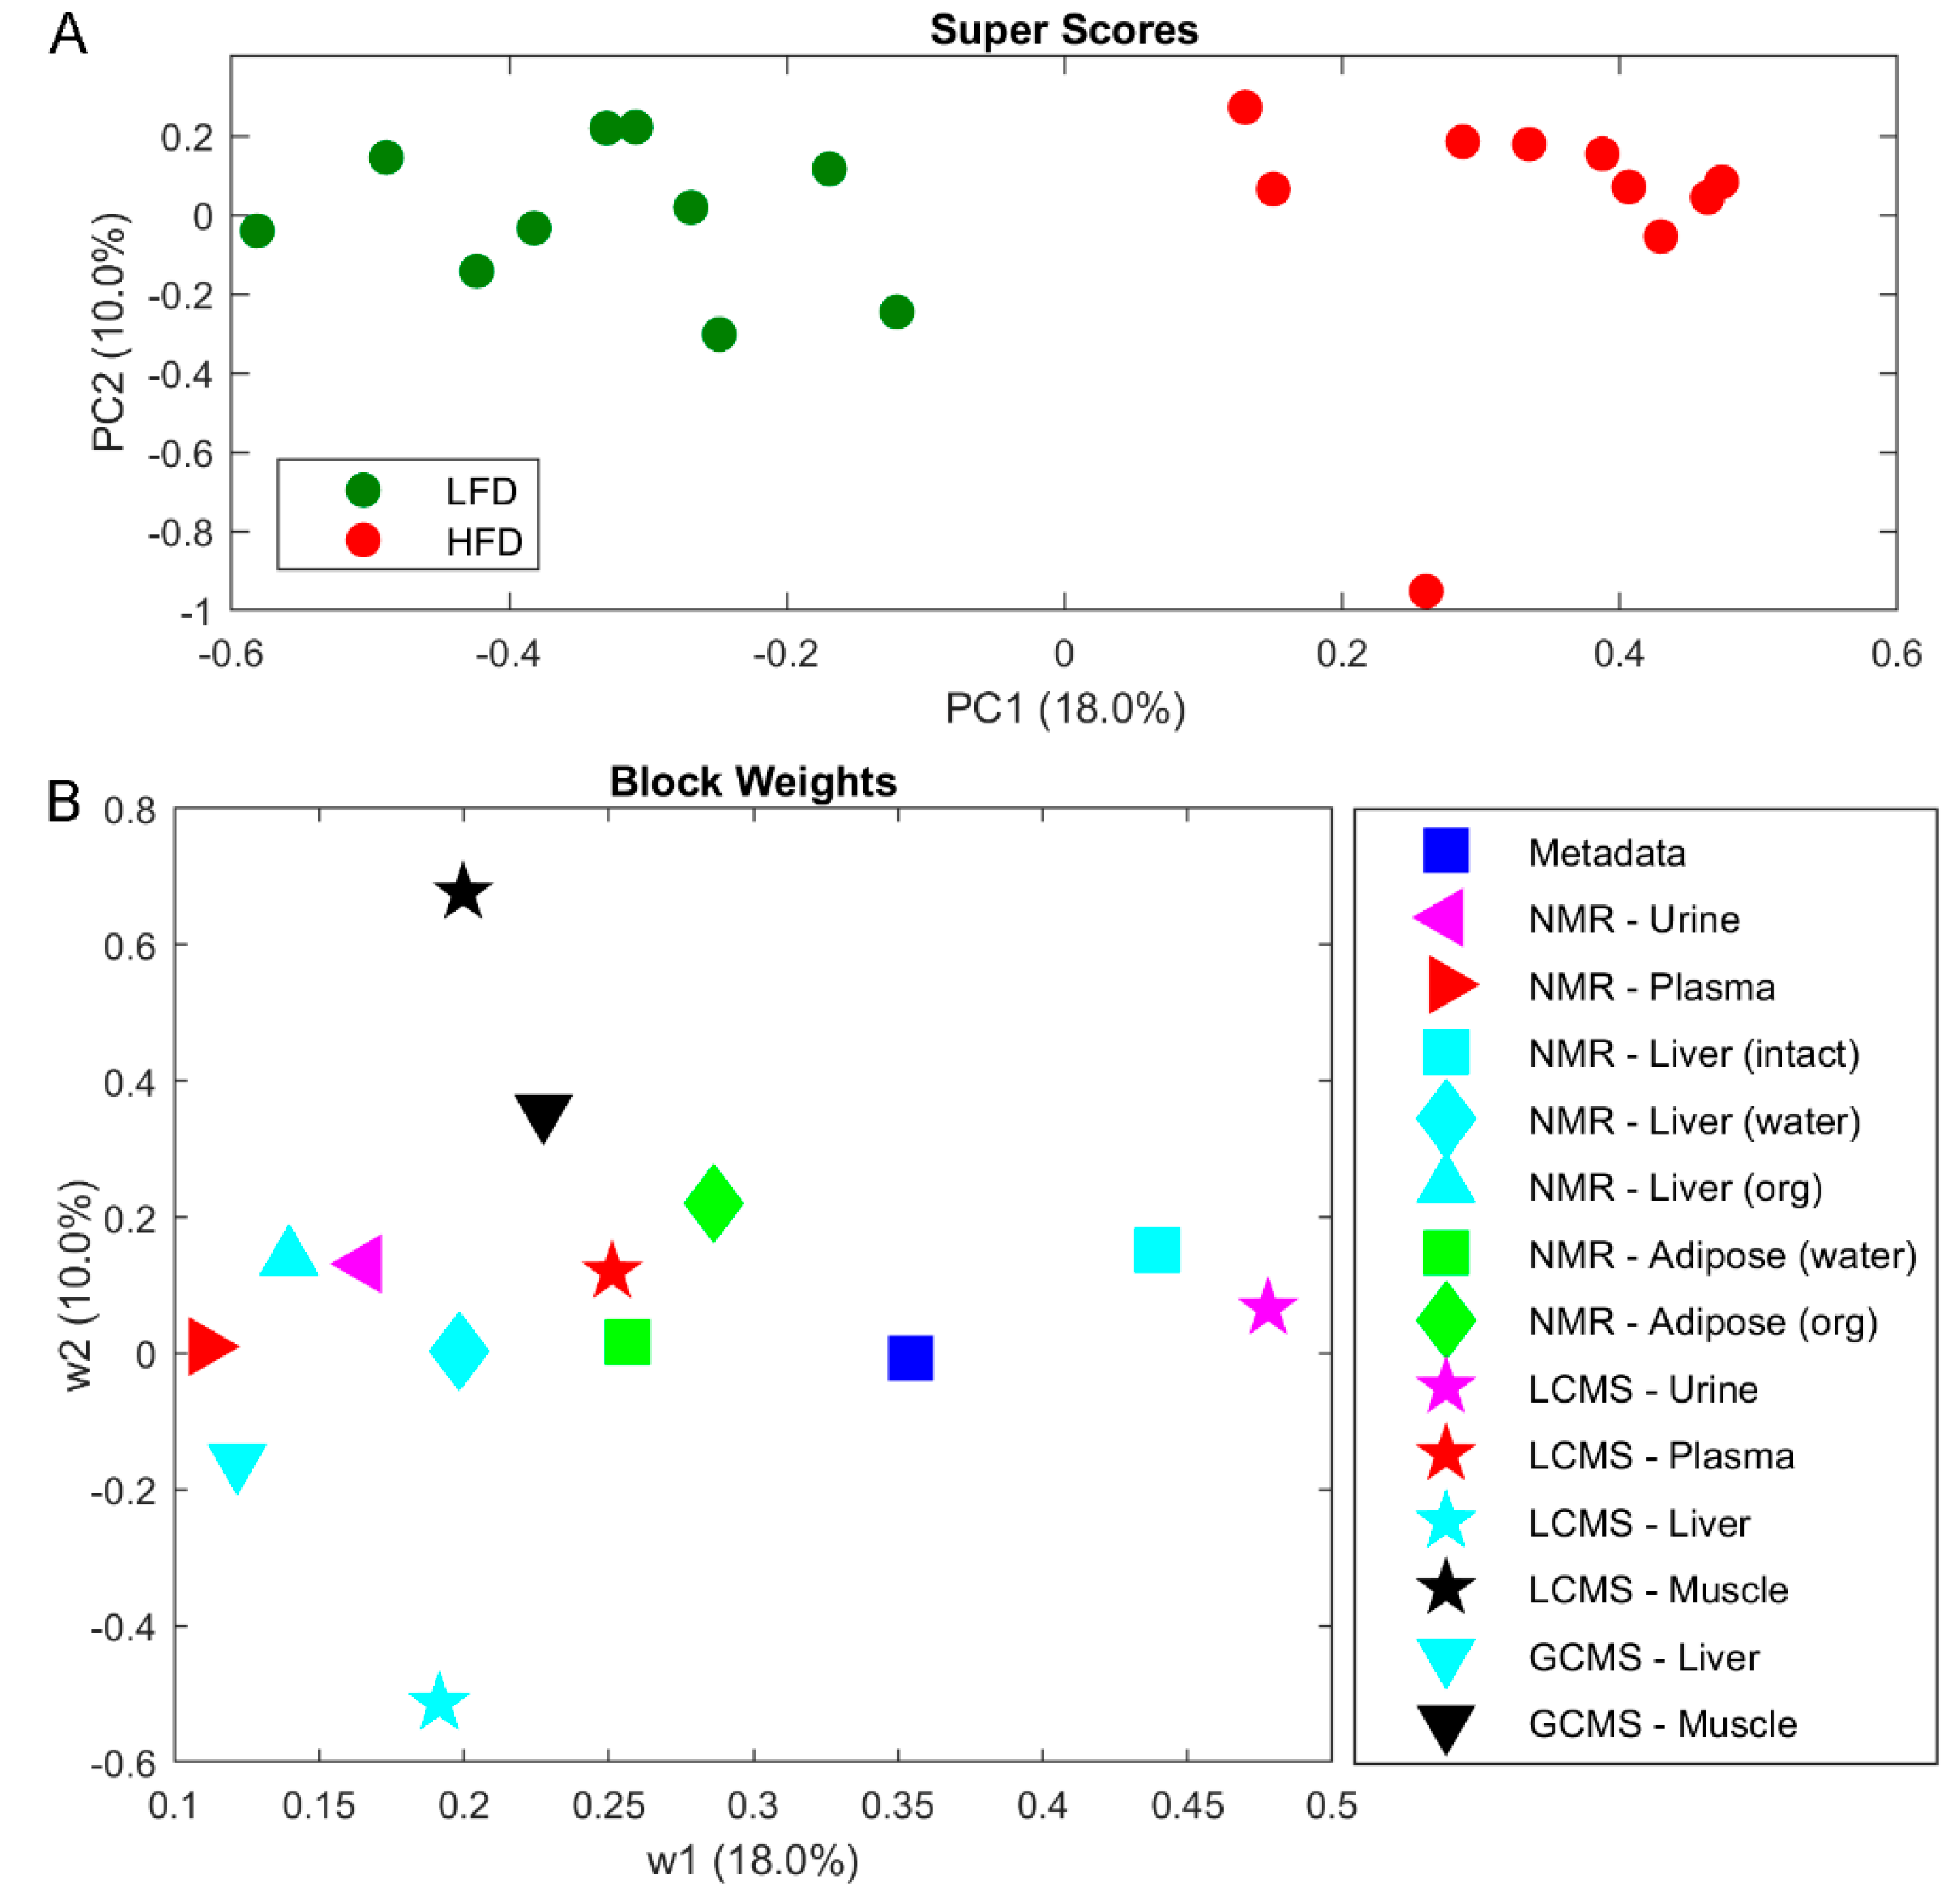
2.3. Metabolomics
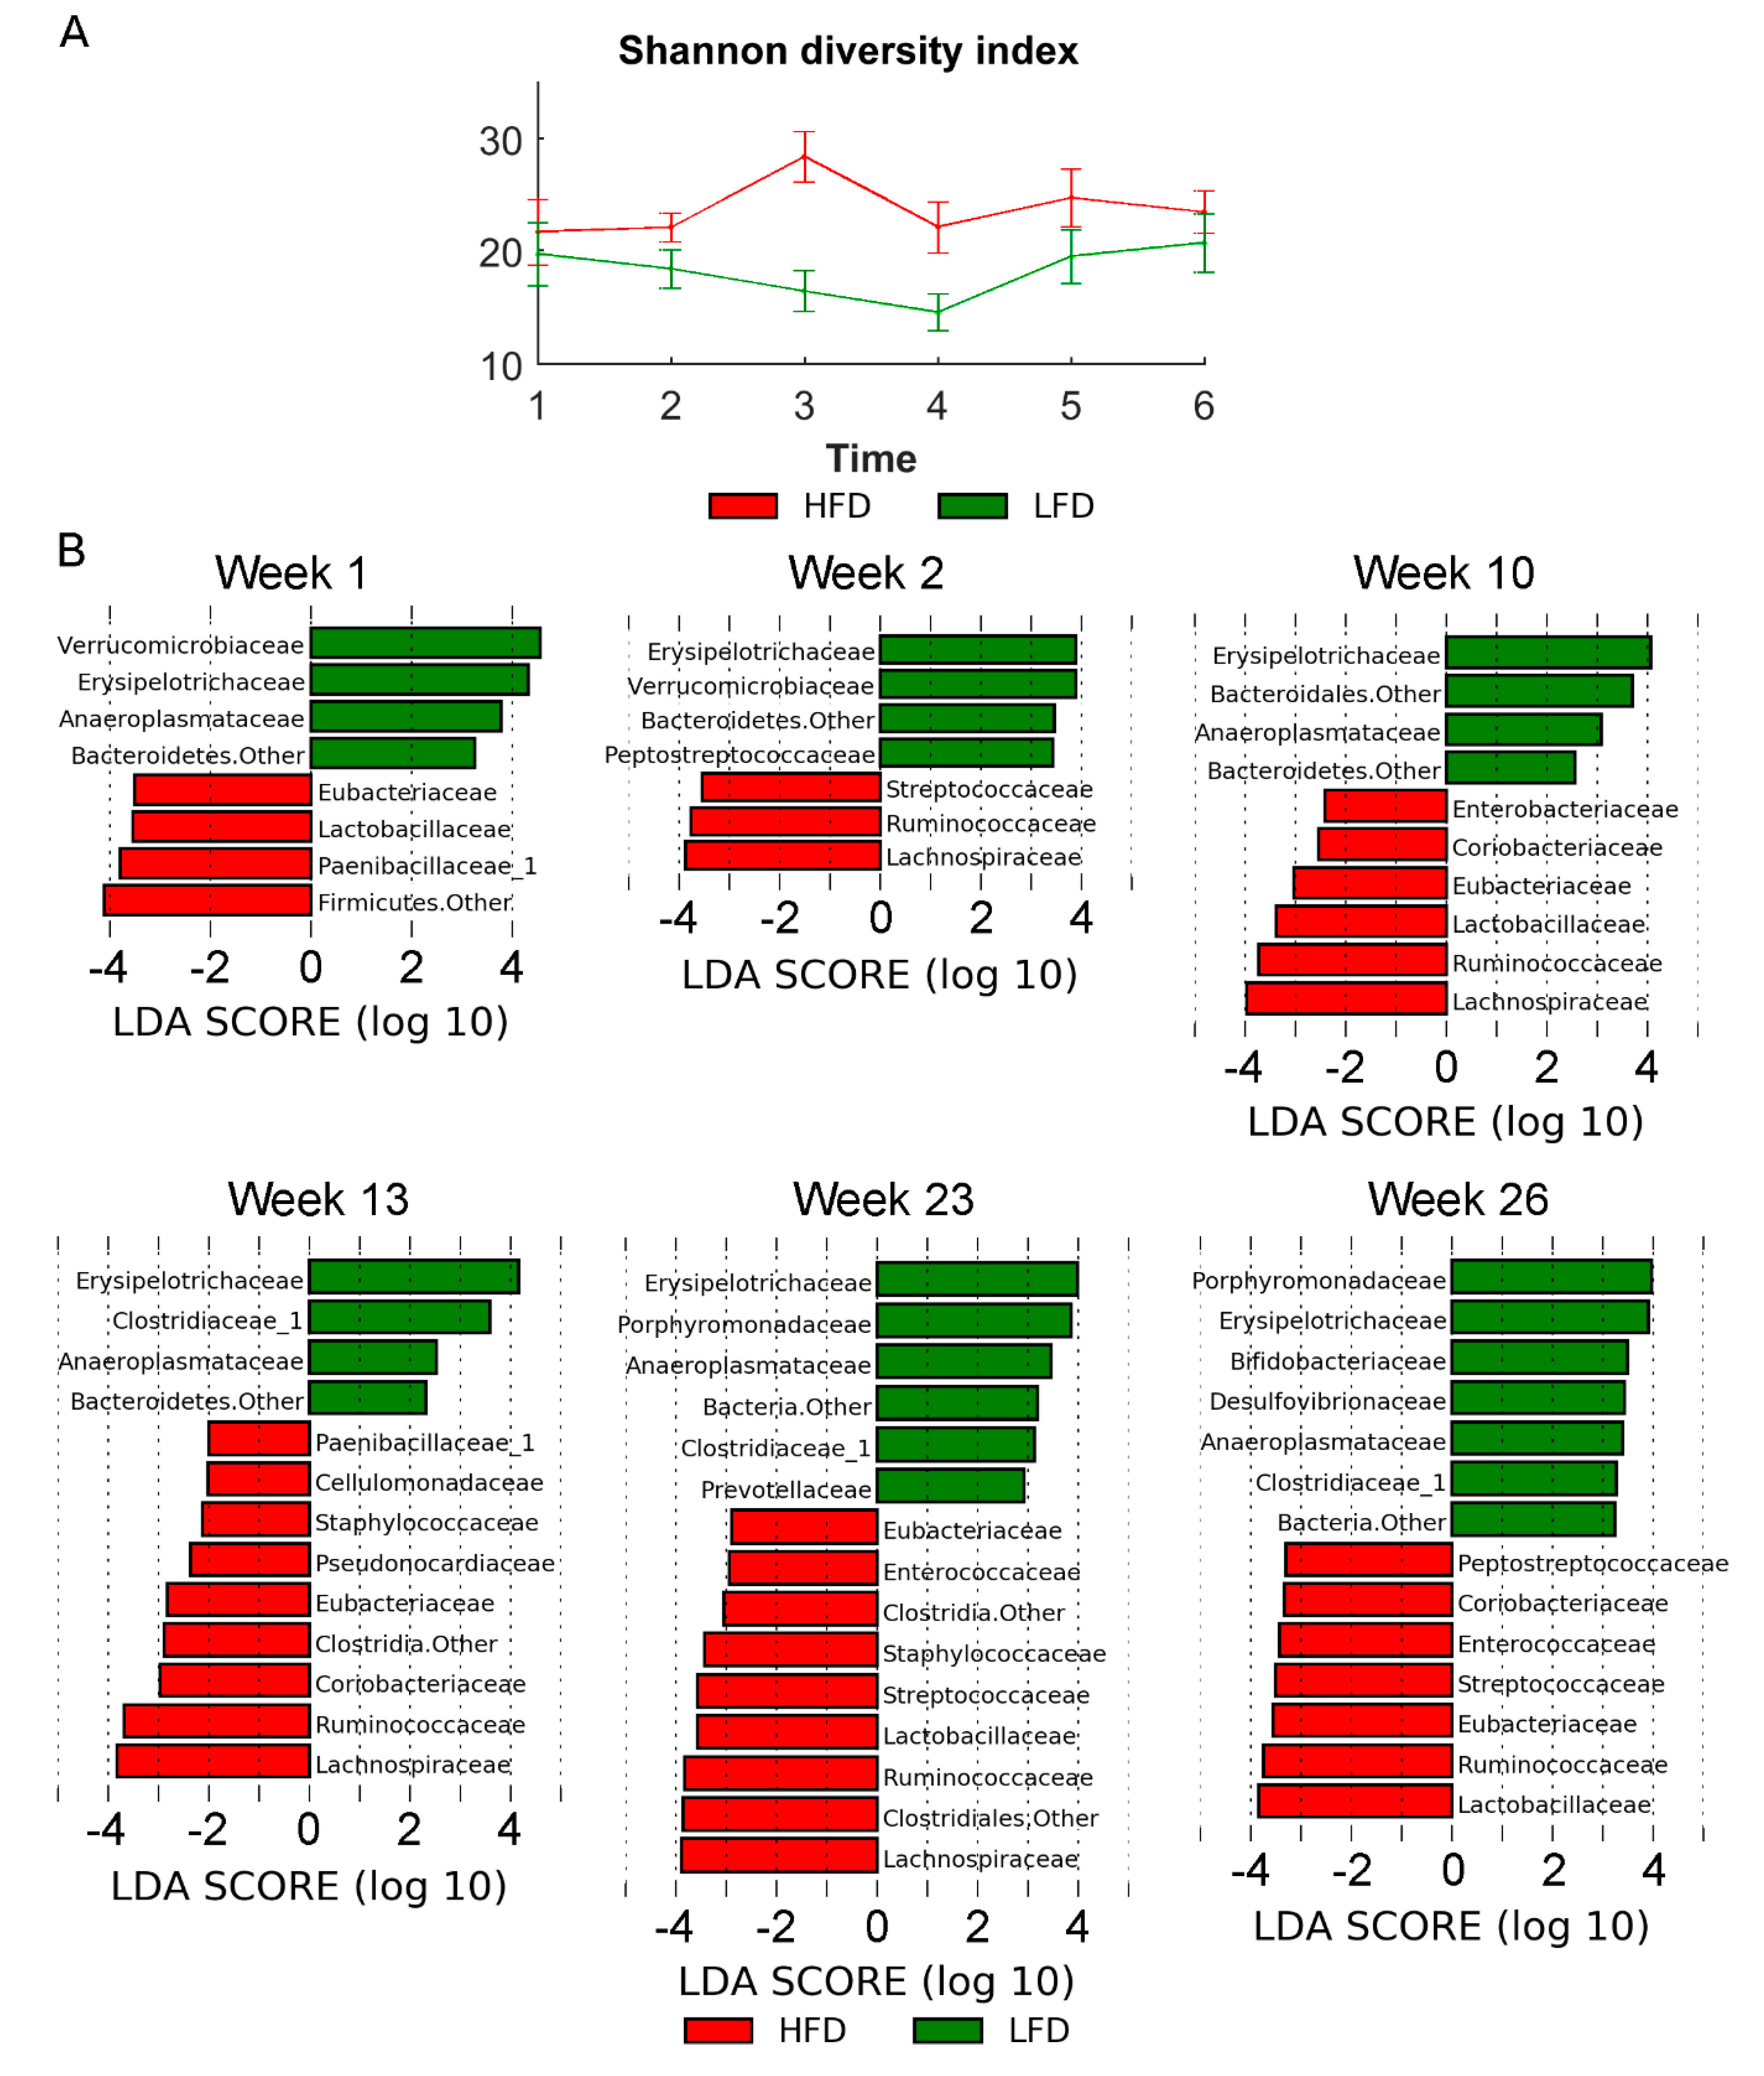
2.4. Metagenomics
3. Discussion
4. Materials and Methods
4.1. Animals
4.2. Gene Expression, Data Generation and Analysis
4.3. Metabolomics
4.3.1. NMR Spectroscopy
4.3.2. LC-MS Analysis on Urine and Plasma
4.3.3. LC-MS Analysis on Tissue Samples
4.3.4. GC-MS Analysis
4.4. Metagenomics Data Generation and Analysis
Supplementary Materials
Author Contributions
Funding
Acknowledgments
Conflicts of Interest
References
- World Health Organization. Obesity and Overweight. Available online: https://www.who.int/en/news-room/fact-sheets/detail/obesity-and-overweight (accessed on 27 November 2019).
- Eckel, R.H.; Alberti, K.G.M.M.; Grundy, S.M.; Zimmet, P.Z.; Church, T.; Blair, S. The metabolic syndrome. Lancet (Lond. Engl.) 2010, 375, 181–183. [Google Scholar] [CrossRef]
- Hotamisligil, G.S. Inflammation and metabolic disorders. Nature 2006, 444, 860–867. [Google Scholar] [CrossRef]
- Stenman, L.K.; Lehtinen, M.J.; Meland, N.; Christensen, J.E.; Yeung, N.; Saarinen, M.T.; Courtney, M.; Burcelin, R.; Lähdeaho, M.-L.; Linros, J.; et al. Probiotic with or without fiber controls body fat mass, associated with serum zonulin, in overweight and obese adults—Randomized controlled trial. EBioMedicine 2016, 13, 190–200. [Google Scholar] [CrossRef] [PubMed]
- Cani, P.D.; Amar, J.; Iglesias, M.A.; Poggi, M.; Knauf, C.; Bastelica, D.; Neyrinck, A.M.; Fava, F.; Tuohy, K.M.; Chabo, C.; et al. Metabolic endotoxemia initiates obesity and insulin resistance. Diabetes 2007, 56, 1761–1772. [Google Scholar] [CrossRef] [PubMed]
- Brun, P.; Castagliuolo, I.; Leo, V.D.; Buda, A.; Pinzani, M.; Palù, G.; Martines, D. Increased intestinal permeability in obese mice: New evidence in the pathogenesis of nonalcoholic steatohepatitis. Am. J. Physiol. Liver Physiol. 2007, 292, G518–G525. [Google Scholar] [CrossRef] [PubMed]
- Stenman, L.K.; Holma, R.; Korpela, R. High-fat-induced intestinal permeability dysfunction associated with altered fecal bile acids. World J. Gastroenterol. 2012, 18, 923–929. [Google Scholar] [CrossRef] [PubMed]
- Surwit, R.S.; Kuhn, C.M.; Cochrane, C.; McCubbin, J.A.; Feinglos, M.N. Diet-induced type II diabetes in C57BL/6J mice. Diabetes 1988, 37, 1163–1167. [Google Scholar] [CrossRef]
- Sinasac, D.S.; Riordan, J.D.; Spiezio, S.H.; Yandell, B.S.; Croniger, C.M.; Nadeau, J.H. Genetic control of obesity, glucose homeostasis, dyslipidemia and fatty liver in a mouse model of diet-induced metabolic syndrome. Int. J. Obes. 2016, 40, 346–355. [Google Scholar] [CrossRef]
- Buettner, R.; Schölmerich, J.; Bollheimer, L.C. High-fat diets: Modeling the metabolic disorders of human obesity in rodents. Obesity 2007, 15, 798–808. [Google Scholar] [CrossRef]
- Stenman, L.K.; Burcelin, R.; Lahtinen, S. Establishing a causal link between gut microbes, body weight gain and glucose metabolism in humans—Towards treatment with probiotics. Benef. Microbes 2016, 7, 11–22. [Google Scholar] [CrossRef]
- Turnbaugh, P.J.; Bäckhed, F.; Fulton, L.; Gordon, J.I. Diet-induced obesity is linked to marked but reversible alterations in the mouse distal gut microbiome. Cell Host Microbe 2008, 3, 213–223. [Google Scholar] [CrossRef] [PubMed]
- Armenise, C.; Lefebvre, G.; Carayol, J.; Bonnel, S.; Bolton, J.; Di Cara, A.; Gheldof, N.; Descombes, P.; Langin, D.; Saris, W.H.; et al. Transcriptome profiling from adipose tissue during a low-calorie diet reveals predictors of weight and glycemic outcomes in obese, nondiabetic subjects. Am. J. Clin. Nutr. 2017, 106, 736–746. [Google Scholar] [CrossRef] [PubMed]
- Shearer, J.; Duggan, G.; Weljie, A.; Hittel, D.S.; Wasserman, D.H.; Vogel, H.J. Metabolomic profiling of dietary-induced insulin resistance in the high fat-fed C57BL/6J mouse. Diabetes Obes. Metab. 2008, 10, 950–958. [Google Scholar] [CrossRef]
- Montoliu, I.; Cominetti, O.; Boulangé, C.L.; Berger, B.; Siddharth, J.; Nicholson, J.; Martin, F.-P.J. Modeling longitudinal metabonomics and microbiota interactions in C57BL/6 mice fed a high fat diet. Anal. Chem. 2016, 88, 7617–7626. [Google Scholar] [CrossRef] [PubMed]
- Spranger, J.; Kroke, A.; Möhlig, M.; Hoffmann, K.; Bergmann, M.M.; Ristow, M.; Boeing, H.; Pfeiffer, A.F.H. Inflammatory cytokines and the risk to develop type 2 diabetes: Results of the prospective population-based European Prospective Investigation into Cancer and Nutrition (EPIC)-Potsdam study. Diabetes 2003, 52, 812–817. [Google Scholar] [CrossRef] [PubMed]
- De Roover, K.; Ceulemans, E.; Timmerman, M.E. How to perform multiblock component analysis in practice. Behav. Res. Methods 2012, 44, 41–56. [Google Scholar] [CrossRef]
- Patel, D.P.; Krausz, K.W.; Xie, C.; Beyoğlu, D.; Gonzalez, F.J.; Idle, J.R. Metabolic profiling by gas chromatography-mass spectrometry of energy metabolism in high-fat diet-fed obese mice. PLoS ONE 2017, 12, e0177953. [Google Scholar] [CrossRef]
- Satapati, S.; Sunny, N.E.; Kucejova, B.; Fu, X.; He, T.T.; Méndez-Lucas, A.; Shelton, J.M.; Perales, J.C.; Browning, J.D.; Burgess, S.C. Elevated TCA cycle function in the pathology of diet-induced hepatic insulin resistance and fatty liver. J. Lipid Res. 2012, 53, 1080–1092. [Google Scholar] [CrossRef]
- Boulangé, C.L.; Claus, S.P.; Chou, C.J.; Collino, S.; Montoliu, I.; Kochhar, S.; Holmes, E.; Rezzi, S.; Nicholson, J.K.; Dumas, M.E.; et al. Early metabolic adaptation in C57BL/6 mice resistant to high fat diet induced weight gain involves an activation of mitochondrial oxidative pathways. J. Proteome Res. 2013, 12, 1956–1968. [Google Scholar] [CrossRef]
- Rauckhorst, A.J.; Gray, L.R.; Sheldon, R.D.; Fu, X.; Pewa, A.D.; Feddersen, C.R.; Dupuy, A.J.; Gibson-Corley, K.N.; Cox, J.E.; Burgess, S.C.; et al. The mitochondrial pyruvate carrier mediates high fat diet-induced increases in hepatic TCA cycle capacity. Mol. Metab. 2017, 6, 1468–1479. [Google Scholar] [CrossRef]
- Kieffer, D.A.; Piccolo, B.D.; Marco, M.L.; Kim, E.B.; Goodson, M.L.; Keenan, M.J.; Dunn, T.N.; Knudsen, K.E.B.; Martin, R.J.; Adams, S.H. Mice fed a high-fat diet supplemented with resistant starch display marked shifts in the liver metabolome concurrent with altered gut bacteria. J. Nutr. 2016, 146, 2476–2490. [Google Scholar] [CrossRef] [PubMed]
- Ley, R.E.; Backhed, F.; Turnbaugh, P.; Lozupone, C.A.; Knight, R.D.; Gordon, J.I. Obesity alters gut microbial ecology. Proc. Natl. Acad. Sci. USA 2005, 102, 11070–11075. [Google Scholar] [CrossRef] [PubMed]
- Bisanz, J.E.; Upadhyay, V.; Turnbaugh, J.A.; Ly, K.; Turnbaugh, P.J. Meta-analysis reveals reproducible gut microbiome alterations in response to a high-fat diet. Cell Host Microbe 2019, 26, 265–272.e4. [Google Scholar] [CrossRef] [PubMed]
- Peters, B.A.; Shapiro, J.A.; Church, T.R.; Miller, G.; Trinh-Shevrin, C.; Yuen, E.; Friedlander, C.; Hayes, R.B.; Ahn, J. A taxonomic signature of obesity in a large study of American adults. Sci. Rep. 2018, 8, 1–13. [Google Scholar] [CrossRef] [PubMed]
- Santos-Marcos, J.A.; Perez-Jimenez, F.; Camargo, A. The role of diet and intestinal microbiota in the development of metabolic syndrome. J. Nutr. Biochem. 2019, 70, 1–27. [Google Scholar] [CrossRef] [PubMed]
- Aguilar, J.A.; Nilsson, M.; Bodenhausen, G.; Morris, G.A. Spin echo NMR spectra without J modulation. Chem. Commun. 2012, 48, 811–813. [Google Scholar] [CrossRef]
- Savorani, F.; Tomasi, G.; Engelsen, S.B. icoshift: A versatile tool for the rapid alignment of 1D NMR spectra. J. Magn. Reson. 2010, 202, 190–202. [Google Scholar] [CrossRef]
- Sousa, S.A.A.; Magalhães, A.; Ferreira, M.C. Optimized bucketing for NMR spectra: Three case studies. Chemom. Intell. Lab. Syst. 2013, 122, 93–102. [Google Scholar] [CrossRef]
- Tautenhahn, R.; Patti, G.J.; Rinehart, D.; Siuzdak, G. XCMS online: A web-based platform to process untargeted metabolomic data. Anal. Chem. 2012, 84, 5035–5039. [Google Scholar] [CrossRef]
- Pluskal, T.; Castillo, S.; Villar-Briones, A.; Oresic, M. MZmine 2: Modular framework for processing, visualizing, and analyzing mass spectrometry-based molecular profile data. BMC Bioinform. 2010, 11, 395. [Google Scholar] [CrossRef]
- Wishart, D.S.; Knox, C.; Guo, A.C.; Eisner, R.; Young, N.; Gautam, B.; Hau, D.D.; Psychogios, N.; Dong, E.; Bouatra, S.; et al. HMDB: A knowledgebase for the human metabolome. Nucleic Acids Res. 2008, 37, D603–D610. [Google Scholar] [CrossRef] [PubMed]
- Kutmon, M.; van Iersel, M.P.; Bohler, A.; Kelder, T.; Nunes, N.; Pico, A.R.; Evelo, C.T. PathVisio 3: An extendable pathway analysis toolbox. PLOS Comput. Biol. 2015, 11, e1004085. [Google Scholar] [CrossRef] [PubMed]
- Kozich, J.J.; Westcott, S.L.; Baxter, N.T.; Highlander, S.K.; Schloss, P.D. Development of a dual-index sequencing strategy and curation pipeline for analyzing amplicon sequence data on the MiSeq illumina sequencing platform. Appl. Environ. Microbiol. 2013, 79, 5112–5120. [Google Scholar] [CrossRef] [PubMed]
- Oksanen, J.; Blanchet, F.G.; Friendly, M.; Kindt, R.; Legendre, P.; McGlinn, D.; Minchin, P.R.; O’Hara, R.B.; Simpson, G.L.; Solymos, P.; et al. Vegan: Community Ecology Package. R Package Version 2.4-3 2017. Available online: https://cran.r-project.org/web/packages/vegan/index.html (accessed on 1 June 2017).
- Segata, N.; Izard, J.; Waldron, L.; Gevers, D.; Miropolsky, L.; Garrett, W.S.; Huttenhower, C. Metagenomic biomarker discovery and explanation. Genome Biol. 2011, 12, R60. [Google Scholar] [CrossRef]
- McMurdie, P.J.; Holmes, S. Phyloseq: An R package for reproducible interactive analysis and graphics of microbiome census data. PLoS ONE 2013, 8, e61217. [Google Scholar] [CrossRef]


| Metabolite | LFD | HFD |
|---|---|---|
| Acetate | 1.00 | 1.10 |
| Glucose | 1.00 | 1.27 |
| Pyruvate | 1.00 | 1.14 |
| Fumarate | 1.00 | 2.95* |
| cis-Aconitate | 1.00 | 0.83 |
| Citrate | 1.00 | 0.66 |
| Malate | 1.00 | 2.60 ** |
| Succinate | 1.00 | 1.65 * |
| Taurine | 1.00 | 0.89 |
| Oxaloacetate | 1.00 | 1.78 * |
| Oxoglutarate | 1.00 | 1.31 |
© 2020 by the authors. Licensee MDPI, Basel, Switzerland. This article is an open access article distributed under the terms and conditions of the Creative Commons Attribution (CC BY) license (http://creativecommons.org/licenses/by/4.0/).
Share and Cite
Sundekilde, U.K.; Yde, C.C.; Honore, A.H.; Caverly Rae, J.M.; Burns, F.R.; Mukerji, P.; Mawn, M.P.; Stenman, L.; Dragan, Y.; Glover, K.; et al. An Integrated Multi-Omics Analysis Defines Key Pathway Alterations in a Diet-Induced Obesity Mouse Model. Metabolites 2020, 10, 80. https://doi.org/10.3390/metabo10030080
Sundekilde UK, Yde CC, Honore AH, Caverly Rae JM, Burns FR, Mukerji P, Mawn MP, Stenman L, Dragan Y, Glover K, et al. An Integrated Multi-Omics Analysis Defines Key Pathway Alterations in a Diet-Induced Obesity Mouse Model. Metabolites. 2020; 10(3):80. https://doi.org/10.3390/metabo10030080
Chicago/Turabian StyleSundekilde, Ulrik K., Christian C. Yde, Anders H. Honore, Jessica M. Caverly Rae, Frank R. Burns, Pushkor Mukerji, Michael P. Mawn, Lotta Stenman, Yvonne Dragan, Kyle Glover, and et al. 2020. "An Integrated Multi-Omics Analysis Defines Key Pathway Alterations in a Diet-Induced Obesity Mouse Model" Metabolites 10, no. 3: 80. https://doi.org/10.3390/metabo10030080
APA StyleSundekilde, U. K., Yde, C. C., Honore, A. H., Caverly Rae, J. M., Burns, F. R., Mukerji, P., Mawn, M. P., Stenman, L., Dragan, Y., Glover, K., & Jensen, H. M. (2020). An Integrated Multi-Omics Analysis Defines Key Pathway Alterations in a Diet-Induced Obesity Mouse Model. Metabolites, 10(3), 80. https://doi.org/10.3390/metabo10030080