A Data Mining Metabolomics Exploration of Glaucoma
Abstract
1. Introduction
2. Results
3. Discussion
4. Materials and Methods
4.1. Chemicals and Reagents
4.2. Ethics Statement
4.3. Study Cohorts
4.4. Plasma Sample Collection and Metabolites Extraction
4.5. Metabolomics Profiling
4.6. Statistical Analyses and Features Selection
- (1)
- Principal component analysis (PCA) was employed to provide an overview of the population structure and to ensure clustering of the pooled quality controls (QCs). Hotelling’s T2 and DModX plots were visually inspected for detecting outliers. The analysis was performed using SIMCA-P v.14.0 (Umetrics, Umea, Sweden);
- (2)
- Univariate analysis was performed using the non-parametric Wilcoxon rank sum test with Benjamini–Hochberg correction and keeping the False Discovery Rate (FDR) below 5%. Features were further filtered according to their fold change (FC) and only metabolites with a FC greater than 1.5 were further considered. These analyses were conducted using Metaboanalyst v4.0 [25];
- (3)
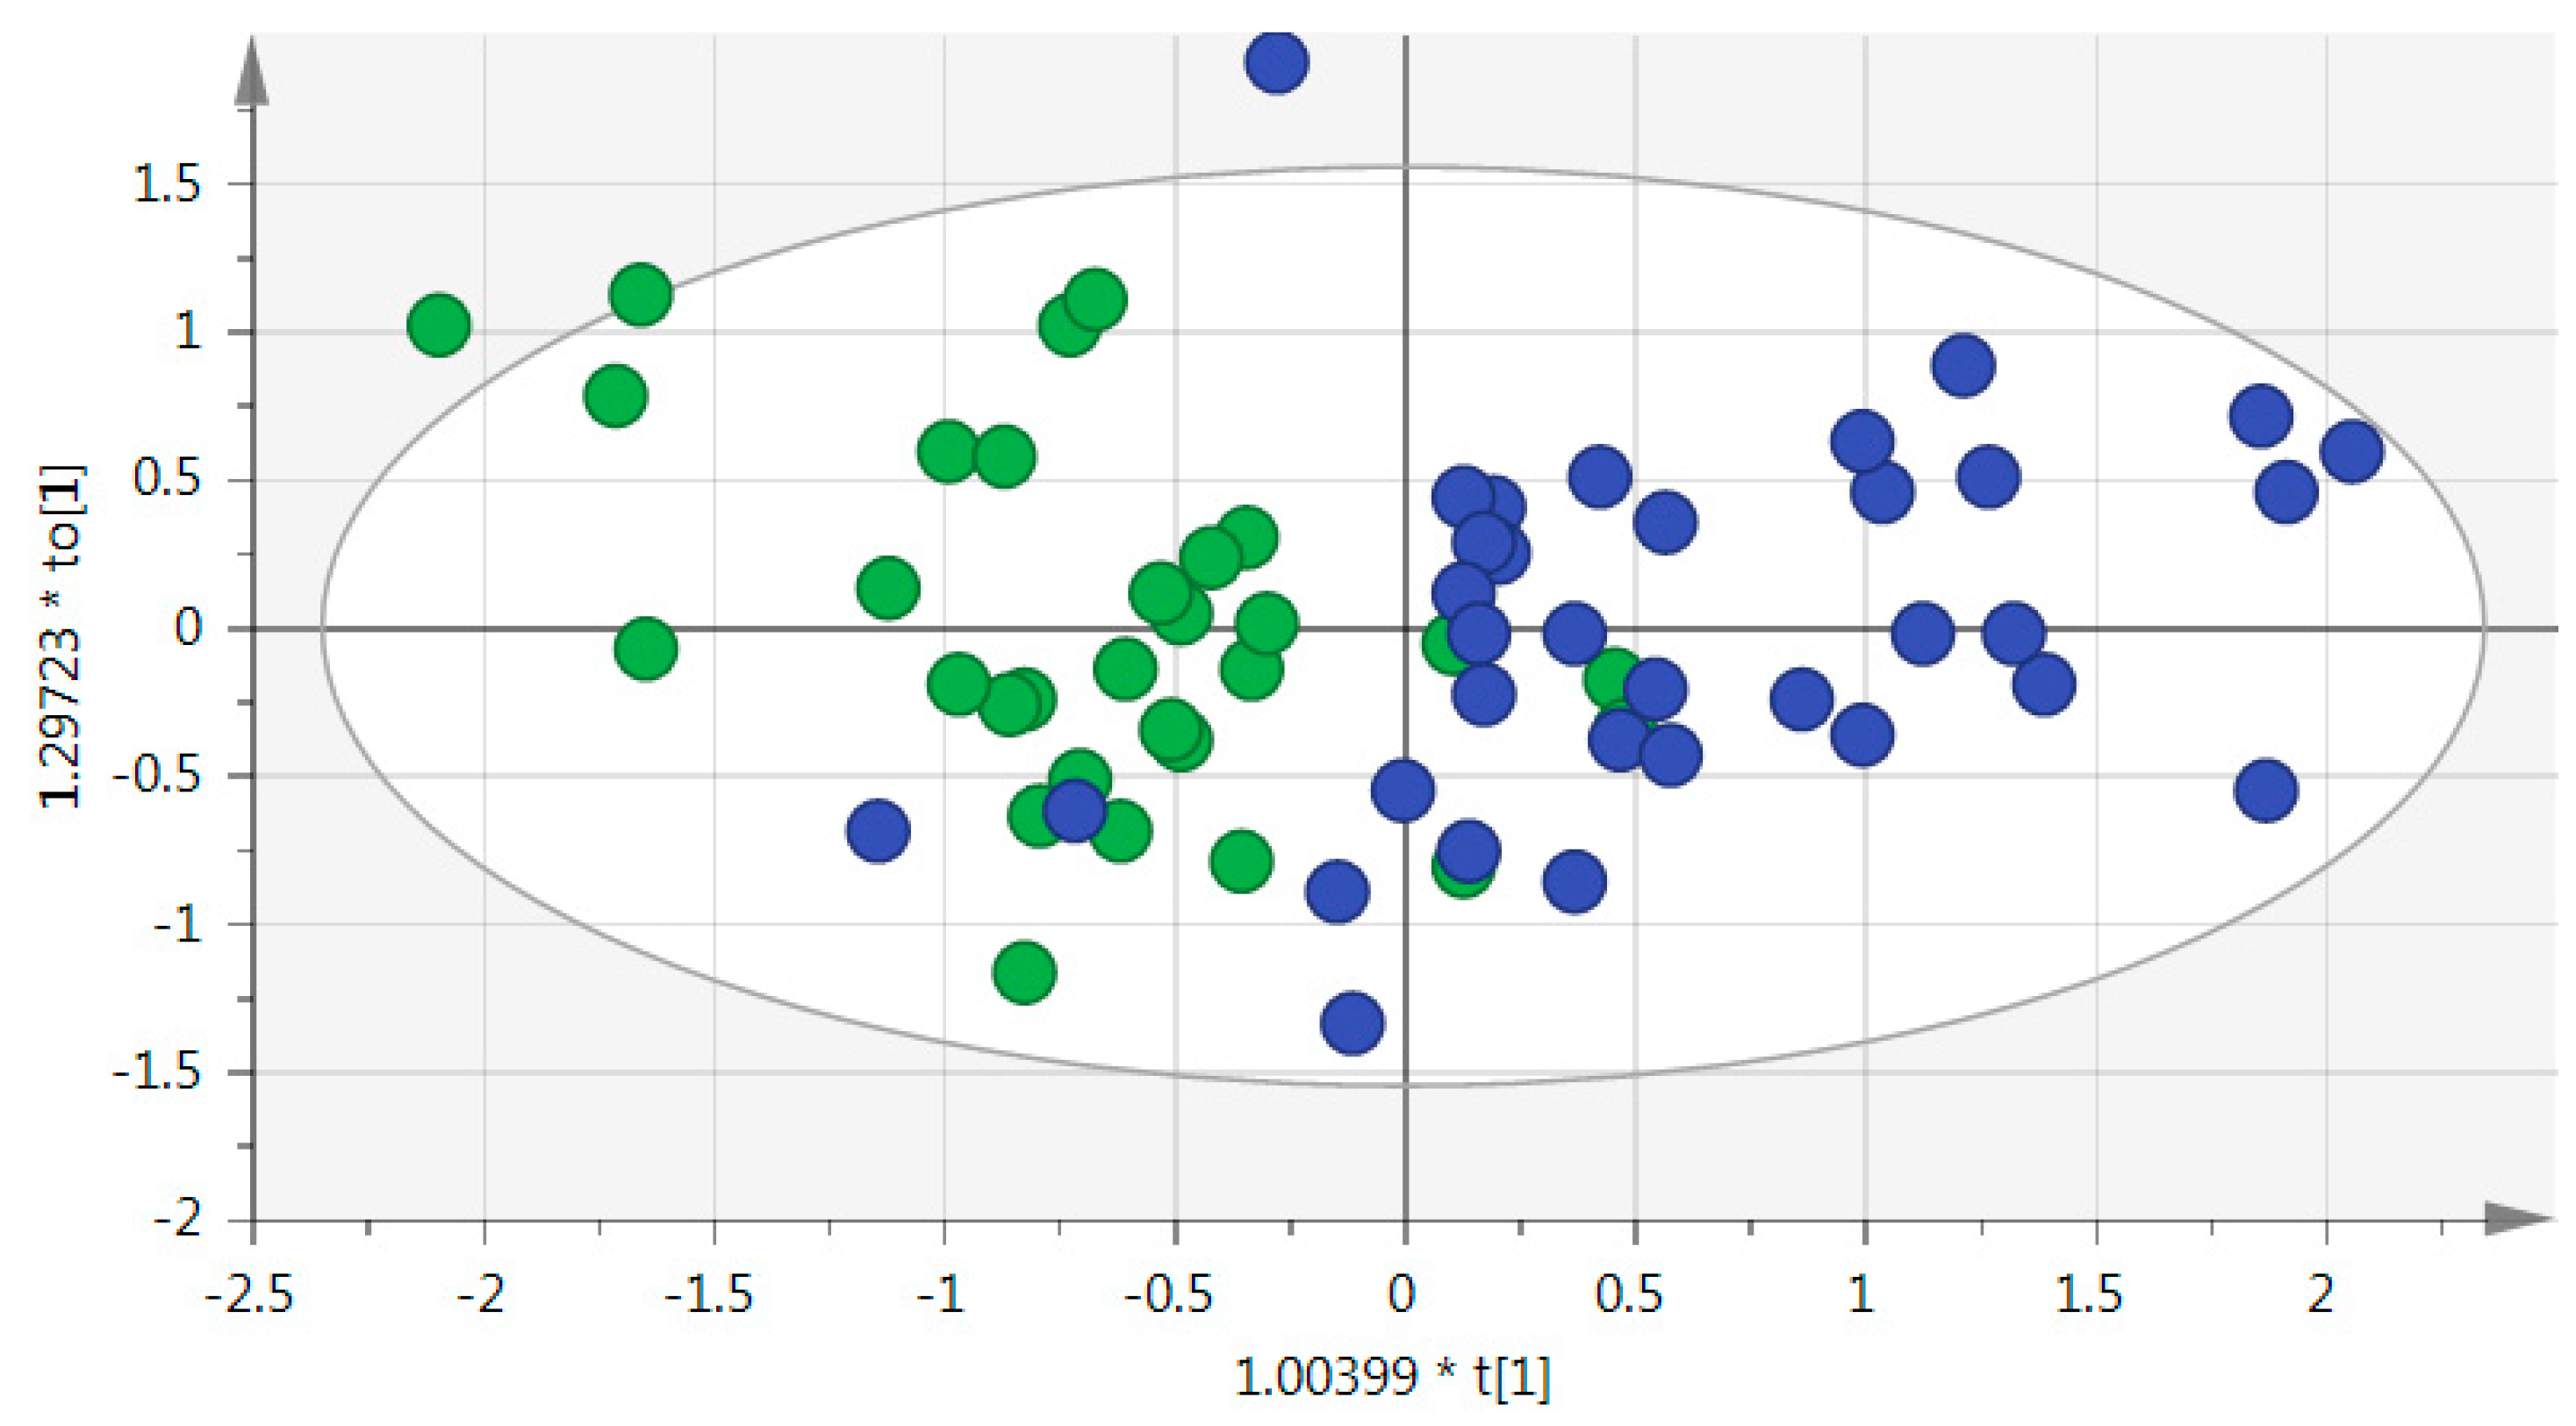
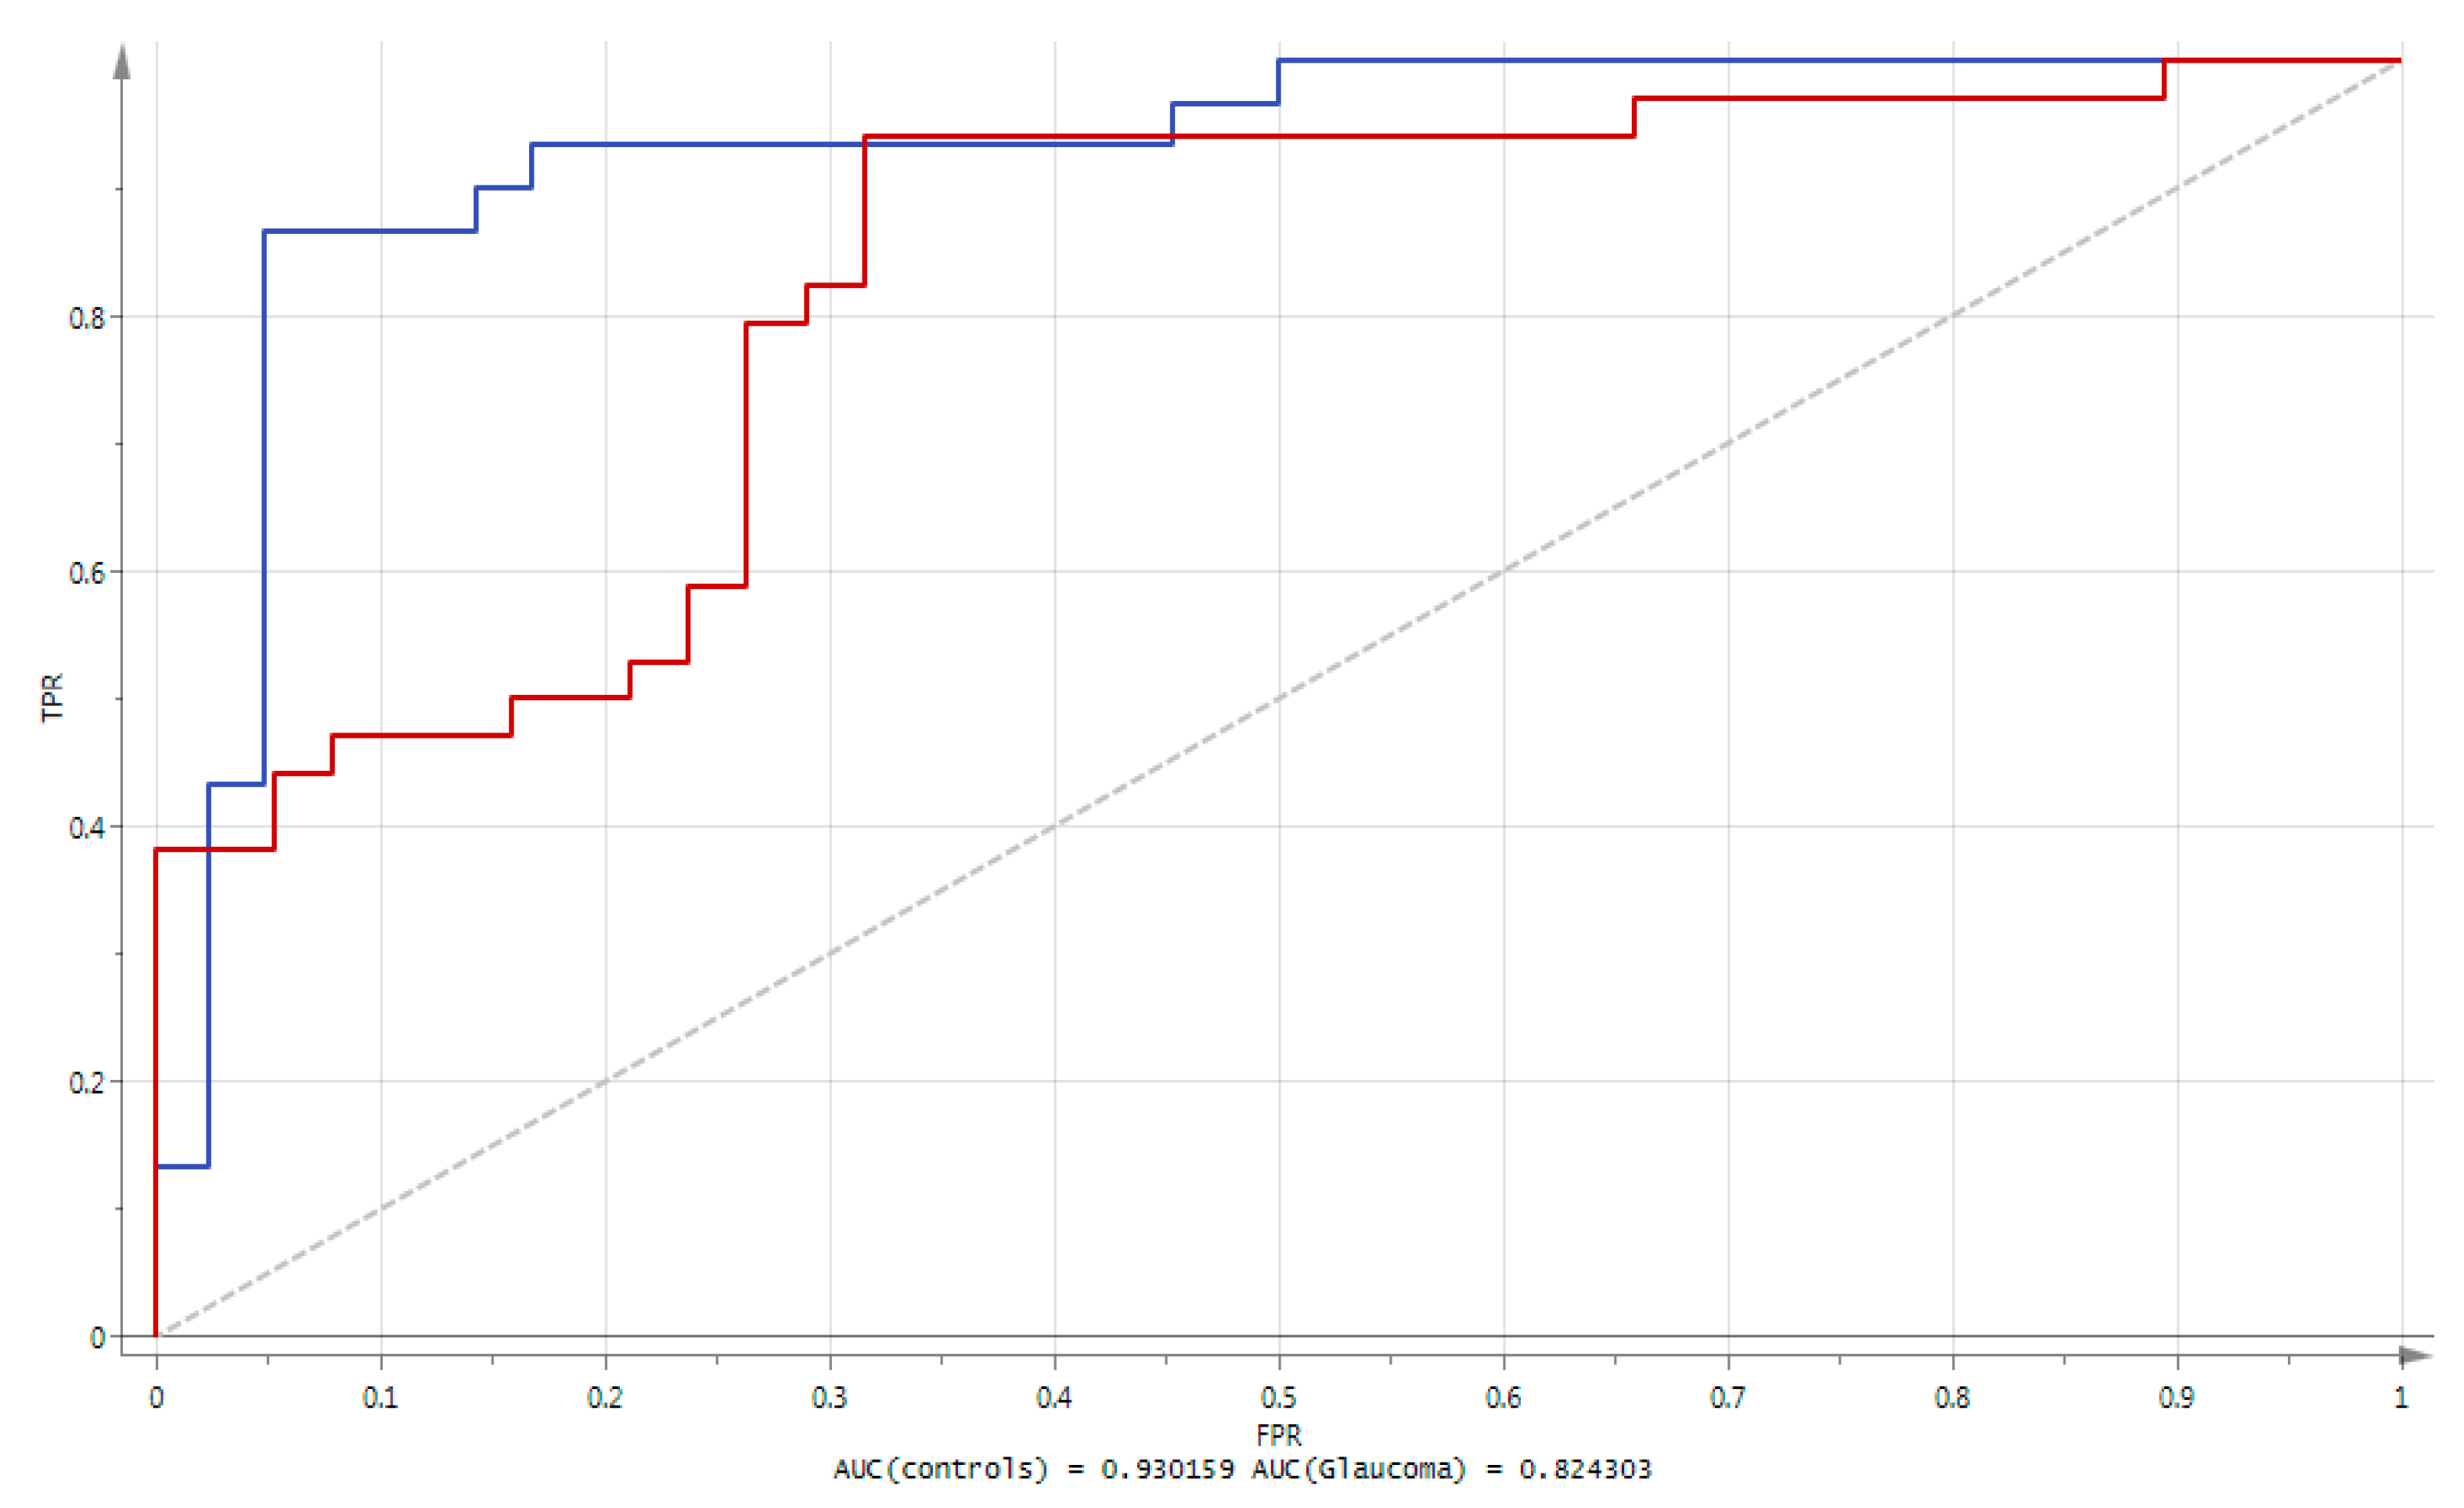
- Orthogonal Projection of Latent Structures-Discriminant Analysis (OPLS-DA) was subsequently performed. The method offers a convenient way of explicitly taking into account the class membership of observations, and to visualize metabolites responsible of the class separation (in this case glaucoma vs. controls). This was followed by an S-plot which provided the visualization of variables’ influence in the OPLS-DA model. Selection of putative biomarkers from the S-plot was combined to jack-knife confidence intervals from a loading column plot; features were further filtered according to their variable importance in the projection (VIP) and only metabolites with VIP values greater than 1.3 were further considered. Consequently, only metabolites with strong model contribution and highly statistical reliability were selected as discriminated metabolites (putative biomarkers). The quality of the finally obtained OPLS-DA model was evaluated by R2 (goodness of fit, i.e., how well the model fits the data), Q2 (goodness of prediction, i.e., how well the model predicts new data) parameters, cross validation-analysis of variance CV-ANOVA and a permutation test. The performance of the identified metabolites was assessed using area under the ROC curve (AUC). The ROC (receiver operating characteristic) can be understood as a plot of the probability of correctly classifying the positive samples against the rate of incorrectly classifying true negative samples. The AUC measure of a ROC plot is a measure of predictive accuracy. A classifier with a perfect discrimination has a ROC curve that passes through the upper left corner (100% sensitivity, 100% specificity); conversely, a ROC curve close to the 1:1 diagonal represents a very poor classifier. These analyses were performed using SIMCA-P v.14.0 (Umetrics, Umea, Sweden);
- (4)
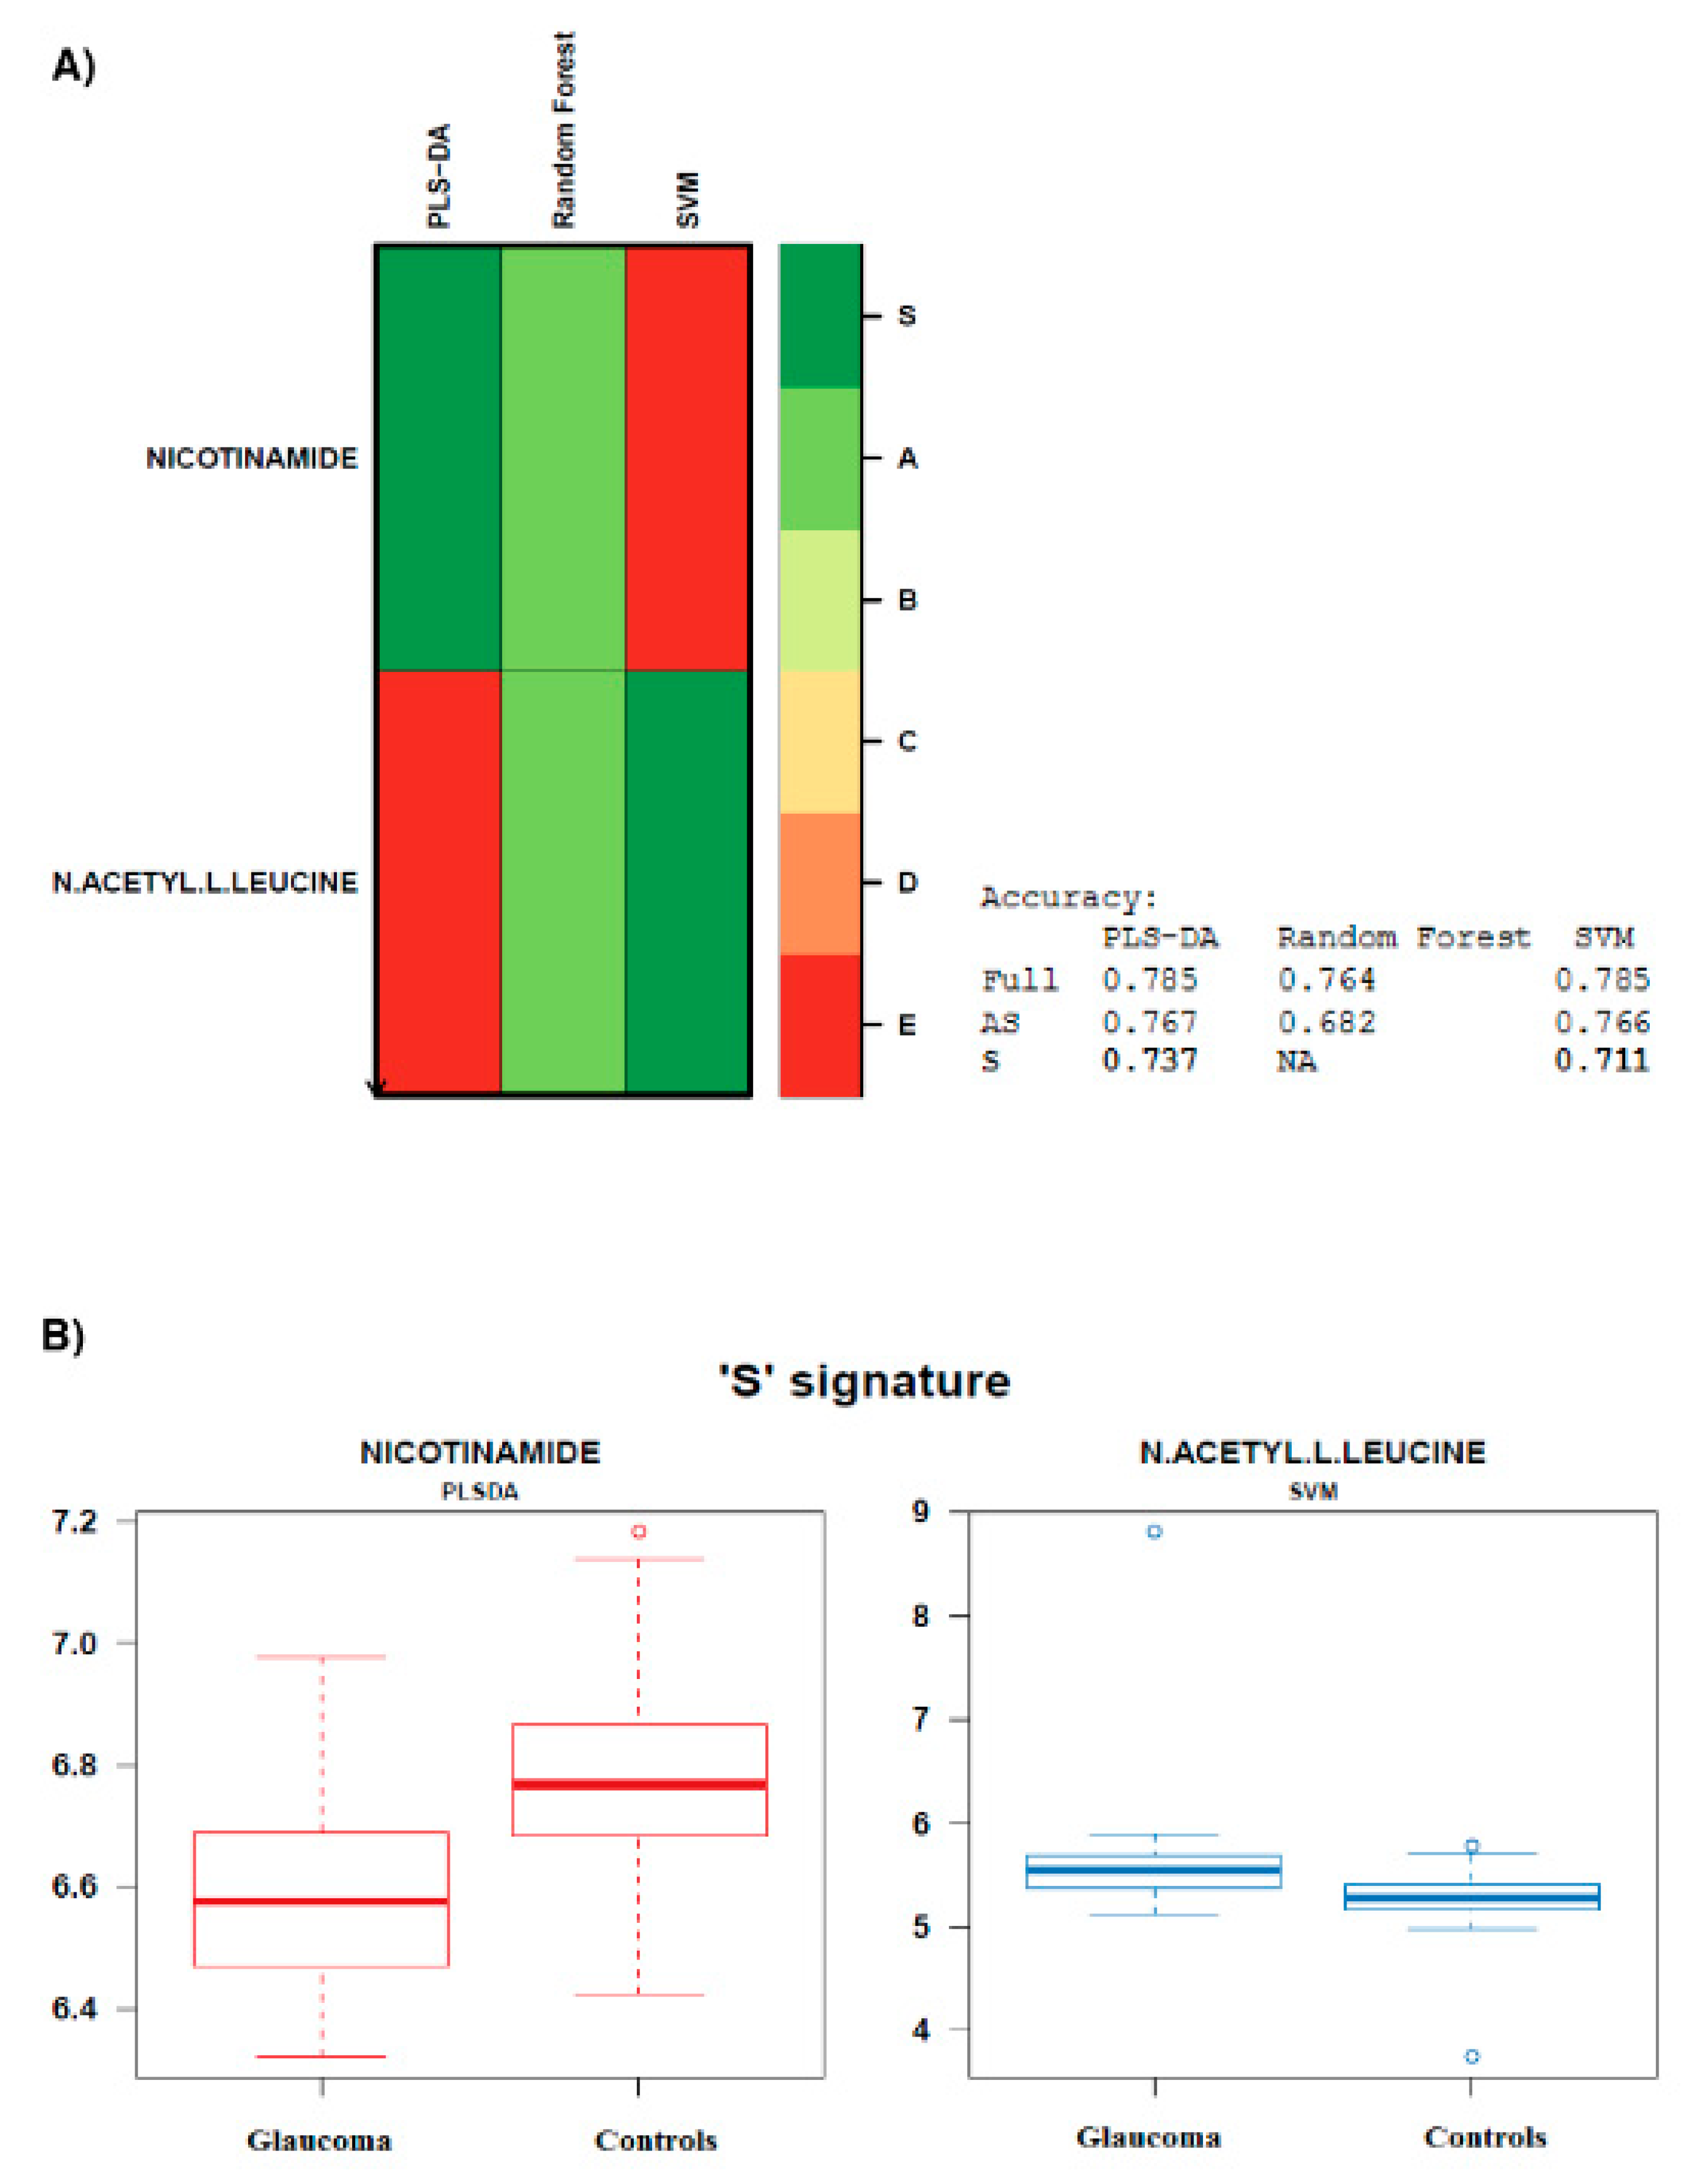
- Biosigner signature was obtained using the new wrapper algorithm ‘Biosigner’ [26]. The algorithm is wrapped around three machine learning approaches ran in parallel, i.e., PLS DA, Random Forest (RF), and Support Vector Machines (SVM). It is an iterative algorithm aiming at the selection of the most promising candidates, i.e., providing a signature of restricted size, of high stability, and high prediction accuracies. The wrapper algorithm is based on random permutation of feature intensities in test subsets obtained by resampling, to assess the significance of the features on the model performance by dichotomy. The S tier corresponds to the final signature, i.e., significant metabolites, which passed all the selection iterations. Biosigner module implemented in Galaxy Workflow4Metabolomics [24] was used, with the aim of finding the smallest feature subset which significantly contributes to the model performance, and optimally discriminates between glaucoma and control individuals. The advanced computational parameters were used, with the following settings: number of bootstraps: 50, selection tier: S, p-value threshold: 0.05, and seed: 1;
- (5)
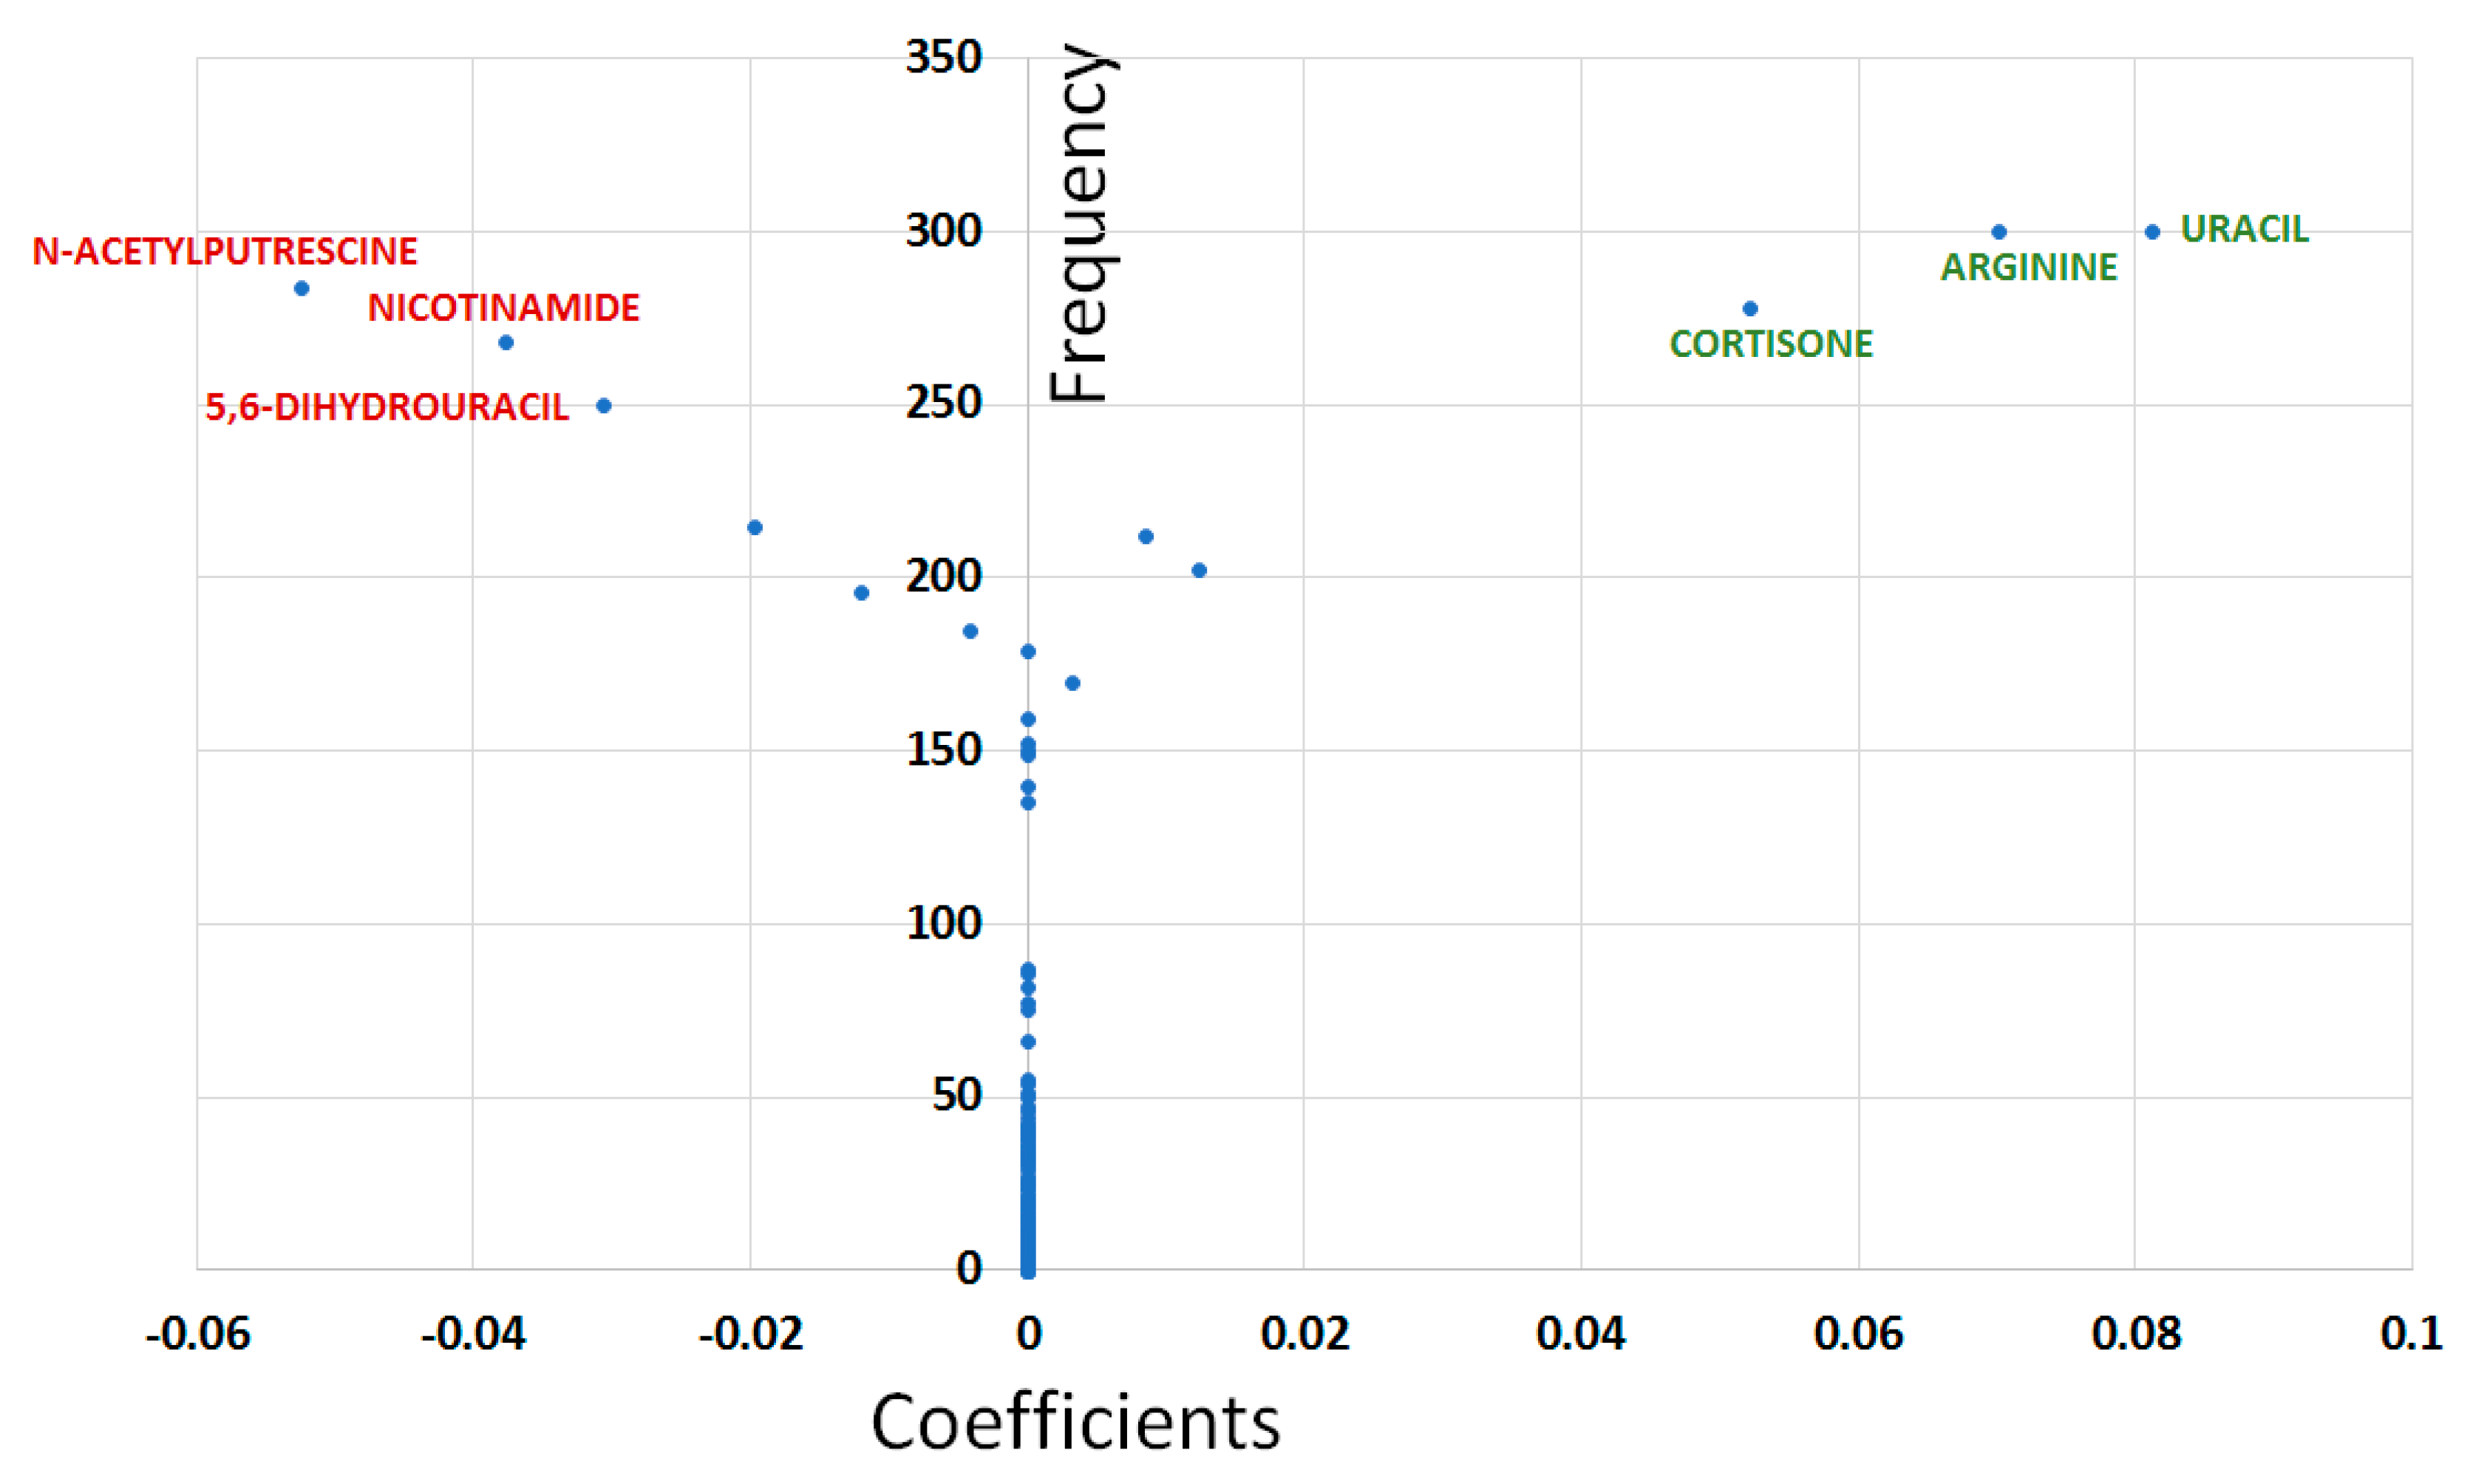
- The Least Absolute Shrinkage and Selection Operator (LASSO) method was performed using the R package glmnet. LASSO combines feature selection and model construction in a single step, by including a penalization constraint within the algorithm; the embedded approaches limit the number of features with non-zero coefficients in the final model [27]. LASSO analysis reveals features that assisted in unambiguous class separation. Before performing LASSO, all data were divided into training (~2/3) and test sets (~1/3). One thousand different training and test sets were created by randomly allocating each patient and control to either the training or the test set. The LASSO method was performed on each training set and the model obtained was then applied to the corresponding test set to evaluate the predictive capabilities of the model. The AUC was used to evaluate the predictive performance of the LASSO model on the test set. Models yielding AUC ≥ 0.8 on the test sets were considered as good models whilst the predictive capabilities of those having AUC ≥ 0.9 were considered as excellent. When the LASSO method displayed good general predictive capabilities (median AUC ≥ 0.8), variable selection was performed by measuring the frequency (F) at which each feature was selected (i.e., non-null coefficient) in models having excellent predictive capabilities when applied to the test sets (i.e., AUC ≥ 0.9). Models with AUC ≥ 0.9 in the test sets were used to estimate metabolite coefficients (C) calculated as the median values of coefficients obtained in each of these models with excellent predictive capabilities. Plotting F vs. C yields a Y-shape graph (called “Y-plot” here) with the vertical branch of the Y accounting for the variables having null median coefficients and left and right upper branches reflecting most likely important variables with decreased (respectively increased) metabolite concentrations in the glaucomatous condition compared to controls.
5. Conclusions
Supplementary Materials
Author Contributions
Funding
Acknowledgments
Conflicts of Interest
References
- Kingman, S. Glaucoma is second leading cause of blindness globally. Bull. World Health Organ. 2004, 82, 887–888. [Google Scholar] [PubMed]
- Quigley, H.A.; Broman, A.T. The number of people with glaucoma worldwide in 2010 and 2020. Br. J. Ophthalmol. 2006, 90, 262–267. [Google Scholar] [CrossRef] [PubMed]
- Güngör, K.; Hotez, P.J.; Özdemir, V.; Aynacıoğlu, Ş. Glaucomics: A Call for Systems Diagnostics for 21st Century Ophthalmology and Personalized Visual Health. OMICS J. Integr Biol. 2014, 18, 275–279. [Google Scholar] [CrossRef] [PubMed]
- Barbosa-Breda, J.; Himmelreich, U.; Ghesquière, B.; Rocha-Sousa, A.; Stalmans, I. Clinical Metabolomics and Glaucoma. Ophthalmic Res. 2018, 59, 1–6. [Google Scholar] [CrossRef] [PubMed]
- Kell, D.B.; Brown, M.; Davey, H.M.; Dunn, W.B.; Spasic, I.; Oliver, S.G. Metabolic footprinting and systems biology: The medium is the message. Nat. Rev. Microbiol. 2005, 3, 557–565. [Google Scholar] [CrossRef] [PubMed]
- Burgess, L.G.; Uppal, K.; Walker, D.I.; Roberson, R.M.; Tran, V.; Parks, M.B.; Wade, E.A.; May, A.T.; Umfress, A.C.; Jarrell, K.L.; et al. Metabolome-Wide Association Study of Primary Open Angle Glaucoma. Investig. Ophthalmol. Vis. Sci. 2015, 56, 5020–5028. [Google Scholar] [CrossRef]
- Leruez, S.; Marill, A.; Bresson, T.; de Saint Martin, G.; Buisset, A.; Muller, J.; Tessier, L.; Gadras, C.; Verny, C.; Gohier, P.; et al. A Metabolomics Profiling of Glaucoma Points to Mitochondrial Dysfunction, Senescence, and Polyamines Deficiency. Investig. Ophthalmol. Vis. Sci. 2018, 59, 4355–4361. [Google Scholar] [CrossRef]
- Kouassi Nzoughet, J.; Bocca, C.; Simard, G.; Prunier-Mirebeau, D.; Chao de la Barca, J.M.; Bonneau, D.; Procaccio, V.; Prunier, F.; Lenaers, G.; Reynier, P. A Nontargeted UHPLC-HRMS Metabolomics Pipeline for Metabolite Identification: Application to Cardiac Remote Ischemic Preconditioning. Anal. Chem. 2017, 89, 2138–2146. [Google Scholar] [CrossRef]
- Bocca, C.; Kouassi Nzoughet, J.; Leruez, S.; Amati-Bonneau, P.; Ferré, M.; Kane, M.S.; Veyrat-Durebex, C.; Chao de la Barca, J.M.; Chevrollier, A.; Homedan, C.; et al. A Plasma Metabolomic Signature Involving Purine Metabolism in Human Optic Atrophy 1 (OPA1)-Related Disorders. Investig. Ophthalmol. Vis. Sci. 2018, 59, 185–195. [Google Scholar] [CrossRef]
- Sumner, L.W.; Amberg, A.; Barrett, D.; Beale, M.H.; Beger, R.; Daykin, C.A.; Fan, T.W.-M.; Fiehn, O.; Goodacre, R.; Griffin, J.L.; et al. Proposed minimum reporting standards for chemical analysis Chemical Analysis Working Group (CAWG) Metabolomics Standards Initiative (MSI). Metabolomics 2007, 3, 211–221. [Google Scholar] [CrossRef]
- Barker, M.; Rayens, W. Partial least squares for discrimination. J. Chemom. 2003, 17, 166–173. [Google Scholar] [CrossRef]
- Rifai, N.; Gillette, M.A.; Carr, S.A. Protein biomarker discovery and validation: The long and uncertain path to clinical utility. Nat. Biotechnol. 2006, 24, 971–983. [Google Scholar] [CrossRef] [PubMed]
- Keating, P.; Cambrosio, A. Too many numbers: Microarrays in clinical cancer research. Stud. Hist. Philos. Sci. Part C Stud. Hist. Philos. Biol. Biomed. Sci. 2012, 43, 37–51. [Google Scholar] [CrossRef] [PubMed]
- Kouassi Nzoughet, J.; Chao de la Barca, J.M.; Guehlouz, K.; Leruez, S.; Coulbault, L.; Allouche, S.; Bocca, C.; Muller, J.; Amati-Bonneau, P.; Gohier, P.; et al. Nicotinamide Deficiency in Primary Open-Angle Glaucoma. Investig. Ophthalmol. Vis. Sci. 2019, 60, 2509–2514. [Google Scholar] [CrossRef]
- Williams, P.A.; Harder, J.M.; Foxworth, N.E.; Cochran, K.E.; Philip, V.M.; Porciatti, V.; Smithies, O.; John, S.W. Vitamin B3 modulates mitochondrial vulnerability and prevents glaucoma in aged mice. Science 2017, 355, 756–760. [Google Scholar] [CrossRef]
- Lee, S.; Sheck, L.; Crowston, J.G.; Van Bergen, N.J.; O’Neill, E.C.; O’Hare, F.; Kong, Y.X.; Chrysostomou, V.; Vincent, A.L.; Trounce, I.A. Impaired complex-I-linked respiration and ATP synthesis in primary open-angle glaucoma patient lymphoblasts. Investig. Ophthalmol. Vis. Sci. 2012, 53, 2431–2437. [Google Scholar] [CrossRef]
- Rustin, P.; Chretien, D.; Parfait, B.; Rötig, A.; Munnich, A. Nicotinamide adenine dinucleotides permeate through mitochondrial membranes in human Epstein-Barr virus-transformed lymphocytes. Mol. Cell Biochem. 1997, 174, 115–119. [Google Scholar] [CrossRef]
- Vibert, N.; Vidal, P.P. In vitro effects of acetyl-DL-leucine (tanganil) on central vestibular neurons and vestibulo-ocular networks of the guinea-pig. Eur. J. Neurosci. 2001, 13, 735–748. [Google Scholar] [CrossRef]
- Tsutsui, H.; Maeda, T.; Min, J.Z.; Inagaki, S.; Higashi, T.; Kagawa, Y.; Toyo’oka, T. Biomarker discovery in biological specimens (plasma, hair, liver and kidney) of diabetic mice based upon metabolite profiling using ultra-performance liquid chromatography with electrospray ionization time-of-flight mass spectrometry. Clin. Chim. Acta Int. J. Clin. Chem. 2011, 412, 861–872. [Google Scholar] [CrossRef]
- Javadiyan, S.; Burdon, K.P.; Whiting, M.J.; Abhary, S.; Straga, T.; Hewitt, A.W.; Mills, R.A.; Craig, J.E. Elevation of serum asymmetrical and symmetrical dimethylarginine in patients with advanced glaucoma. Investig. Ophthalmol. Vis. Sci. 2012, 53, 1923–1927. [Google Scholar] [CrossRef]
- McBean, G.J.; Aslan, M.; Griffiths, H.R.; Torrão, R.C. Thiol redox homeostasis in neurodegenerative disease. Redox Biol. 2015, 5, 186–194. [Google Scholar] [CrossRef]
- Huang, S.; Huang, P.; Liu, X.; Lin, Z.; Wang, J.; Xu, S.; Guo, L.; Leung, C.K.; Zhong, Y. Relevant variations and neuroprotecive effect of hydrogen sulfide in a rat glaucoma model. Neuroscience 2017, 341, 27–41. [Google Scholar] [CrossRef]
- Weinreb, R.N.; Khaw, P.T. Primary open-angle glaucoma. Lancet 2004, 363, 1711–1720. [Google Scholar] [CrossRef]
- Giacomoni, F.; Le Corguillé, G.; Monsoor, M.; Landi, M.; Pericard, P.; Pétéra, M.; Duperier, C.; Tremblay-Franco, M.; Martin, J.-F.; Jacob, D. Workflow4Metabolomics: A collaborative research infrastructure for computational metabolomics. Bioinform. Oxf. Engl. 2015, 31, 1493–1495. [Google Scholar] [CrossRef]
- Xia, J.; Wishart, D.S. Using MetaboAnalyst 3.0 for Comprehensive Metabolomics Data Analysis. Curr Protoc. Bioinform. 2016, 55, 14.10.1–14.10.91. [Google Scholar] [CrossRef]
- Rinaudo, P.; Boudah, S.; Junot, C.; Thévenot, E.A. biosigner: A New Method for the Discovery of Significant Molecular Signatures from Omics Data. Front. Mol. Biosci. 2016, 3, 1–14. [Google Scholar] [CrossRef]
- Tibshirani, R. Regression Shrinkage and Selection Via the Lasso. J. R. Stat. Soc. Ser. B Methodol. 1996, 58, 267–288. [Google Scholar] [CrossRef]


| Metabolites | Univariate Analysis | OPLS-DA | BIOSIGNER | LASSO | ||
|---|---|---|---|---|---|---|
| a Fold Change (POAG/Control) | b FDR q-Value | VIP Values | ||||
| Nicotinamide * | 0.643 ↓ | 0.00269 | 2.06794 | √ | √ | √ |
| Arginine | 1.312 ↑ | 0.00375 | 1.36764 | √ | √ | |
| Glyceraldehyde | 1.106 ↑ | 0.00375 | 0.94874 | |||
| N-acetyl-L-leucine * | 1.846 ↑ | 0.00375 | 2.02646 | √ | √ | |
| Galactose | 1.103 ↑ | 0.00444 | 0.93104 | |||
| Hypoxanthine * | 0.558 ↓ | 0.00444 | 3.13134 | √ | ||
| 1-methyl-6,7-dihydroxy-1,2,3,4-tetrahydroisoquinoline * | 0.469 ↓ | 0.00444 | 2.61827 | √ | ||
| Glyoxylic acid | 1.097 ↑ | 0.00523 | 0.90817 | |||
| Arabinose | 1.121 ↑ | 0.00523 | 0.98914 | |||
| Xanthine | 0.727 ↓ | 0.00629 | 1.95504 | √ | ||
| 3-hydroxybenzaldehyde | 1.325 ↑ | 0.00938 | 1.12595 | |||
| Tyrosine | 1.213 ↑ | 0.01127 | 1.30588 | |||
| Indole-3-acetate | 1.449 ↑ | 0.01791 | 1.36766 | |||
| Urocanate | 0.733 ↓ | 0.01791 | 1.58454 | |||
| Uracil | 1.048 ↑ | 0.02246 | 0.42581 | |||
| N-acetylputrescine | 0.812 ↓ | 0.02285 | 1.24824 | |||
| 3-hydroxyphenylacetate | 1.398 ↑ | 0.02285 | 1.37148 | |||
| Glycolate | 1.13 ↑ | 0.02285 | 0.84268 | |||
| Rac-glycerol 1-myristate | 1.316 ↑ | 0.03136 | 1.63356 | √ | ||
| Methionine | 1.163 ↑ | 0.03268 | 1.27457 | |||
| Alpha-aminoadipate | 1.306 ↑ | 0.03409 | 1.59113 | |||
| Cystathionine * | 1.656 ↑ | 0.03886 | 2.46291 | |||
| Cortisone | 1.35 ↑ | 0.04246 | 0.88469 | |||
| Uridine | 0.811 ↓ | 0.04246 | 1.41792 | |||
| cis-4-hydroxy-d-proline | 1.443 ↑ | 0.04444 | 1.32333 | |||
| 4-hydroxy-l-proline | 1.432 ↑ | 0.04463 | 1.32638 | |||
| Cystine | 0.841 ↓ | 0.04487 | 1.0005 | |||
| 1-oleoyl-rac-glycerol * | 1.608 ↑ | 0.04906 | 1.53561 | √ | ||
© 2020 by the authors. Licensee MDPI, Basel, Switzerland. This article is an open access article distributed under the terms and conditions of the Creative Commons Attribution (CC BY) license (http://creativecommons.org/licenses/by/4.0/).
Share and Cite
Kouassi Nzoughet, J.; Guehlouz, K.; Leruez, S.; Gohier, P.; Bocca, C.; Muller, J.; Blanchet, O.; Bonneau, D.; Simard, G.; Milea, D.; et al. A Data Mining Metabolomics Exploration of Glaucoma. Metabolites 2020, 10, 49. https://doi.org/10.3390/metabo10020049
Kouassi Nzoughet J, Guehlouz K, Leruez S, Gohier P, Bocca C, Muller J, Blanchet O, Bonneau D, Simard G, Milea D, et al. A Data Mining Metabolomics Exploration of Glaucoma. Metabolites. 2020; 10(2):49. https://doi.org/10.3390/metabo10020049
Chicago/Turabian StyleKouassi Nzoughet, Judith, Khadidja Guehlouz, Stéphanie Leruez, Philippe Gohier, Cinzia Bocca, Jeanne Muller, Odile Blanchet, Dominique Bonneau, Gilles Simard, Dan Milea, and et al. 2020. "A Data Mining Metabolomics Exploration of Glaucoma" Metabolites 10, no. 2: 49. https://doi.org/10.3390/metabo10020049
APA StyleKouassi Nzoughet, J., Guehlouz, K., Leruez, S., Gohier, P., Bocca, C., Muller, J., Blanchet, O., Bonneau, D., Simard, G., Milea, D., Procaccio, V., Lenaers, G., Chao de la Barca, J. M., & Reynier, P. (2020). A Data Mining Metabolomics Exploration of Glaucoma. Metabolites, 10(2), 49. https://doi.org/10.3390/metabo10020049


