Article

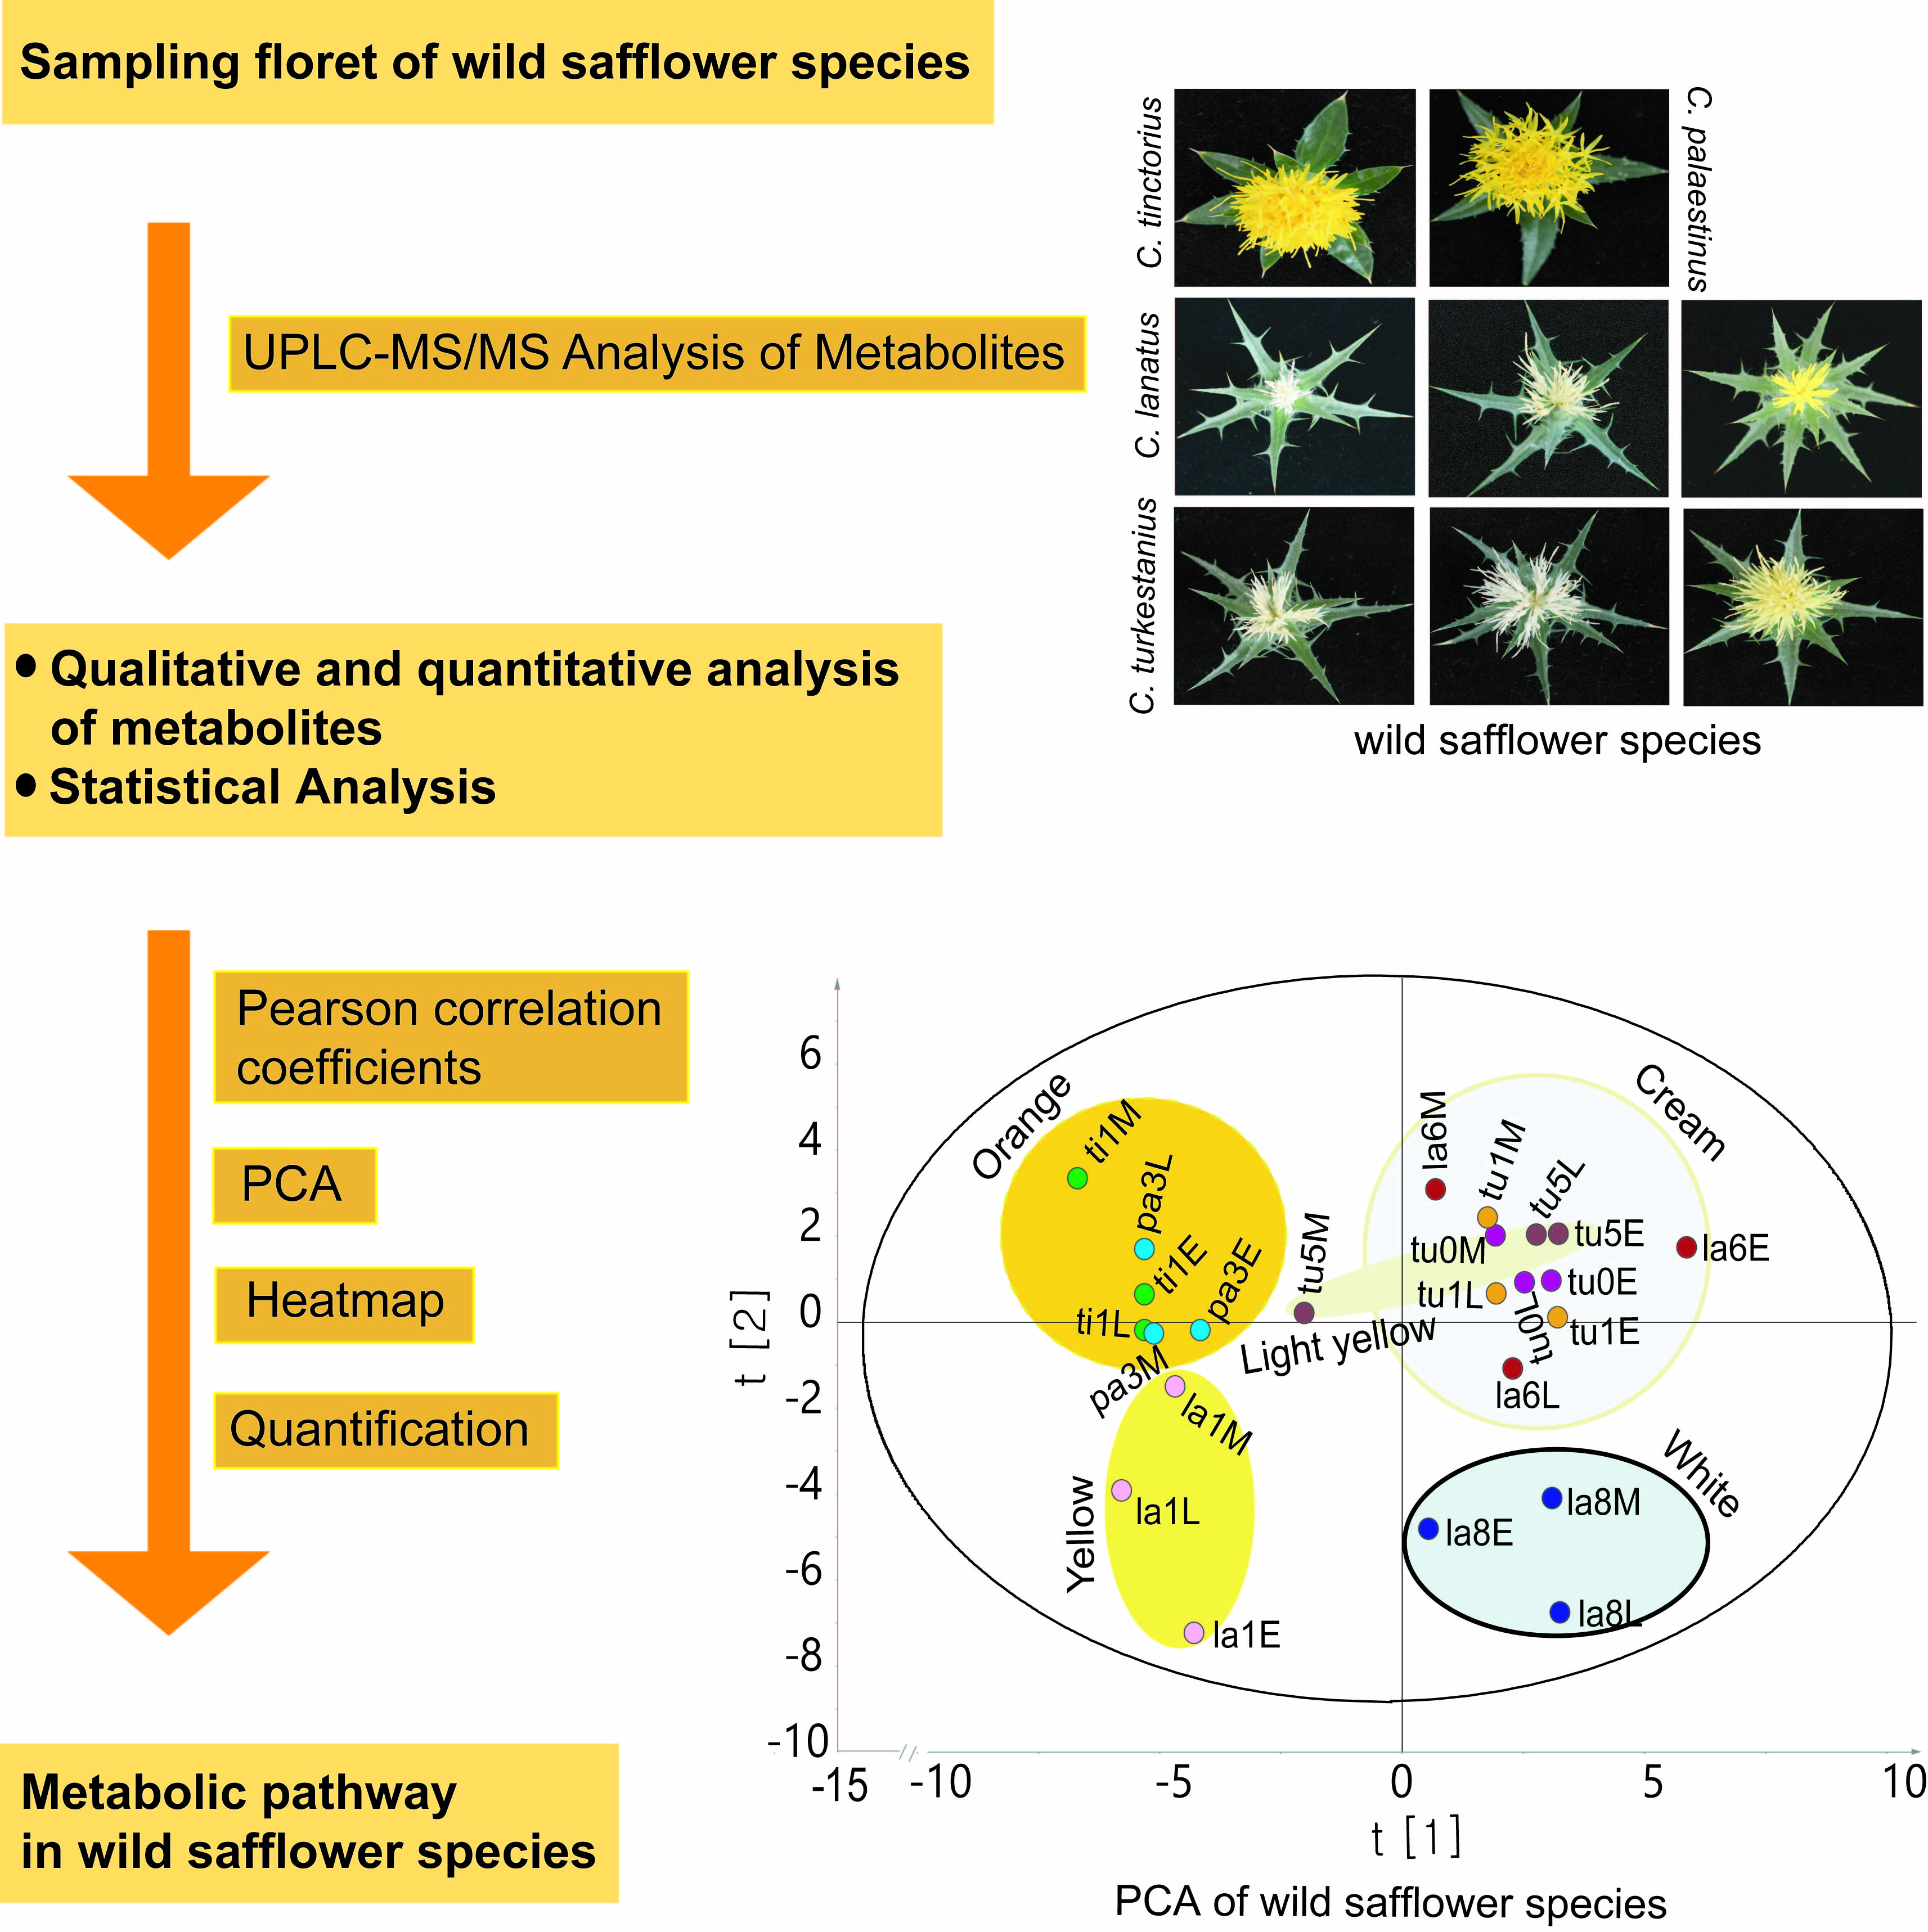
Assessment of Metabolic Profiles in Florets of Carthamus Species Using Ultra-Performance Liquid Chromatography-Mass Spectrometry

1
Department of Agricultural Biotechnology, National Institute of Agricultural Sciences, Rural Development Administration, Jeonju 54874, Korea
2
National Agrobiodiversity Center, National Institute of Agricultural Sciences, Rural Development Administration, Jeonju 54874, Korea
3
Department of Bio-Industry and Bio-Resource Engineering, Sejong University, Seoul 05006, Korea
*
Author to whom correspondence should be addressed.
These authors contributed equally to this work.
Metabolites 2020, 10(11), 440; https://doi.org/10.3390/metabo10110440
Submission received: 9 October 2020 / Revised: 28 October 2020 / Accepted: 28 October 2020 / Published: 30 October 2020
(This article belongs to the Section Plant Metabolism)

Abstract

:
The genus Carthamus is a diverse group of plants belonging to the family Compositae. Florets of Carthamus species exhibit various colors, including white, yellow, orange, and red, which are related to their metabolite compositions. We aimed to investigate the metabolites accumulated in florets of three wild (C. lanatus, C. palaestinus, and C. turkestanicus) and one cultivated (C. tinctorius) species of safflower at three developmental stages. Metabolites were extracted from freeze-dried florets using 70% methanol; qualification and quantification were carried out using liquid chromatography quadrupole time-of-flight mass spectrometry in positive and negative ion modes followed by extraction of the peaks. Fifty-six metabolites, including phenylpropanoids, chalcones, isoflavonoids, flavanones, flavonols, flavones, and other primary metabolites, were identified for the first time in safflower wild species. The orange florets contained high abundances of safflomin A, anhydrosafflor yellow B, and baimaside, whereas white/cream and light-yellow pigmented florets had high abundances of 1,5-dicaffeoylquinic acid, luteolin 7-O-glucuronide, and apigenin 7-O-β-D-glucuronide. The principal component analysis clearly distinguished the samples based on their pigment types, indicating that color is a dominant factor dictating the identity and amount of the metabolites. Pearson correlation data based on levels of metabolites showed that orange and yellow florets were significantly correlated to each other. White and cream pigmented species were also highly correlated. Comparison between three developmental stages of safflower wild species based on their metabolite profile showed inconsistent. The findings of this study broaden the current knowledge of safflower metabolism. The wide diversity of metabolites in safflower materials also helps in efforts to improve crop quality and agronomic traits.

Graphical Abstract

1. Introduction

The genus Carthamus, which probably originated in southern Asia, comprise a diverse group of plants belonging to the family Compositae. It is believed to have been cultivated in China, Egypt, India, and Iran in the era of human prehistory, and in Italy, France, and Spain during the Middle Ages [1,2]. Safflower is one of the major oil seed crops cultivated over the last five decades. Carthamus tinctorius L., one of the most studied major Carthamus species, is a branching, thistle-like herbaceous perennial broadleaved oil seed crop [3,4,5]. Other species of Carthamus include but are not limited to C. alexandrines, C. anatolicus, C. creticus, C. dentatus, C. divaricatus, C. flavescens, C. glaucus, C. lanatus L., C. leucocaulos, C. nitidus, C. oxyacantha, C. palaestinus L., C. tenuis, and C. turkestanicus [6,7,8,9,10,11].
Various studies have been done on the evolution of Carthamus species. Earlier studies indicated that the diverse nature of Carthamus species is accompanied by high variation in chromosome number (2n = 20, 22, 24, 44, 64; x = 10, 11, 12) [6,7,12,13]. Ashri and Knowles (1960) [7] considered C. oxyacantha, C. palaestinus, and C. flavescens to be true wild species closely related to C. tinctorius. On the other hand, these species were regarded as the biological wild species of C. tinctorius [14]. Other species, such as C. creticus and C. turkestanicus are treated either as distinct species or subspecies of C. lanatus [6,8,9,10]. Morphological, karyological, experimental hybridization, and isozyme studies indicated that C. creticus originated from C. lanatus and C. leucocaulos, whereas C. turkestanicus Popov originated from C. lanatus and C. glaucus M. Bieb subsp. Glaucus [7,9,10,15,16]. Recent studies based on phylogenetic analysis of a combined dataset [17] unweighted pair group method with arithmetic mean (UPGMA) dendrogram clustering analysis [18], nuclear DNA assay results [19], and fluorescent in situ hybridization (FISH) studies [20] showed that the cultivated C. tinctorius L. is closely related to, and most likely derived from, the wild species C. palaestinus, whereas C. persicus and C. oxyacanthus appear to be more distantly related to it. Another study based on chloroplast DNA diversity revealed that C. oxyacantha and C. palaestinus contributed their plastomes to C. tinctorius var. tinctorius and C. tinctorius var. inermis, respectively [21]. Sehgal et al. (2009) [22] reported that C. boissieri (2n = 20) is more likely to be a diploid progenitor of C. lanatus ssp. creticus (2n = 64), C. lanatus (2n = 44), C. lanatus ssp. lanatus (2n = 44), and C. lanatus ssp. montanus (2n = 44), whereas C. glaucus ssp. anatolicus (2n = 20) is a likely progenitor of C. lanatus ssp. turkestanicus (2n = 64). FISH study results showed that C. boissieri is one of the genome donors for C. lanatus [20]. Phylogenetic analyses of the nuclear introns and additivity analysis of randomly amplified polymorphic DNA markers showed that the tetraploid C. lanatus is a progenitor of the hexaploid C. turkestanicus, and C. glaucus is likely the diploid progenitor of C. turkestanicus [11].
Petals, stamens and pistils of safflower flower exhibit various colors, including white, yellow, orange, and red [23,24]. Color is an important factor that helps as an external appearance indicator to evaluate the quality of the safflower in conformity assessments of certain specifications and quality changes due to processing, storage, and other factors. Stages of blooming affect the color of safflower florets. The most common color at early bloom is yellow, which gradually turns to red [25,26]. At the post-blooming stage, the orange, yellow, and red flowers become dark or purple [27]. Environmental conditions, such as light intensity, affect safflower color and also cause changes in color [28]. Safflower color is mostly related to its chemical components [29,30].
The various chemical constituents reported in extracts of fresh florets, oil cake, dried aerial parts, and seeds of Carthamus species. These include flavonoids, phenolic acids, quinochalcones, alkaloids, polyacetylene, fatty acids, sterols, triterpenes, volatile constituents, sugars, and amino acids [23,28,31,32,33,34,35,36,37,38,39,40]. The chromatic components in the petal or whole flower part of C. tinctorius L. reported to date include the red pigment carthamin [41], the yellow carthamin precursor precarthamin [26,42], safflower yellow B [43], safflomin A [44,45,46], safflomin C [28,47], tinctromine [48], cartormin [49], hydroxysafflor yellow A, anhydrosafflor yellow B (AHSYB) [28], hydroxycartormin, and cartormin [50]. Two quinochalcone C-glycosides, carthorquinosides A and B, were recently isolated from C. tinctorius florets [51]. Pu et al. (2019) [28] isolated flavonols and flavones from 40 diversely colored safflower floret samples. The rearranged derivatives of two flavonoid C-glycosides, saffloflavonesides A and B, were isolated from the florets of C. tinctorius [52]. Various flavonoids have been isolated from dried petals of C. tinctorius [53], leaves of C. tinctorius L. [54], and aerial parts of C. lanatus [38,55]. Fresh florets of C. tinctorius L. were reported to include derivatives of kaempferols and quercetins [23]. The petals of C. tinctorius L. are a rich source of volatile oils [1]. The most common fatty acids extracted from safflower include oleic, linoleic, palmitic, and stearic acids [56,57,58]. Aromatic glucosides, alkaloids, p-coumaric acid and its derivatives, coumaroylspermidine analogs, and various types of glucopyranosides have also been isolated from C. tinctorius [53,59,60,61] Other compounds such as oxygenated bisabolanefucosides, asperulosides, stigmasterol 3-O-β-D-glucoside, and sitosterol 3-O-β-D-glucoside were isolated from aerial parts of C. lanatus [39]. Flavonoids and quinochalcones are considered the main and active constituents of safflower plant extracts. Carthamus tinctorius L. is the most investigated species in terms of its chemical constituents.
Safflower is an important crop with various applications. The florets and seeds of safflower have been used in various pharmaceutical and industrial applications, including producing herbal medicines and food colorants, as a natural red dye, and as a source of vegetable and industrial oils [3,62,63,64,65]. Traditionally, safflower florets have been used in China, Korea, Japan, and other countries for the treatment of various cardiovascular-related diseases, inflammatory diseases, osteoporosis, and gynecological disorders [66,67]. Modern clinical and epidemiological experiments indicate that safflower helps in dilating coronary arteries, improving myocardial ischemia, and regulating the immune system; it also possesses anticoagulative, antithrombotic, and antioxidative properties [67,68]. The chromatic component of orange and red safflower, hydroxysafflor yellow A, was reported to reduce blood pressure and heart rate [65]. Whole extracts, fractions, and constituents of C. lanatus that contained quercetin and luteolin glucosides as the main constituents increased the amount of glutathione antioxidant in human endothelial EA.hy926 cells [69] and inhibited cell proliferation [70]. In other studies, dichloromethane, water, and methanol extracts of C. lanatus L. exhibited significant anti-inflammatory activity in induced human neutrophils and rats [71,72], as well as noticeable antibacterial activity and cytotoxicity [73].
Although the identification and quantification of secondary and primary metabolites have been reported for the cultivated safflower species C. tinctorius, safflower wild species have received limited attention. To the best of our knowledge, there are no reports concerning the metabolites of the safflower wild species C. lanatus, C. palaestinus, and C. turkestanicus. Profiling the metabolites in Carthamus spp. florets expands our knowledge of bioactive components and is important for quality control improvement. In this paper, we evaluated differences in the quality and quantity of metabolites between three wild and one cultivated safflower species. First, 56 metabolites were identified from safflower florets sampled at the early, middle, and late maturity stages using liquid chromatography quadrupole time-of-flight mass spectrometry (LC-ESI-QTOF-MS). Second, the metabolite variations among different species were assessed using multivariate data analysis. Third, the absolute concentrations of metabolites that differed significantly among species were examined. This study broadens our knowledge of flowering behavior so as to identify physiological process indicators and highlights the value of safflower as a source of natural colorants, food additives, and nutraceuticals.

2. Results

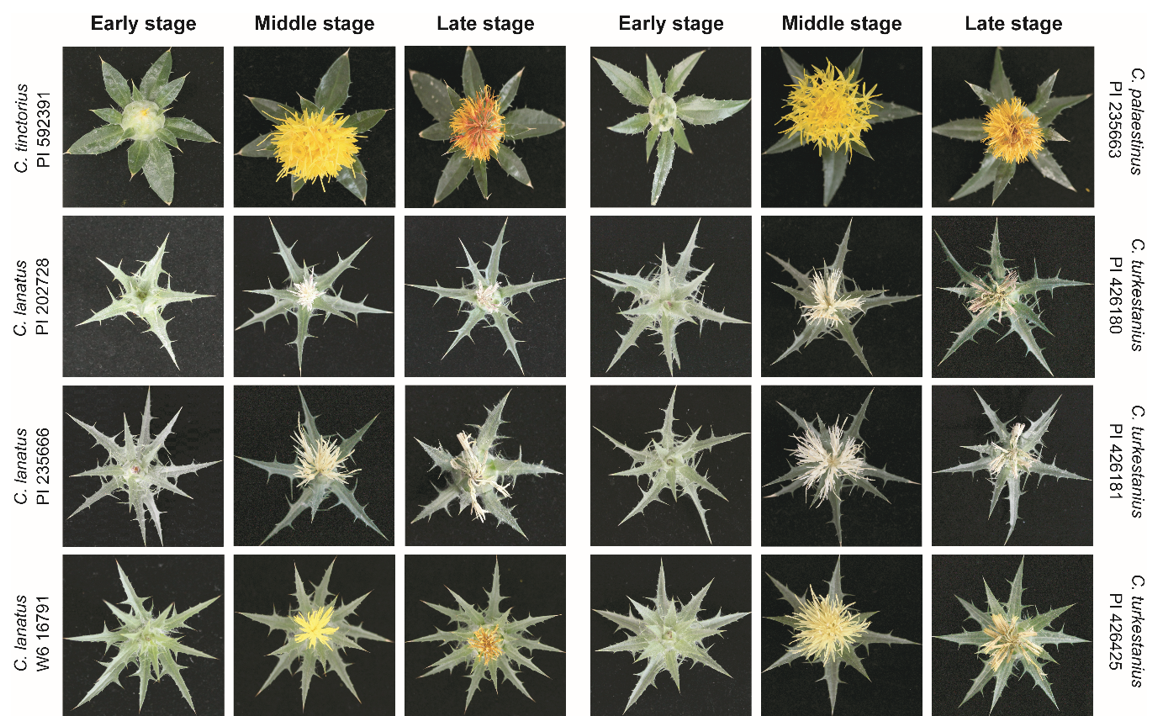
2.1. Floret Colors and Leaf Shapes of Safflower Species

Florets of three wild (C. palaestinus, C. lanatus, and C. turkestanicus) and one cultivated (C. tinctorius) safflower species at three different growth stages were used in this study; photographs are presented in Figure 1. Floret samples were collected at three different developmental stages as described previously [25]: (1) before the beginning of flowering, when the upper portion of the florets about to emerge through the bracts (early stage); (2) at the stage when the flowering is considered complete (more than 90% of florets open); and (3) at the late stage of flowering when the capitulum begins to expand and the seeds are about to start developing. At the complete flowering stage (middle stage), the florets of the studied genotypes were yellow, light-yellow, and white/cream. At later stages, the yellow and light-yellow florets started to change color to orange or red-orange. The florets of C. tinctorius and C. palaestinus are orange at the middle stage and orange/red at the late stage. W6 16791 (C. lanatus) and PI 426425 (C. turkestanicus) are yellow and light-yellow at the middle stage of growth, respectively. The former changed color to yellow/red, whereas little color change was observed for the latter. The petals of PI 235666 (C. lanatus), PI 426180 (C. turkestanicus), and PI 426181 (C. turkestanicus) were white at the middle stage of development. The pistils of the other flowers were either yellow or yellowish except the pistils of PI 202728 (C. lanatus), which were white at the middle stage. The involucral bracts of the main capitula and leaf margins of C. tinctorius and C. palaestinus exhibited short spines, whereas those of all other species had long and sharp spines. All species generally had lanceolate leaf shapes, but the leaves of C. tinctorius and C. palaestinus were relatively wider with acuminate apices, whereas those of the other species had attenuate leaf apices. Head sizes are described as small, intermediate, and large. The florets of C. tinctorius and C. palaestinus had large and intermediate head sizes, respectively. Those of the other species had small head sizes.

2.2. Metabolites of Safflower Species

A total of 56 metabolites, including 19 flavonols, 9 flavones, 9 phenylpropanoids, 4 flavanones, 4 isoflavones, 5 primary metabolites, 2 chalcones, 2 anthraquinones, esculetin, and salicylic acid, were identified in safflower florets using LC-ESI-QTOF-MS. The relative peak areas of the identified metabolites are presented in Table S1. Flavones (apigenin 7-O-β-D-glucuronide, luteolin 7-O-glucuronide, and luteolin 7-O-β-D-glucoside), flavonols (astragalin, kaempferol, quercetin, isoquercetin, kaempferol 3-O-β-D-glucosylgalactoside, and kaempferol 7-O-β-D-glucopyranoside), phenylpropanoids (caffeic acid, caffeoylquinic acid, and quinic acid), safflomin A, and aconitic acid were detected in all samples. The chromaticity-related components safflomin A and AHSYB were among the dominant metabolites in the orange florets of C. tinctorius and C. palaestinus. Luteolin 7-O-glucuronide comprised the highest portion of the total content of metabolites in the white and creamy florets of C. lanatus and C. turkestanicus. Instead of quinochalcones, isoflavonoids were the dominant compounds in white and creamy florets. Malonylgenistin, pratensein, and 2’-hydroxygenistein were detected in C. turkestanicus and C. lanatus, whereas 6-hydroxydaidzein was only detected in C. lanatus and the early-stage florets of C. palaestinus. Most of the flavones and flavonols were detected in most samples with some exceptions. Lesser quantities of 3’-O-methylluteolin, apigenin, 3-O-methylquercetin, myricitrin, and quercetin 3-O-(6-O-malonyl-β-D-glucoside) were detected in orange and yellow florets compared with others. Phenylpropanoids were distributed throughout the samples with 1,5-dicaffeoylquinic acid, caffeoylquinic acid, and quinic acid contributing highly to the overall content of phenylpropanoids. High interspecies variation was observed in the levels of some of the metabolites. Whereas p-coumaric acid dominated in C. tinctorius and C. palaestinus florets, 1,5-dicaffeoylquinic acid was only detected in C. turkestanicus and C. lanatus.
Correlation analysis can be used to substantiate the relationship between biochemically related properties in plant samples. To examine the detailed relationships among floret samples, Pearson correlation analysis was performed using the relative peak areas of the 56 studied compounds (Table 1). Two C. lanatus individuals, PI 235666 and PI 202728, which had creamy and white florets, respectively, exhibited similar metabolite profiles and were strongly correlated with each other (R2 = 0.647–0.976). However, the yellow C. lanatus (W6 16791) was not significantly correlated with PI 235666 or PI 202728 despite being the same species. W6 16791, rather, was highly correlated with C. tinctorius and C. palaestinus and moderately correlated with yellow C. turkestanicus (PI 426425). A similar correlation trend was observed between the cream pigmented C. lanatus and C. turkestanicus, suggesting that, rather than genotype, color is a strong predictor of the quality and quantity of metabolites in safflower florets. All C. turkestanicus individuals exhibited very high similarity in metabolite profile and were significantly correlated with each other and with the creamy and white C. lanatus individuals. The yellow variant of C. turkestanicus (PI 426425) was moderately correlated with the orange C. tinctorius and C. palaestinus and the yellow C. lanatus (W6 16791), confirming greater resemblance to the creamy and white variants. Hierarchical clustering analysis (results not shown) of the florets at the middle stage of flowering identified two major clusters. One group contained individuals of C. tinctorius and C. palaestinus as well as the yellow C. lanatus (W6 16791). All remaining species were clustered in the other group.
A heat map analysis (Figure 2) based on the relative peak areas of the metabolites was performed to examine variation in metabolite synthesis among species and floret developmental stages. The orange florets of C. tinctorius and C. palaestinus contained high levels of safflomin A, AHSYB, and baimaside, whereas the other florets contained high levels of 1, 5-dicaffeoylquinic acid, luteolin 7-O-glucuronide, and apigenin 7-O-β-D-glucuronide. Other flavonoids, such as dihydrokaempferol, eriodictoyl, naringenin, and prunin were either not abundant or identified at trace levels in white/creamy and light-yellow florets. Some other metabolites that are involved in flavone and flavonol biosynthesis, including syringetin, vitexin, acacetin, herbacetin, narirutin, and myricetin, were not detected in most of the materials. Compared with the yellow and orange florets, 2’-hydroxygenistein was more abundant in white/creamy and light-yellow florets, whereas the other isoflavonoid, 6-hydroxydaidzein, was much less abundant and not detected in most of the safflower species.

2.3. Classification of Safflower Species Based on Their Characteristic Chemical Components Using Principal Component Analysis (PCA) and Orthogonal Partial Least Squares Discriminant Analysis (OPLS-DA)

PCA and OPLS-DA scatter plots representing the safflower samples and loading plots of their 56 constituents are presented in Figure 3. In the PCA plot, the orange C. tinctorius and C. palaestinus, yellow C. lanatus, and white C. lanatus (PI 202728) were clearly separated, with sample points located at the top left, bottom left, and bottom right quadrant, respectively. All three individuals of C. turkestanicus and one C. lanatus (PI 235666) individual formed a loose group at the top right PCA plot quadrant, but the middle stage florets of light-yellow C. turkestanicus (PI 426425) were excluded. The pistils of these safflower wild species were yellow except for PI 202728. Factor loadings in the first component revealed that the compounds with the highest contributions were kaempferin, luteolin 7-O-glucuronide, apigenin 7-O-β-D-glucuronide, 1,5-dicaffeoylquinic acid, xanthorin, 2′-hydroxygenistein, quercetin, 3-O-methylquercetin, scutellarein, 3′-O-methylluteolin, quercetin 3-O-(6-O-malonyl-β-D-glucoside), narcissoside, apigenin, myricitrin, and kaempferol, with eigenvectors ranging between 0.22 and 0.15, which indicated that they were present at higher levels mainly in the early-stage florets of PI 235666 (C. lanatus) and all individuals of C. turkestanicus. Safflomin A, baimaside, AHSYB, glucoaurantio-obtusin, and dihydrokaempferol contributed the least to component 1 (eigenvector values between −0.21 and −0.15), further confirming that the orange and yellow florets (all grouped in the left [negative] side of the PCA plot) contained higher levels of these components. Other constituents, including rutin, p-coumaric acid, aconitic acid, kaempferol 3-O-β-D-glucosylgalactoside, scolymoside, and kaempferol 3-O-β-rutinoside, contributed highly to component 2 with eigenvectors ranging from 0.21 to 0.34, whereas pantothenic acid, caffeoylquinic acid, and syringetin had negative eigenvector values of −0.25, −0.17, and −0.15, respectively. OPLS-DA was performed to examine the distribution in the safflower species and highlight the distinguishing metabolites. The metabolites with statistically significant relevance for explaining the differences among species were identified. Twenty-four metabolites had variable importance in projection (VIP) scores greater than or equal to 1. Rutin, myricitrin, isoquercetin, and aconitic acid had the highest contributions in decreasing order with VIP scores greater than 1.5. The score plot of the OPLS-DA (Figure 3c) clearly revealed the separation of most safflower species based on floret color. Each of the orange, yellow, white, and cream colored species essentially appeared in different quadrants of the OPLS-DA plot except for PI 426425 (C. turkestanicus) at the early and late stages of development, which were grouped together with creamy-floret species.

2.4. Quantification of Metabolites with High VIP Scores

The contents of metabolites that significantly contributed to discriminating among safflower species are presented in Figure 4 and Table S2. The chromaticity-related components safflomin A and AHSYB were among the dominant metabolites in C. tinctorius and C. palaestinus. Safflomin A was detected in all samples, with contents ranging from 1.64 to 109.14 mM, whereas AHSYB was only found in C. tinctorius and C. palaestinus and varied between 31.17 and 73.13 mM. Isoflavonoids and flavones, unlike quinochalcones, accumulated at higher levels in non-orange and non-yellow florets. Pratensein and 2’-hydroxygenistein dominated in C. turkestanicus and C. lanatus, respectively. Most of the isoflavonoids were not detected in C. tinctorius, C. palaestinus, and yellow-pigmented C. lanatus (W6 16791), and 6-hydroxydaidzein was detected only in C. lanatus (PI 202728 and PI 235666). A similar trend was observed in flavones with luteolin 7-O-glucuronide ranging from 216.08 to 440.72 mM in C. turkestanicus and two C. lanatus (PI 202728 and PI 235666) individuals. The flavonols were distributed in all species; C. lanatus (PI 202728) with white florets accumulated the largest amount, whereas C. lanatus (W6 16791) with yellow florets accumulated the lowest. Myricitrin and isoquercetin, whose contents ranged from 0.00 to 133.43 mM and 1.16 to 78.42 mM, respectively, contributed the most to the overall levels of flavonols with high VIP scores. Myricitrin was not detected in orange florets of C. tinctorius and C. palaestinus. Phenylpropanoids were distributed throughout all species with 1,5-dicaffeoylquinic acid, ferulic acid, and p-coumaric acid predominating. However, the identities of the dominant compounds varied among species. Whereas p-coumaric acid was dominant in C. tinctorius and C. palaestinus, 1,5-dicaffeoylquinic acid was only detected in C. turkestanicus and C. lanatus (Table S2).

3. Discussion

Various morphological descriptions of safflower have been published [74,75]. Floret color is an important phenotypic trait that indicates the chemical characteristics of safflower. Safflower florets exhibit several colors ranging from white to yellow/red/orange depending on the variety, genotype, and developmental stage [4]. Yellow is the predominant petal color in many Carthamus spp. [76]. Previously collected data accessions of C. tinctorius variants revealed that white, pale yellow, yellow orange, orange, orange red, and red pigments exist, as well as both spiny and spineless and small-, medium-, and large-headed florets [77,78]. Data on the phenotypes of the safflower wild species C. lanatus, C. palaestinus, and C. turkestanicus in the literature are lacking.
In this study, the metabolic profiles of wild and cultivated safflower species were studied using LC-ESI-QTOF-MS. Flavonols absorb wavelengths of approximately 340 nm due to the flavonol aglycone. Flavonoids have ether, ester, and C4–C8 bonds that can be easily cleaved in mass analysis. The retention times of the metabolites, comparison with commercial standards, comparison of mass fragmentation patterns with those in databases (in-house chemical libraries and public libraries), and the literature simultaneously assist in the chemical assignment of aglycone structures and their derivatives. Flavonol and flavone glycosides in safflower mainly consist of combinations of aglycones, glucuronidation, glycosylation, and sugar groups. Flavonoid fragmentation is characterized by the elimination of sugar residues and the formation of aglycone product ions [79,80,81]. In this study, luteolin, apigenin, kaempferol, quercetin, myricetin, and naringenin were prevalent aglycones of safflower florets. Quinochalcones occur as monomeric or dimeric C-glucosides and display a prominent band in their ultraviolet–visible spectra at approximately 403 nm, which helps to differentiate them from other flavonoids [66]. Safflomin A and AHSYB quinochalcones were identified in this study. The specific fragmentation patterns of quinochalcones from C. tinctorius have been previously described [50,82] and reviewed [66].
Metabolite profiling was combined with chemometrics with the goal of identifying specific constituents based on species and color of safflower florets. PCA can reveal intrinsic similarities and differences in metabolite abundance in a given sample collection. In this study, PCA was performed to classify 24 floret samples (three wild and one cultivated safflower species at three different developmental stages) based on the relative peak areas of 56 identified chemical components. OPLS-DA was conducted to validate the classification. The PCA and OPLS-DA results revealed that the samples tended to form groups based on floret color. The VIP score represents the contribution of each constituent to the OPLS-DA model. The larger the VIP score, the greater the contribution. Usually, components with VIP scores greater than 1 are considered more important in distinguishing samples. The chemical components with higher VIP scores were closely related to color characteristics.
Accumulation of metabolites in safflower florets is highly influenced by various factors, including harvest time and/or flower development [27,83,84], color [28,29,30], genotype/cultivar [23,84,85], and drought stress [86]. Safflowers with different colors exhibit a wide variety in the quality and quantity of their chemical constituents. For example, safflomin A levels decrease as safflower florets become less red and darker [29]. In another study, orange and white safflower florets contained high levels of safflomin A and kaempferol-3-O-β-D-glucoside, respectively [30]. Strong associations between various chemical components and color were reported in safflower [28] and other food samples [87]. Harvest time affected the levels of red and yellow pigments in C. tinctorius, with levels of yellow components peaking at the beginning of flowering and decreasing during flower development, whereas those of the red components increased [27,84]. This is in concordance with safflower florets reddening during development. In the OPLS-DA plot (Figure 3), safflomin A and quinic acid are located in the bottom-right quadrant, similar to the orange samples, whereas scolymoside and kaempferol 3-O-β-rutinoside are found in the same location as the yellow samples. This suggests that these compounds contribute to the corresponding orangeness and yellowness of the florets. Pu et al. (2019) [28] reported that safflomin A, AHSYB, and safflomin C made safflower florets brighter, and more red, yellow, and orange-yellow, whereas 6-hydroxykaempferol-3-O-β-D-glucoside and kaempferol-3-O-rutinoside made safflower florets more orange-yellow. In our study, floret color seems to be a very important indicator of metabolite accumulation. The two orange cultivated (C. tinctorius) and wild (C. palaestinus) species of safflower had similar metabolite profiles despite being distinct species. This could be partly due to their similar floret color and the genetic relationship between the two species as indicated by the phylogenetic studies described in the introduction section. Choice of extraction solvent dictates the identity and quantity of metabolites that could be recovered from plant sources. Methanol is a commonly used solvent for extraction of hydrophilic polyphenols [88,89]. Methanol has been used to extract phenolic compounds from safflower plant [28,85,90]. This study was mainly focused on phenylpropanoids and flavonoids.
Absolute quantification of the metabolites that had high VIP scores and significant contributions for discrimination analysis was performed. Although the identity and quantity of some metabolites varied among floret developmental stages, the pattern of variation was inconsistent and, hence, inconclusive. However, during the floret developmental stages in C. tinctorius, changes in polyphenol, flavonoid, and proanthocyanidin contents have been reported, with the levels peaking at the middle stage [83]. A comparison of the levels of metabolites quantified in our study revealed that orange flowers had higher levels of quinochalcones, whereas white and creamy ones accumulated higher levels of isoflavonoids, flavones, and flavonols. Salem et al. (2011) [83] found that the level of total flavonoids and total phenolic compounds increased in the following order: yellow < red < orange flowers.
The chemical components of safflower identified in this study are involved in various metabolic pathways. The main biosynthetic metabolic pathways involve phenylpropanoids, chalcone isoflavonoids, flavanones, flavones, and flavonols. Simplified metabolic pathways that include phenylpropanoids and flavonoids in safflower florets are presented in Figure 5. The phenylpropanoid and polyketide pathways are responsible for the biosynthesis of flavonoids. The former is derived from phenylalanine and tyrosine and is responsible for the formation of p-coumaroyl-CoA, whereas the latter is responsible for the elongation of the C2 chain using malonyl-CoA as the condensing unit. The first enzyme responsible for the biosynthesis of flavonoids is chalcone synthase. The formation of naringenin chalcone is catalyzed by chalcone synthase in the polyketide pathway from p-coumaroyl-CoA and malonyl-CoA [90]. Naringenin chalcone undergoes stereospecific cyclization to form a flavanone, naringenin, with the help of the enzyme chalcone isomerase. Naringenin plays a central role in the metabolic pathway for the formation of other flavanones, isoflavonoids, flavones, and flavonols. Chalcone isomerase also converts tetrahydroxychalcone into naringenin. Flavanone 3-hydroxylase catalyzes the oxygenation of naringenin at the 3-position to form dihydrokaempferol (aromadendrin), which is subsequently converted to kaempferol, which then is converted to quercetin. Shikimate/quinate hydroxycinnamoyltransferase genes convert p-coumaroyl-CoA into caffeoyl-CoA, which is further converted to eriodictoyl or 1,5-dicaffeoylquinic acid. Flavonoid scaffolds also undergo several tailoring reactions, such as glycosylation, methylation, and acylation, resulting in the formation of diverse metabolites with different physicochemical and biological properties, catalyzed by flavonoid glycosyltransferase, flavonoid methyltransferase, and flavonoid acyltransferase, respectively.

4. Materials and Methods

4.1. Plant Samples and Chemicals

Three wild Carthamus species (C. lanatus, C. palaestinus, and C. turkestanicus) and a cultivated species, C. tinctorius, were obtained from the USDA National Plant Germplasm System via the Germplasm Resource Information Network and planted in a greenhouse maintained at 18–25 °C located at the National Institute of Agricultural Sciences, Jeonju, Korea. Sample information and some phenotypic characters are presented in Table 2. Flowers from the plants were collected by handpicking at three developmental stages (early, middle, and late stages). Since the stages of flower development were not morphologically the same for the different species, the florets were collected at different time. Early stage samples were collected before the onset of flowering; the middle stage samples at the stage when the flowering is considered complete (more than 90% of florets open); and the late stage samples were collected when the capitulum begins to expand and the seeds are about to start developing. The flowers of each plant were continuously monitored and quickly collected at the required stage of development. Sample collection was initiated at approximately 12 weeks after seed planting. At the early stage, flower heads were removed and washed with distilled water, after which excess water was removed using filter paper. Flowers at the middle and late stages were directly collected by handpicking from flower heads. Samples were snap-frozen using liquid nitrogen, then freeze-dried and stored at –80 °C until further processing.
All reagents were LC/MS-grade. Methanol, acetonitrile (ACN), and water were purchased from Merck (Darmstadt, Germany). Formic acid was obtained from Sigma-Aldrich (St. Louis, MO, USA). Standards of quinic acid, aconitic acid, pantothenic acid, 5-O-caffeoylshikimic acid, kaempferol 3-O-β-D-glucosylgalactoside, rutin, p-coumaric acid, myricitrin, scolymoside, isoquercetin, luteolin 7-O-β-D-glucoside, safflomin A, ferulic acid, narcissoside, kaempferol 3-O-β-rutinoside, astragalin, luteolin 7-O-glucuronide, trifolin, 1,5-dicaffeoylquinic acid, 6-hydroxydaidzein, apigenin 7-O-β-D-glucuronide, kaempferin, malonylgenistin, AHSYB, 2′-hydroxygenistein, xanthorin, pratensein, and 3′-O-methylluteolin were purchased from ChemFaces (Wuhan, China).

4.2. Sample Preparation and Extraction

For metabolite extraction, all samples were freeze-dried, and 25 mg of each sample was weighed and transferred to a cryotube (2.0 mL) containing zirconia beads (YTZ-5; 5-4060-13; 5-mm diameter; AS ONE, Osaka, Japan). Into each cryotube, 1 mL of 70% methanol was added. The sample solutions were homogenized using a beads shocker operating at 25 Hz for 2 min (at 4 °C) five times, followed by centrifugation at 15,000× g for 5 min (at 4 °C). Then, the upper aqueous layer was carefully removed (~800 μL) and filtered using prewashed filters (0.2 µm, GHP, 13 mm; Pall, Port Washington, NY, USA). The filtrates containing the metabolites were diluted and mixed with an internal standard (2.5 µm, 7-hydroxy-5-methylflavone) at a 1:1 ratio. Then, the extracts were transferred into a 2-mL amber vial and injected into the LC-ESI-QTOF-MS system. The samples were analyzed in biological triplicates.

4.3. LC-ESI-QTOF-MS Analysis of Metabolites

Metabolite qualification and quantification was carried out using a Shimadzu liquid chromatography system (Nexera X2 UHPLC; Shimadzu, Kyoto, Japan) equipped with a quadrupole time-of-flight mass spectrometer (AB Sciex, Ontario, CA, USA) in positive and negative electrospray ionization (ESI) modes, followed by peak extraction using automatic integration software (MasterView v1.1; AB Sciex). Metabolites were analyzed under the following conditions. The LC-ESI-QTOF-MS system was controlled by Shimadzu software (Lab Solutions v5.73; Nexera X2 UHPLC; Shimadzu) for liquid chromatography, and a reversed-phase column (Shim-pack GIS-ODS-I column, 3 µm, 3.0 × 100 mm; Shimadzu) was used. The run solution was 0.1% formic acid in ACN, which was also used for rinsing. The column oven temperature was maintained at 40 °C, and the mobile phase was composed of 0.1% formic acid in water (eluent A) and 0.1% formic acid in ACN (eluent B). The elution conditions were as follows: 0–1 min, 10% of eluent B; 1–25 min, 10–100% of eluent B; 25–40 min, 100% of eluent B; and 40–41 min, 10% of eluent B. The flow rate and injection volume were maintained at 0.5 mL/min and 5 μL, respectively. Mass spectrometry conditions were maintained as follows: nebulizing gas, 50 psi; heating gas, 50 psi; curtain gas, 25 psi; temperature, 550 °C; ion spray voltage, floating between 4.5 and 5.5 kV; fragmentation, 35 collision energy; and 15 collision energy spread, TOF/MS and TOF/MS/MS scan ranges of 50–1500 and 50–1500 m/z, respectively. Samples were diluted two-fold and five-fold for the positive and negative ionization modes, respectively, to improve analysis quality.

4.4. Qualitative Analysis and Data Processing

Fifty-six metabolites were identified based on comparisons of retention times and mass fragmentation patterns with commercial standards, previous reports, a mass spectrometry database (The Accurate Mass Metabolite Spectral Library; AB Sciex), and an in-house library. Peaks were automatically extracted using MasterView integration software to obtain various peak information, including m/z value, migration time (MT), and peak area. All signal peaks potentially corresponding to authentic compounds were extracted, whereas others corresponding to isotopomers, adduct ions, and other product ions of known metabolites were excluded. The MTs of extracted peaks were normalized using the MTs of the internal standards, followed by peak alignment according to the m/z values and normalized MT values. Finally, peak areas were normalized against that of the internal standard (7-hydroxy-5-methylflavone). The resultant relative peak area values were further normalized by sample amount. Annotation tables were constructed from LC-ESI-QTOF-MS analysis of authentic standards and aligned with the datasets based on similar m/z and normalized MT values. The peak detection limit was determined according to the signal-to-noise ratio, which was 20. The relative peak area was calculated as follows:
Relative   Peak   Area =   Metabolite   Peak   Area   Internal   Standard   Peak   Area  

4.5. Quantification of Metabolites and Statistical Analysis

Absolute quantification of 27 metabolites was performed. The concentrations of the metabolites were calculated using linear regression equations derived from the calibration curves of the corresponding commercial standards. Results are presented as the mean ± standard deviation of triplicate experiments. Pearson correlation analysis was performed using SPSS v17.0 statistical software (SPSS Inc., Chicago, IL, USA). PCA and OPLS-DA were performed using SIMCA v13.0.3 software (Umetrics, Umea, Sweden). Quantitative expression of the metabolites was normalized using the preprocessCore package in Bioconductor software [91], and heat maps were generated using MeV v4.9.0 software [92].

5. Conclusions

Wide diversity in quality and quantity of metabolites among safflower species were explored. A total 56 metabolites were identified and absolute quantification of 27 significantly differential metabolites was performed. The cultivated safflower species, C. tinctorius and the wild safflower species, C. palaestinus showed a strong resemblance to each other in terms of the identity and amount of metabolites. The orange colored florets showed high abundance of safflomin A, anhydrosafflor yellow B, and baimaside while white/whitish and light yellow pigmented florets had high abundance of 1, 5-dicaffeoylquinic acid, luteolin 7-O-glucuronide, and apigenin 7-O-β-D-glucuronide. Data were analyzed using multivariate statistical methods, PCA and OPLS-DA, and heat maps. The results demonstrated that a clear separation of the samples based on their color, indicating that color is a dominant factor dictating the identity and quantity of the metabolites.

Supplementary Materials

The following are available online at https://www.mdpi.com/2218-1989/10/11/440/s1. Table S1: Relative peak areas of metabolites identified in florets of cultivated and safflower wild species, Table S2: Contents (mM) of metabolites with high VIP values in the florets of safflower.

Author Contributions

B.-S.H. and J.K. conceived and designed the experiments; J.K., V.M., A.D.A., J.S., and B.-S.H. performed the experiments; J.K., A.D.A., D.-G.K., and B.-S.H., analyzed the data; B.-S.H., S.P., S.-K.L., and K.L. contributed reagents/materials/analysis tools; and A.D.A. and B.-S.H. wrote the manuscript.

Funding

This research received no external funding.

Acknowledgments

We would like to thank Geun-Hyang Lim for cultivating the plants. The authors want to acknowledge funding through grants allocated to B.S.H. from the National Institute of Agricultural Sciences (Project No. PJ01333401), Rural Development Administration, Korea. This study was supported by the 2020 Postdoctoral Fellowship Program (V.M. and A.D.A.) of the National Institute of Agricultural Sciences, RDA, Korea.

Conflicts of Interest

The authors declare no conflict of interest.

References

  1. Turgumbayeva, A.A.; Ustenova, G.O.; Yeskalieva, B.K.; Ramazanova, B.A.; Rahimov, K.D.; Aisa, H.; Juszkiewicz, K.T. Volatile oil composition of Carthamus tinctorius L. flowers grown in Kazakhstan. Ann. Agric. Environ. Med. 2018, 25, 87–89. [Google Scholar] [CrossRef] [PubMed]
  2. Mani, V.; Lee, S.; Yeo, Y.; Hahn, B. A metabolic perspective and opportunities in pharmacologically important safflower. Metabolites 2020, 10, 253. [Google Scholar] [CrossRef]
  3. Asgarpanah, J.; Kazemivash, N. Phytochemistry, pharmacology and medicinal properties of Carthamus tinctorius L. Chin. J. Integr. Med. 2013, 19, 153–159. [Google Scholar] [CrossRef] [PubMed]
  4. Dajue, L.; Mündel, H.-H. Safflower (Carthamus tinctorius L.). Promoting the Conservation and Use of under-Utilized and Neglected Crops. 7; International Plant Genetic Resources Institute: Rome, Italy, 1996; ISBN 9290432977. [Google Scholar]
  5. Park, S.D.; Park, K.S.; Kim, K.J.; Kim, J.C.; Yoon, J.T.; Khan, Z. Effect of sowing time on development of safflower anthracnose disease and degree of resistance in various cultivars. J. Phytopathol. 2005, 153, 48–51. [Google Scholar] [CrossRef]
  6. Knowles, P.F. Safflower. Adv. Agron. 1959, 10, 289–323. [Google Scholar]
  7. Ashri, A.; Knowles, P.F. Cytogenetics of safflower (Carthamus L.) species and their hybrids. Agron. J. 1960, 52, 11–17. [Google Scholar] [CrossRef] [Green Version]
  8. Khidir, M.O. Evolution of the genetic system of safflower (Carthamus L.). Genetica 1969, 40, 84–88. [Google Scholar] [CrossRef]
  9. Khidir, O.; Knowles, P.F. Cytogenetic studies of Carthamus species (Compositae) with 32 pairs of chromosomes. I. Intrasectional hybridization. Am. J. Bot. 1970, 57, 123–129. [Google Scholar] [CrossRef]
  10. Khidir, M.O.; Knowles, P.F. Cytogenetic studies of Carthamus species (Compositae) with 32 pairs of chromosomes. II. Intersectional hybridization. Can. J. Genet. Cytol. 1970, 12, 90–99. [Google Scholar] [CrossRef]
  11. Vilatersana, R.; Brysting, A.K.; Brochmann, C. Molecular evidence for hybrid origins of the invasive polyploids Carthamus creticus and C. turkestanicus (Cardueae, Asteraceae). Mol. Phylogenet. Evol. 2007, 44, 610–621. [Google Scholar] [CrossRef]
  12. Estilai, A.; Knowles, P.F. Relationship of Carthamus leucocaulos to other Carthamus species (Compositae). Can. J. Genet. Cytol. 1978, 20, 221–233. [Google Scholar] [CrossRef]
  13. Sehgal, D.; Raina, S.N. Carthamus. In Wild Crop Relatives: Genomic and Breeding Resources. Oilseeds; Kole, C., Ed.; Springer-Verlag: Berlin, Germany, 2011; pp. 63–95. ISBN 9783642148712. [Google Scholar]
  14. Baker, H.G. Taxonomy and the biological species concepts in cultivated plants. In Genetic Resources in Plants—Their Exploration and Conservation; Frankel, O.H., Bennett, E., Eds.; Blackwell Scientific Publications: Oxford, UK, 1970; pp. 49–65. [Google Scholar]
  15. Harvey, B.L.; Knowles, P.F. Natural and artificial alloploids with 22 pairs of chromosoms in the genus Carthamus (Compositae). Can. J. Genet. Cytol. 1965, 7, 126–139. [Google Scholar] [CrossRef]
  16. Efron, Y.; Peleg, M.; Ashri, A. Alcohol dehydrogenase allozymes in the safflower Carthamus L. Biochem. Genet. 1973, 9, 299–308. [Google Scholar] [CrossRef]
  17. Sasanuma, T.; Sehgal, D.; Sasakuma, T.; Raina, S.N. Phylogenetic analysis of Carthamus species based on the nucleotide sequence of the nuclear SACPD gene and chloroplast trnL–trnF IGS region. Genome 2008, 51, 721–727. [Google Scholar] [CrossRef] [PubMed]
  18. Ambreen, H.; Kumar, S.; Variath, M.T.; Joshi, G.; Bali, S.; Agarwal, M.; Kumar, A.; Jagannath, A.; Goel, S. Development of genomic microsatellite markers in Carthamus tinctorius L. (safflower) using next generation sequencing and assessment of their cross-species transferability and utility for diversity analysis. PLoS ONE 2015, 10, e0135443. [Google Scholar] [CrossRef] [PubMed] [Green Version]
  19. Chapman, M.A.; Burke, J.M. DNA sequence diversity and the origin of cultivated safflower (Carthamus tinctorius L.; Asteraceae). BMC Plant Biol. 2007, 7, 60. [Google Scholar] [CrossRef] [Green Version]
  20. Agrawal, R.; Tsujimoto, H.; Tandon, R.; Rao, S.R.; Raina, S.N. Species-genomic relationships among the tribasic diploid and polyploid Carthamus taxa based on physical mapping of active and inactive 18S–5.8S–26S and 5S ribosomal RNA gene families, and the two tandemly repeated DNA sequences. Gene 2013, 521, 136–144. [Google Scholar] [CrossRef]
  21. Sehgal, D.; Rajpal, V.R.; Raina, S.N. Chloroplast DNA diversity reveals the contribution of two wild species to the origin and evolution of diploid safflower (Carthamus tinctorius L.). Genome 2008, 51, 638–643. [Google Scholar] [CrossRef]
  22. Sehgal, D.; Raina, S.N.; Devarumath, R.M.; Sasanuma, T.; Sasakuma, T. Nuclear DNA assay in solving issues related to ancestry of the domesticated diploid safflower (Carthamus tinctorius L.) and the polyploid (Carthamus) taxa, and phylogenetic and genomic relationships in the genus Carthamus L. (Asteraceae). Mol. Phylogenet. Evol. 2009, 53, 631–644. [Google Scholar] [CrossRef]
  23. Kazuma, K.; Takahashi, T.; Sato, K.; Takeuchi, H.; Matsumoto, T.; Okuno, T. Quinochalcones and flavonoids from fresh florets in different cultivars of Carthamus tinctorius L. Biosci. Biotechnol. Biochem. 2000, 64, 1588–1599. [Google Scholar] [CrossRef]
  24. Golkar, P.; Arzani, A.; Rezaei, A.M. Inheritance of flower colour and spinelessness in safflower (Carthamus tinctorius L.). J. Genet. 2010, 89, 259–262. [Google Scholar] [CrossRef] [PubMed]
  25. Flemmer, A.C.; Franchini, M.C.; Lindström, L.I. Description of safflower (Carthamus tinctorius) phenological growth stages according to the extended BBCH scale. Ann. Appl. Biol. 2015, 166, 331–339. [Google Scholar] [CrossRef]
  26. Kumazawa, T.; Sato, S.; Kanenari, D.; Kunimatsu, A.; Hirose, R.; Matsuba, S.; Obara, H.; Suzuki, M.; Sato, M.; Onodera, J. Precursor of carthamin, a constituent of safflower. Chem. Lett. 1994, 23, 2343–2344. [Google Scholar] [CrossRef]
  27. Mohammadi, M.; Tavakoli, A. Effect of harvest time of spring safflower (Carthamus tinctorius L.) florets on the production of red and yellow pigments. Qual. Assur. Saf. Crop. Foods 2015, 7, 581–588. [Google Scholar] [CrossRef]
  28. Pu, Z.-J.; Yue, S.-J.; Zhou, G.-S.; Yan, H.; Shi, X.-Q.; Zhu, Z.-H.; Huang, S.-L.; Peng, G.-P.; Chen, Y.-Y.; Bai, J.-Q.; et al. The comprehensive evaluation of safflowers in different producing areas by combined analysis of color, chemical compounds, and biological activity. Molecules 2019, 24, 3381. [Google Scholar] [CrossRef] [Green Version]
  29. Xu, M.; Du, C.; Zhang, N.; Shi, X.; Wu, Z.; Qiao, Y. Color spaces of safflower (Carthamus tinctorius L.) for quality assessment. J. Tradit. Chinese Med. Sci. 2016, 3, 168–175. [Google Scholar] [CrossRef]
  30. Tu, Y.; Li, D.; Fan, L.; Jia, X.; Guo, D.; Xin, H.; Guo, M. DOXC-class 2-oxoglutarate-dependent dioxygenase in safflower: Gene characterization, transcript abundance, and correlation with flavonoids. Biochem. Syst. Ecol. 2018, 80, 14–20. [Google Scholar] [CrossRef]
  31. Akihisa, T.; Yasukawa, K.; Oinuma, H.; Kasahara, Y.; Yamanouchi, S.; Takido, M.; Kumaki, K.; Tamura, T. Triterpene alcohols from the flowers of Compositae and their anti-inflammatory effects. Phytochemistry 1996, 43, 1255–1260. [Google Scholar] [CrossRef]
  32. Zhang, H.L.; Nagatsu, A.; Watanabe, T.; Sakakibara, J.; Okuyama, H. Antioxidative compounds isolated from safflower (Carthamus tinctorius L.) oil cake. Chem. Pharm. Bull. (Tokyo) 1997, 45, 1910–1914. [Google Scholar] [CrossRef] [Green Version]
  33. Takii, T.; Hayashi, M.; Hiroma, H.; Chiba, T.; Kawashima, S.; Zhang, H.L.; Nagatsu, A.; Sakakibara, J.; Onozaki, K. Serotonin derivative, N-(p-coumaroyl)serotonin, isolated from safflower (Carthamus tinctorius L.) oil cake augments the proliferation of normal human and mouse fibroblasts in synergy with basic fibroblast growth factor (bFGF) or epidermal growth factor (EGF). J. Biochem. 1999, 125, 910–915. [Google Scholar] [PubMed]
  34. Hotta, Y.; Nagatsu, A.; Liu, W.; Muto, T.; Narumiya, C.; Lu, X.; Yajima, M.; Ishikawa, N.; Miyazeki, K.; Kawai, N.; et al. Protective effects of antioxidative serotonin derivatives isolated from safflower against postischemic myocardial dysfunction. Mol. Cell. Biochem. 2002, 238, 151–162. [Google Scholar] [CrossRef]
  35. Mitova, M.; Taskova, R.; Popov, S.; Berger, R.G.; Krings, U.; Handjieva, N. GC/MS analysis of some bioactive constituents from Carthamus lanatus L. Z. Nat. C 2003, 58, 697–703. [Google Scholar] [CrossRef] [PubMed] [Green Version]
  36. Taskova, R.; Mitovab, M.; Mikhova, B.; Duddeck, H. Bioactive phenolics from Carthamus lanatus L. Z. Nat. C 2003, 58, 704–707. [Google Scholar] [CrossRef] [PubMed] [Green Version]
  37. Mikhova, B.; Duddeck, H.; Taskova, R.; Mitova, M.; Alipieva, K. Oxygenated bisabolane fucosides from Carthamus lanatus L. Z. Nat. C 2004, 59, 244–248. [Google Scholar] [CrossRef] [Green Version]
  38. Koyama, N.; Kuribayashi, K.; Seki, T.; Kobayashi, K.; Furuhata, Y.; Suzuki, K.; Arisaka, H.; Nakano, T.; Amino, Y.; Ishii, K. Serotonin derivatives, major safflower (Carthamus tinctorius L.) seed antioxidants, inhibit low-density lipoprotein (LDL) oxidation and atherosclerosis in apolipoprotein E-deficient mice. J. Agric. Food Chem. 2006, 54, 4970–4976. [Google Scholar] [CrossRef]
  39. Hao, G.Z.; In, G.Q.; Ai, Y.G.; Uo, L.G. Structural identification of a new tri-p-coumaroylspermidine with serotonin transporter inhibition from safflower. Chem. Pharm. Bull. (Tokyo) 2010, 58, 950–952. [Google Scholar]
  40. Zhou, X.; Tang, L.; Xu, Y.; Zhou, G.; Wang, Z. Towards a better understanding of medicinal uses of Carthamus tinctorius L. in traditional Chinese medicine: A phytochemical and pharmacological review. J. Ethnopharmacol. 2014, 151, 27–43. [Google Scholar] [CrossRef]
  41. Obara, H.; Onodera, Ju. Structure of carthamin. Chem. Lett. 1979, 8, 201–204. [Google Scholar] [CrossRef]
  42. Kazuma, K.; Shirai, E.; Wada, M.; Umeo, K.; Sato, A.; Matsumoto, T.; Okuno, T. Structure of precarthamin, a biosynthetic precursor of carthamin. Biosci. Biotechnol. Biochem. 1995, 59, 1588–1590. [Google Scholar] [CrossRef]
  43. Takahashi, Y.; Saito, K.; Yanagiya, M.; Ikura, M.; Hikichi, K.; Matsumoto, T.; Wada, M. Chemical constitution of safflower yellow B, a quinochalcone C-glycoside from the flower petals of Carthamus tinctorius L. Tetrahedron Lett. 1984, 25, 2471–2474. [Google Scholar] [CrossRef]
  44. Ondera, J.; Obara, H.; Osone, M.; Maruyama, Y.; Sato, S. The structure of safflomin-A, a component of safflower yellow. Chem. Lett. 1981, 10, 433–436. [Google Scholar] [CrossRef]
  45. Takahashi, Y.; Miyasaka, N.; Tasaka, S.; Miura, I.; Urano, S.; Ikura, M.; Hikichi, K.; Matsumoto, T.; Wada, M. Constitution of two coloring matters in the flower petals of Carthamus tinctorius L. Tetrahedron Lett. 1982, 23, 5163–5166. [Google Scholar] [CrossRef]
  46. Goda, Y.; Suzuki, J.; Maitani, T. Structure of safflomin A and content of safflomin (safflor yellow) in commercial safflower yellow product. Jpn. J. Food Chem. 1997, 4, 54–58. [Google Scholar]
  47. Onodera, J.; Obara, H.; Hirose, R.; Matsuba, S.; Sato, N.; Sato, S.; Suzuki, M. The structure of safflomin C, a constituent of safflower. Chem. Lett. 1989, 18, 1571–1574. [Google Scholar] [CrossRef]
  48. Meselhy, M.R.; Kadota, S.; Momose, Y.; Hattori, M.; Namba, T. Tinctormine, a novel Ca2+ antagonist N-containing quinochalcone C-glycoside from Carthamus tinctorius L. Chem. Pharm. Bull. (Tokyo) 1992, 40, 3355–3357. [Google Scholar] [CrossRef] [Green Version]
  49. Yin, H.-B.; He, Z.-S. A novel semi-quinone chalcone sharing a pyrrole ring C-glycoside from Carthamus tinctorius. Tetrahedron Lett. 2000, 41, 1955–1958. [Google Scholar] [CrossRef]
  50. Jin, Y.; Zhang, X.-L.; Shi, H.; Xiao, Y.-S.; Ke, Y.-X.; Xue, X.-Y.; Zhang, F.-F.; Liang, X.-M. Characterization of C-glycosyl quinochalcones in Carthamus tinctorius L. by ultraperformance liquid chromatography coupled with quadrupole-time-of-flight mass spectrometry. Rapid Commun. Mass Spectrom. 2008, 22, 1275–1287. [Google Scholar] [CrossRef]
  51. Yue, S.-J.; Qu, C.; Zhang, P.-X.; Tang, Y.-P.; Jin, Y.; Jiang, J.-S.; Yang, Y.-N.; Zhang, P.-C.; Duan, J.-A. Carthorquinosides A and B, quinochalcone C-glycosides with diverse dimeric skeletons from Carthamus tinctorius. J. Nat. Prod. 2016, 79, 2644–2651. [Google Scholar] [CrossRef]
  52. He, J.; Yang, Y.-N.; Jiang, J.; Feng, Z.-M.; Zhang, P.-C. Saffloflavonesides A and B, two rearranged derivatives of flavonoid C-glycosides with a furan − tetrahydrofuran ring from Carthamus tinctorius. Org. Lett. 2014, 16, 5714–5717. [Google Scholar] [CrossRef] [PubMed]
  53. Zhou, Y.-Z.; Chen, H.; Qiao, L.; Xu, N.; Cao, J.-Q.; Pei, Y.-H. Two new compounds from Carthamus tinctorius. J. Asian Nat. Prod. Res. 2008, 10, 429–433. [Google Scholar] [CrossRef] [PubMed]
  54. Lee, J.Y.; Chang, E.J.; Kim, H.J.; Park, J.H.; Choi, S.W. Antioxidative flavonoids from leaves of Carthamus tinctorius. Arch. Pharm. Res. 2002, 25, 313–319. [Google Scholar] [CrossRef]
  55. Shin-jun, Y.; Yu-ping, T.; Lin-yan, W.; Hao, T.; Shu-Jiao, L.; Pei, L.; Shu-lan, S.; Jin-ao, D. Separation and evaluation of antioxidant constituents from Carthamus tinctorius. China J. Chin. Mater. Med. 2014, 39, 3295–3300. [Google Scholar] [CrossRef]
  56. Rahamatalla, A.B.; Babiker, E.E.; Krishna, A.G.; ELTinay, A.H. Changes in fatty acids composition during seed growth and physicochemical characteristics of oil extracted from four safflower cultivars. Plant Foods Hum. Nutr. 2001, 56, 385–395. [Google Scholar] [CrossRef] [PubMed]
  57. Conte, R.; Gullich, L.M.D.; Bilibio, D.; Zanella, O.; Bender, J.P.; Carniel, N.; Priamo, W.L. Pressurized liquid extraction and chemical characterization of safflower oil: A comparison between methods. Food Chem. 2016, 213, 425–430. [Google Scholar] [CrossRef] [PubMed]
  58. Zhao, B.; Li, H.; Lan, T.; Wu, D.; Pan, L.; Chen, Z. Preparation of high-purity trilinolein and triolein by enzymatic esterification reaction combined with column chromatography. J. Oleo Sci. 2019, ess18142. [Google Scholar] [CrossRef]
  59. Zhou, Y.-Z.; Qiao, L.; Chen, H.; Li, R.-F.; Hua, H.-M.; Pei, Y.-H. New aromatic glucosides from Carthamus tinctorius. J. Asian Nat. Prod. Res. 2008, 10, 817–821. [Google Scholar] [CrossRef]
  60. Huang, X.-X.; Yan, Z.-Y.; Liu, S.; Wang, X.-B.; Song, S.-J. Investigation of chemical constituents of safflower and their tyrosinase inhibitory activity. J. Asian Nat. Prod. Res. 2019, 31, 248–256. [Google Scholar] [CrossRef]
  61. Li, W.-C.; Wang, X.-Y.; Lin, P.-C.; Hu, N.; Zhang, Q.-L.; Suo, Y.-R.; Ding, C.-X. Preparative separation and purification of four cis–trans isomers of coumaroylspermidine analogs from safflower by high-speed counter-current chromatography. J. Chromatogr. B 2013, 938, 75–79. [Google Scholar] [CrossRef]
  62. Kim, H.J.; Bae, Y.C.; Park, R.W.; Choi, S.W.; Cho, S.H.; Choi, Y.S.; Lee, W.J. Bone-protecting effect of safflower seeds in ovariectomized rats. Calcif. Tissue Int. 2002, 71, 88–94. [Google Scholar] [CrossRef]
  63. Radhika, K.; Sujatha, M.; Rao, T.N. Thidiazuron stimulates adventitious shoot regeneration in different safflower explants. Biol. Plant. 2006, 50, 174–179. [Google Scholar] [CrossRef]
  64. Schweiggert, R.M. Perspective on the ongoing replacement of artificial and animal-based dyes with alternative natural pigments in foods and beverages. J. Agric. Food Chem. 2018, 66, 3074–3081. [Google Scholar] [CrossRef]
  65. Nie, P.; Zhang, L.; Zhang, W.; Rong, W.; Zhi, J. The effects of hydroxysafflor yellow A on blood pressure and cardiac function. J. Ethnopharmacol. 2012, 139, 746–750. [Google Scholar] [CrossRef] [PubMed]
  66. Yue, S.; Tang, Y.; Li, S.; Duan, J. Chemical and biological properties of quinochalcone C-glycosides from the florets of Carthamus tinctorius. Molecules 2013, 18, 15220–15254. [Google Scholar] [CrossRef]
  67. Delshad, E.; Yousefi, M.; Sasannezhad, P.; Rakhshandeh, H.; Ayati, Z. Medical uses of Carthamus tinctorius L. (safflower): A comprehensive review from traditional medicine to modern medicine. Electron. Physician 2018, 10, 6672–6681. [Google Scholar] [CrossRef] [PubMed] [Green Version]
  68. Yao, D.; Wang, Z.; Miao, L.; Wang, L. Effects of extracts and isolated compounds from safflower on some index of promoting blood circulation and regulating menstruation. J. Ethnopharmacol. 2016, 191, 264–272. [Google Scholar] [CrossRef] [PubMed]
  69. Stagos, D.; Balabanos, D.; Savva, S.; Skaperda, Z.; Priftis, A.; Kerasioti, E.; Mikropoulou, E.V.; Vougogiannopoulou, K.; Mitakou, S.; Halabalaki, M.; et al. Extracts from the Mediterranean food plants Carthamus lanatus, Cichorium intybus, and Cichorium spinosum enhanced GSH levels and increased Nrf2 expression in human endothelial cells. Oxid. Med. Cell. Longev. 2018, 2018, 6594101. [Google Scholar] [CrossRef] [PubMed] [Green Version]
  70. Topashka-ancheva, M.N.; Taskova, R.M.; Handjieva, N. V Mitogenic effect of Carthamus lanatus extracts, fractions and constituents. Fitoterapia 2006, 77, 608–610. [Google Scholar] [CrossRef]
  71. Bocheva, A.; Mikhova, B.; Taskova, R.; Mitova, M.; Duddeck, H. Antiinflammatory and analgesic effects of Carthamus lanatus aerial parts. Fitoterapia 2003, 74, 559–563. [Google Scholar] [CrossRef]
  72. Jalil, S.; Mikhova, B.; Taskova, R.; Mitova, M.; Duddeck, H.; Choudhary, M.I.; Atta-ur, R. In vitro anti-inflammatory effect of Carthamus lanatus L. Z. Nat. C 2003, 58, 830–832. [Google Scholar]
  73. Taskova, R.; Mitova, M.; Najdenski, H.; Tzvetkova, I.; Duddeck, H. Antimicrobial activity and cytotoxicity of Carthamus lanatus. Fitoterapia 2002, 73, 540–543. [Google Scholar] [CrossRef]
  74. Ashri, A. Evaluation of the germplasm collection of safflower, Carthamus tinctirius L. V. distribution and regional divergence for morphological characters. Euphytica 1975, 24, 651–659. [Google Scholar] [CrossRef]
  75. Shinwari, Z.K.; Rehman, H.; Rabbani, M.A. Morphological traits based genetic diversity in safflower (Carthamus tinctorius L.). Pakistan J. Bot. 2014, 46, 1389–1395. [Google Scholar]
  76. Mukta, N.; Reddy, A.P.; Lavanya, C.; Dudhe, M.Y. Variability for DUS characteristics in released varieties of safflower (Carthamus tinctorius L.) in India. J. Oilseeds Res. 2012, 29, 133–135. [Google Scholar]
  77. Dwivedi, S.L.; Upadhyaya, H.D.; Hegde, D.M. Development of core collection using geographic information and morphological descriptors in safflower (Carthamus tinctorius L.) germplasm. Genet. Resour. Crop Evol. 2005, 52, 821–830. [Google Scholar] [CrossRef] [Green Version]
  78. Khan, M.A.; von Witzke-Ehbrecht, S.; Maass, B.L.; Becker, H.C. Relationships among different geographical groups, agro-morphology, fatty acid composition and RAPD marker diversity in Safflower (Carthamus tinctorius). Genet. Resour. Crop Evol. 2009, 56, 19–30. [Google Scholar] [CrossRef] [Green Version]
  79. Yang, W.; Qiao, X.; Bo, T.; Wang, Q.; Guo, D.; Ye, M. Low energy induced homolytic fragmentation of flavonol 3-O-glycosides by negative electrospray ionization tandem mass spectrometry. Rapid Commun. Mass Spectrom. 2013, 28, 385–395. [Google Scholar] [CrossRef]
  80. Yao, C.; Yang, W.; Si, W.; Shen, Y.; Zhang, N.; Chen, H.; Pan, H.; Yang, M.; Wu, W.; Guo, D. An enhanced targeted identification strategy for the selective identification of flavonoid O-glycosides from Carthamus tinctorius by integrating offline two-dimensional liquid chromatography / linear ion-trap-orbitrap mass spectrometry, high-resolution. J. Chromatogr. A 2017, 1491, 87–97. [Google Scholar] [CrossRef]
  81. De Villiers, A.; Venter, P.; Pasch, H. Recent advances and trends in the liquid-chromatography–mass spectrometry analysis of flavonoids. J. Chromatogr. A 2016, 1430, 16–78. [Google Scholar] [CrossRef]
  82. Mirzajani, F.; Zeinali, S.M.; Goodarzi, R. Identification of hydroxy-safflor yellow A, safflor yellow B, and precarthaminin safflower using LC/ESI—MSMS. J. Food Meas. Charact. 2015, 9, 332–336. [Google Scholar] [CrossRef]
  83. Salem, N.; Msaada, K.; Hamdaoui, G.; Limam, F.; Marzouk, B. Variation in phenolic composition and antioxidant activity during flower development of safflower (Carthamus tinctorius L.). J. Agric. Food Chem. 2011, 59, 4455–4463. [Google Scholar] [CrossRef]
  84. Steberl, K.; Hartung, J.; Graeff-Hönninger, S. Impact of cultivar, harvest date and threshing parameter settings on floret and carthamidin yield of safflower. Agronomy 2020, 10, 1272. [Google Scholar] [CrossRef]
  85. Chakradhari, S.; Perkons, I.; Mišina, I.; Sipeniece, E.; Radziejewska, E. Profiling of the bioactive components of safflower seeds and seed oil: Cultivated (Carthamus tinctorius L.) vs. wild (Carthamus oxyacantha M. Bieb.). Eur. Food Res. Technol. 2020, 246, 449–459. [Google Scholar] [CrossRef]
  86. Yeloojeh, K.A.; Saeidi, G.; Sabzalian, M.R. Drought stress improves the composition of secondary metabolites in safflower flower at the expense of reduction in seed yield and oil content. Ind. Crop. Prod. 2020, 154, 112496. [Google Scholar] [CrossRef]
  87. Anna, V.S.; Gurak, P.D.; Marczak, L.D.F.; Tessaro, I.C. Dyes and pigments tracking bioactive compounds with colour changes in foods—A review. Dye. Pigment. 2013, 98, 601–608. [Google Scholar] [CrossRef]
  88. Mojzer, E.B.; Hrncic, M.K.; Škerget, M.; Knez, Ž.; Bren, U. Polyphenols: Extraction methods, antioxidative action, bioavailability and anticarcinogenic effects. Molecules 2016, 21, 901. [Google Scholar] [CrossRef]
  89. Ajila, C.M.; Brar, S.K.; Verma, M.; Tyagi, R.D.; Godbout, S.; Valéro, J.R. Extraction and analysis of polyphenols: Recent trends. Crit. Rev. Biotechnol. 2011, 31, 227–249. [Google Scholar] [CrossRef] [PubMed]
  90. Chen, J.; Wang, J.; Wang, R.; Xian, B.; Ren, C.; Liu, Q.; Wu, Q. Integrated metabolomics and transcriptome analysis on flavonoid biosynthesis in safflower (Carthamus tinctorius L.) under MeJA treatment. BMC Plant Biol. 2020, 20, 353. [Google Scholar] [CrossRef]
  91. Bolstad, B.M.; Irizarry, R.A.; Astrand, M.; Speed, T.P. A comparison of normalization methods for high density oligonucleotide array data based on variance and bias. Bioinformatics 2003, 19, 185–193. [Google Scholar] [CrossRef] [PubMed] [Green Version]
  92. Saeed, A.; Sharov, V.; White, J.; Li, J.; Liang, W.; Bhagabati, N.; Braisted, J.; Klapa, M.; Currier, T.; Thiagarajan, M.; et al. TM4: A free, open-source system for microarray data management and analysis. Biotechniques 2003, 34, 374–377. [Google Scholar] [CrossRef] [Green Version]
Figure 1. Phenotypes of wild safflowers and cultivars. Safflower materials were obtained from the USDA (U.S. Department of Agriculture) National Plant Germplasm System via the Germplasm Resource Information Network. C. tinctorius and C. palaestinus florets were orange at the middle stage and became red/orange as development proceeded. Florets of W6 16791 and PI 426425 were yellow at the middle stage, and the pistils became orange as development proceeded. All other materials were white/cream at the middle stage.
Metabolites 10 00440 g001
Figure 2. Heat maps comparing the levels of phenylpropanoids, chalcones, and flavonoids in safflower wild species. Relative peak areas were normalized to construct a comparative heat map. The abscissa at top displays the names of the samples, and the ordinate at right displays the names of the metabolites. The deeper the red color, the higher the peak area of the metabolites; the deeper the blue color, the lower the peak area of the metabolites. Sample name abbreviations: the first two letters indicate the first two letters of the species name, the number indicates the last digit of the PI number, and the letters E, M, and L indicate early, middle, and late stages of development, respectively. For example, “ti1E” indicates the sample PI 592391 (C. tinctorius) at the early stage of development.
Metabolites 10 00440 g002
Figure 3. Loading (A) and score (B) plots of principal components 1 and 2 from the principal component analysis (PCA) and orthogonal partial least squares discriminant analysis (OPLS-DA) (C) and variable importance in projection (VIP) scores associated with metabolites (D) of wild and cultivated safflower species. Sample name abbreviations: the first two letters indicate the first two letters of the species name, the number indicates the last digit of the PI number, and the letters E, M, and L indicate early, middle, and late stages of cultivation, respectively. For example, “ti1E” indicates the sample PI 592391 (C. tinctorius) at the early stage of development.
Metabolites 10 00440 g003
Figure 4. Cumulative distribution of chalcones (A), isoflavonoids (B), flavones (C), and flavonols (D) in wild safflower florets at different developmental stages. Sample name abbreviations: the first two letters indicate the first two letters of the species name, the number indicates the last digit of the PI number, and the letters E, M, and L indicate early, middle, and late stages of development, respectively. For example, “ti1E” indicates the sample PI 592391 (C. tinctorius) at the early stage of development.
Metabolites 10 00440 g004
Figure 5. Simplified integrated metabolic pathways of phenylpropanoid, chalcone, isoflavonoid, flavanone, flavone, and flavonol biosynthesis in the florets of wild and cultivated safflower species.
Metabolites 10 00440 g005
Table 1. Pearson correlation coefficients among safflower wild species at different developmental stages based on metabolite levels.
Species C. tinctorius
PI 592391
C. lanatus
PI 202728
C. lanatus
PI 235666
C. lanatus
W6 16791
C. palaestinus
PI 235663
C. turkestanicus
PI 426180
C. turkestanicus
PI 426181
C. turkestanicus
PI 426425
EMLEMLEMLEMLEMLEMLEMLEM
C. tinctorius
PI 592391
M0.998**
L0.998 ** 0.996 **
C. lanatus
PI 202728
E−0.077 −0.083 −0.076 Key
M−0.088 −0.092 −0.086 0.976 ** −1−0.75−0.5−0.2500.250.50.751
L−0.081 −0.087 −0.079 0.940 ** 0.914 **
C. lanatus
PI 235666
E0.008 0.015 0.002 0.710 ** 0.742 ** 0.747 **
M0.092 0.116 0.086 0.665 ** 0.678 ** 0.647 ** 0.827 **
L0.007 0.016 0.007 0.773 ** 0.789 ** 0.806 ** 0.913 ** 0.908 **
C. lanatus
W6 16791
E0.891 ** 0.878 ** 0.891 ** 0.051 0.022 0.088 0.187 0.099 0.138
M0.949 ** 0.939 ** 0.954 ** 0.007 −0.001 0.042 0.119 0.108 0.110 0.959 **
L0.963 ** 0.952 ** 0.966 ** −0.018 −0.028 0.002 0.045 0.067 0.045 0.938 ** 0.989 **
C. palaestinus
PI 235663
E0.993 ** 0.988 ** 0.995 ** −0.063 −0.077 −0.067 −0.001 0.068 0.005 0.895 ** 0.957 ** 0.973 **
M0.992 ** 0.988 ** 0.996 ** −0.081 −0.090 −0.083 −0.014 0.058 −0.009 0.881 ** 0.946 ** 0.958 ** 0.996 **
L0.992 ** 0.990 ** 0.996 ** −0.060 −0.071 −0.063 0.008 0.087 0.017 0.888 ** 0.954 ** 0.963 ** 0.995 ** 0.997 **
C. turkestanicus
PI 426180
E−0.018 −0.014 −0.023 0.620 ** 0.647 ** 0.683 ** 0.917 ** 0.815 ** 0.893 ** 0.153 0.093 0.029 −0.022 −0.037 −0.021
M0.004 0.014 0.004 0.683 ** 0.706 ** 0.699 ** 0.796 ** 0.895 ** 0.933 ** 0.076 0.072 0.038 0.006 −0.011 0.008 0.879 **
L−0.007 −0.004 −0.005 0.735 ** 0.753 ** 0.749 ** 0.894 ** 0.840 ** 0.905 ** 0.117 0.109 0.041 0.000 −0.015 0.013 0.917 ** 0.848 **
C. turkestanicus
PI 426181
E−0.013 −0.011 −0.016 0.689 ** 0.709 ** 0.708 ** 0.920 ** 0.843 ** 0.914 ** 0.149 0.093 0.033 −0.012 −0.028 −0.011 0.935 ** 0.882 ** 0.907 **
M0.054 0.068 0.051 0.695 ** 0.709 ** 0.678 ** 0.825 ** 0.954 ** 0.922 ** 0.100 0.098 0.063 0.048 0.032 0.055 0.862 ** 0.949 ** 0.877 ** 0.922 **
L0.025 0.040 0.025 0.682 ** 0.687 ** 0.714 ** 0.854 ** 0.945 ** 0.955 ** 0.107 0.100 0.043 0.021 0.008 0.033 0.889 ** 0.946 ** 0.904 ** 0.915 ** 0.972 **
C. turkestanicus
PI 426425
E0.355 ** 0.363 ** 0.349 ** 0.550 ** 0.585 ** 0.574 ** 0.900 ** 0.830 ** 0.832 ** 0.444 ** 0.424 ** 0.374 ** 0.346 ** 0.328 * 0.348 * 0.865 ** 0.786 ** 0.829 ** 0.874 ** 0.839 ** 0.832 **
M0.522 ** 0.538 ** 0.517 ** 0.493 ** 0.490 ** 0.498 ** 0.702 ** 0.866 ** 0.775 ** 0.509 ** 0.538 ** 0.511 ** 0.511 ** 0.492 ** 0.517 * 0.712 ** 0.782 ** 0.720 ** 0.740 ** 0.852 ** 0.840 ** 0.891 **
L0.346 ** 0.357 ** 0.343 ** 0.565 ** 0.607 ** 0.564 ** 0.766 ** 0.860 ** 0.865 ** 0.362 ** 0.389 ** 0.356 ** 0.340 * 0.321 * 0.345 ** 0.790 ** 0.894 ** 0.780 ** 0.789 ** 0.873 ** 0.865 ** 0.875 ** 0.898 **
** Correlation significant at p < 0.01 (two-tailed). *Correlation significant at p < 0.05 (two-tailed). Sample name abbreviations: the first two letters indicate the first two letters of the species name, the number indicates the last digit of the PI number, and the letters E, M, and L indicate early, middle, and late stages of development, respectively. For example, “ti1E” indicates the sample PI 592391 (C. tinctorius) at the early stage of development.
Table 2. Details of safflower (Carthamus) wild and cultivated species samples used in this study.
Accession NumberSpeciesFlower Color at Middle Stage of DevelopmentSpine LengthTypeLeaf Shape Leaf Apices
PI 202728C. lanatusWhiteLongWildLanceolate Attenuate
PI 235666C. lanatusCreamLongWildLanceolateAttenuate
W6 16791C. lanatusYellowLongWildLanceolateAttenuate
PI 235663C. palaestinusOrangeVery shortWildLanceolateAcuminate
PI 426180C. turkestanicusCreamLongWildLanceolateAttenuate
PI 426181C. turkestanicusCreamLongWildLanceolateAttenuate
PI 426425C. turkestanicusLight-yellowLongWildLanceolateAttenuate
PI 592391C. tinctoriusOrangeVery shortCultivarLanceolateAcuminate
Publisher’s Note: MDPI stays neutral with regard to jurisdictional claims in published maps and institutional affiliations.

