Study of the Royal Jelly Free Fatty Acids by Liquid Chromatography-High Resolution Mass Spectrometry (LC-HRMS)


Abstract
1. Introduction
2. Results and Discussion
2.1. ESI-MS/MS Data
2.2. Sample Preparation
2.3. Method Validation
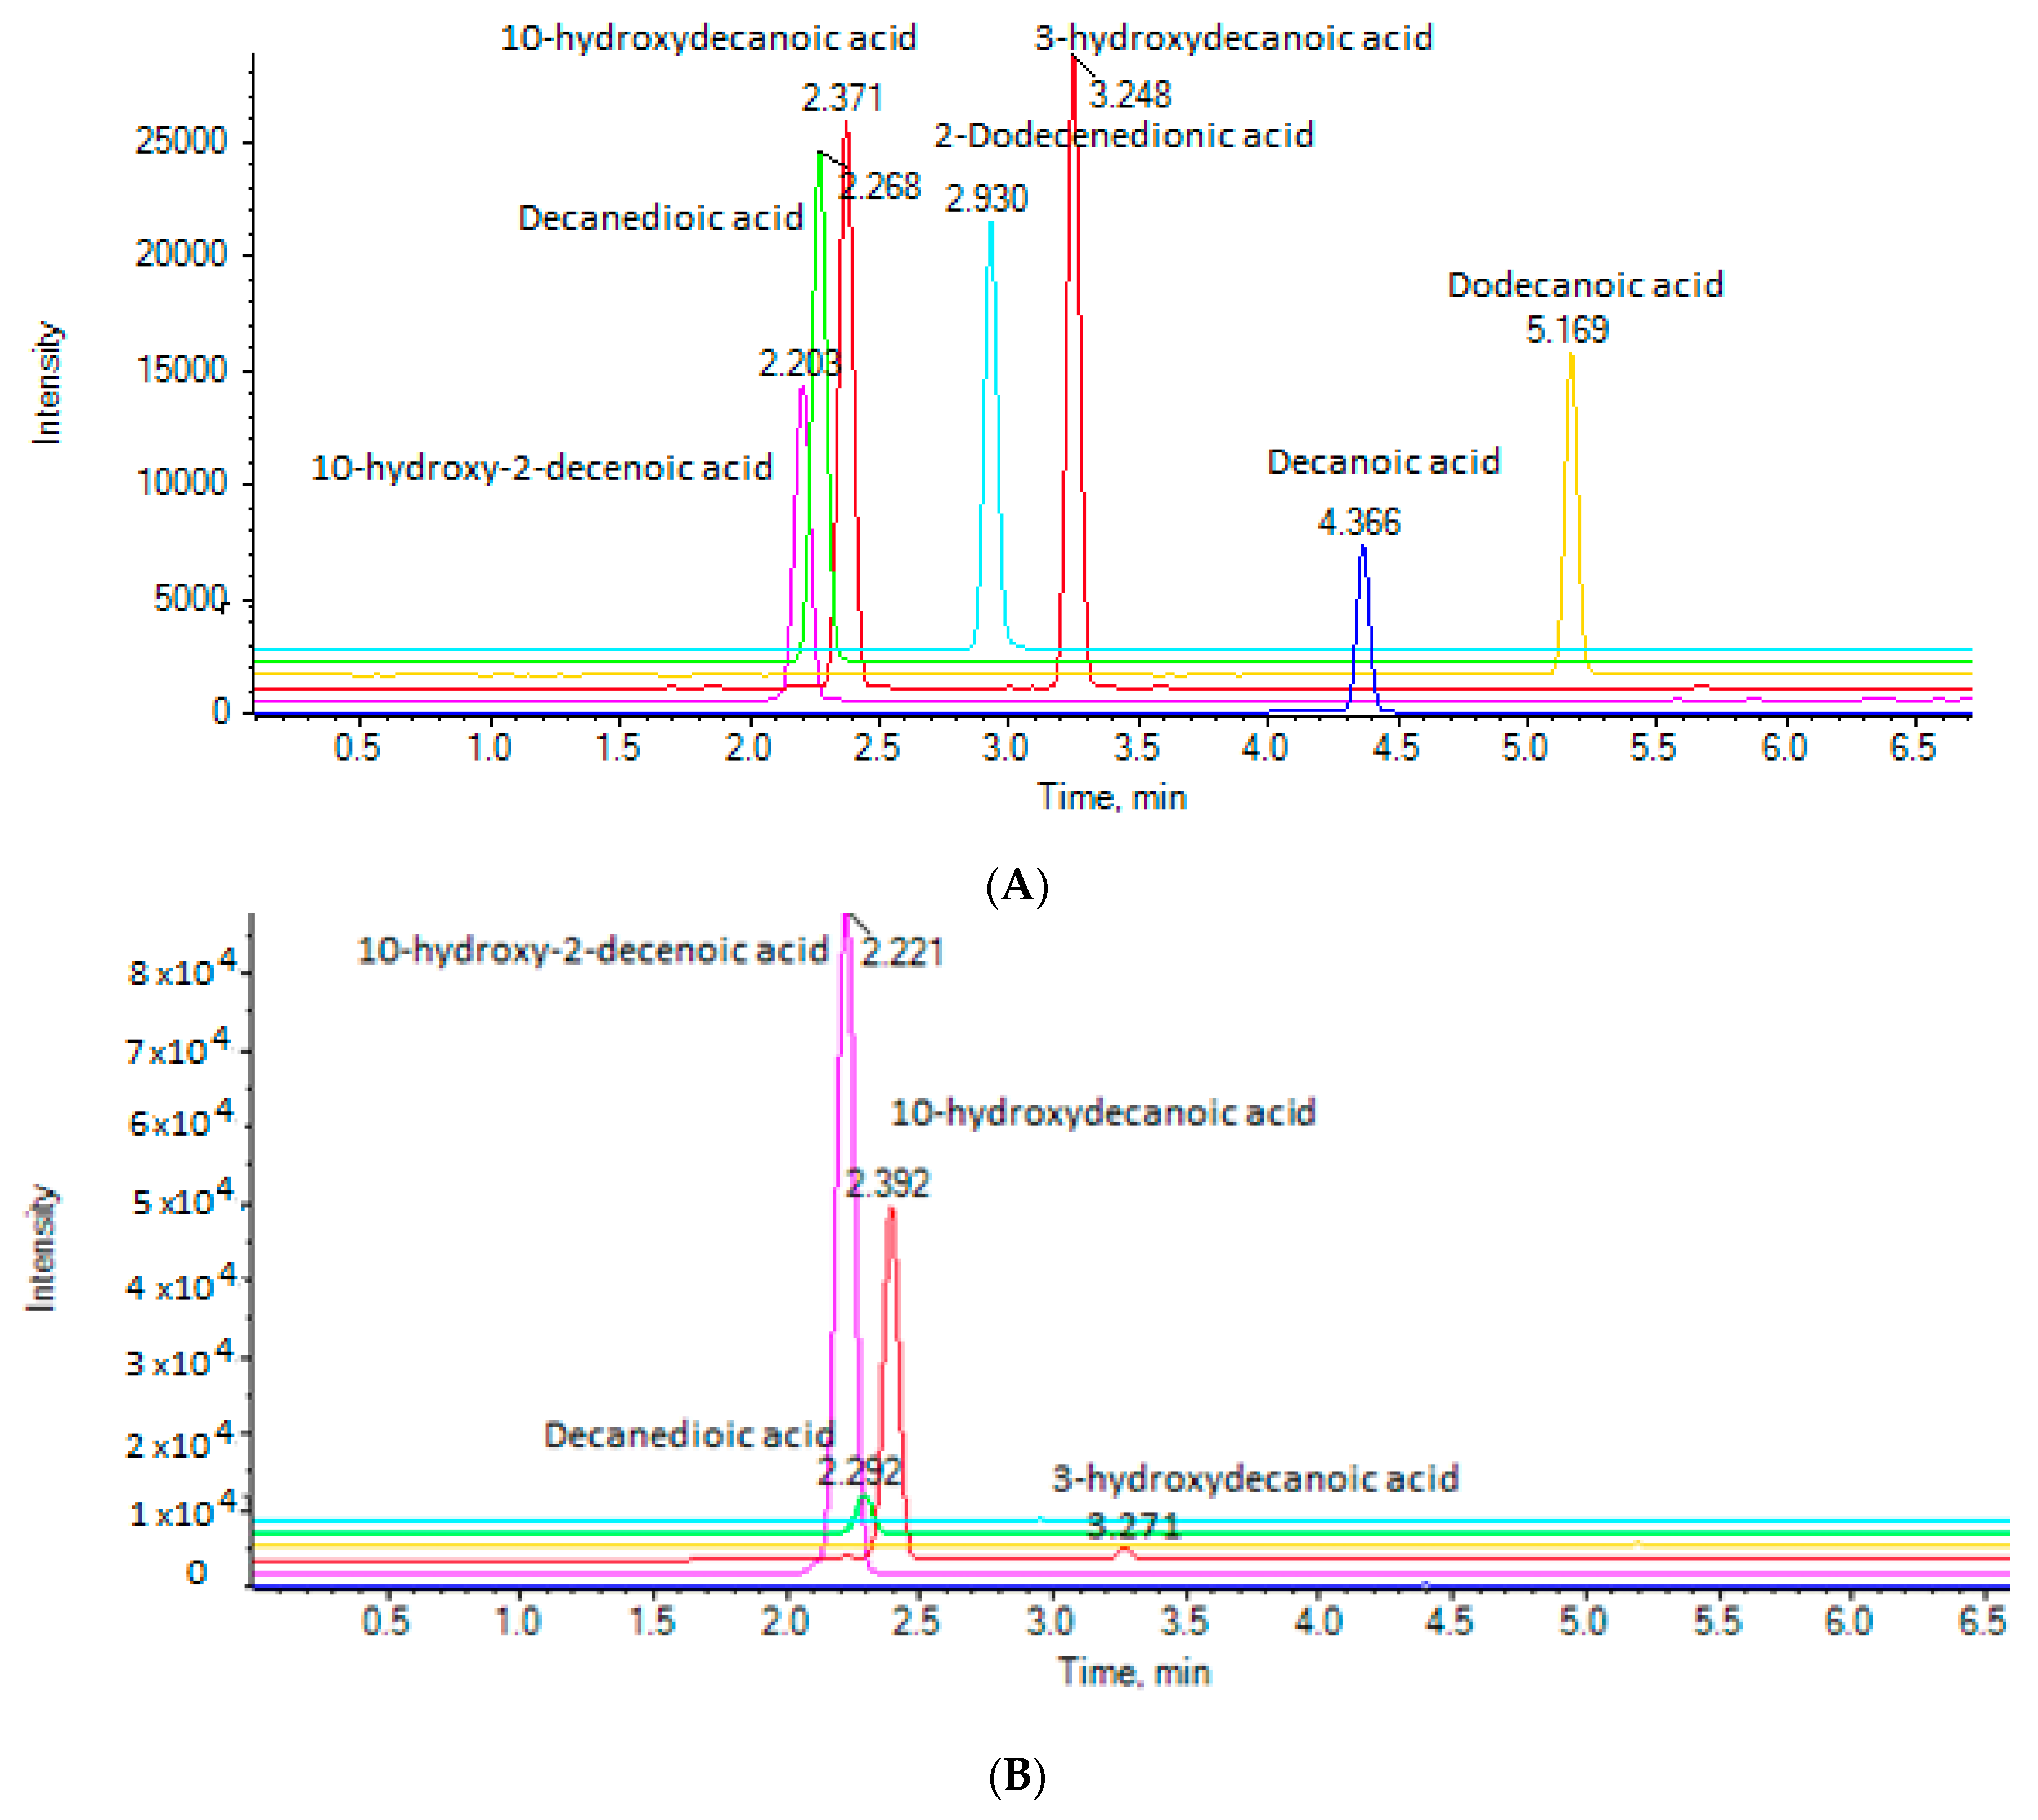
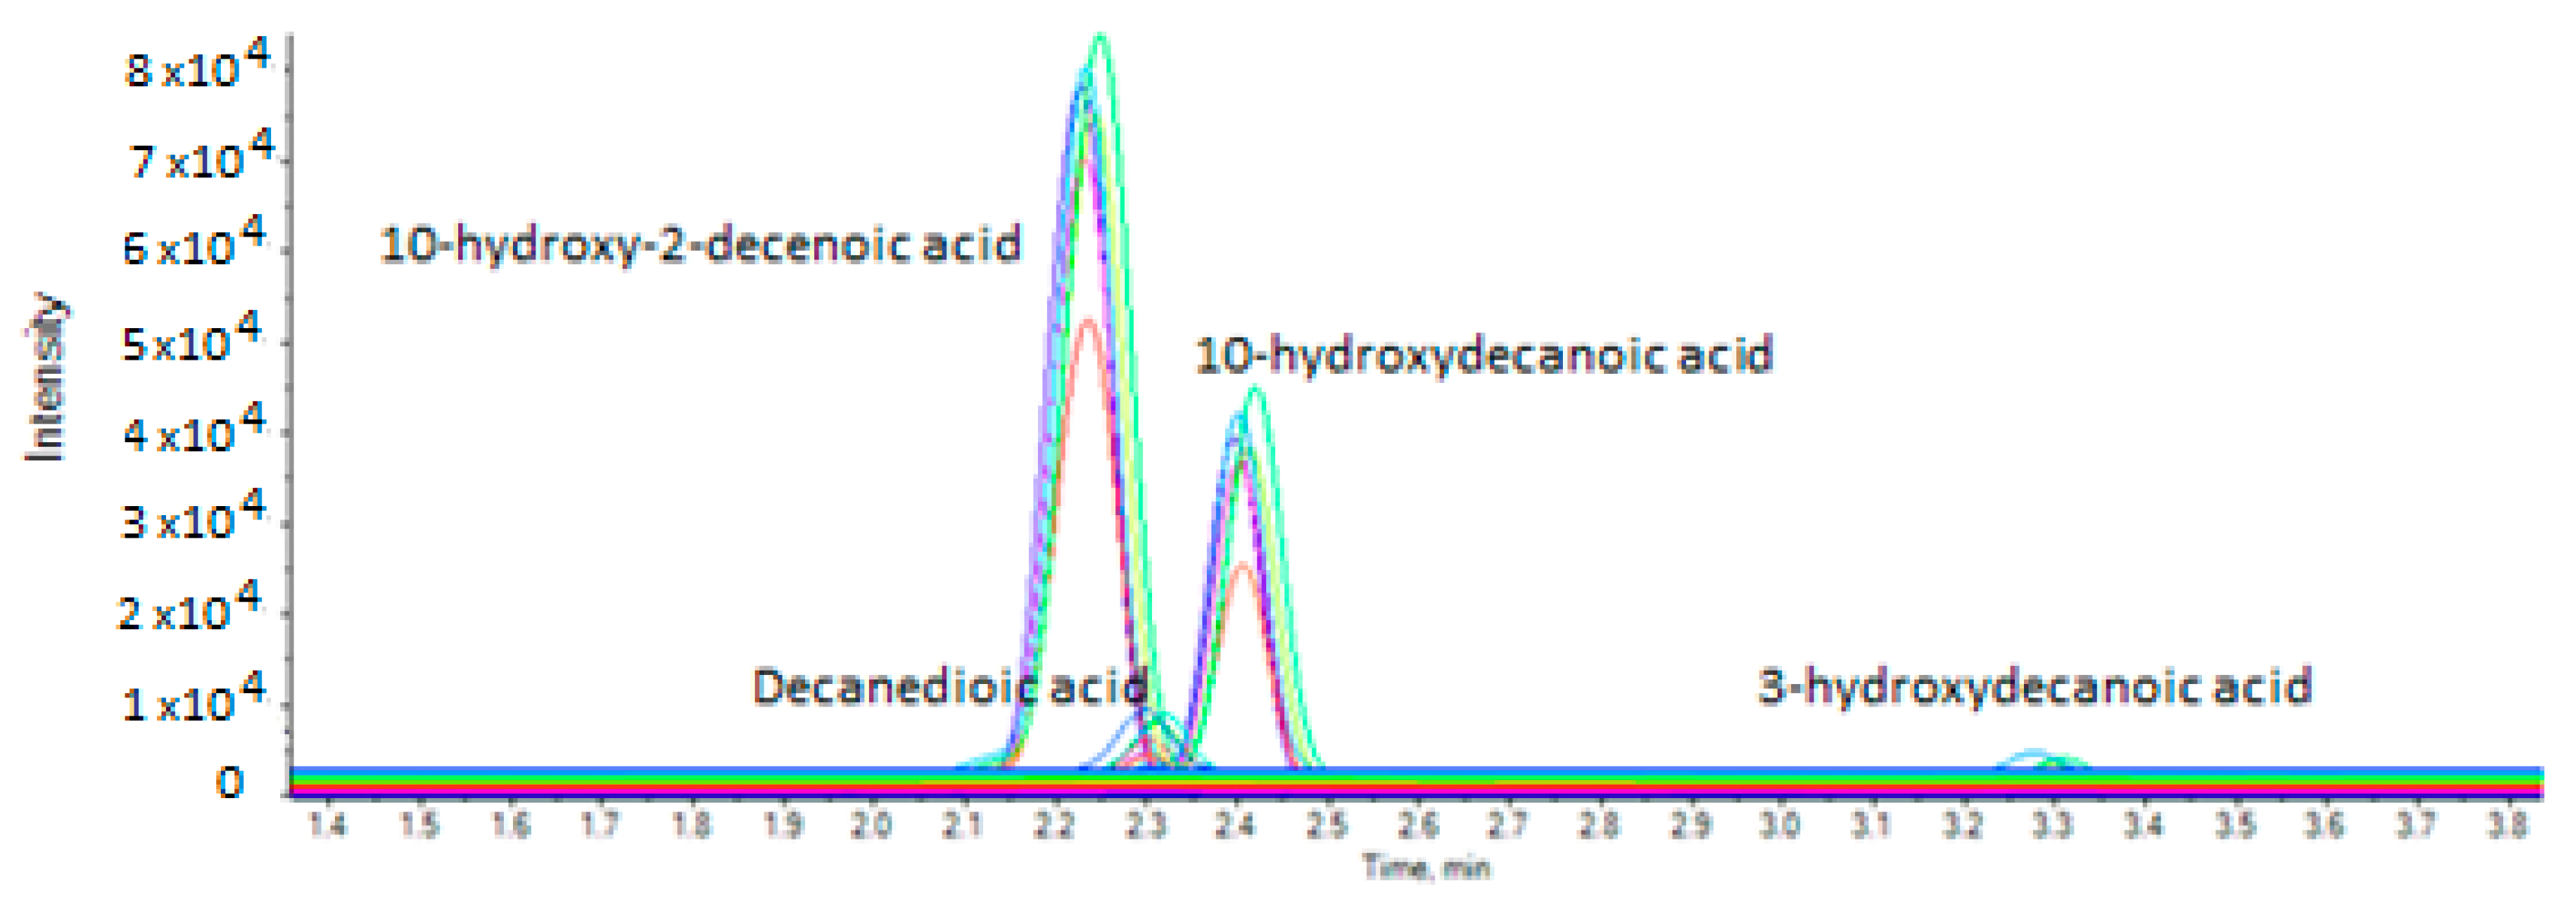
2.4. Analysis of RJ Samples
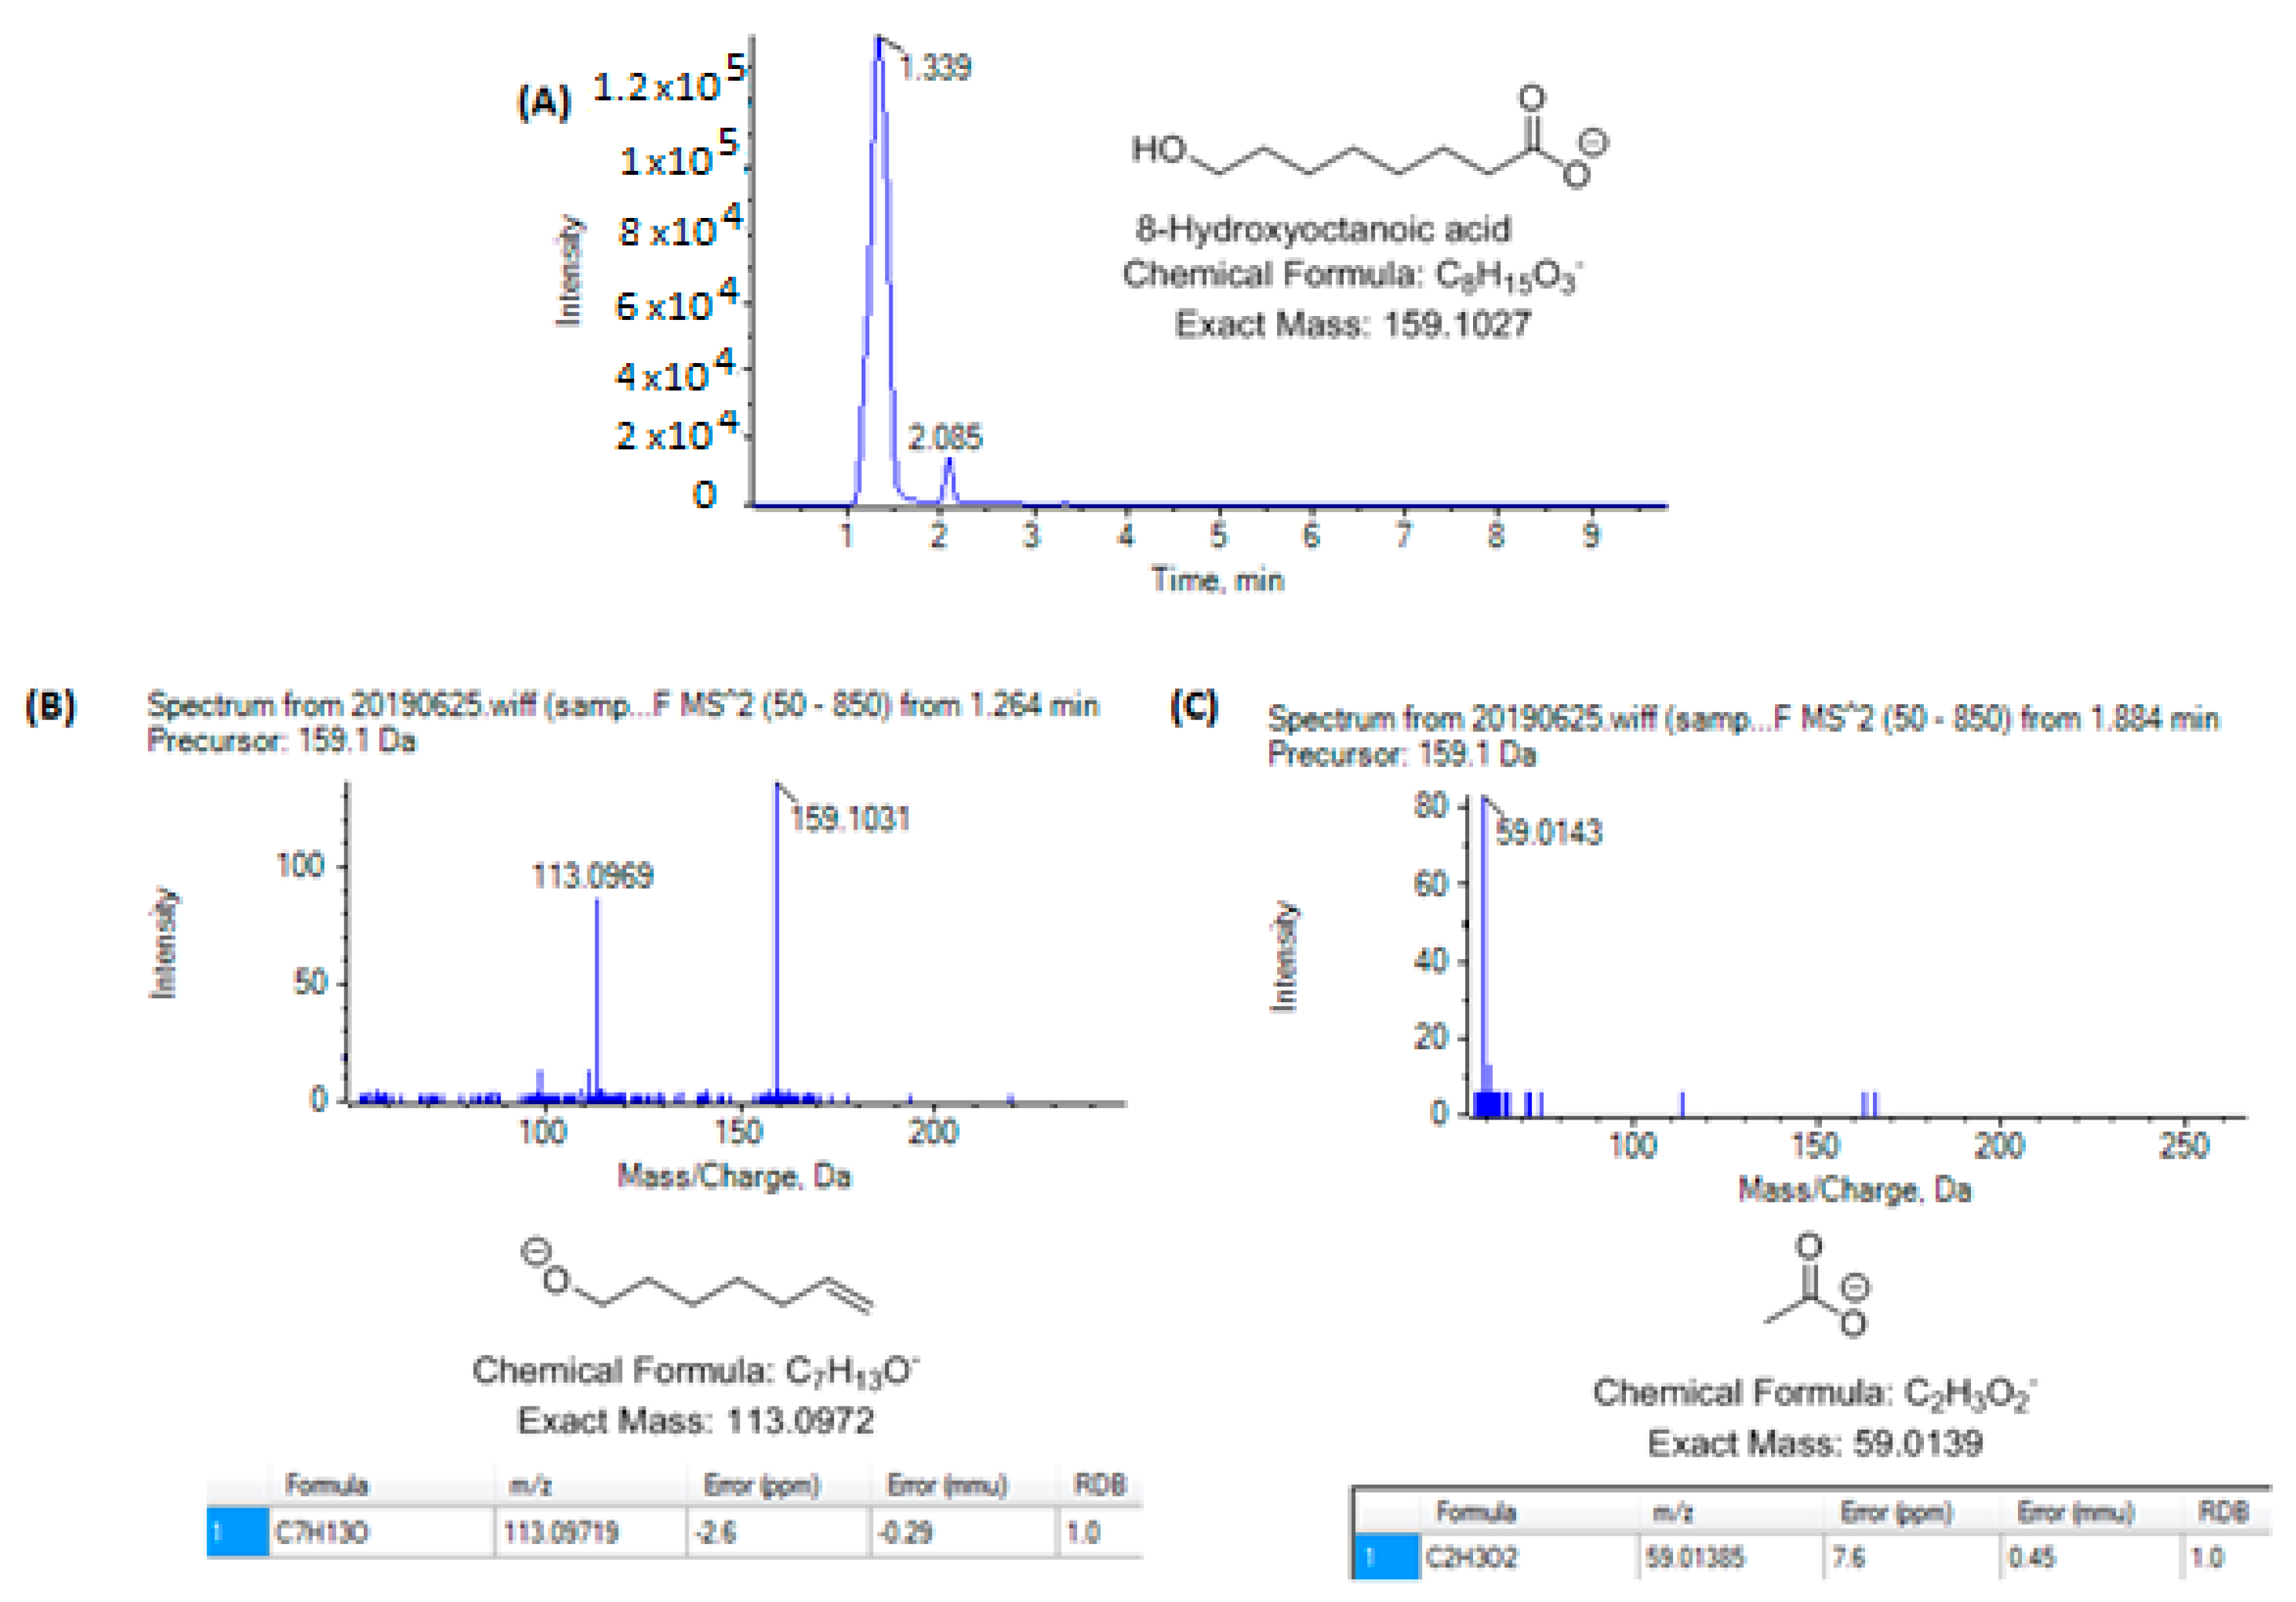
2.5. Suspect Analysis
2.6. Biological Significance
3. Materials and Methods
3.1. Chemicals and Reagents
3.2. Stock and Working Solutions
3.3. Instrumentation
3.4. Sample Preparation
3.5. Method Validation
3.6. Royal Jelly Samples
4. Conclusions
Supplementary Materials
Author Contributions
Funding
Conflicts of Interest
References
- Ramadana, M.F.; Al-Ghamdi, A. Bioactive compounds and health-promoting properties of royal jelly: A review. J. Funct. Foods 2012, 4, 39–52. [Google Scholar] [CrossRef]
- Fratini, F.; Cilia, G.; Mancini, S.; Felicioli, A. Royal Jelly: An ancient remedy with remarkable antibacterial properties. Microbiol. Res. 2016, 192, 130–141. [Google Scholar] [CrossRef] [PubMed]
- Cornara, L.; Biagi, M.; Xiao, J.; Burlando, B. Therapeutic properties of bioactive compounds from different honeybee products. Front. Pharmacol. 2017, 8, 412. [Google Scholar] [CrossRef] [PubMed]
- Khazaei, M.; Ansarian, A.; Ghanbari, E. New findings on biological actions and clinical applications of royal jelly: A Review. J. Diet. Suppl. 2018, 5, 757–775. [Google Scholar] [CrossRef]
- Melliou, E.; Chinou, I. Chemistry and bioactivity of royal jelly from Greece. J. Agric. Food Chem. 2005, 53, 8987–8992. [Google Scholar] [CrossRef]
- Terada, Y.; Narukawa, M.; Watanabe, T. Specific hydroxy fatty acids in royal jelly activate TRPA1. J. Agric. Food Chem. 2011, 59, 2627–2635. [Google Scholar] [CrossRef]
- Sugiyama, T.; Takahashi, K.; Tokoro, S.; Gotou, T.; Neri, P.; Mori, H. Inhibitory effect of 10-hydroxy-trans-2-decenoic acid on LPS-induced IL-6 production via reducing IκB-ζ expression. Innate Immun. 2011, 18, 429–437. [Google Scholar] [CrossRef]
- Mihajlovic, D.; Rajkovic, I.; Chinou, I.; Colic, M. Dose-dependent immunomodulatory effects of 10-hydroxy-2-decenoic acid on human monocyte-derived dendritic cells. J. Funct. Foods 2013, 5, 838–846. [Google Scholar] [CrossRef]
- Chen, Y.F.; Wang, K.; Zhang, Y.Z.; Zheng, Y.F.; Hu, F.L. In vitro anti-inflammatory effects of three fatty acids from royal jelly. Mediat. Inflamm. 2016, 2016, 3583684. [Google Scholar] [CrossRef]
- Yang, Y.C.; Chou, W.M.; Widowati, D.A.; Lin, I.P.; Peng, C.C. 10-Hydroxy-2-decenoic acid of royal jelly exhibits bactericide and anti-inflammatory activity in human colon cancer cells. BMC Complement. Altern. Med. 2018, 18, 202. [Google Scholar] [CrossRef]
- Weiser, M.J.; Grimshaw, V.; Wynalda, K.M.; Mohajeri, M.H.; Butt, C.M. Long-term administration of queen bee acid (QBA) to rodents reduces anxiety-like behavior, promotes neuronal health and improves body composition. Nutrients 2018, 10, 13. [Google Scholar] [CrossRef] [PubMed]
- Bloodworth, B.C.; Harn, C.S.; Hock, C.T. Liquid chromatographic determination of trans-10-hydroxy-2-decenoic acid content of commercial products containing royal jelly. JAOAC Int. 1995, 78, 1019–1023. [Google Scholar]
- Genc, M.; Aslan, A. Determination of trans-10-hydroxy-2-decenoic acid content in pure royal jelly and royal jelly products by column liquid chromatography. J. Chromatogr. A 1999, 839, 265–268. [Google Scholar] [CrossRef]
- Antinellia, J.-F.; Zeggane, S.; Davico, R.; Rognonea, C.; Faucon, J.-P.; Lizzani, L. Evaluation of (E)-10-hydroxydec-2-enoic acid as a freshness parameter for royal jelly. Food Chem. 2003, 80, 85–89. [Google Scholar] [CrossRef]
- Zhou, J.; Zhao, J.; Yuan, H.; Meng, Y.; Li, Y.; Wu, L.; Xue, X. Comparison of UPLC and HPLC for determination of trans-10-hydroxy-2-decenoic acid content in royal jelly by ultrasound-assisted extraction with internal standard. Chromatographia 2007, 66, 185–190. [Google Scholar] [CrossRef]
- Ferioli, F.; Marcazzan, G.L.; Caboni, M.F. Determination of (E)-10-hydroxy-2-decenoic acid content in pure royal jelly: A comparison between a new CZE method and HPLC. J. Sep. Sci. 2007, 30, 1061–1069. [Google Scholar] [CrossRef]
- Isidorov, V.A.; Czyzewska, U.; Isidorova, A.G.; Bakier, S. Gas chromatographic and mass spectrometric characterization of the organic acids extracted from some preparations containing lyophilized royal jelly. J. Chromatogr. B 2009, 877, 3776–3780. [Google Scholar] [CrossRef]
- Isidorov, V.A.; Bakier, S.; Grzech, I. Gas chromatographic–mass spectrometric investigation of volatile and extractable compounds of crude royal jelly. J. Chromatogr. B 2012, 885, 109–116. [Google Scholar] [CrossRef]
- Ferioli, F.; Armaforte, E.; Caboni, M.F. Comparison of the lipid content, fatty acid profile and sterol composition in local Italian and commercial royal jelly samples. J. Am. Oil Chem. Soc. 2014, 91, 875–884. [Google Scholar] [CrossRef]
- Yamaga, M.; Tani, H.; Yamaki, A.; Tatefuji, T.; Hashimoto, K. Metabolism and pharmacokinetics of medium chain fatty acids after oral administration of royal jelly to healthy subjects. RSC Adv. 2019, 9, 15392–15401. [Google Scholar] [CrossRef]
- Loss, M.; Geber, C.; Corona, F.; Hollender, J.; Singer, H. Accelerated isotope fine structure calculation using pruned transition trees. Anal. Chem. 2015, 87, 5738–5744. [Google Scholar] [CrossRef] [PubMed]
- Jia, W.; Shi, L.; Chu, X. Untargeted screening of sulfonamides and their metabolites in salmon using liquid chromatography coupled to quadrupole Orbitrap mass spectrometry. Food Chem. 2018, 239, 427–433. [Google Scholar] [CrossRef] [PubMed]
- Gauglitz, J.M.; Aceves, C.M.; Aksenov, A.A.; Aleti, G.; Almaliti, J.; Bouslimanim, A.; Brown, E.A.; Campeau, A.; Caraballo-Rodríguez, A.M.; Chaar, R.; et al. Untargeted mass spectrometry-based metabolomics approach unveils molecular changes in raw and processed foods and beverages. Food Chem. 2020, 302, 125290. [Google Scholar] [CrossRef] [PubMed]
- Horai, H.; Arita, M.; Kanaya, S.; Nihei, Y.; Ikeda, T.; Suwa, K.; Ojima, Y.; Tanaka, K.; Tanaka, S.; Aoshima, K.; et al. MassBank: A public repository for sharing mass spectral data for life sciences. J. Mass Spectrom. 2010, 45, 703–714. [Google Scholar] [CrossRef] [PubMed]
- Offermanns, S. Free fatty acid (FFA) and hydroxy carboxylic acid (HCA) receptors. Annu. Rev. Pharmacol. Toxicol. 2014, 54, 407–434. [Google Scholar] [CrossRef]
- Briscoe, C.P.; Tadayyon, M.; Andrews, J.L.; Benson, W.G.; Chambers, J.K.; Eilert, M.M.; Ellis, C.; Elshourbagy, N.A.; Goetz, A.S.; Minnick, D.T.; et al. The orphan G protein coupled receptor GPR40 is activated by medium and long chain fatty acids. J. Biol. Chem. 2003, 278, 11303–11311. [Google Scholar] [CrossRef]
- Itoh, Y.; Kawamata, Y.; Harada, M.; Kobayashi, M.; Fujii, R.; Fukusumi, S.; Ogi, K.; Hosoya, M.; Tanaka, Y.; Uejima, H.; et al. Free fatty acids regulate insulin secretion from pancreatic beta cells through GPR40. Nature 2003, 422, 173–176. [Google Scholar] [CrossRef]
- Wang, J.; Wu, X.; Simonavicius, N.; Tian, H.; Ling, L. Medium-chain fatty acids as ligands for orphan G protein-coupled receptor GPR84. J. Biol. Chem. 2006, 281, 34457–34464. [Google Scholar] [CrossRef]
- Suzuki, M.; Takaishi, S.; Nagasaki, M.; Onozawa, Y.; Iino, I.; Maeda, H.; Komai, T.; Oda, T. Medium-chain fatty acid-sensing receptor, GPR84, is a proinflammatory receptor. J. Biol. Chem. 2013, 288, 10684–10691. [Google Scholar] [CrossRef]
- Kanehisa, M.; Goto, S. KEGG: Kyoto Encyclopedia of Genes and Genomes. Nucleic Acids Res. 2000, 28, 27–30. [Google Scholar] [CrossRef]


| Compound | Structure | Theoretical Mass [M − H]− | Measured Mass [M − H]− | Elemental Composition | MS Rank a | RDB b |
|---|---|---|---|---|---|---|
| 10-HDA |  | 185.1183 | 185.1181 MS/MS 139.1122 | C10H17O3− C9H15O− | 1/1 1/1 | 2 2 |
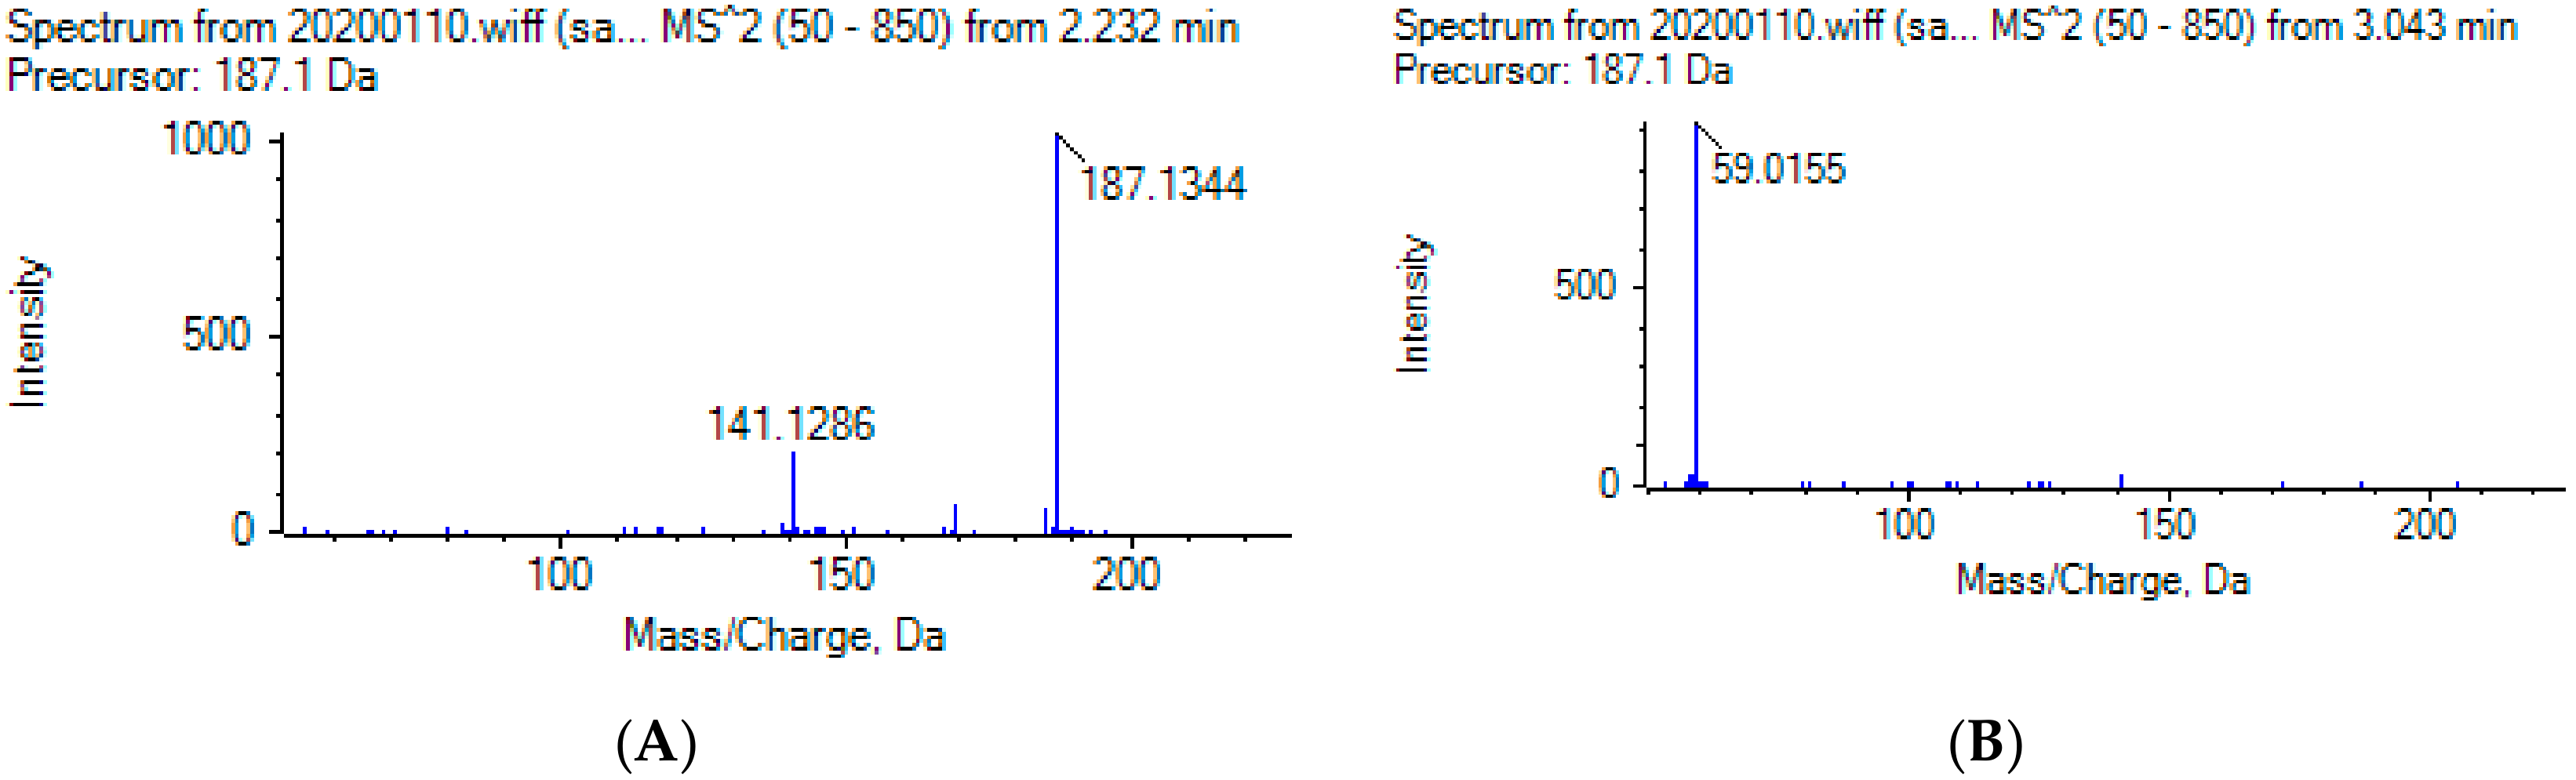
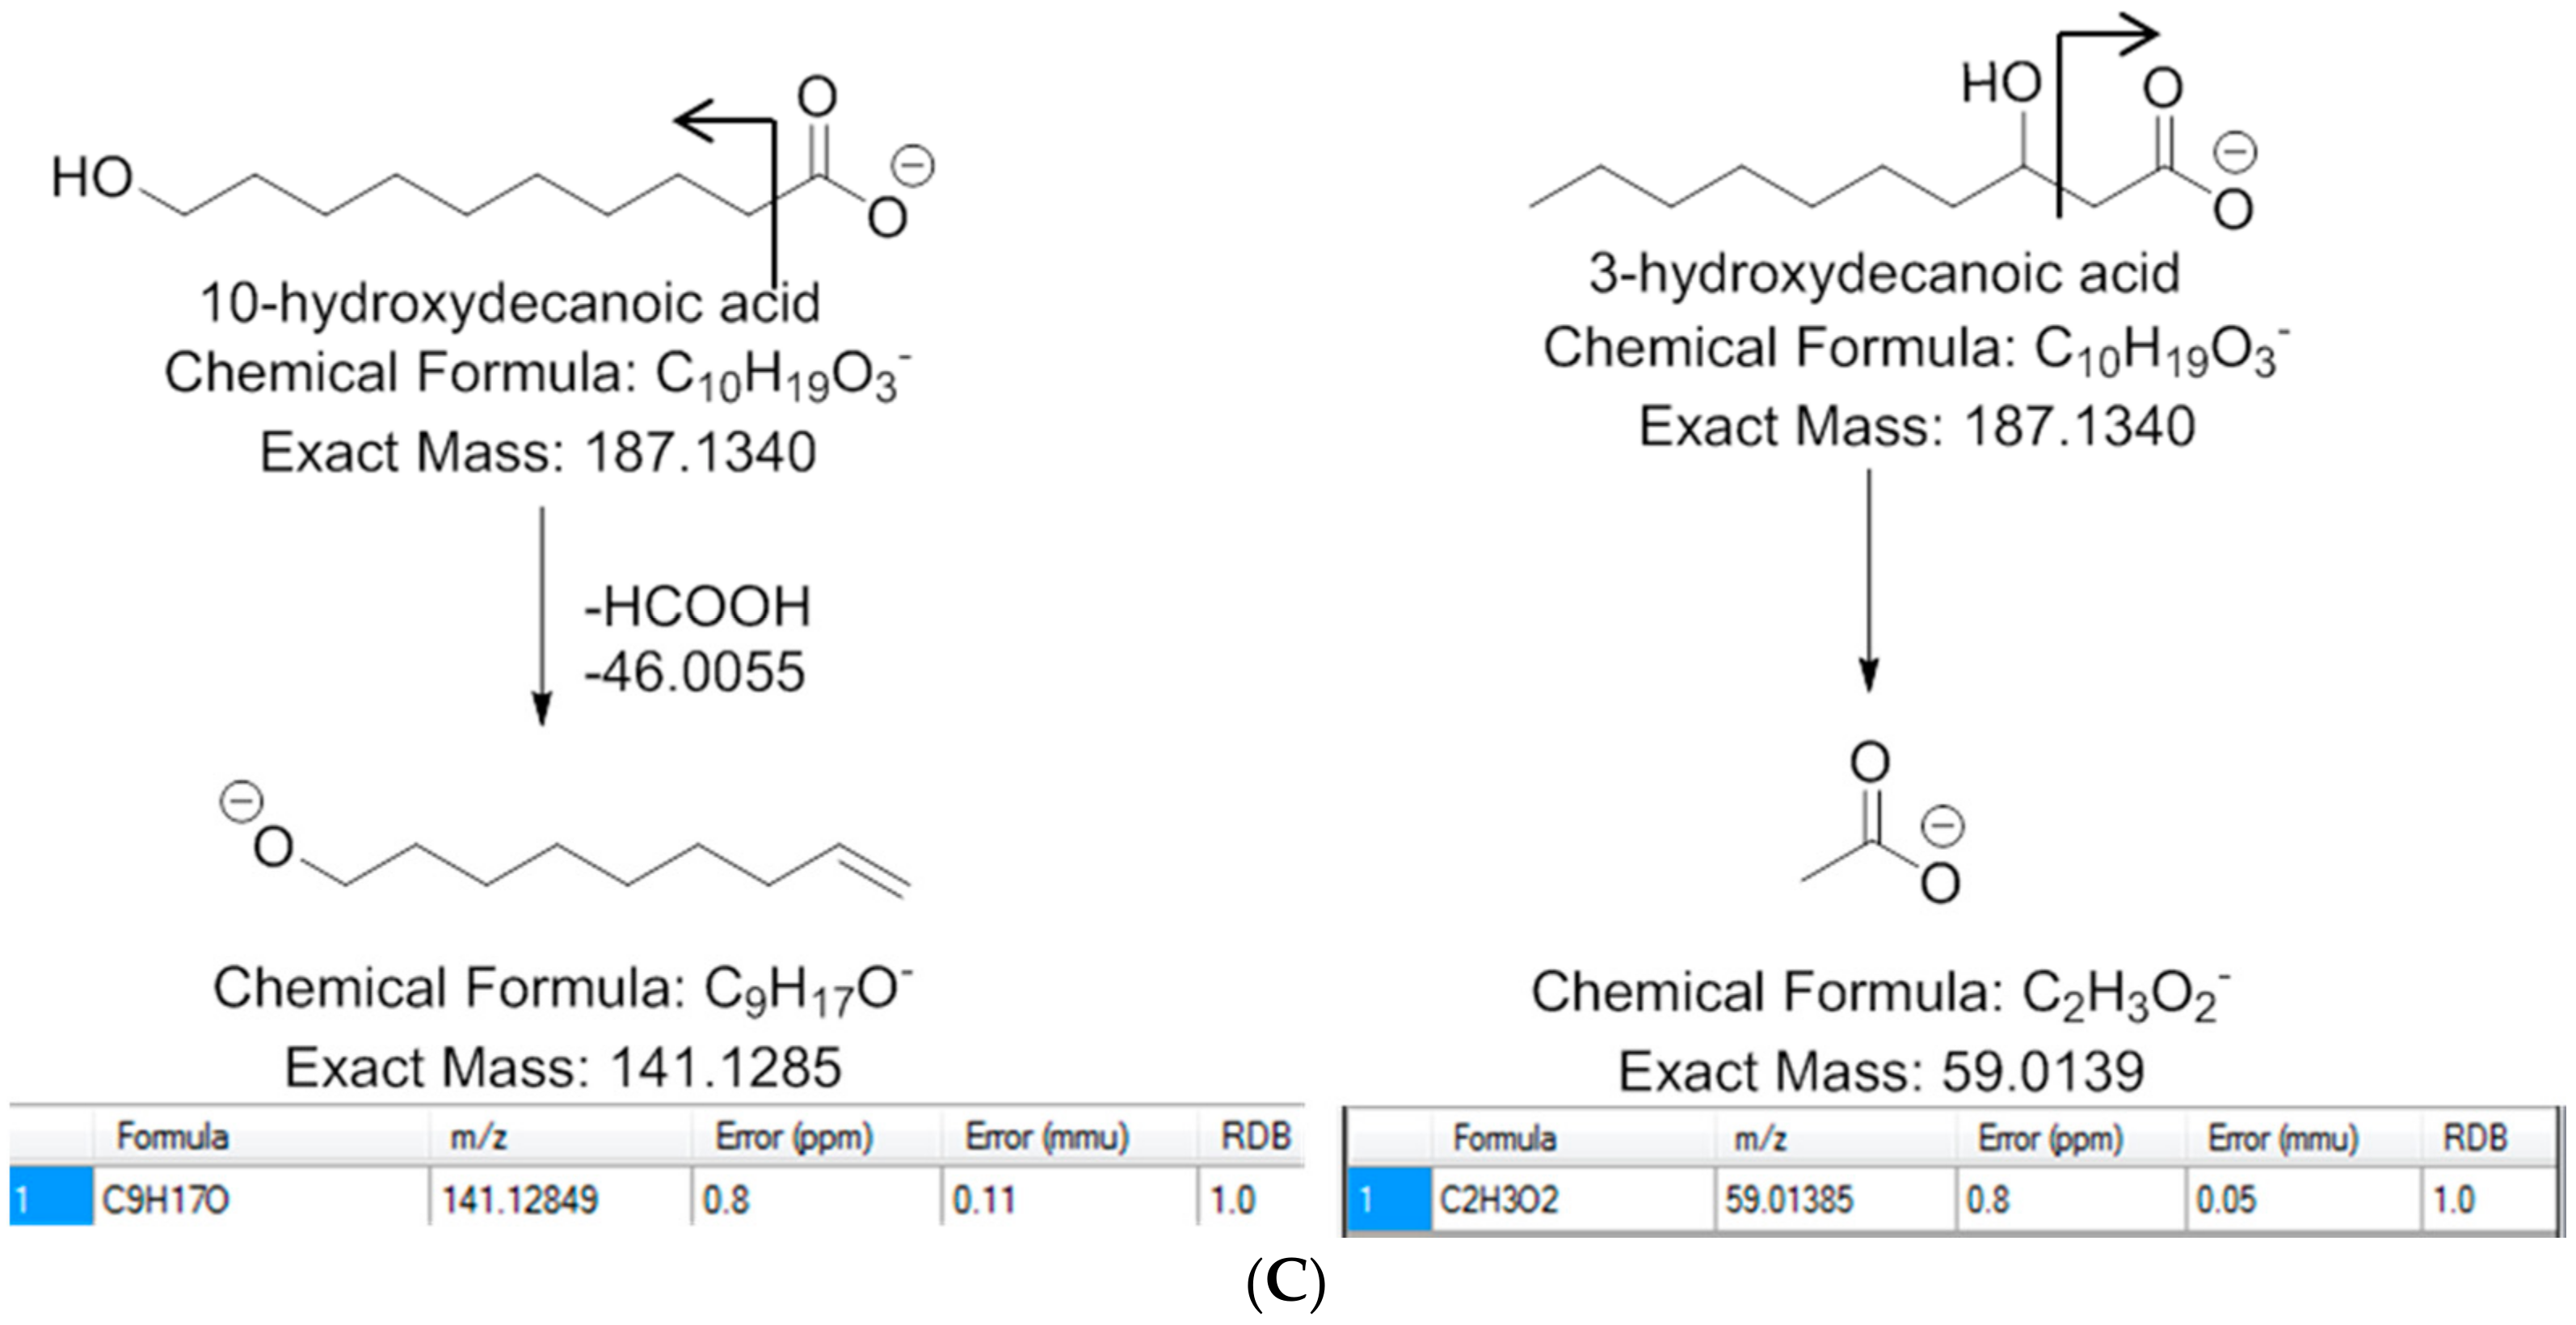
| 10-Hydroxydecanoic acid |  | 187.1340 | 187.1335 MS/MS 141.1286 | C10H19O3− C9H17O− | 1/1 1/1 | 1 1 |
| 3-Hydroxydecanoic acid |  | 187.1340 | 187.1341 MS/MS 59.0155 | C10H19O3− C2H3O2− | 1/1 1/1 | 1 1 |
| Decanedioic acid |  | 201.1132 | 201.1125 MS/MS 139.1133 183.1030 | C10H17O4− C9H15O− C10H15O3− | 1/1 1/1 1/1 | 2 2 3 |
| 2-Dodecenedioic acid |  | 227.1289 | 227.1284 MS/MS 183.1398 | C12H19O4− C11H19O2− | 1/1 1/1 | 3 2 |
| Decanoic acid |  | 171.1391 | 171.1388 MS/MS - | C10H19O2− - | 1/1 - | 1 - |
| Dodecanoic acid |  | 199.1704 | 199.1703 MS/MS - | C12H23O2− - | 1/1 - | 1 - |
| Analyte | Range (ng/mL) | Calibration Equations | Linearity (R2) | LOD (ng/mL) | LOQ (ng/mL) |
|---|---|---|---|---|---|
| 10-HDA | 10–2000 | y = 70x − 4360 | 0.993 | 207 | 628 |
| 10-Hydroxydecanoic Acid | 10–2000 | y = 90x − 4199 | 0.990 | 282 | 855 |
| 3-Hydroxydecanoic Acid | 10–2000 | y = 96x − 5325 | 0.995 | 197 | 596 |
| Decanedioic Acid | 10–2000 | y = 74x − 7432 | 0.992 | 200 | 608 |
| 2-Dodecenedioic Acid | 10–2000 | y = 67x − 7466 | 0.992 | 266 | 805 |
| Decanoic Acid | 5–500 | y = 22x − 637 | 0.992 | 24 | 80 |
| Dodecanoic Acid | 5–500 | y = 33x − 643 | 0.991 | 18 | 60 |
| Analyte | 1 | 2 | 3 | 4 | 5 | 6 | 7 | Median |
|---|---|---|---|---|---|---|---|---|
| 10-HDA | 0.892 ± 0.02 | 0.903 ± 0.08 | 0.876 ± 0.03 | 0.771 ± 0.08 | 0.875 ± 0.03 | 0.928 ± 0.04 | 0.914 ± 0.04 | 0.880 ± 0.05 |
| 10-Hydroxy decanoic Acid | 0.302 ± 0.03 | 0.366 ± 0.02 | 0.303 ± 0.02 | 0.325 ± 0.05 | 0.285 ± 0.03 | 0.342 ± 0.05 | 0.315 ± 0.01 | 0.320 ± 0.03 |
| 3-Hydroxy decanoic Acid | 0.030 ± 0.001 | 0.032 ± 0.001 | 0.028 ± 0.003 | 0.032 ± 0.001 | 0.036 ± 0.001 | 0.036 ± 0.001 | 0.035 ± 0.001 | 0.032 ± 0.00 |
| Decanedioic Acid | 0.089 ± 0.006 | 0.082 ± 0.002 | 0.080 ± 0.005 | 0.075 ± 0.002 | 0.082 ± 0.006 | 0.091 ± 0.005 | 0.122 ± 0.008 | 0.089 ± 0.04 |
| 2-Dodecenedioic Acid | 0.012 ± 0.000 | 0.012 ± 0.000 | 0.012 ± 0.000 | 0.012 ± 0.000 | 0.012 ± 0.000 | 0.012 ± 0.000 | 0.012 ± 0.000 | 0.012 ± 0.00 |
| Decanoic Acid | 0.002 ± 0.000 | 0.003 ± 0.000 | 0.003 ± 0.000 | 0.003 ± 0.000 | 0.003 ± 0.000 | 0.003 ± 0.000 | 0.003 ± 0.000 | 0.003 ± 0.00 |
| Dodecanoic Acid | 0.003 ± 0.000 | 0.003 ± 0.000 | 0.003 ± 0.000 | 0.003 ± 0.000 | 0.002 ± 0.000 | 0.003 ± 0.000 | 0.003 ± 0.000 | 0.003 ± 0.00 |
| Compound | Structure | Theoretical Mass [M − H]− | Measured Mass [M − H]− | Elemental Composition | MS Rank a | RDB b | Content Relative to 10-HDA (%) c |
|---|---|---|---|---|---|---|---|
| 3,10-Dihydroxydecanoic acid |  | 203.1289 | 203.1286 MS/MS 59.0136 | C10H19O4− C2H3O2− | 1/1 1/1 | 1 1 | 15 ± 0.04 |
| 8-Hydroxyoctanoic acid |  | 159.1027 | 159.1024 MS/MS 113.0969 | C8H15O3− C7H13O− | 1/1 1/1 | 2 1 | 9 ± 0.02 |
| 3-Hydroxyoctanoic acid |  | 159.1027 | 159.1024 MS/MS 59.0143 | C8H15O3− C2H3O2− | 1/1 1/1 | 2 1 | 0.2 ± 0.00 |
| 2-Decenedioic acid |  | 199.0976 | 199.0979 MS/MS 155.1073 | C10H15O4− C9H15O2− | 1/1 1/1 | 3 2 | 5 ± 0.01 |
© 2020 by the authors. Licensee MDPI, Basel, Switzerland. This article is an open access article distributed under the terms and conditions of the Creative Commons Attribution (CC BY) license (http://creativecommons.org/licenses/by/4.0/).
Share and Cite
Kokotou, M.G.; Mantzourani, C.; Babaiti, R.; Kokotos, G. Study of the Royal Jelly Free Fatty Acids by Liquid Chromatography-High Resolution Mass Spectrometry (LC-HRMS). Metabolites 2020, 10, 40. https://doi.org/10.3390/metabo10010040
Kokotou MG, Mantzourani C, Babaiti R, Kokotos G. Study of the Royal Jelly Free Fatty Acids by Liquid Chromatography-High Resolution Mass Spectrometry (LC-HRMS). Metabolites. 2020; 10(1):40. https://doi.org/10.3390/metabo10010040
Chicago/Turabian StyleKokotou, Maroula G., Christiana Mantzourani, Rodalia Babaiti, and George Kokotos. 2020. "Study of the Royal Jelly Free Fatty Acids by Liquid Chromatography-High Resolution Mass Spectrometry (LC-HRMS)" Metabolites 10, no. 1: 40. https://doi.org/10.3390/metabo10010040
APA StyleKokotou, M. G., Mantzourani, C., Babaiti, R., & Kokotos, G. (2020). Study of the Royal Jelly Free Fatty Acids by Liquid Chromatography-High Resolution Mass Spectrometry (LC-HRMS). Metabolites, 10(1), 40. https://doi.org/10.3390/metabo10010040