Article

Open Innovations for Tourism Logistics Design: A Case Study of a Smart Bus Route Design for the Medical Tourist in the City of Greater Mekong Subregion

by
Sumalee Ngeoywijit
1,
Tawamin Kruasom
1,
KiengKwan Ugsornwongand
2,
Rapeepan Pitakaso
3,
Worapot Sirirak
4,
Natthapong Nanthasamroeng
5,
Thachada Kotmongkol
6,*,
Thanatkij Srichok
3,
Surajet Khonjun
3 and
Chutchai Kaewta
7
1
Department of International Business Management, Faculty of Management Science, Ubon Ratchathani University, 85 Sathonlamark, Muang SriKai, Warin Chamrap, Ubon Ratchathani 34190, Thailand
2
Department of Financial and Investment, Faculty of Management Science, Ubon Ratchathani University, 85 Sathonlamark, Muang SriKai, Warin Chamrap, Ubon Ratchathani 34190, Thailand
3
Artificial Intelligence Optimization SMART Laboratory, Department of Industrial Engineering, Faculty of Engineering, Ubon Ratchathani University, 85 Sathonlamark, Muang SriKai, Warin Chamrap, Ubon Ratchathani 34190, Thailand
4
Department of Industrial Engineering, Faculty of Engineering, Rajamangala University of Technology Lanna, Chiang Rai 50300, Thailand
5
Artificial Intelligence Optimization SMART Laboratory, Department of Engineering Technology, Faculty of Industrial Technology, Ubon Ratchathani Rajabhat University, 2 Ratchathani, Nai Muang, Ubon Ratchathani 34000, Thailand
6
Department of Logistics Management, Faculty of Industrial Technology, Ubon Ratchathani Rajabhat University, 2 Ratchathani, Nai Muang, Ubon Ratchathani 34000, Thailand
7
Artificial Intelligence Optimization SMART Laboratory, Department of Computer Science, Faculty of Computer Science, Ubon Ratchathani Rajabhat University, 2 Ratchathani, Nai Muang, Ubon Ratchathani 34000, Thailand
*
Author to whom correspondence should be addressed.
J. Open Innov. Technol. Mark. Complex. 2022, 8(4), 173; https://doi.org/10.3390/joitmc8040173
Submission received: 28 August 2022 / Revised: 18 September 2022 / Accepted: 21 September 2022 / Published: 24 September 2022

Abstract

:
One of the industries with the fastest growth rates worldwide, and notably in Thailand, is medical tourism. With connections to Cambodia and Laos, Ubon Ratchathani is located in lower northeastern Thailand, close to Vietnam and Myanmar. Therefore, there is a significant chance that this region will welcome medical travelers. High-quality medical facilities are available in Ubon Ratchathani to fulfill the needs of medical tourists. A visitor’s decision to travel to Ubon Ratchathani for medical treatment is influenced by factors other than the high-level medical facilities, such as lodging, accessibility to public transportation, and tourist attractions. The public transportation services in Ubon Ratchathani, especially the public bus system, are poorly designed and may let down visitors. The purpose of this study is to develop a smart public bus route design that will meet tourists’ demands. The concept of open innovation will be utilized to develop the model. We surveyed 400 visitors to Ubon Ratchathani. The tourists’ opinions and views of public transportation will be made public and used as an input parameter when designing bus routes. The bus route can then be constructed using the differential evolution algorithm (DE). A web-based smart public transportation system was built. In order to construct an efficient smart public bus system (SPBS), open innovation was used in the development phase. According to the computational results, the new routes using DE lead to a 5.97% reduction in travel distance when compared to the output of the more well-known genetic method. More than 98.5% of visitors are satisfied with the new routes, and once they start running, 99.5% of all respondents plan to use public transit.

1. Introduction

Ubon Ratchathani is a province located on the northeastern border of Thailand. Bordering Laos and Cambodia, its length is 428 km. Ubon Ratchathani has a reputation for excellent and low-cost medical treatment [1]. As a result, it is accepted by foreigners living in Thailand and neighboring countries. According to Future Market Insight (FMI) [2], Thailand’s tourism market, which was estimated to be worth USD 57 billion as of 2022, is anticipated to expand around 3% yearly, and reach USD 76.60 billion in 2032. The abundance of tourists and the desire for Thai tourism are anticipated to expand due to the country’s rich history, nature, and cuisine, among other things. More than 7,727,693 people crossed the border in the greater Mekong subregion in 2021, according to the Foreign Affairs Division of the Office of the Permanent Secretary of the Interior [3], and more than 83.79% of those crossing the border were tourists, including both medical and general tourists.
One of the fastest-growing international business in the tourist sector of developing nations is health tourism, which is a relatively new form of travel. The act of traveling abroad to receive medical care is referred to as “medical tourism” [4]. Medical tourism, a growing industry associated with potential tourist motivation, represents a global phenomenon in the field of health care. Due to its low cost of living and the availability of medical treatments that comply with international standards, Thailand holds the largest market share in its region for health tourism, accounting for over 38% of Asian countries. The policy to establish Thailand as Asia’s medical hub is another way in which the government is supporting this. The Thai medical tourism industry also benefits from affordable costs and standards that are acknowledged globally. In addition to making many foreigners interested in receiving medical care in Thailand and encouraging future use, this policy also involves short treatment wait times. This demonstrates that Thailand’s healthcare sector has the capacity to successfully compete with other Asian countries that offer medical tourism, such as Singapore, Malaysia, and India.
In Thailand, foreigners extensively use a range of medical services, from routine procedures, such as minor surgery, cosmetic procedures, and dental work, to more involved procedures for life-threatening maladies, such as neurological disorders, heart conditions, and musculoskeletal and joint problems [5,6]. In Ubon Ratchathani, Thailand, there are more than 511 medical service facilities. Muang District has more than 107 medical sites. All of the highest-quality medical services are available here. The following are the top hospitals for tourists seeking medical care: Ubonrak Thonburi Hospital, Sunpasitinter Hospital, Ekachon Romklao Hospital, Prince Hospital Ubon Ratchathani, Sunpasitthiprasong Hospital, Warin Chamrap Hospital, Rajavej Hospital Ubon Ratchathani, and Fort Sunpasitthiprasong Hospital. Ref. [7] stated that the following criteria will be used to determine which hospital Laotian medical tourists choose: (1) service quality and price, (2) place and access, (3) facilities, (4) tourism resources/attractions, (5) marketing promotion, and (6) responsiveness to individual needs. As a result, in addition to considering the service, setting, value, and cost when choosing medical facilities, travelers should also consider the hospital’s location, ease of access, and tourist resources and attractions. Although the local government sector must support the target market, develop marketing partnerships with other companies, support medical tourism, maintain a database of specialists, and improve the foreign language proficiency of medical staff in order to improve the quality of service, they must also take care of transportation, hotel infrastructure, and the connection of tourists’ transportation to the major attractions, including the medical centers [8]. Because medical tourists want more than only high-quality medical care, the competitiveness of the destinations is growing. Tourists must consider attractions in a city as well as its transit options when making a final decision.
Ref. [9] states that public transportation and tourism are co-dependent, and this idea is supported by [10,11]. Therefore, excellent public transport can support medical tourism activities directly. To travel to Ubon Ratchathani, there are a number of options: (1) take an international bus from Pakse, Champasak, Lao PDR to the bus terminal in Ubon Ratchathani, and then transfer to a local bus to reach the lodging or medical facility; (2) take a bus from Siem Reap, Cambodia, which then arrives at the Chong Sangam border crossing point, links with a Thai bus at the bus terminal in Ubon Ratchathani, and connects with a local bus to the lodging or hospital; (3) take a domestic flight to Ubon Ratchathani airport, connecting with a bus to the lodging or hospital, and then fly to Don Mueang Airport or Suvarnabhumi Airport; or (4) travel directly from Lao PDR or Cambodia to Ubon Ratchathani in a private vehicle. Figure 1 shows the details of the road transportation options from Ubon Ratchathani to the Loas and Cambodia borders.
According to Figure 1, three of the four options for travelling around Ubon Ratchathani by public transportation pass through the bus terminal, and there is also the option of taking the airplane, which departs from the airport. The number of medical tourists is rising as a result of the need for well-planned local public transit from medical tourists. Even though it takes just a few hours to reach the medical centers, there are not many foreign visitors who travel to Ubon Ratchanani on public international buses. This is due to the issue of the protracted wait for local buses at the bus station in Ubon Ratchathani. Additionally, there is no guarantee as to how long it will take for a local bus or other form of public transportation to arrive at the bus terminal. Likewise, the bus routes do not include vital healthcare centers or accommodations for medical tourists. These problems arise for the following reasons: (1) there are not enough buses; (2) the bus route is not well planned; and (3) information about the trip time is not made readily available to the public. The following problems will be discussed in this article as a solution to the medical tourists’ public transportation issue in Ubon Ratchathani:
  • The travel itineraries of the current buses will be planned to include preferable hospitals, lodging locations, and tourism hotspots;
  • A smart bus service system will be designed to support medical tourists so they may access the timetable of their preferred buses and receive information about the bus network.
This article will be organized as follows. Section 2 will feature associated works. The study technique will be discussed in Section 3, and Section 4 will present the results of the bus route design process’s initial stages. Section 5 gives the conclusions and managerial implications, while Section 6 discusses the limitations and future research.

2. Related Works

Traveling between an origin and a destination, as well as within the destination, requires the use of transportation facilities and networks, which is inevitable. In contrast to the transportation arrangements between the origin and the destination, the dynamics underpinning tourist movement patterns and visitor behavior at the destination are more complex and less preplanned [13]. This problem is especially pertinent in urban locations because individual tourists frequently use public transportation to visit tourist attractions, despite the fact that they frequently lack familiarity with many of the local public transportation options. According to [14], the most popular form of transportation for tourists is the networks of tourist-friendly metro lines that connect the major hotel districts and well-known attractions in cities all over the world. The accessibility of tourist attractions, however, depends more on the available transportation alternatives because they are also spread out in outlying places. Masiero and Hrankai [15] modeled visitor accessibility to side attractions with a variety of accessibility variables, including land use, transportation, temporal factors, and individual accessibility.
For instance, city destinations are where the tourism is often concentrated in urban regions and other attractions in peripheral areas [16]. Visits to distant urban attractions frequently entail protracted journeys and the use of various modes of transportation. The literature on tourist attractions is replete with examples of how important transportation is at locations. Prior studies have addressed the development of transportation infrastructure and services using the analysis of visitor mobility patterns [17]. Due to the fact that local transportation options already meet some of the demand [18], it is critical to consider visitor preferences in light of the generally low demand for outlying urban attractions. The paucity of research on how visitors utilize and perceive local transportation networks makes it difficult to improve tourists’ consumption of urban attractions [19].
More research on the subject has been performed; in 2019, Grinberger and Shoval proposed allocating a bus for excursions during which tourists require varied amounts of time [20]. The bus allocation process is presented by [21], wherein transportation between various places is also considered. Less time is available for another activity when one activity (such as transportation) takes up more time. The composition of a network of attractions inside a destination is reflected in the spatiotemporal distribution of tourists. A systematic understanding of the geographic distribution of attractions in the destination is provided by the core–periphery model of attractions [22]. A main attraction may draw more visitors than a secondary one, and a group of attractions may draw more visitors who stay longer than at a single attraction [23]. Tourist migration continuously alters and shapes a destination’s spatial structure. An understanding of the structure of the destination and the relationships between destinations can be gained via mapping tourist movements [24,25]. The present trajectory of studies on visitors’ usage of urban public transportation and tourism in peripheral locations can thus benefit from a thorough analysis of tourist accessibility to peripheral urban attractions. By offering more discounts to regional bus operators with high demand, it will be possible to address the inadequate state of buses in Ubon Ratchathani. However, a management structure should be put in place to ensure excellent service and the maintaining of service standards, taking into account customer happiness and safety standards, in order to increase concessions for new operators [25].
The principle behind the new open innovation service design is that the service must be created using the demand and requirements derived from a pool of consumer information; this information must then be utilized to create a service that satisfies the needs of the customers. In order to address the issue of service during COVID-19, the process was applied in the healthcare system [26], which offered non-bound collaboration amongst medical centers that share their diagnostic, treatment, and vaccine technologies. Ref. [27] put forth a list of guidelines for creating modular structures for new product designs. Ref. [28] used the open innovation concept to develop new products for elderly-friendly food packaging that adheres to customer needs; it then created said packaging, and finally [29] developed platforms and channels in the hotel industry to collaborate with its guests in order to better understand their tastes and demands. We must thus use information from medical tourists in order to develop the service for them, and thus implement the open innovation idea in our bus route design and ultimately support medical tourists in the target area.
Open tourism was defined as a use of open innovation, crowd sourcing, and co-creation in tourism industries [30]. Many researchers worked in the theme of open data and open innovations in tourism. Watson R. et al. [31] initiated the open tourism consortium to promote the open tourism under the u-commerce model and enhance the tourist’s experience in the three phases of tourism including planning, touring, and reminiscing. Open data for tourism were also mentioned in many studies such as the Tourpedia [32], smart cities and tourism destinations [33], and the location-based recommendation system [34]. However, there are many challenges of using open innovations in tourism including the positive impact of open innovation in product and service development, turnover, and improving distinctive strength which relied on the innovation management model and technology adoption [35,36].
The following section will cover how the technology used to design the route and the system used to regulate the route drew from the pool of open technology that is now accessible.
Three processes will be employed in constructing the smart bus system in this study: (1) using qualitative methods to survey passenger/tourist needs; (2) planning the bus route; and (3) designing the smart bus system. The problem statements, approaches taken, and outcomes of earlier studies addressing issues comparable to those in our research can be categorized into the following 13 groups. (1) the article’s results show that visitors preferred to use public transportation (VT); (2) the article’s results show that tourists prefer certain attractions (PA); (3) the article’s results evaluate the state of the existing public transportation (CPT); (4) the article’s conclusion tries to boost client satisfaction (PS); (5) the article’s conclusion tries to reduce the trip time (TD); (6) in the article, the attraction allocation for routing (AAR) approach is employed; (7) the geographic method is used to form bus routes (GEO); (8) the heuristics approach is used to form bus routes (HEU); (9) data mining is used to design the bus route (DM); (10) transportation outsourcing decision (OUT); (11) a smart bus is designed (BS); (12) whether the bus route supports medical tourism is evaluated (MT); and (13) whether the bus route design employs the idea of open innovation (OPN) is evaluated. Table 1 addresses the conclusions of all scholarly works.
From Table 1, we can see that the research in this study collects all the necessary data in the same way as the previous literature, and the results are consistent with those of the other studies. However, we added another goal to the research, which is to take into account not only the tourists’ satisfaction, which we want to maximize, but also the travel distance, which is something that other articles do not do. Heuristics are used to address the bus routing problem, which is different from other approaches discussed in the related literature because the goal of our study is to reduce overall distances. The various techniques suggested in the other articles are not appropriate for this. In this study, we developed a smart bus system to work in tandem with the designed transportation routes in order to maximize the usage of those routes. Of course, using our created routes has boosted medical tourism, although other related publications have not taken that into account.
From the Ubon Ratchathani international airport to the city’s bus terminal, a service bus is available. It exclusively employs the five buses it has on hand to transport passengers from the international airport to the bus terminal. It encourages Thai medical tourism in Ubon Ratchathani if these buses are designed to incorporate the other hospitals, clinics, lodgings, and important tourist attractions. To our knowledge, a plan to assist the medical tourism system has not been specified in the area of urban and bus trip planning. The following are gaps in the research that we will address in our study:
(1)
In order to support the medical tourism system, the key players in the medical supply chain are included in bus route planning for the first time in this article;
(2)
Typically, bus routes are created using tourist preferences related to the attractions. However, in this study, the chain actors, such as hospitals, clinics, lodging facilities, and attractions, will be divided into various categories, which will have a significant impact on bus route planning. Hospitals and lodging are preferred based on their level of service and popularity, while tourism attractions are drawn from typical tourist attractions.

3. Research Methods

Open innovation or cooperative innovation is only significant when it is created in collaboration with everyone and for everyone. We employed the open innovation design concept in our research when creating the bus routes and the smart public bus system. We developed the bus route and its control system using the information provided by tourists, with tourists in mind (to cooperatively construct the route that will be used by everybody involved in the medical supply chain). As a result, when customers utilized our system, it was designed for them, and we let them respond. We derived information on how the participants in the medical supply chain collaborated when designing bus routes that would service the chain’s clients. Two groups were established in this research methodology. The initial survey group was used to ascertain the opinions of visitors to Ubon Ratchathani. This procedure will reveal what the tourists believe about the current public transportation and whether it supports medical tourism. In order to conduct this study, a sample of 400 people in this group was given a questionnaire to complete. We utilized the Cochran method to ascertain the sample size [37]. In the second part, we used the data from the first section to build new bus routes that will meet tourists’ demands. The smart bus system’s design will be included in this section. A smart bus system that can encourage medical tourism in Ubon Ratchathani can be designed using the web application platform. Figure 2 illustrates the four sections of the research that constructs a smart public bus system.
Figure 2 shows the conceptual framework of the smart public bus system (SPBS) being developed for Ubon Ratchathani. The SPBS of the Ubon Ratchathani airport bus was developed in four steps, as shown in Figure 2. These four steps are listed below.
(1)
Determine the demand for, and preferences of, tourists in relation to Ubon Ratchathani’s public transportation;
(2)
Based on the information from the survey obtained in step 1, choose the hospital, clinics, lodging, and tourism attractions;
(3)
Plan a bus route using the information from steps 1 and 2 in order to minimize the total traveling distance while maintaining the bus’s limited journey time;
(4)
Design the SPBS for airport buses using the IOT and GPS system.

4. Research Results

This section will be broken up into four sub-sections that correspond to the research methodological phases discussed in Section 3.

4.1. Public Transportation Requirement

In order to conduct this study, a sample of 400 people was given a questionnaire to fill out. We utilized the Cochran method to ascertain the sample size. Table 2 presents the survey’s findings. The table shows the total number of responders as well as the determined percentage.
According to the demographics of the respondents, 57% of them were men, 43% were women, and 1% did not specify their gender. The age range with the highest percentage of respondents (more than 54.5%) was 29–39 years old. For America, Europe, Australia, and Africa, the response rates were, respectively, 74.5%, 8.5%, 9.5%, 2.8%, and 4.80%. The respondent’s occupations included government employee, firm employee, student, self-employed, unemployed, and others, with respective percentages of 25%, 23%, 5%, 21%, 20%, 8%, 3%, and 6%. Since the majority of respondents have ties to Thailand as their country of origin, they travel there to receive medical care because the country offers services of a higher caliber. Table 3 shows the motivations of tourists who come to receive medical services in Ubon Ratchathani.
Common diseases are those that do not require serious or specialized care. Allergies, colds, flu, conjunctivitis, diarrhea, headaches, mononucleosis, and stomach aches are examples of common diseases. The term “specified disease” refers to conditions that require specialized care, such as cancer, TB, kidney disease, and neurological conditions with a disability level of at least 40%. The term “others disease” refers to illnesses that are not classified as either general or specific diseases, such as dental care and cosmetic and plastic surgery. According to the results in Table 3, general disease treatment is the top reason for respondents to travel to Ubon Ratchathani for medical care, while yearly health checks, other diseases, specific disease treatment, and chronic disease treatment are ranked lowest.
As previously mentioned, the respondents use private automobile services more frequently than other modes of public transit such as buses, trains, and so on. Table 4 displays the findings from our investigation into why the respondents prefer not to use public transportation, and particularly the bus.
The sample group was made up of foreign nationals who live in Ubon Ratchathani and foreign nationals who travel there for medical care. In total, 10% of the tourists and travelers do not choose the public bus since it is inconvenient. Other explanations given include that the public transportation system does not serve all necessary locations due to the insufficiency of buses, their lengthy wait times, and their unsuitable conditions given Thailand’s climate, which amount to 30%, 15%, 30%, and 15.5%, respectively. From the open-ended questions in the questionnaires, the following suggestions were derived. In the inner city, certain districts contain historical and cultural sites, museums, restaurants, and gift shops, and it is an old town with winding streets and no parking. Many tourists, both Thai and foreign, come here, but it was discovered that several locations lack buses along the route. The major university in Ubon Ratchathani is situated in Warin Chamrap district, only 20 km from the bus terminal or 15 km from the city/airport. However, there are only two bus lines, which are rather slow because they have to travel through the downtown area before reaching the institution. Because of this, students ride motorcycles to travel to the bus terminal instead of using the public transportation system, which increases the likelihood of accidents. This route is thus crucial for Ubon Ratchathani’s public buses as well. The next set of questions that we asked the tourists concern what should be improved in order for the tourist to change their mind and use public transport. The results of the subsequent questions are displayed in Table 5.
According to Table 5, the tactics proposed by tourists include increasing the number of significant destinations that the bus passes through, increasing the number of buses on all routes, increasing the number of air-conditioned buses, and incorporating attractions within the bus’s route. These suggestions were raised by 45%, 35%, 10%, and 10% of the tourists, correspondingly. We can infer from the analysis of the open-ended surveys that a long-distance bus with a small number of passengers should be switched to a van. As a result, there will be more vehicles traveling the lengthy route. Because all vans come with air-conditioning systems, they are very convenient for the passengers. Since this may be set up as a shuttle bus system wherein passengers purchase a one-time ticket on the day, vans can be used instead of buses on routes to attractions and added to the bus schedule, stop where the travelers would like to look, and then continue to the next location. This solution will increase the popularity of tourist destinations [38]. The results of this section, which was intended to create bus routes for medical tourists, are as follows:
(1)
The bus’s itinerary should incorporate essential destinations, such as hospitals, clinics, lodging, tourist attractions, universities, and important provinces;
(2)
There should not be such a large gap between buses, nor should they be predictable or recognized in advance;
(3)
The bus should be in top-notch condition, including the air conditioning, the engine, and the seats;
(4)
There should be enough buses (equivalent to two) on each route.
In the next section, we will discover what locations should be integrated into the bus’s route to support the medical tourism system.

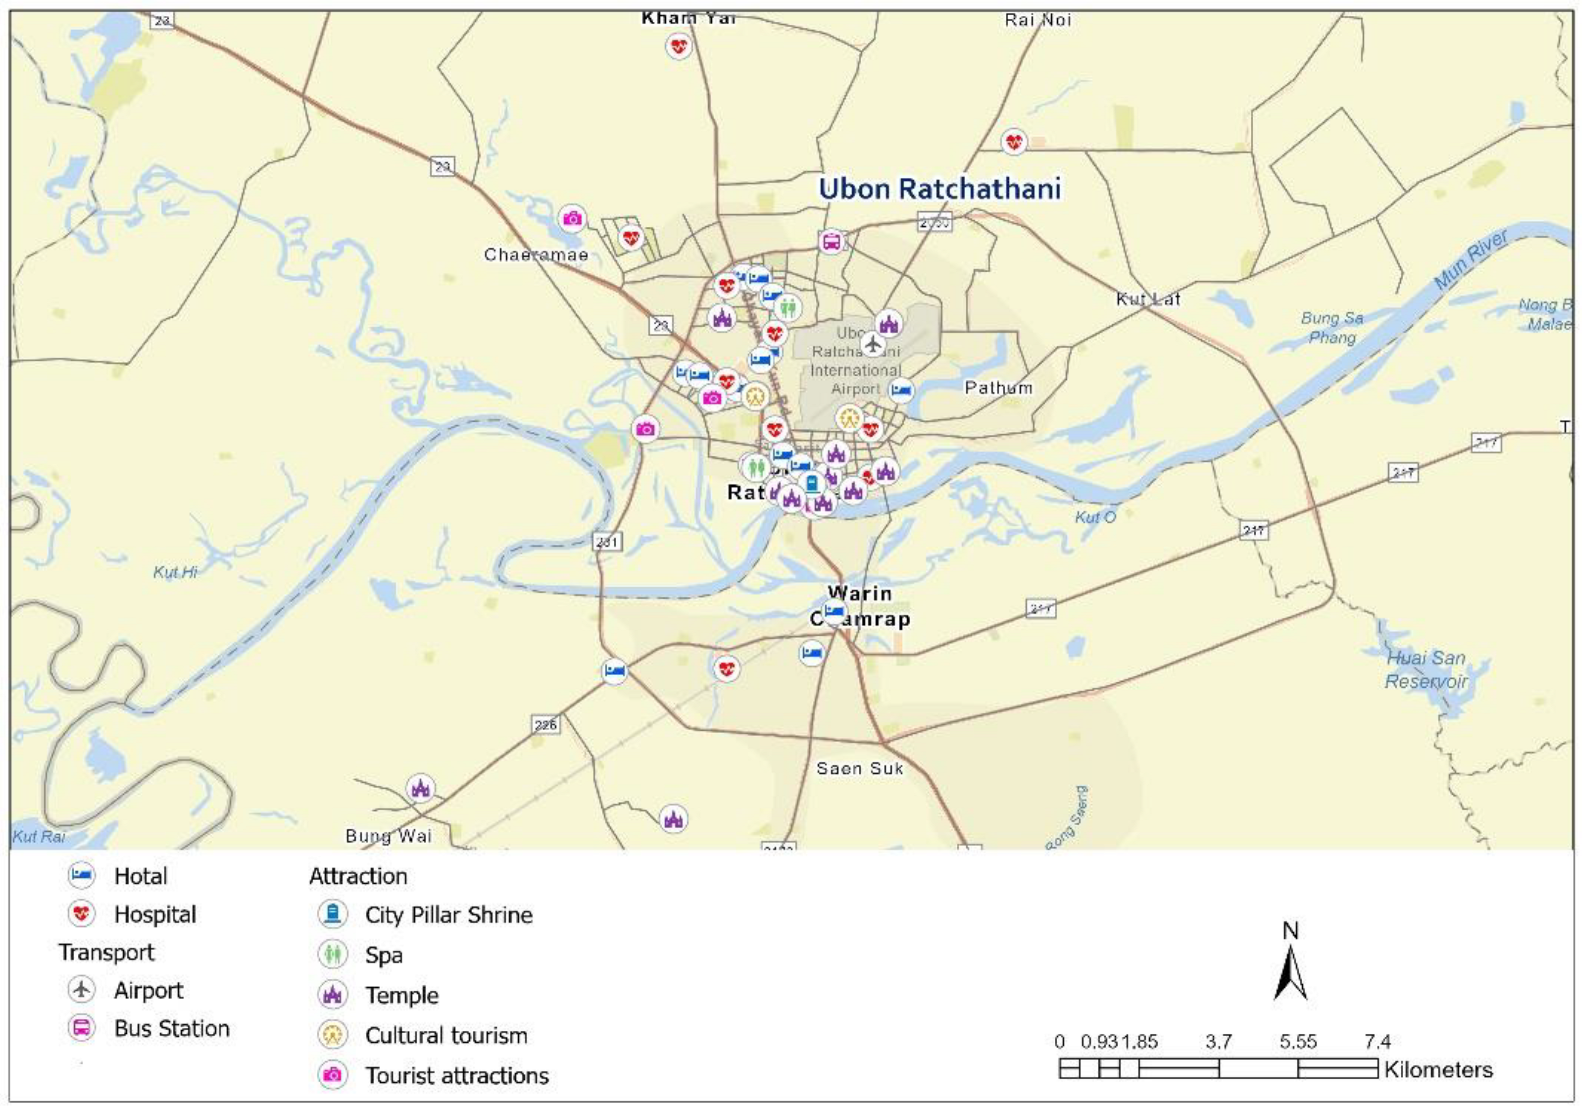
4.2. Determine the Locations to Be Integrated into the Medical Tourism Bus’s Routing System

The preferred hospitals, lodging options, and tourist attractions in Ubon Ratchathani are questioned in this section using the same questionnaire that was used in Section 3. We listed the top 20 hospitals, popular hotels, and the 30 most popular attractions. As such, 70 locations were included in the route designed for the bus. The most popular medical centers that the tourists prefer are listed in Table 5. The survey asked visitors whether they were familiar with and plan to use the hospitals, lodgings, and attractions whenever possible. The proportion of respondents who favored these locations was calculated and is shown in Table 6, Table 7 and Table 8. The respondents could choose more than one location.
The WIND clinic, a center for cosmetic and plastic surgery, is the most favored medical facility, as shown in Table 5. It is preferred by 97.65% of respondents. The runners-up are Sunasittiprasong Hospital, Smile Room Dental Clinic, and Ubonrak Thonburi Hospital. Table 7 lists the top 20 places that tourists are familiar with and choose to stay in.
According to the computational results shown in Table 6, V Hotel Ubon Ratchathani, Arista Hotel, Velawarin Hotel, and Yuu Hotel Ubon Ratchathani are the most popular hotels for medical tourists. The top 30 tourism locations that people know about and want to visit are shown in Table 8.
Table 8 lists the top five Thai destinations that medical visitors want to visit as Wat Phra That Nong Bua, Central Plaza Ubon Ratchathani, Wat Thung Sri Muang, Lak Muang (City Pillar Shrine), and the Rachabut Night Market. Each of these locations is rated as the favorite by more than 80% of visitors. A map which includes all 70 places is presented in Figure 3. As a result, the technique presented in Section 4.3 can be used to design the bus route.

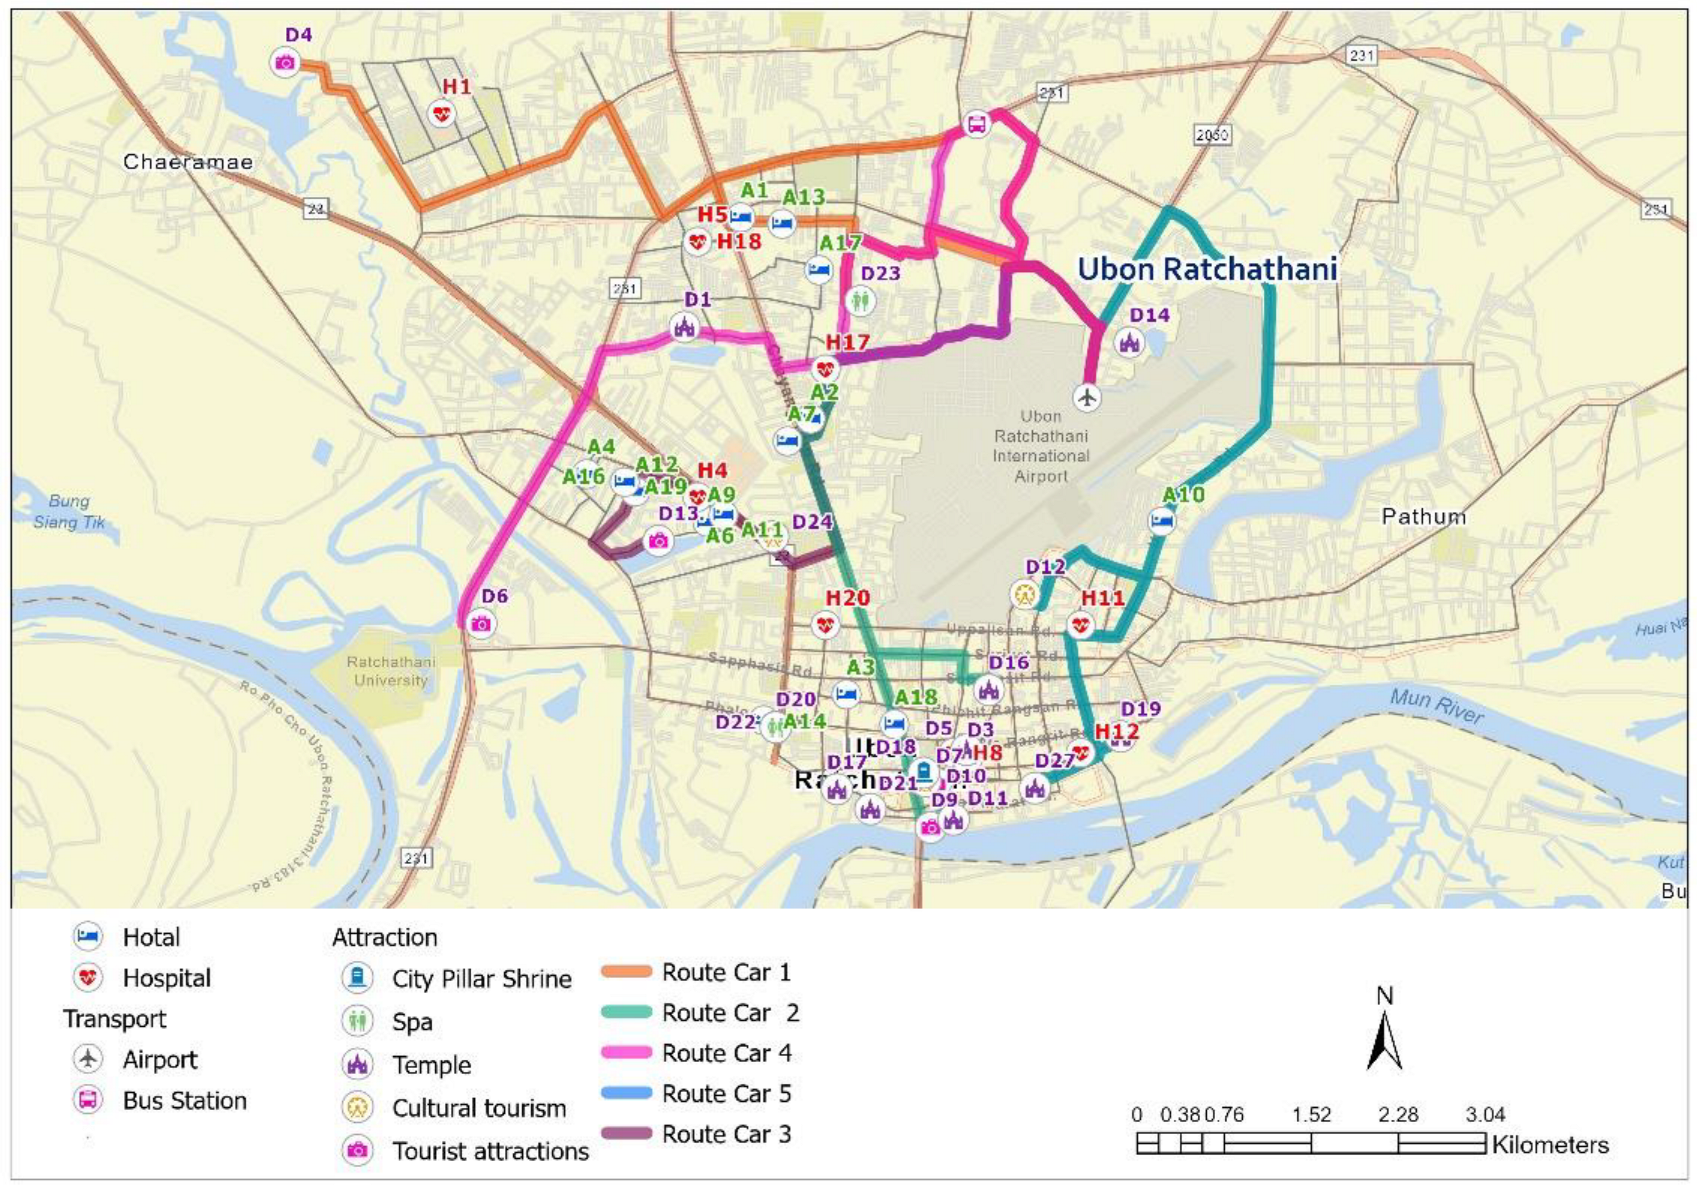
4.3. The Bus Route Constructed to Support Medical Tourists

Considering the data from Section 3 and the specifications derived in Section 3, the second step is to designate a bus route for five airport buses to support medical tourists. As recommended by Dechampai et al. [39], we will apply the differential evolution algorithm for the vehicle routing problem in this section. Figure 4 depicts the problem statement related to the bus route in Ubon Ratchathani.
According to Figure 4, the buses will depart from the airport terminal every day at 6:30 am to begin their route, conclude each trip at the bus terminal, and then take the same route back to the airport terminal. Each bus must return to the airport terminal in one hour, and the last bus must return to the airport terminal before 20:30. As there are five buses operating along this route, a bus will depart from the airport every 30 min. Additionally, all destinations need to be included in at least one bus route. The differential evolution (DE) algorithm’s general process consists of the following steps: (1) generate the initial set of solutions; (2) conduct the mutation process; (3) conduct the recombination process; (4) conduct the selection process; and (5) repeat steps (2) through (4) until the termination condition is satisfied. The DE used to create the bus route can be delineated step by step as follows.

4.3.1. Generate the Initial Set of Solutions

In this section, the proposed problem will be demonstrated, utilizing the actual number of encoding methods. The decoding method used to convert the true value into the suggested problem solution will then be applied. The decoding method will be used before selecting the procedure of the DE algorithm. Table 9 provides an example of a collection of vectors, wherein five vectors were generated for each iteration of the DE’s procedure. Assuming there are four hospitals, five lodgings, five attractions, and one bus terminal, and considering that three buses must stop at the bus terminal, it is necessary for the bus terminal to have three positions in one vector. Table 9 displays five vectors, each of which has a size of 1 × 17. In the first iteration, the initial vectors will be randomly generated. The results of the random selection are shown in Table 9.
Five random vectors were created using the data in Table 8 as a starting point. For instance, the first vector has 17 positions with values of 0.97, 0.07, 0.18, … and 0.37, respectively. The letters H, A, D, and B stand for the hospital, accommodations, destination, and bus terminal, respectively. Using the decoding approach, which will be described step-by-step as follows, the codes presented in Table 8 will be decoded to obtain the answer to the proposed problem.
The problem’s solution was decoded from the code generated and displayed in Table 8 using the decoding technique. This involves three steps, as below.
Step 1—The values are sorted into descending order. Let us define the sorting result as List A and the value in position j of the vector i as X_ij.
Step 2—The locations are assigned to the buses one at a time, starting with assigning the first place in List A to Bus Number 1, then the second location in List A to Bus Number 2, and so on. The second round of assignment is started by assigning the following locations in List A to Bus Number 1, and so on, until all of the locations in List A are assigned to the buses in the first round. The assignment will be conducted continuously until each location is paired with a single bus. Later, if the bus’s trip duration has not yet reached 90 min, the assignments will be conducted once more, beginning at the first location on List A. When it takes more than 90 min to go from the airport to every assigned placed and back, the assignment is terminated, and the final location that was assigned to that bus is removed from the route. The assignment restriction states that one bus can only travel to a specific location once. Other regulations for determining the bus’s route are as follows.
  • Each bus terminal must be serviced by at least two buses.
  • A bus cannot make a repeat trip to the same location.
  • Each bus travels at an average speed of 50 km/h outside the city limits and 40 km/h inside.
  • Several buses can travel to the same place.
Step 3—The relevant distances are calculated for each route.
If there are five buses and 17 destinations, as shown in Table 8, we decode vector number one. The first step is to sort the values into the positions of vector one. The result is shown in Table 10.
Then, the assignment step (step 2) will be executed, and the result is shown in Table 11.
The assignment process shown in Table 11 shows how each route begins at the airport and ends at the airport. In this illustration, the maximum trip duration is 30 min; however, in the actual case study, the maximum journey time for each bus is 90 min. Bus number one departs from the airport, travels to B1-H4-A2-D2-D5, and then returns to the airport. The total distance is 21.5 km, and the journey duration is 24 min. There are five buses, which in this case cover 124.5 km.

4.3.2. Perform the Mutation Process

Vector mutation, which has an impact on other pertinent vectors, was used to execute the mutation process. Three random vectors—not the current vector—will be used in the process. The other three vectors will be chosen at random and given the names vector r, n, and m if the current vector is vector i. Formula (1) is used to conduct the mutation process.
V i j t = X r j t + F X m j t X n j t
where V i j t is the mutant vector I; F is the scaling factor, which is the predefined parameter; and X r j t , X m j t and X n j t are vectors r, m, and n, respectively.

4.3.3. The Recombination Process

The recombination process is used to recombine the current target vector ( X r j t ) with the current mutant vector using Formula (2).
U i j t = V i j t     i f   i j C R X i j t       o t h e r w i s e  
U i j t is referred to as the trial vector or the vector following recombination in iteration t. The current target vector ( X i j t ) will be equal to the mutant vector ( V i j t ) if the random number ( i j ) of vector i position j is smaller than the controlled random number (CR), which is the specified value.

4.3.4. Perform the Selection Process

The selection process aims to select the target vector for the next iteration. Normally, the best solution between the trial vector and the current target vector will be selected. This process is executed using Formula (3):
X i j t + 1 = U i j t     i f   f U i j t   f X i j t   X i j t             o t h e r w i s e                            
where f ( U i j t   ) is the objective function of trial vector U i j t   , and is the objective function of the current target vector X i j t   .
The trial vector will be used in conjunction with the local search approach before the selection process is put into action. This study used the k-random-move approach as its local search methodology (K-RM). The following is an explanation of the K-RE method.

4.3.5. K-RM Method

To improve the quality of the trial vector’s solution, the K-RM, a local search technique, will be applied. The following are the three main steps of K-RM: First, a random K value is chosen for the current solution. Next, a random K position from all positions is chosen in the current solution. Finally, the selected position is cyclically moved in the order of the randomly selected positions. Each answer will go through 50 K-RM cycles of the local search. Figure 5 displays an example of the K-RM technique. Figure 5 makes the assumption that K is chosen at random, and has a value of 7. The seven positions were chosen at random in the following order: D5, B1, H1, D1, A3, D5, and A1. Figure 5 displays the updated solution as a result of the local search. If the move is forbidden, the next position will be chosen at random, and the location will be changed to one that is allowed. Figure 5 shows that the new solution following the application of K-RM is superior to the existing solution; hence, the move is accepted; the new solution is used, and U i j t and f ( U i j t ) are updated.
In conclusion, the DE pseudocode is used in Algorithm 1, as shown below.
Algorithm 1. Differential evolution algorithm (DE)
input: Population size (NP), number of locations (D), mutation rate (F), recombination rate (CR)
    output: Best_Vector_Solution
    begin
      Population = Initialize set of Vectors
      IBPop = Initialize InformationIB (NIB) [ X i j t ]
      encode Population to NP
            while the stopping criterion is not met do
                  for i = 1: NP
                    Perform the mutation process and update V i j t
                      Perform the recombination process and update U i j t
                    Perform the K-RM
                    Perform the selection process and update X i j t + 1
                  end For Loop//end update heuristics information
            end while Loop
      return Best_Vector_Solution
    end
The case study, which comprises 5 buses, 70 sites, and a 90 min time limit, will be resolved using Algorithm 1. Table 12 and Figure 4 display the route design solution. On a computer with an Intel ® Core TM i5-2467M CPU operating at 1.6 GHz, the DE is written in C++.
According to Figure 6 and Table 11, five buses will travel 757.3 km in total. We compare the outcomes of our suggested approach with Mitchell’s [40] genetic algorithm (GA), applied to solving the case study in Ubon Ratchathani in Table 13.
The computational result in Table 13 demonstrates that DE provides a better solution than GA for both criterions, i.e., a journey distance and travel time of 5.63 and 7.14%, respectively. This is supported by [41,42], who claim that DE offers a superior solution to GA to the transportation problem. However, depending on the circumstances and the local search strategy we adopt, the methods may produce different results. The shorter distance traveled according to DE compared to GA not only resulted in less fuel being used, but also in less CO2 being released into the atmosphere. The impact on the environment has been extensively researched, and is of utmost significance in the modern research period. Ref. [43] addressed how crucial it is to employ clean transportation technologies to reduce greenhouse gas (GHG) emissions.
The idea of employing an efficient transportation system to lower CO2 emissions has been extensively debated in numerous studies [44,45,46]. Therefore, cutting down on the distance DE must travel overall can significantly cut down on the amount of CO2 released into the atmosphere. Additionally, the smart bus system that we will demonstrate will be used with an electronic bus in the following section, which will significantly lower the amount of CO2 released. In the next experiment, we compare the simulation result and the current situation of the buses, as indicated in Table 14, to determine the differences between the current situation of these five buses and the proposed traveling route. Moreover, we use 70 POIs as the normal VRP problems to solve the bus route design [47,48,49], and our next experiment is focused on how well the GA and DE perform in contrast to optimization tools such as Lingo V.16. For example, Lingo V.16 requires more time than it has to optimally handle a problem involving 70 POIs and 5 buses (240 h of computation time). Table 14 shows the results of a comparison between Lingo V.16, DE, and GA. While DE and GA only took 30 min to compute, Lingo V.16 took 240 h.
%   d i f f e r e n t = | O b j D E O b j C a n d i d a t e | O b j C a n d i d a t e × 100 %
When O b j D E is the objective result of the differential evolution algorithm and O b j C a n d i d a t e is the objective result of the candidate, which in this case is CR and LI, the % difference is determined using Equation (4). According to Table 14, the new bus routes travel farther and take longer to reach their destinations than the bus routes that are currently in use. The distance and travel time on new routes are increased by 19.59% and 14.50%, respectively. The new bus routes, however, can travel via more hospitals, hotels, and destinations, covering 566.67%, 191.67%, and 425% more locations than the existing bus routes, respectively. Comparing the best objective determined by the optimization software (Lingo V.16) using 240 h of computational time, we discovered that DE provides superior solutions for all KPIs by 9.70 to 20.69 percent. We can draw the conclusion that while providing medical tourists with better services will cost more time and money, they will be happier and more likely to use public transportation than under the current bus routes.
We conducted a survey with another 400 respondents within the same group of tourists, and revealed their satisfaction level and the likelihood of them using public transport if we designed the routes as shown in Figure 5; the result is shown in Table 15.
According to the survey’s results, which are shown in Table 15, more than 98.2% of respondents appreciate the new bus route design, and 100% of them believe that the buses pass by their favorite hotels and hospitals. There are many places in Ubon Ratchathani, but we only chose 30 of them to include in the plan; therefore, 1.5% of respondents believe the buses do not pass by the tourist attractions they prefer. If we included every location, it might result in lengthy journey times and increased energy use. The rating that travelers give the new routes is 95.6%, which is extremely high. Finally, 99.5% of respondents think that when the planned routes are implemented, they will utilize public transportation more since it is convenient and simple to use.

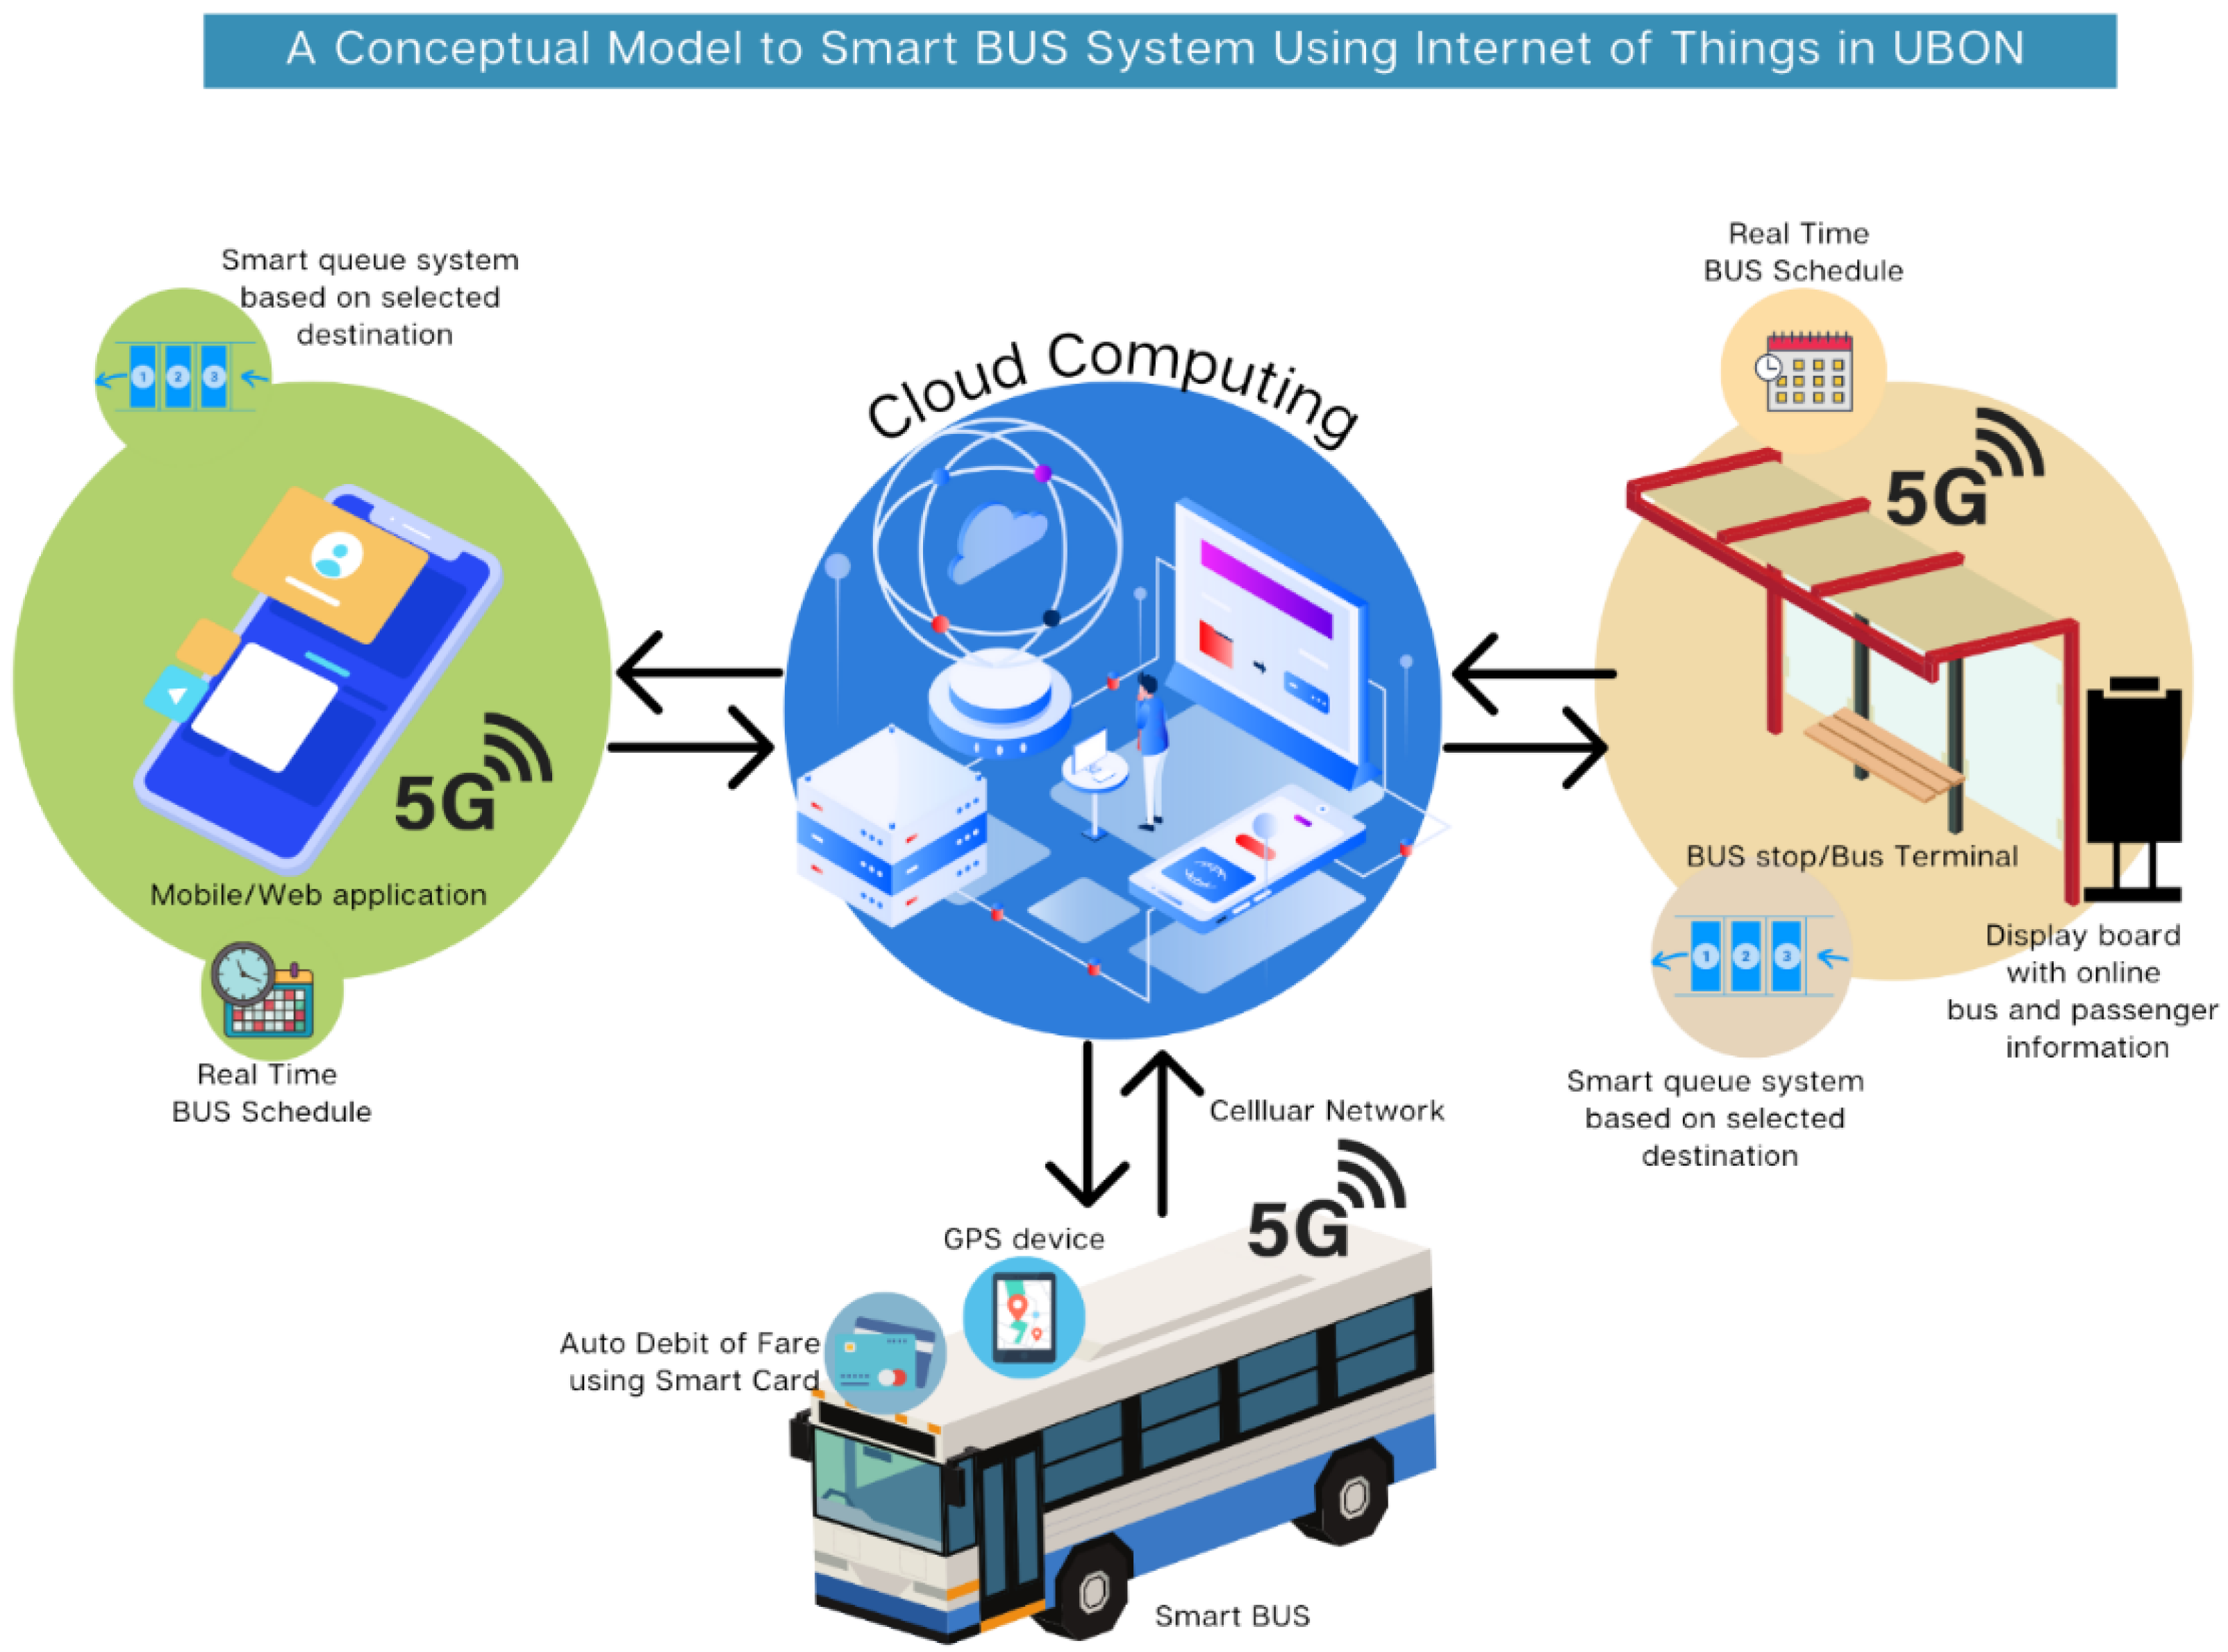
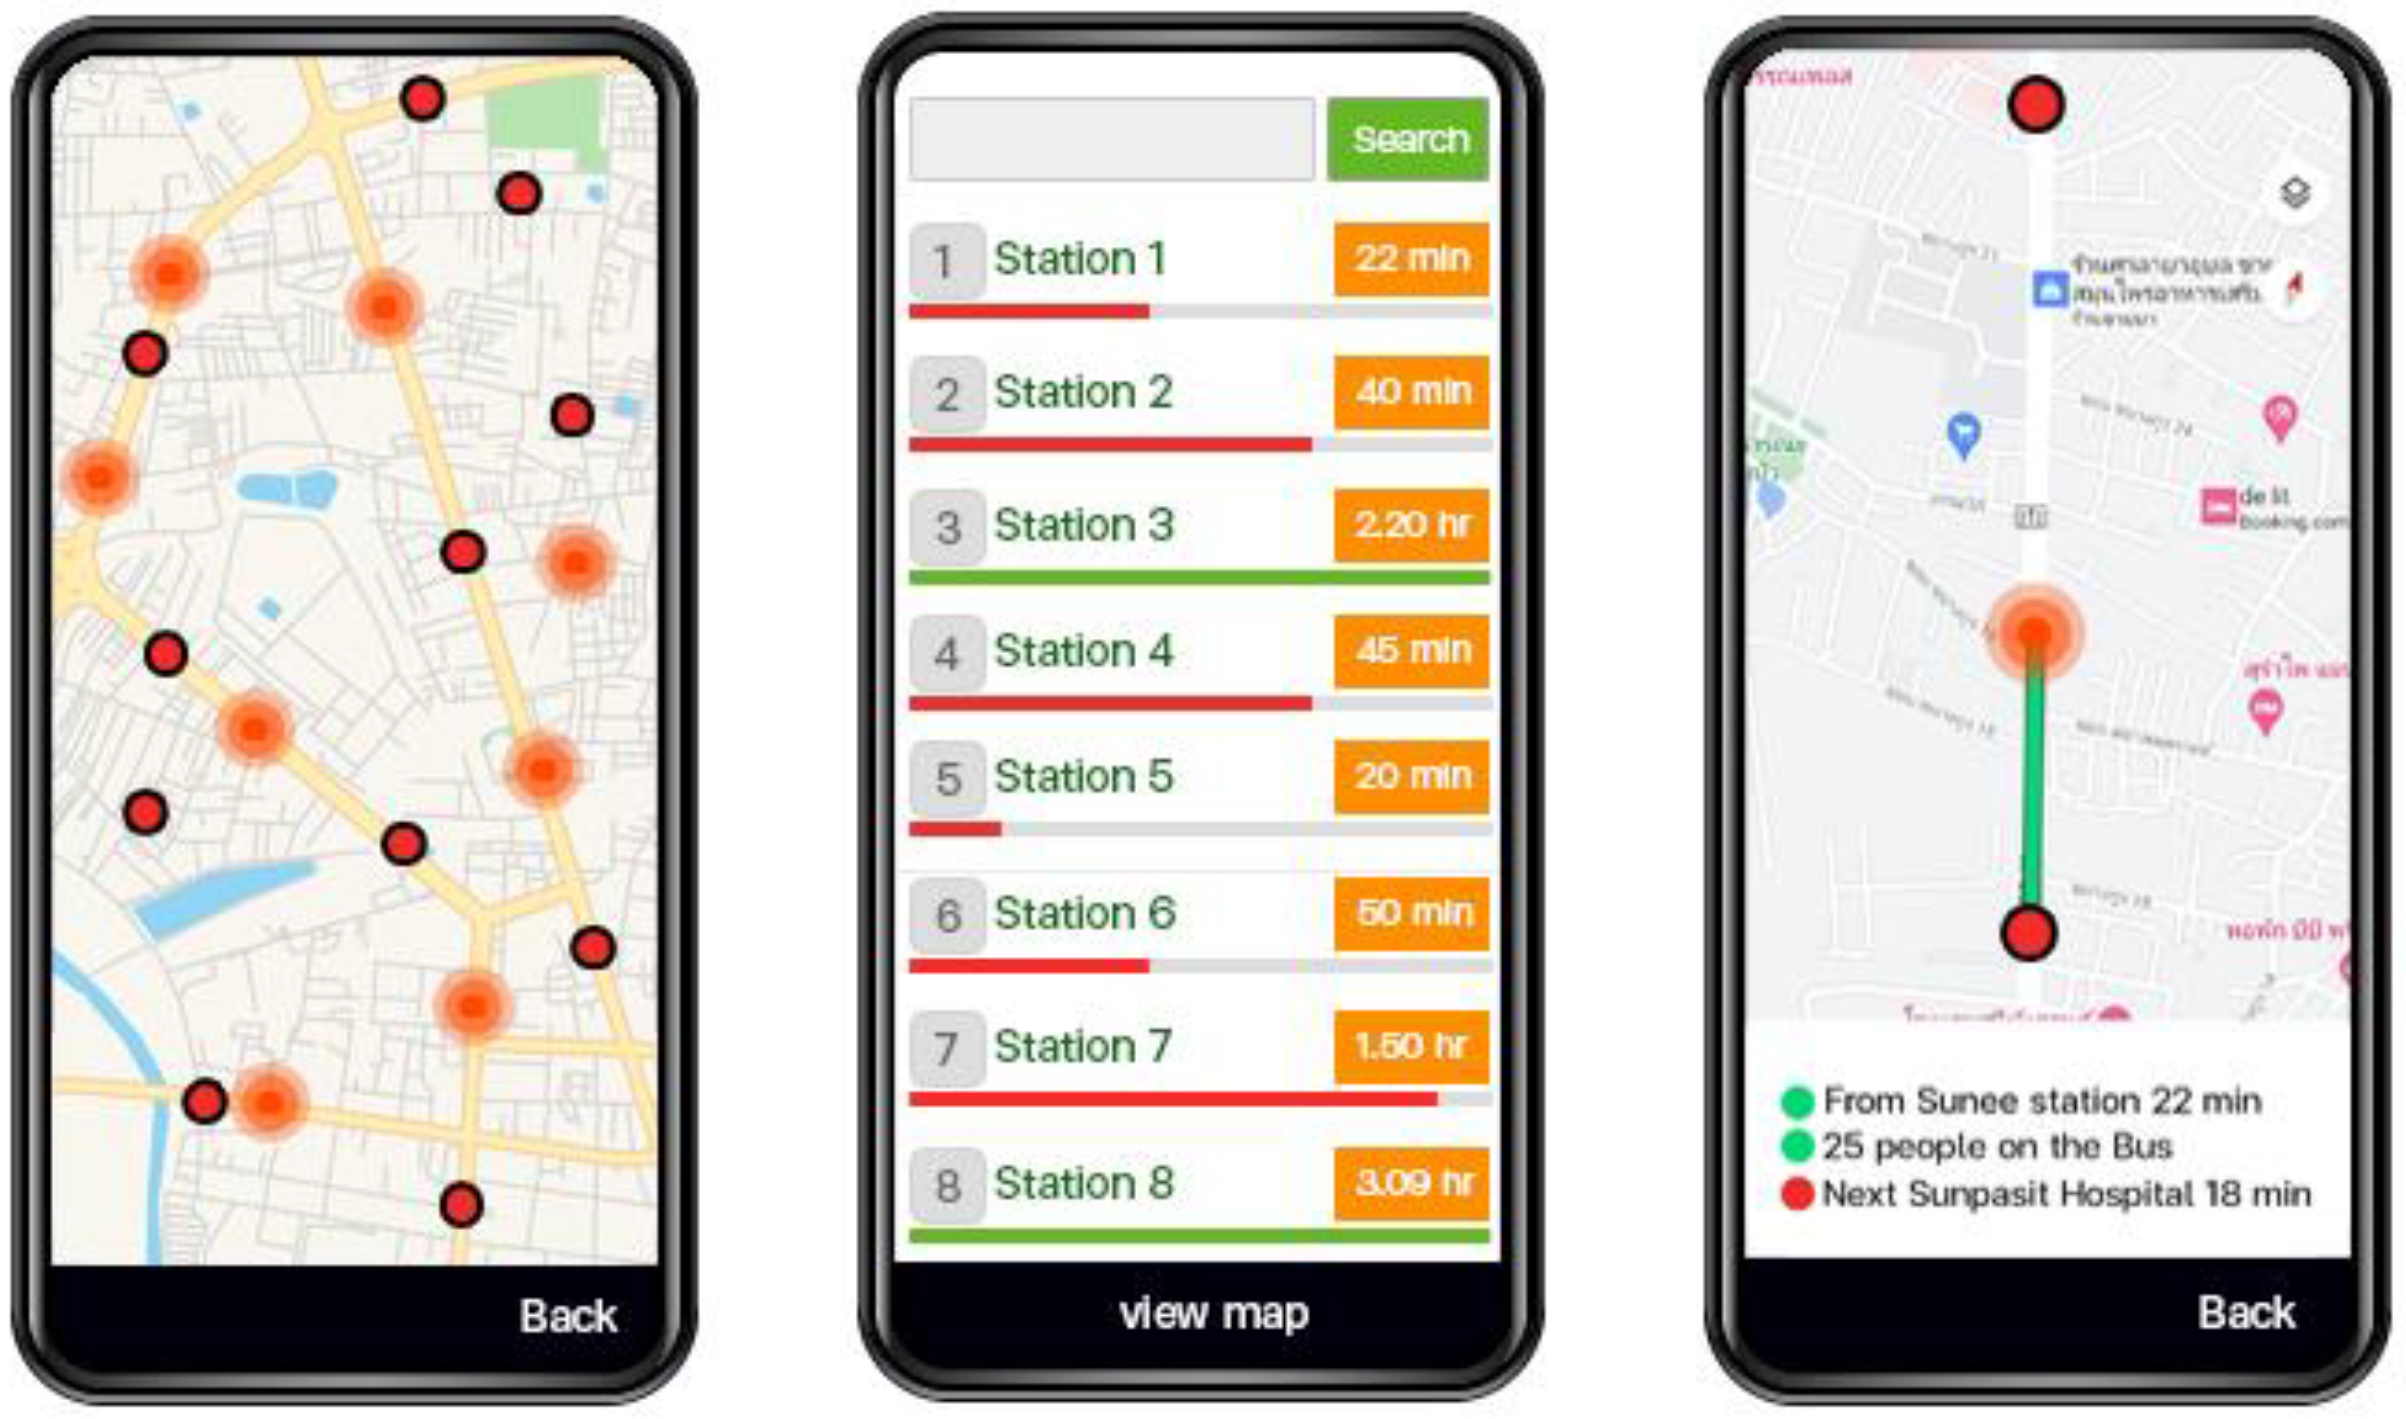
4.4. The Smart Bus System Design

A smart public bus system (SPBS) will be designed to support medical tourists according to their requirements. The conceptual framework used to design the SPBS is shown in Figure 7.
All smart buses will have GPS installed for real-time location tracking. The identification and payment system will be installed at the bus’s main entrance so that passengers can pay their bus fares there. The payment options include using a smartcard or an auto debit from one of the participating banks. The bus will also be equipped with 5G WiFi hotspots. These can be used to connect all electronic and sensor devices to the internet, not just for the benefit of the customers. The map will show the bus’s precise location and the expected time of arrival at each bus stop. A multi-language voice announcement system will also be available to inform passengers of the location of the next bus stop. The number of people who must disembark from the bus at the next bus stop, as well as information on traffic conditions and emergency alerts, will be sent to the drivers in real time. Every smart bus stop will have an electronic screen that shows bus routing details. Payment services and online top-up for smartcards will be available on mobile and web applications. Additionally, a real-time bus schedule, with smart bus positions on a map and passenger counts, will be implemented. The IOT components used in the smart public bus system, depicted in Figure 7, are compiled in Table 16. Table 17 lists the capabilities of the developed smart public bus system, which we designed with the needs of the customers in mind, with a list of tourists’ requirements regarding the bus service system, derived from a survey of the tourists shown in Section 4.1.
Information from Table 17 illustrates that all visitor needs were considered when the system was being designed. The buses traveled past 425% more attractions, 191.67% more hotels, and 566.67% more hospitals than on the existing route. Our method uses an airport city bus to transport people from the airport to the bus station, in contrast to the current public bus service in Ubon Ratchathani, which is devoid of air conditioning. The buses all have air conditioning. The bus tracking system, which contains route information, and the payment system are both run by electronic procedures. However, the recently created bus transit system satisfies all of the requirements of patients.
Figure 8 depicts an illustration of the user interface used to see the bus timetables and the estimated arrival times. In order to use the application as a tool and source of information to enhance the service, passengers may also review and rate the drivers, the quality of the service, and other issues. The application enables users and passengers to view the current bus occupancy, allowing arriving passengers to judge whether there is space for them on the bus or whether it is at capacity. If the bus is full, passengers can check the arrival time of the subsequent bus and prepare to board it.
The bus schedule can be monitored quickly to ensure buses are available throughout the day and on time using the application connected to the GPS system of every vehicle. In addition, passengers can check the next buses that will arrive at their nearest stop in a few minutes using the same application [50]. Currently, only Ubon Ruamjai Pattana Muang Company Limited provides smart bus services with a system to check the availability of the next bus that will arrive in the vicinity so that we can walk to the bus stop in time, and the bus is connected with GPS in real time, with CCTV installed to prevent crimes. The CCTV can also be used when passengers forget their belongings, as staff can check the footage and return the items immediately. They also feature a platform for wheelchairs, free Wi-Fi, USB chargers, and cashless payment systems using the E-wallet to reduce the transmission of various infectious diseases. The smart bus service with air conditioning will charge THB 20/trip.
There will be a cheaper bus service charging THB 10/tri, which will be open-air and of lower quality. For safety purposes, the Department of Transportation concession owners should make improvements to open-air buses by equipping them with GPS, which will allow them to monitor vehicle speeds, route adherence, and punctuality; this will improve the quality of service and ensure that the buses are available at all the same times as open-air buses.
Passengers can view the bus timetable at any point via GPS, in order to improve the effectiveness of public bus access. With the use of GPS, travelers can plan their routes and decide where and when to wait for a specific bus. This will boost passenger satisfaction and reduce the use of personal vehicles. The use of public buses should be increased. In the end, this will minimize inner-city traffic congestion, air pollution, and accidents [51]. Using a smartphone to access GPS is simple and practical. Additionally, it can immediately notify clients that the bus they are waiting for will arrive in a few minutes. Furthermore, it will assist passengers in preparing to board the bus. Likewise, smartphones make it easier to pay the fare without having to worry about having enough cash. Moreover, operators need not worry about their health because restricting contact between people slows the transmission of contagious diseases, which is appropriate given the present COVID-19 situation [52,53]. RFID tracking technology is another means of maintaining service standards and customer satisfaction while ensuring safe driving and punctuality. Travelers may make more considered travel plans with the use of GPS and RFID, which also allows those waiting to learn the status and location of the bus. This will thereby boost the effectiveness of public transit [54].
E-logistics, such as RFID, assist bus operators by letting them know where a lot of customers are waiting during rush hour, and where regularly scheduled buses will not be able to provide their service. In order to quickly service people, an urgent bus can be added to the region. The competitive advantage is increased by this enhancement [55]. Estimates of the demand for buses at each time and day of travel are necessary for bus management during peak periods. This prediction can be formed using statistical information. The forecast is then planned using calculations. This will make it possible to quickly prepare the vehicle as needed, and alter it as necessary, ultimately saving money on bus management and matching the fare [56]. Increasing the number of buses will result in more pollution when environmental protection and sustainable development are considered [57].
As a result, it is important to specify in the grant to new bus operators that the vehicle must use renewable energy to prevent pollution. Old buses are replaced with sustainable energy vehicles, such as electric vehicles, when they reach the end of their life. How far a charged battery can travel is one issue to be considered in relation to a clean-energy bus. For instance, running a short route in the city but stopping so frequently that the driver does not remember to check the distance may drain the battery. Using a smaller battery to match your daily trips or using a GPS to help you measure distance and know when to recharge the battery are two ways to avoid these issues [58,59].
The computation results given in Section 4.3 show that the new routes’ trip lengths are 11.96% shorter than the old ones. Shorter travel distances need less energy, which reduces the amount of CO2 emitted, hence reducing the effect of global warming that is brought on by inappropriate energy use in transportation. The proposed bus route can lower greenhouse gas emissions in addition to transportation costs. The impact on the environment is becoming more and more concerning today, because it can lead to a variety of problems. New technology advancements and behavioral adjustments will be needed to stop the effects of climate change. The world needs to move to more clean energy technologies and a sustainable economy. There are disagreements over the possibility of a significantly changed climate and the difficulties it would present for daily life. In this study, we seek to increase the use of public transportation by locals and medical tourists alike in order to decrease the number of fossil-fuel-consuming vehicles. In an effort to meet their needs, we aim to employ the open innovation concept design, which includes designing the product from the perspective of the users. According to the research findings, 99.5% of passengers would use public transportation if it were implemented. Therefore, it is possible that CO2 emissions may drop if the number of people driving private vehicles decreases, which might have a positive impact on the global climate. It is established that in addition to technological advancements that can reduce the contribution of public transportation to climate change, open innovation designs that can change passenger behavior can also contribute to a reduction in the environmental impact of the transportation industry.
Even though human behavior has changed, which can help to properly protect the world from global warming, technological development is still crucial for minimizing the environmental impact of the transportation industry. The need for energy around the world has led to extensive research in and the rapid growth of new technology to produce energy or green energy. Climate change mitigation strategies that are now the focus of in-depth research across several initiatives include electrifying transportation, utilizing wind and solar energy, increasing fuel efficiency, and replanting. This study uses the smart bus, the most recent electric vehicle technology, as a component of the smart bus system. To reduce the negative effects of CO2 emissions on the environment, we want to deploy electric smart buses. However, we can draw the conclusion that smart energy management, changing human behavior, and the use of high-tech innovations (such as electric vehicles) can all work together to significantly minimize global warming.
The autonomous electronic bus is a different choice for short-distance inner-city bus routes that can help the city clean its air. Additionally, power sources arranged as a straight point might help carry electricity due to their close proximity [60]. A battery for a long-distance vehicle needs to be considered that has more capacity and power, can travel extremely far, and can supply the final miles of the vehicle’s driving range. The vehicle must be able to quickly locate the battery-charging station [61]. However, because using clean energy is less expensive than conventional energy in the beginning, operators will be able to minimize energy expenses by investing in cars that employ clean energy technology. Our opinion is that the government may decrease spending while still adhering to the UN’s sustainable development goals by deploying traditional energy-saving engines to minimize emissions. The government has a policy of promoting clean energy by keeping energy prices low. Finally, bus companies will see shorter returns on new bus purchases and higher profits than usual [62,63].
Our research shows that smart buses could improve passenger satisfaction on public transit systems, but implementing them is difficult. This is because the development of a smart city is contingent, not merely on state-of-the-art technology progress, but also on the decisions and actions of local communities and policies [64]. To strengthen the cooperation between researchers, policymakers, and the community, the transfer of knowledge to the community and the politician, who must have a tight relationship with each other, can raise the likelihood of success for the smart bus system [65]. The smart/autonomous vehicle and other robotic industries are the business sectors that require high and rapid open innovation technologies, as well as a business plan and model for success [66], as it is difficult to execute these technologies in the real world and achieve success. The purpose of this study is to create a public bus system for one city in Thailand in order to encourage medical tourism, which can be understood as a public sector activity. Open innovation is vital not only for the public service sector, but also for all business sectors, including SMEs, startups, and large corporations. Entrepreneurial cyclical dynamics of open innovation has three sub-economies, including market open innovation by SMEs and startups, closed open innovation by large corporations, and social open innovation. They proposed that in order to accelerate business growth, all subeconomies must be well-balanced [67].
The term “open innovation” (OI) refers to the process of “using external knowledge while making internal expertise freely available to others” [68]. Numerous channels exist for tapping into this pool of external expertise, from casual conversations with clients and research and development (R&D) partnerships to more formal contracts for independently created technologies [69]. The term “open innovation” refers to a business strategy that aims “to increase the markets for external use of invention”, which includes both the sourcing and commercialization of technologies [70]. To sum up, open innovation is a method of managing technology that benefits from the contributions of both internal and external stakeholders. Companies have made deals with third parties to acquire technologies for quite some time, but often these deals were one-offs with no commitment to further cooperation [71].
It is argued in this study that the availability of smart bus technology and the effectiveness of bus routing design, both of which may be found in publicly accessible internet sources, are integral to the success of the smart bus system. Without open innovation, we cannot claim that this study would have been a success. As the knowledge-based economy grows (a point [72] makes), so does the volume and speed with which knowledge is shared around the globe. Companies increasingly rely not only on in-house innovations but also on acquired expertise and cutting-edge technologies. Furthermore, the trend of open innovation is rapidly expanding across various sectors in around the world [73,74,75] as companies make their underutilized innovations available to third parties. Since open innovation (OI) relies on transfers across the borders of knowledge and technology, it will be used to refer to user innovation, customer innovation, collective intelligence, crowdsourcing, and open source innovations. New items from companies are often quickly duplicated by competitors, and the lifespan of even the most innovative products is decreasing. The commodities trap describes this trend, which is becoming more widespread. As a result, OI is receiving a lot of attention because it is a process that makes technological innovation possible all the time [76].
While we do take advantage of pre-existing innovations in our research, there are still certain issues with the open technology’s adaptability that need to be addressed by its creators. In order to make the best use of the existing technology, it must be modified to suit the characteristics of the product. After carrying out extensive investigation, we determined that the present bus routing system might be adapted to meet the needs of medical tourists by first accounting for information regarding consumer requirements. These are the primary benefits of our proposed method for utilizing the open innovation success, and they should be applicable to various open innovation dynamics.
According to [77], the zigzag growth pattern of the company caused by open innovation dynamics based on the inter-rationality of economic actors could provide any realistic solution to surpass the growth constraints of enterprises or economic systems. This means that using open innovation strategies might boost corporate expansion, but our findings also suggest that, without proper adaption, such strategies can lock a company into a cycle of producing subpar goods at best [78,79]. This is especially true in cutting-edge technology sectors. Another benefit of open innovation is that it can shorten the time and money spent on R&D when developing new products, which in turn reduces transaction costs [80,81,82,83]. Knowledge from outside the company, in the form of knowledge transfer or spillovers, has been shown to boost a company’s ability to innovate and increase its productivity [84,85]. Open innovation can be very profitable for some companies, but it is not right for everyone. Creative industries have the biggest barriers to information collaboration in both domestic and foreign markets, as shown by [86], which shows that barriers to open innovation vary among knowledge-intensive sectors and at different geographic dimensions. Consequently, before implementing open innovation, we must recognize that the innovation is appropriate for the current state of our firm and business, and that doing so would not shorten the product life cycle, which is crucial to our success.

5. Conclusions and Managerial Implications

This study aims to create a public bus route in Ubon Ratchathani that will help the city’s rapidly expanding medical tourism industry. In order to better understand how 400 visitors to Ubon Ratchathani see public transportation, our first step was to poll them. After utilizing the survey data and the differential evolution algorithm (DE), we constructed bus routes. After figuring out the optimum bus routes, we designed an intelligent public bus system to support the use of public transportation by medical visitors. According to the computational results, the novel routes using DE will lead to a 5.97% reduction in travel distance when compared to the output of the well-known genetic algorithm (GA). More than 98.5% of visitors were satisfied with the new routes, and once they start running, 99.5% of all respondents stated a plan to use public transit. In comparison with the previously used bus routes, the new bus routes pass 566.67%, 191.67%, and 425.00% more medical facilities, lodgings, and destinations, respectively.
The bus routes we developed benefit both healthcare visitors and regular city tourists in Ubon Ratchathani. Because the bus routes encompass all of the most popular tourist locations, as well as the best hotels and other lodging alternatives, they can boost the competitiveness of the tourism industry in Ubon Ratchathani. Every bus route also has bus stops at intersections. This will make it simple for guests to travel from the hotel lobby to the area’s key attractions. Due to the anticipated increase in tourists, businesses along bus routes might improve their capacity and competitiveness, and thus generate more revenue. Because the current bus system offers both private and public operation options, and because operating costs were kept around THB 20 for the entire bus line, bus operators can choose to operate privately or publicly. The service cost of the bus can be decreased by adding more options for businesses to participate in the bus management system, such as placing bus stops at sponsorship areas or at suitable positions.
The government is in charge of service quality, safety, and reductions in environmental pollution issues. Public transportation providers may also receive compensation in the form of service fees. A higher level of service will draw more customers, which will ultimately boost revenue. This will serve as an example for supporting cross-border medical services in major cities such as Ubon Ratchathani, which are border cities and have connections to other countries. In the wake of the COVID-19 pandemic, transportation providers are advised to expand their cleaning procedures for buses beyond what is customary and maintain safety standards to prevent transmission even after the epidemic situation has passed. This will boost passengers’ confidence in the cleanliness of their surroundings.

6. Limitations and Further Research

The distribution of surveys was challenging during the COVID-19 pandemic, which was one of the study’s shortcomings. Additionally, obtaining information is too expensive due to the need for international communication via social media and international telephones, as well as the length of time this takes. It took a while to broach the primary issue of language and communication problems, because some foreign nationals cannot speak the researcher’s language and others cannot communicate in English. As a result, we had to utilize an interpreter. Because it takes a while to check the accuracy of material, the interpreter occasionally misinterpreted the meaning. Future research ideas include looking at different supply chains to support Ubon Ratchathani’s claim to medical excellence, and finding ways to enhance service standards and boost client happiness.
Because we intend to create the bus route to assist medical tourism, we did not consider demand for use when conducting our research. The demand of customers at each site of interest is determined by the results of a survey; hence, we are unable to estimate the number of passengers that will be present at any location. Based on the results of the poll, the most appealing attractions and destinations for medical tourists have been identified. This research could only be implemented when bus capacity was adequate and demand was low because it failed to take into account demand for use, a key component in the overall planning of bus routes. As a result, this is a drawback of the study, and additional research expansion is warranted to fill in this research gap.
This study concerns the findings of a survey that was conducted only among visitors to Ubon Ratchathani for medical purposes. If the poll was to be switched to Thai visitors or tourists who traveled to Ubon Ratchathani for other reasons, the preference scores of the attractions, destinations, and medical centers may radically change. However, bus route design can still benefit from the study’s methods. This study makes the assertion that the bus route design herein promotes medical tourism and increases their satisfaction with public buses, but other sorts of tourists may have different feelings. The whole spectrum of tourists must be included in the survey if we want to improve the bus routes to accommodate all types of tourists. Additionally, the management of must-see locations (bus terminals and intersection stations) and speed limits will result in the creation of different bus routes. Therefore, it is necessary to redesign the bus routes whenever information and regulations change. However, the smart bus system that we created on a web platform is simple to adapt to new routes or to changes in existing routes. The flexible mechanism of the differential evolution algorithm (DE) makes it capable of responding to changes in the information and rules governing bus route planning.

Author Contributions

Conceptualization, S.N., R.P. and T.K. (Thachada Kotmongkol); methodology, T.K. (Tawamin Kruasom), K.U. and R.P.; software, C.K., W.S. and N.N.; validation, S.K., T.K. (Thachada Kotmongkol) and S.N.; formal analysis, N.N., K.U. and T.K. (Tawamin Kruasom); investigation, S.N., R.P., N.N. and T.K. (Thachada Kotmongkol); resources, C.K., S.N., T.S. and K.U.; data curation, W.S. and S.K.; writing—original draft preparation, S.N., R.P., T.K. (Thachada Kotmongkol) and N.N.; writing—review and editing, T.K. (Thachada Kotmongkol), W.S., S.K. and T.S.; visualization, W.S., C.K. and R.P.; supervision, R.P. and S.N.; project administration, S.N. and T.K. (Thachada Kotmongkol); funding acquisition, S.N., R.P. and T.K. (Thachada Kotmongkol). All authors have read and agreed to the published version of the manuscript.

Funding

This research was funded by Thailand Science Research and Innovation (TSRI) and the National Science, Research, and Innovation Fund (NSRF) via grant no. 2450857.

Institutional Review Board Statement

Not applicable.

Informed Consent Statement

Not applicable.

Data Availability Statement

Not applicable.

Acknowledgments

Ministry of Higher Education, Science, Research, and Innovation; Basic Research Fund group; and the AIO-SMART laboratory.

Conflicts of Interest

The authors declare no conflict of interest.

References

  1. Na Ranong, V.A. Guidelines for Expanding the Social Security Program to Informal Workers under Section 40 of the Social Security Act B.E. 1990; Thailand Development Research Institute: Bangkok, Thailand, 2011. [Google Scholar]
  2. Future Market Insights Inc. Thailand Tourism Market Outlook (2022–2032). Available online: https://www.futuremarketinsights.com/reports/thailand-tourism-spend-analytics-forecast?utm_source=adwords&utm_medium=ppc&utm_source=adwords&utm_medium=ppc&id=5&gclid=Cj0KCQjwgO2XBhCaARIsANrW2X3ab56iZsxacAZxVnCxWvJwdmbssT5dKASBnnfKb40EFMrJOYDxTrgaAmGbEALw_ (accessed on 12 August 2022).
  3. Summary Report of Travel Statistics in and out of Thai Border Crossings and Neighboring Countries. Available online: http://www.fad.moi.go.th/images/ngancedkumpha/meena63/satititpandean.pdf (accessed on 22 August 2022).
  4. Keckley, P.H. Medical Tourism: Consumers in Search of Value; Deloitte Center for Health Solutions: Washington, DC, USA, 2008; p. 4. [Google Scholar]
  5. Bochaton, A. Cross-border mobility and social networks: Laotians seeking medical treatment along the Thai border. Soc. Sci. Med. 2014, 124, 364–373. [Google Scholar] [CrossRef] [PubMed]
  6. Cohen, E. Medical tourism in Thailand. AU-GSB e-J. 2008, 1, 24–37. [Google Scholar]
  7. Sukjai, P.; Srirak, C. Cross-border medical tourism of tourists in Thailand’s border provinces: A case study of Laotian tourists in Nongkhai and Udon Thani Patthaphon. Kasetsart J. Soc. Sci. 2022, 43, 123–130. [Google Scholar]
  8. Narayanan, S.; Lai, Y.W. Medical Tourism in Malaysia: Growth, Contributions and Challenges. Thail. World Econ. 2021, 39, 1–22. [Google Scholar]
  9. Miravet, D.; Domènech, A.; Gutiérrez, A. What prompts tourists to become public transportation users at their destination? The case of a Mediterranean city. Travel Behav. Soc. 2021, 24, 10–21. [Google Scholar] [CrossRef]
  10. Hall, D.R. Conceptualising tourism transport: Inequality and externality issues. J. Transp. Geogr. 1999, 7, 181–188. [Google Scholar] [CrossRef]
  11. Le-Klähn, D.-T.; Roosen, J.; Gerike, R.; Hall, C.M. Factors affecting tourists’ public transport use and areas visited at destinations. Tour. Geogr. 2015, 17, 738–757. [Google Scholar] [CrossRef]
  12. Indochina Tours. Category Archives: Indochina Map. Maps of Vietnam, Cambodia & Laos. Available online: www.indochaina.tour/WP-content/upload/2016/10/indochaina-Map.jpg (accessed on 22 August 2022).
  13. Masiero, L.; Hrankai, R. Modeling tourist accessibility to peripheral attractions. Ann. Tour. Res. 2022, 92, 103343. [Google Scholar] [CrossRef]
  14. Le-Klähn, D.-T.; Hall, C.M. Tourist use of public transport at destinations—A review. Curr. Issues Tour. 2015, 18, 785–803. [Google Scholar] [CrossRef]
  15. Masiero, L.; Hrankai, R.; Zoltan, J. The role of intermodal transport on urban tourist mobility in peripheral areas of Hong Kong. Res. Transp. Bus. Manag. 2022; in press. [Google Scholar] [CrossRef]
  16. Su, X.; Spierings, B.; Hooimeijer, P. Different urban settings affect multi-dimensional tourist-resident interactions. Tour. Geogr. 2020, 24, 1–22. [Google Scholar] [CrossRef]
  17. Paulino, I.; Lozano, S.; Prats, L. Identifying tourism destinations from tourists’ travel patterns. J. Destin. Mark. Manag. 2021, 19, 100508. [Google Scholar] [CrossRef]
  18. Duval, D.T. Tourism and Transport: Modes, Networks and Flows; Channel View Publications: Frankfurt, Germany, 2007. [Google Scholar]
  19. Gronau, W. On the Move: Emerging Fields of Transport Research in Urban Tourism. Tourism in the City; Springer: Cham, Switzerland, 2017. [Google Scholar]
  20. Grinberger, A.Y.; Shoval, N. Spatiotemporal Contingencies in Tourists’ Intradiurnal Mobility Patterns. J. Travel Res. 2019, 58, 512–530. [Google Scholar] [CrossRef]
  21. Prideaux, B. Building visitor attractions in peripheral areas—Can uniqueness overcome isolation to produce viability? Int. J. Tour. Res. 2002, 4, 379–389. [Google Scholar] [CrossRef]
  22. Neutens, T.; Schwanen, T.; Witlox, F. The Prism of Everyday Life: Towards a New Research Agenda for Time Geography. Transp. Rev. 2011, 31, 25–47. [Google Scholar] [CrossRef]
  23. Lue, C.-C.; Crompton, J.L.; Fesenmaier, D.R. Conceptualization of multi-destination pleasure trips. Ann. Tour. Res. 1993, 20, 289–301. [Google Scholar] [CrossRef]
  24. Park, S.; Xu, Y.; Jiang, L.; Chen, Z.; Huang, S. Spatial structures of tourism destinations: A trajectory data mining approach leveraging mobile big data. Ann. Tour. Res. 2020, 84, 102973. [Google Scholar] [CrossRef]
  25. Świtała, M.; Cichosz, M.; Trzęsiok, J. How to achieve customer satisfaction? Perspective of logistics outsourcing performance. LogForum 2019, 15, 39–51. [Google Scholar] [CrossRef]
  26. Liu, Z.; Shi, Y.; Yang, B. Open Innovation in Times of Crisis: An Overview of the Healthcare Sector in Response to the COVID-19 Pandemic. J. Open Innov. Technol. Mark. Complex. 2022, 8, 21. [Google Scholar] [CrossRef]
  27. Sanchez, R.; Shibata, T. Modularity Design Rules for Architecture Development: Theory, Implementation, and Evidence from the Development of the Renault–Nissan Alliance “Common Module Family” Architecture. J. Open Innov. Technol. Mark. Complex. 2021, 7, 242. [Google Scholar] [CrossRef]
  28. Jeong, H.; Lee, S.; Shin, K. Development of Food Packaging through TRIZ and the Possibility of Open Innovation. J. Open Innov. Technol. Mark. Complex. 2021, 7, 213. [Google Scholar] [CrossRef]
  29. Díaz, M.M.; Duque, C.M. Open Innovation through Customer Satisfaction: A Logit Model to Explain Customer Recommendations in the Hotel Sector. J. Open Innov. Technol. Mark. Complex. 2021, 7, 180. [Google Scholar] [CrossRef]
  30. Egger, R.; Gula, I.; Walcher, D. Open Tourism: Open Innovation, Crowdsourcing and Co-Creation Challenging the Tourism Industry. In Tourism on the Verge; Springer: Berli, Germany, 2016; Volume 1. [Google Scholar]
  31. Watson, R.; Akselsen, S.; Monod, E.; Pitt, L. The Open Tourism Consortium: Laying the Foundations for the Future of Tourism. Eur. Manag. J. 2004, 22, 315–326. [Google Scholar] [CrossRef]
  32. lo Duca, A.; Marchetti, A. Open Data for Tourism: The Case of Tourpedia. J. Hosp. Tour. Technol. 2019, 10, 351–368. [Google Scholar] [CrossRef]
  33. Celdrán-Bernabeu, M.A.; Mazón, J.N.; Sánchez, D.G. Open Data and Tourism. Implications for Tourism Management in Smart Cities and Smart Tourism Destinationss. Investig. Tur. 2018, 49–78. [Google Scholar] [CrossRef]
  34. Yochum, P.; Chang, L.; Gu, T.; Zhu, M. Linked Open Data in Location-Based Recommendation System on Tourism Domain: A Survey. IEEE Access 2020, 8, 16409–16439. [Google Scholar] [CrossRef]
  35. Iglesias-Sánchez, P.P.; Correia, M.B.; Jambrino-Maldonado, C. Challenges of Open Innovation in the Tourism Sector. Tour. Plan. Dev. 2019, 16, 22–42. [Google Scholar] [CrossRef]
  36. Hermawati, A.; Nurwati, N.; Suhana, S.; Machmuddah, Z.; Ali, S. Satisfaction, Hr, and Open Innovation in Tourism Sector. J. Open Innov. Technol. Mark. Complex. 2020, 6, 182. [Google Scholar] [CrossRef]
  37. Chamnongphol, K. Appropriate Sample Size. Available online: https://sites.google.com/site/bb24049/khnad-khxng-klum-tawxyang-thi-hemaa-sm (accessed on 22 August 2022).
  38. Junior, P.N.A.; Melo, I.C.; Branco, J.E.H.; Bartholomeu, D.B.; Caixeta-Filho, J.V. Which Green Transport Corridors (GTC) Are Efficient? A Dual-Step Approach Using Network Equilibrium Model (NEM) and Data Envelopment Analysis (DEA). J. Mar. Sci. Eng. 2021, 9, 247. [Google Scholar] [CrossRef]
  39. Dechampai, D.; Tanwanichkul, L.; Sethanan, K.; Pitakaso, P. A differential evolution algorithm for the capacitated VRP with flexibility of mixing pickup and delivery services and the maximum duration of a route in poultry industry. J. Intell. Manuf. 2015, 28, 1357–1376. [Google Scholar] [CrossRef]
  40. Mitchell, M. An Introduction to Genetic Algorithms; A Bradford Book; The MIT Press: Cambridge, MA, USA; London, UK, 1998. [Google Scholar]
  41. Thoucharee, S.; Pitakaso, R.; Phannikul, T. Application of Modified Differential Evolution for the supply chain management of rice in the lower North-Eastern Region of Thailand. Songklanakarin J. Sci. Technol. 2017, 3, 609–617. [Google Scholar]
  42. Akararungruangkul, R.; Chokanat, P.; Pitakaso, R.; Supakdee, K.; Sethanan, K. Solving Vehicle Routing Problem for Maintaining and Repairing Medical Equipment Using Differential Evolution Algorithm: A Case Study in UbonRatchathani Public Health Office. Int. J. Appl. Eng. 2018, 13, 8035–8045. [Google Scholar]
  43. Park, C.; Park, J.; Choi, S. Emerging clean transportation technologies and distribution of reduced greenhouse gas emissions in Southern California. J. Open Innov. Technol. Mark. Complex. 2017, 3, 8. [Google Scholar] [CrossRef]
  44. Amry, Y.; Elbouchikhi, E.; Le Gall, F.; Ghogho, M.; El Hani, S. Electric Vehicle Traction Drives and Charging Station Power Electronics: Current Status and Challenges. Energies 2022, 15, 6037. [Google Scholar] [CrossRef]
  45. Ghobadpour, A.; Monsalve, G.; Cardenas, A.; Mousazadeh, H. Off-Road Electric Vehicles and Autonomous Robots in Agricultural Sector: Trends, Challenges, and Opportunities. Vehicles 2022, 4, 843–864. [Google Scholar] [CrossRef]
  46. Kumar, P.; Nikolovski, S.; Ali, I.; Thomas, M.S.; Ahuja, H. Impact of Electric Vehicles on Energy Efficiency with Energy Boosters in Coordination for Sustainable Energy in Smart Cities. Processes 2022, 10, 1593. [Google Scholar] [CrossRef]
  47. Sethanan, K.; Pitakaso, R. Differential Evolution Algorithms for Scheduling Raw Milk Transportation. Comput Electron. Agric. 2016, 121, 245–259. [Google Scholar] [CrossRef]
  48. Chen, J.; Wang, S.; Liu, Z.; Wang, W. Design of Suburban Bus Route for Airport Access. Transp. A Transp. Sci. 2017, 13, 568–589. [Google Scholar] [CrossRef]
  49. Gong, M.; Hu, Y.; Chen, Z.; Li, X. Transfer-Based Customized Modular Bus System Design with Passenger-Route Assignment Optimization. Transp. Res. E Logist. Transp. Rev. 2021, 153, 102422. [Google Scholar] [CrossRef]
  50. Guideubon. Ubon Ruamjai Offers a Free Trial Ride!! Smart Bus Bus Station—Ubon Airport. Available online: http://www.guideubon.com/2.0/pr-ubon/smart-bus-ubon/ (accessed on 22 August 2022).
  51. Ismail, A.; Yunan, Y.M. Service quality as a predictor of customer satisfaction and customer loyalty. LogForum 2016, 12, 269–283. [Google Scholar] [CrossRef]
  52. Ochocka, J. Mobile technologies in logistic customer service as a tool for winning customers’ satisfaction. LogForum 2019, 15, 403–411. [Google Scholar] [CrossRef]
  53. Patella, S.M.; Grazieschi, G.; Gatta, V.; Marcucci, E.; Carrese, S. The Adoption of Green Vehicles in Last Mile Logistics: A Systematic Review. Sustainability 2021, 13, 6. [Google Scholar] [CrossRef]
  54. Chudy-Laskowska, K. Factors influencing the decision to implement an RFID system. LogForum 2018, 14, 221–233. [Google Scholar] [CrossRef]
  55. Erceg, A.; Sekuloska, D.J. E-logistics and e-SCM: How to increase competitiveness. LogForum 2019, 15, 155–169. [Google Scholar] [CrossRef]
  56. Sun, Z.; Zhou, K.; Yang, X.; Peng, X.; Song, R. Optimization Method of Customized Shuttle Bus Lines under Random Condition. Algorithms 2021, 14, 52. [Google Scholar] [CrossRef]
  57. Majchrzak-Lepczyk, J.; Bober, B. Selected aspects of the logistics network of public hospitals in the competitive market of health services. LogForum 2016, 12, 247–267. [Google Scholar] [CrossRef]
  58. Duangsrikaew, B.; Mongkoltanatas, J.; Benyajati, C.; Karin, P.; Hanamura, K. Battery Sizing for Electric Vehicles Based on Real Driving Patterns in Thailand. World Electr. Veh. J. 2019, 10, 43. [Google Scholar] [CrossRef]
  59. Kim, H.; Hartmann, N.; Zeller, M.; Luise, R.; Soylu, T. Comparative TCO Analysis of Battery Electric and Hydrogen Fuel Cell Buses for Public Transport System in Small to Midsize Cities. Energies 2021, 14, 4384. [Google Scholar] [CrossRef]
  60. Iclodean, C.; Cordos, N.; Varga, B.O. Autonomous Shuttle Bus for Public Transportation: A Review. Energies 2020, 13, 2917. [Google Scholar] [CrossRef]
  61. Jang, I.-G.; Lee, C.-S.; Hwang, S.-H. Energy Optimization of Electric Vehicles by Distributing Driving Power Considering System State Changes. Energies 2021, 14, 594. [Google Scholar] [CrossRef]
  62. Hashmi, S.D.; Akram, S. Impact of Green Supply Chain Management on Financial and Environmental Performance: Mediating Role of Operational Performance and the Moderating Role of External Pressures. LogForum 2021, 17, 359–371. [Google Scholar]
  63. Islam, M.A.; Gajpal, Y. Optimization of Conventional and Green Vehicles Composition under Carbon Emission Cap. Sustainability 2021, 13, 6940. [Google Scholar] [CrossRef]
  64. Yigitcanlar, T.; Kamruzzaman, M.; Buys, L.; Ioppolo, G.; Sabatini-Marques, J.; da Costa, E.M.; Yun, J.H.J. Understanding ‘Smart Cities’: Intertwining Development Drivers with Desired Outcomes in a Multidimensional Framework. Cities 2018, 81, 145–160. [Google Scholar] [CrossRef]
  65. Yun, J.H.J.; Won, D.K.; Jeong, E.S.; Park, K.B.; Yang, J.H.; Park, J.Y. The Relationship between Technology, Business Model, and Market in Autonomous Car and Intelligent Robot Industries. Technol. Forecast. Soc. Change 2016, 103, 142–155. [Google Scholar] [CrossRef]
  66. Yun, J.H.J.; Won, D.K.; Park, K.B.; Jeong, E.S.; Zhao, X. The Role of a Business Model in Market Growth: The Difference between the Converted Industry and the Emerging Industry. Technol. Forecast Soc. Change 2019, 146, 534–562. [Google Scholar] [CrossRef]
  67. Yun, J.H.J.; Won, D.K.; Park, K.B. Entrepreneurial Cyclical Dynamics of Open Innovation. J. Evol. Econ. 2018, 28, 1151–1174. [Google Scholar] [CrossRef]
  68. Mazzocchi, S. Open Innovation: The New Imperative for Creating and Profiting from Technology. Innovation 2004, 6, 474. [Google Scholar] [CrossRef]
  69. Chesbrough, H.; Brunswicker, S. A Fad or a Phenomenon? The Adoption of Open Innovation Practices in Large Firms. Res. Technol. Manag. 2014, 57. [Google Scholar] [CrossRef]
  70. Chesbrough, H.W. Open Business Models: How to Thrive in the New Innovation Landscape (Hardcover), 1st ed.; Harvard Business School Press Books: Brighton, MA, USA, 2006. [Google Scholar]
  71. Mowery, D.C. Plus ca Change: Industrial R&D in the “Third Industrial Revolution”. Ind. Corp. Change 2009, 18, 1–50. [Google Scholar] [CrossRef]
  72. Yun, J.H.J.; Won, D.K.; Park, K. Dynamics from Open Innovation to Evolutionary Change. J. Open Innov. Technol. Mark. Complex. 2016, 2, 7. [Google Scholar] [CrossRef]
  73. Wu, L.; Sun, L.; Chang, Q.; Zhang, D.; Qi, P. How Do Digitalization Capabilities Enable Open Innovation in Manufacturing Enterprises? A Multiple Case Study Based on Resource Integration Perspective. Technol. Forecast. Soc. Change 2022, 184, 122019. [Google Scholar] [CrossRef]
  74. Azhar Mohd Harif, M.A.; Nawaz, M.; Hameed, W.U. The Role of Open Innovation, Hotel Service Quality and Marketing Strategy in Hotel Business Performance. Heliyon 2022, 8, e10441. [Google Scholar] [CrossRef] [PubMed]
  75. Abhari, K.; McGuckin, S. Limiting Factors of Open Innovation Organizations: A Case of Social Product Development and Research Agenda. Technovation 2022, 102526. [Google Scholar] [CrossRef]
  76. D’Aveni, R.A. Beating the Commodity Trap: How to Maximize Your Competitive Position and Increase Your Pricing Powe; Harvard Business School Press Books: Brighton, MA, USA, 2010. [Google Scholar]
  77. Yun, J.H.J.; Ahn, H.J.; Lee, D.S.; Park, K.B.; Zhao, X. Inter-Rationality; Modeling of Bounded Rationality in Open Innovation Dynamics. Technol. Forecast. Soc. Change 2022, 184, 122015. [Google Scholar] [CrossRef]
  78. Teece, D.J.; Pisano, G.; Shuen, A. Dynamic Capabilities and Strategic Management. Strateg. Manag. J. 1997, 18, 509–533. [Google Scholar] [CrossRef]
  79. Shuen, A.A. Technology Sourcing and Learning Strategies in the Semiconductor Industry; Unpublish Dissertation; University of California, Berkeley: Berkeley, CA, USA, 1994. [Google Scholar]
  80. Coase, R.H. The Nature of the Firm, Economica. New Series 1937, 4, 386–405. [Google Scholar] [CrossRef]
  81. Williamson, O.E. Strategizing, Economizing, and Economic Organization. Strateg. Manag. J. 1991, 12, 75–94. [Google Scholar] [CrossRef]
  82. Kogut, B. Joint Ventures: Theoretical and Empirical Perspectives. Strateg. Manag. J. 1988, 9, 319–332. [Google Scholar] [CrossRef]
  83. Jacobides, M.G.; Winter, S.G. The Co-Evolution of Capabilities and Transaction Costs: Explaining the Institutional Structure of Production. Strateg. Manag. J. 2005, 26, 395–413. [Google Scholar] [CrossRef]
  84. Bogers, M.; Chesbrough, H.; Moedas, C. Open Innovation: Research, Practices, and Policies. Calif. Manag. Rev. 2018, 60, 5–16. [Google Scholar] [CrossRef]
  85. Audretsch, B.D.; Belitski, M. The Limits to Open Innovation and Its Impact on Innovation Performance. Technovation 2022, 102519. [Google Scholar] [CrossRef]
  86. Jaffe, A.B. Characterizing the “Technological Position” of Firms, with Application to Quantifying Technological Opportunity and Research Spillovers. Res. Policy 1989, 18, 87–97. [Google Scholar] [CrossRef]
Figure 1. Details of road transport from Ubon Ratchathani to Loas and Cambodia borders [12].
Joitmc 08 00173 g001
Figure 2. Conceptual framework for the smart public bus system (SPBS).
Joitmc 08 00173 g002
Figure 3. The 70 locations plotted to form the bus route.
Joitmc 08 00173 g003
Figure 4. Framework of the bus routing problem to support medical tourists.
Joitmc 08 00173 g004
Figure 5. Example of the K-RM method.
Joitmc 08 00173 g005
Figure 6. The travel routes of the buses.
Joitmc 08 00173 g006
Figure 7. Framework of the smart public bus system (SPBS).
Joitmc 08 00173 g007
Figure 8. Example of user interface in the smart public bus system.
Joitmc 08 00173 g008
Table 1. The contributions of the previous studies compared with the proposed methods.
Relate LiteraturesVTPACPTPSTDAARGEOHEUDMOUTBSMTOPN
[13]
[14]
[15]
[16]
[17]
[18]
[19]
[20]
[21]
[22]
[23]
[24]
[25]
[26]
[27]
[28]
[29]
This study
Table 2. Demographic of the people who answered the questionnaires.
DetailNumberPercent
Gender
Male22857.00
Female16842.00
Not specified41.00
Age
Below 25 y10325.80
25–39 y21854.50
Over 40 y7919.80
Continent of origin
Asia29874.50
America348.50
Europe389.50
Australia112.80
Africa194.80
Occupation
Student8421.00
Government Employee10025.00
Company Employee9423.50
Self-Employed8320.80
Unemployed153.80
Others246.00
Table 3. Details of the required medical services.
Detail of the Medical ServiceNumberPercent
Annual health check up14637.00%
Common disease treatment26165.00%
Specified disease treatment5714.00%
Chronic disease318.00%
Others11228.00%
Table 4. Reasons for tourists to not use public transportation.
ReasonPercent
Inconvenient10%
Public transportation system does not cover all areas30%
Number of public buses is insufficient15%
Long wait time for the bus30%
Condition of the bus is not suitable for the temperature15.5%
Total100%
Table 5. Tourists’ suggestions as to how to make public transportation better.
How to Improve the Public TransportPercent
Increase public transport services to cover more locations45%
Increase the number of public vehicles on every bus route35%
Increase the number of air-conditioned buses on all routes10%
Increase the number of air-conditioned buses on sightseeing routes around local attractions10%
Total100%
Table 6. Top 20 most preferred medical centers in Ubon Ratchathani.
Medical Center NamePercent Preference
WIND Clinic97.65%
Ubonrak Thonburi Hospital94.63%
Smile Room Dental Clinic89.99%
Sunpasittiprasong Hospital87.44%
Chiwamitra Cancer Hospital87.07%
Rajavejubon Hospital86.70%
Prin Hospital Ubonratchathani85.07%
V clinics Ubon81.43%
Skin2U Aesthetic Clinic81.13%
The Clinic79.42%
Ubon Ratchathani Cancer Hospital79.18%
Sunpasitthiprasong Children Hospital78.60%
Fort Sunpasitthiprasong Hospital75.39%
Dental Space75.06%
Ekachon Romklao Hospital70.24%
The 50th Anniversary Mahavajiralongkorn Hospital61.41%
Your Smile Dental Clinics58.59%
Warin chamrap Hospital54.74%
Ubon Ratchathani University Hospital38.84%
Prasrimahapol Hospital31.95%
Table 7. Top 20 hotels preferred by the travelers, obtained from the questionnaire.
Hotel NamePreferable Score
V Hotel Ubon Ratchathani96.51%
Arista hotel95.68%
Velawarin Hotel94.55%
Yuu Hotel Ubon Ratchathani90.67%
Moon Fox Café Inn & Art Gallery85.51%
Luck Esan Loft—Hostel84.93%
De’ Proud Hotel83.31%
Baan Suan Khun Ta and Golf Resort83.16%
Excella Hotel81.33%
The Bliss Ubon81.29%
168 Studio Hotel Ubon Ratchathani77.25%
Rapeepan Ville Hotel76.96%
Sunee Grand Hotel and Convention Center74.67%
U Duay Gan Garden Home72.11%
Pen Ta Hug Hotel70.35%
Laithong Hotel68.84%
Nartsiri Residence68.17%
Tohsang City Hotel61.87%
Rapeepan Ville Hotel61.39%
Table 8. Top 30 attractions for travelers, obtained from the questionnaire.
Attractions NamePreferable Score
Wat Phra That Nong Bua95.95%
Central Plaza Ubon Ratchathani92.41%
Wat Thung Sri Muang87.81%
Lak Muang (City Pillar Shrine)87.22%
Rachabut Night Market83.73%
Talad Yai Morning Market76.75%
Ubon Zoo76.71%
Hat Wat Tai Beach75.98%
Wat Pah Nanachat73.66%
Ubonvej Thai Massage68.52%
Ubon Ratchathani Cultural Center66.57%
Wat Su Phatthanaram Worawihan65.33%
Wat Maha Wanaram63.05%
Wat Thung Si Muang Temple62.98%
Hat Salung62.72%
Ubon Ratchathani Cultural Center60.08%
Country of Arts (3D Gallery)56.42%
Ubon Ratchathani National Museum55.53%
Thung Si Mueang52.63%
Huai Muang49.18%
Wat Burapa Temple46.15%
Aroma in Zen Spa44.50%
Wat Saprasansuk42.56%
Wat Ban Na Muang41.10%
Wat Loung39.93%
Wat Nong Pah Pong34.75%
Mae Praniramol Church32.00%
Garden House Thai Massage30.49%
Table 9. Five randomly generated vectors with the size of 1 × 17.
Position1234567891011121314151617
VectorH1H2H3H4A1A2A3A4A5D1D2D3D4D5B1B2B3
10.950.070.180.270.360.390.300.430.120.540.850.660.420.130.030.200.37
20.970.220.740.980.870.380.040.410.140.710.330.120.430.700.820.210.56
30.500.390.710.210.590.120.010.190.220.860.280.090.560.220.290.890.10
40.970.430.780.760.040.250.220.920.420.490.010.020.800.120.640.630.75
50.010.780.410.180.580.340.470.320.890.430.440.990.470.400.310.690.03
Table 10. Results of step one (List A).
Before SortH1H2H3H4A1A2A3A4A5D1D2D3D4D5B1B2B3
Value0.950.070.180.270.360.390.30.430.120.540.850.660.420.130.030.20.37
After SortB1H2A5D5H3B2H4A3A1B3A2D4A4D1D3D2H1
Value0.030.070.120.130.180.20.270.30.360.370.390.420.430.540.660.850.95
Table 11. Result of the assignment step (the traveling time of the buses is limited to 30 min).
Bus NumberStart FromDestination AssignedLast TerminalTotal Distance
(km)
Total Traveling Time
(min)
1Air portB1-H4-A2-D2-D5Air port21.524
2Air portH2-B2-D4-H1-H3Air port22.123
3Air portA5-A3-A4-B1-D2-A1Air port27.328
4Air portD5-A1-D1-H2-H4-A2Air port28.529
5Air portH3-B3-D3-A5-A3-D4Air port25.127
Table 12. The bus route plan.
Bus NumberStart FromBust Stop NumberLast TerminalTotal Distance
(km)
Total Traveling Time
(min)
1Air portD14, H17, D23, A17, A13, A1, H5, H18, H1, D4Air port4452.8
2Air portD14, A10, D12, H11, D19, H12, D27Air port7589.8
3Air portD14, H17, A2, D21, A11, A6, H4.A12, A16, D13Air port4655.2
4Air portD14, D23, H17, D1, D6, A17Air port5161.2
5Air portD14, A10, D12, H11, H12, D27Air port5262.4
Total268.0321.4
Table 13. Compared results of the genetic algorithm and the differential evolution algorithm.
MethodsTotal Distance (km)Total Traveling Time (min)
DE268.0321.4
GA284.0346.1
% different5.637.14
Table 14. Comparison of the current traveling plan and the proposed bus routes.
MethodsTotal Distance (km)Total Traveling Time (min)Total Number of Hospitals the Buses Passed
(Locations)
Total Number of Hotels the Buses Passed
(Locations)
Total Number of Destinations the Buses Passed
New routes (DE)268.0321.4203542
Current routes (CR)224.1280.73128
Lingo V.16 (LI)296.8358.8182937
% different (DE-CR)19.5914.50566.67191.67425.00
% different (DE-LI)9.7010.4211.1120.6913.51
Table 15. Tourists’ preference scores for the new bus routes designed.
DetailYes (%)No (%)
The new bus routes—do you like them?99.10.9
Do the buses go by where you want to stay?1000
Do the buses pass by the hospitals you like?1000
Do the busses go by the destinations you want to visit?98.51.5
Are the bus routes simple to navigate?98.21.8
Are the bus routes convenient?98.51.5
If the new routes are implemented, will you use the public buses?99.50.5
Score
How many points will you award the new routes? (full score is 100)95.6
Table 16. Details of the IOT devices used in the designed public bus system.
DevicesAim
IOT devices for the bus
Payment ReaderAutomatic ticket vending machine in the bus
Scanner Barcode 2DScans the barcode if the customer purchased their ticket online or through a ticket machine at the bus terminal
ESP32 Microcontroller boardControls the SMART bus’s operating system
GPS deviceDetermines the satellite-based bus locations (coordinates)
5G Sim Card RouterInternet router for IoT devices on the bus
Amplifier and speakerInforms the passengers of the stations and other details
IOT devices for the bus stop
Jetson Nano BoardControls the IOT equipment at the bus stop
ESP32 Microcontroller boardControls the IOT equipment at the bus stop
Automatic Ticket Vending MachineSells tickets or distributes online barcodes to the passengers
5G Sim Card RouterInternet router for IoT devices in the bus stop
Touchscreen LCD MonitorReports bus and other information
Solar Panel and BatteryStorage of solar energy for the devices in the system
Application
Mobile/Web ApplicationCheck bus status, purchase tickets online, view bus routes, rate the bus service, and notify administration
DatabaseObtain real-time information about the quality of the service and the passengers
Table 17. Details of the designed public bus system compared with the tourists’ requirements.
RequirementsSpecification of the Bus
The bus should include more hospitals and hotels.Yes
There are more buses in the medical tourism system.Yes
The bus has air conditioning.Yes
The number of sightseeing places on each bus route is increasing.Yes
The bus adheres to environmental protection.Yes
The bus service is less inconvenient.Yes
The bus tracking system is online.Yes
The arrival time of the bus is known.Yes
The traveling route is informed.Yes
Publisher’s Note: MDPI stays neutral with regard to jurisdictional claims in published maps and institutional affiliations.

