Digital Marketing Utilization Index for Evaluating and Improving Company Digital Marketing Capability


Abstract
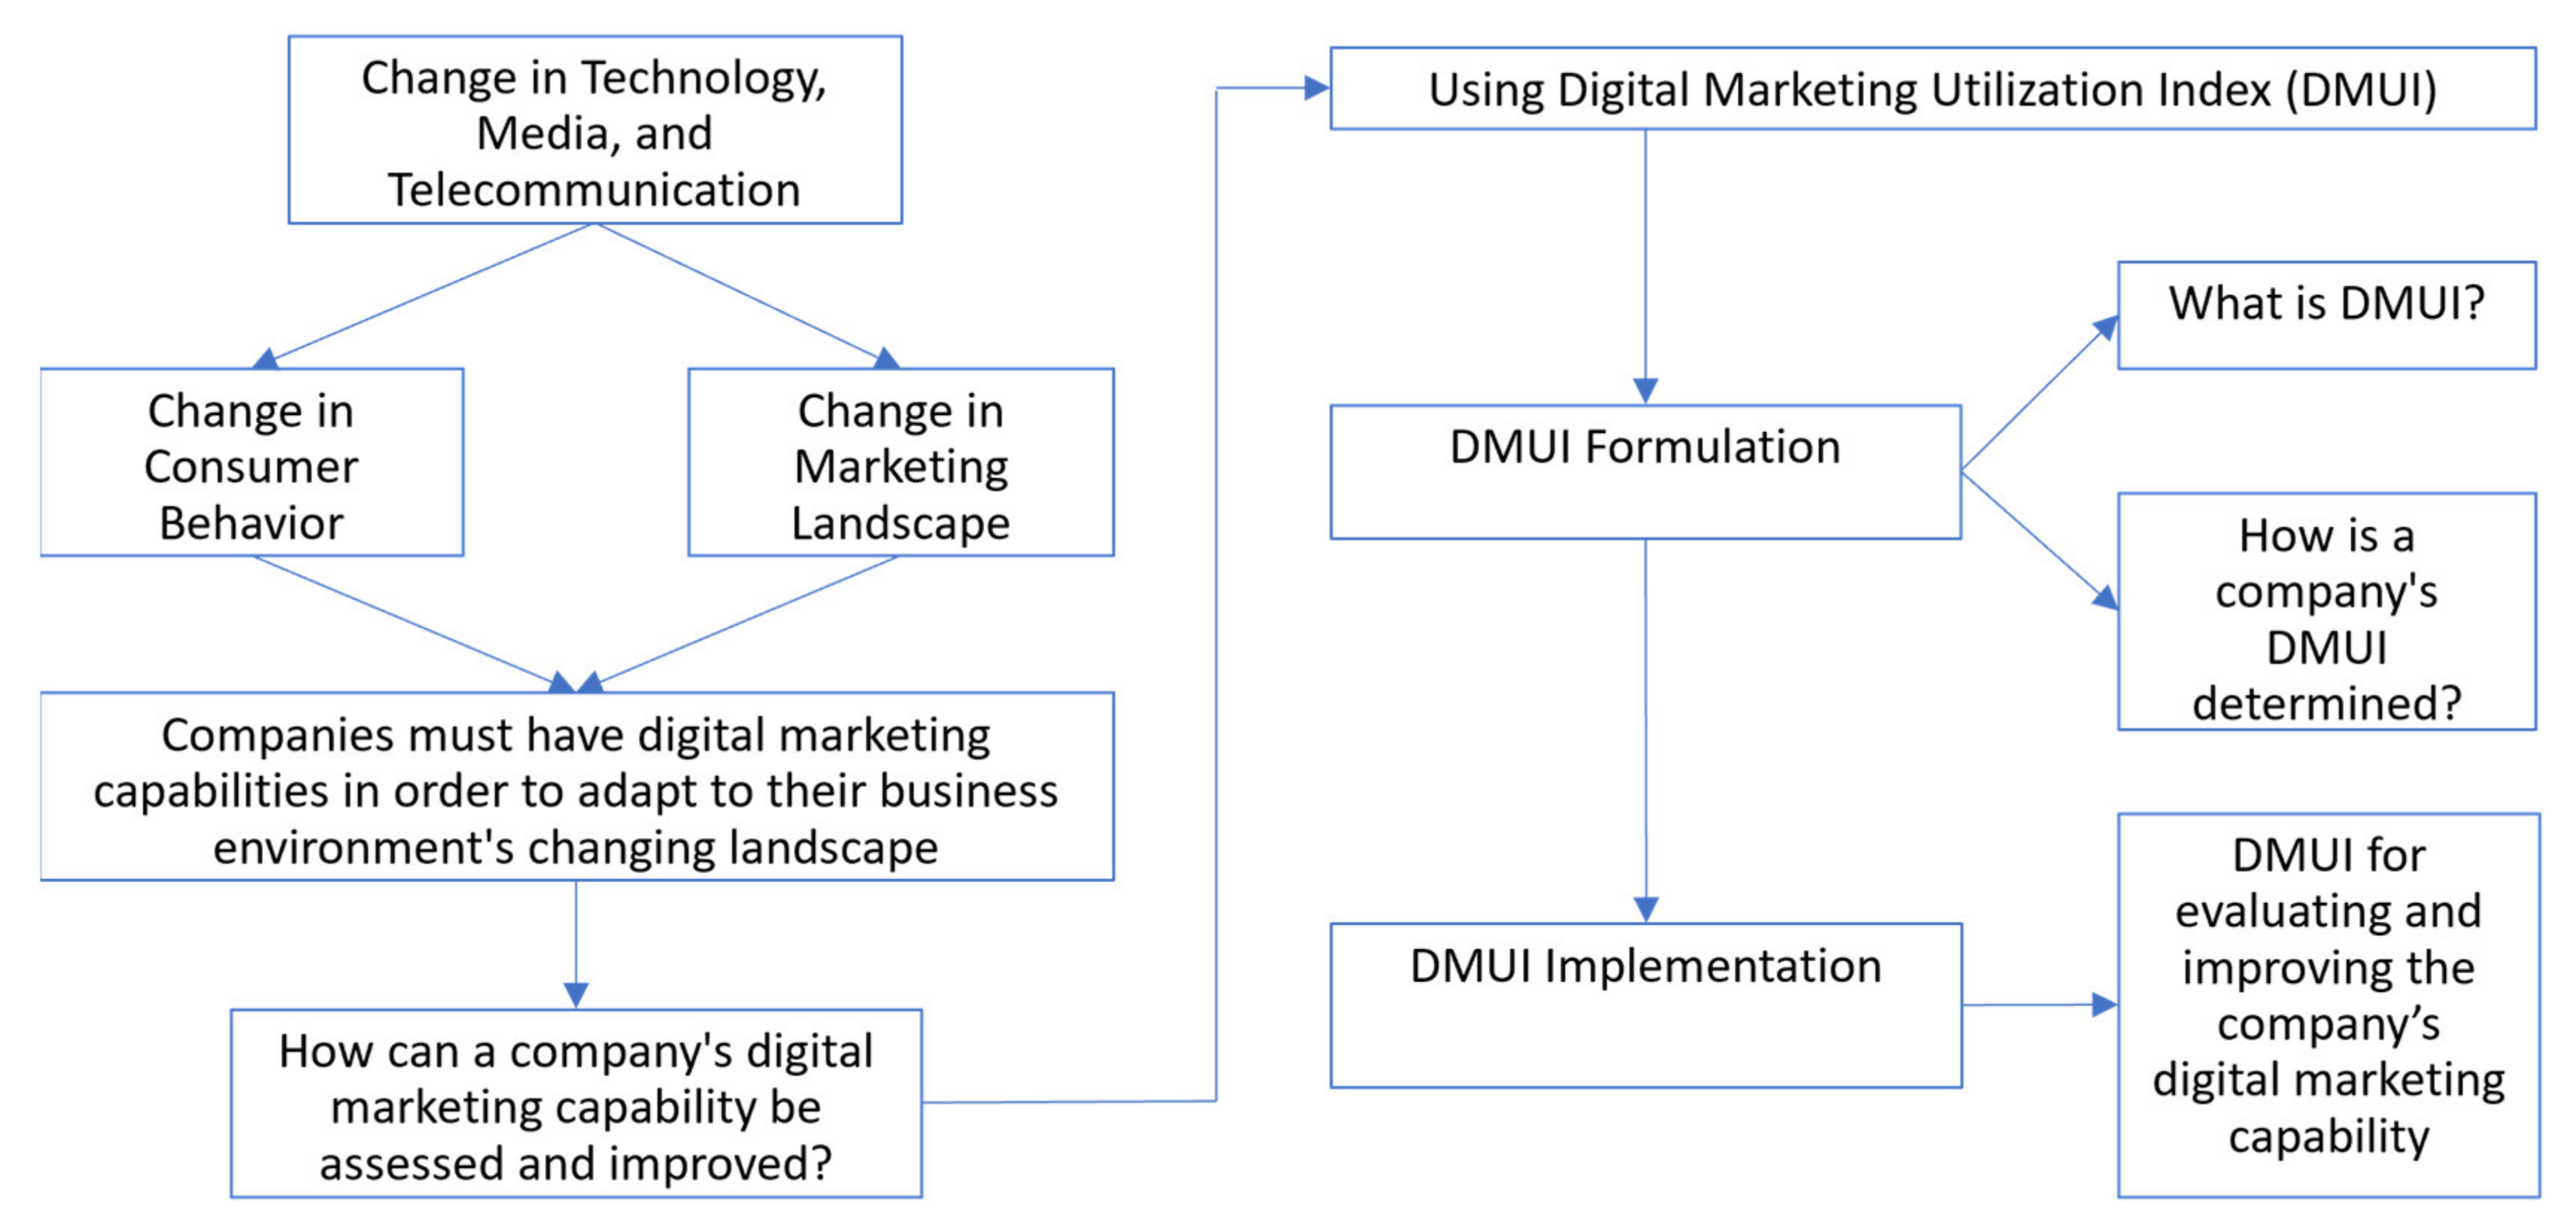
:1. Introduction
2. Background and Related Studies
2.1. Digital Marketing Adoption
2.2. Digital Transformation
2.3. Innovation Ecosystem Readiness
2.4. Digital Marketing Capability
2.5. Digital Capability Index
3. Materials and Methods
3.1. Data Collection and Sampling
3.2. Statistical Analysis
4. Results
4.1. Evaluation of Reflective Measurement Model
4.2. Evaluation of Structural Model
4.3. DMUI Formulation
4.3.1. Innovation Ecosystem Readiness Index
4.3.2. Company Digital Transformation Index
4.3.3. Company Digital Marketing Adoption Index
4.4. DMUI Implementation (Case Study from Companies in Food and Beverage, Property, and Online Product Industry Sectors)
5. Discussion
Discussion on Empirical Findings
6. Contribution
6.1. Theoretical Contribution
6.2. Managerial Contribution
- Companies must prioritize digital marketing in their organizational strategies. As a result, businesses must align their digital strategies with their organizational and marketing strategies. Companies must establish organizational goals, marketing goals, and digital marketing goals in order to properly plan digital marketing budgeting to achieve return on investment.
- Companies must create an organizational structure to support digital marketing operations. As a result, the company may think about changing or creating a new structure by integrating the marketing team, information technology team, and other teams, or by utilizing cross-functional teams. Furthermore, if the company’s internal resources are insufficient, it can consider outsourcing options.
- Companies must create processes, procedures, and/or information systems to support digital marketing. As a result, they must have systems in place to manage the quality of digital marketing content, manage customer information, plan and report on digital marketing effectiveness, and have integrated technology solutions from both internal and external sources.
- Companies must identify the characteristics of their human resources, which tend to be marketing and information technology savvy. As a result, the company must improve the skills of the digital marketing team through employee development and training in order to increase employee knowledge and skills about digital marketing and increase management involvement in digital marketing.
- Companies must have an organizational style and culture that guides collective behavior by key managers in achieving organizational goals and digital marketing goals, so that digital marketing can become a common goal to be achieved by the company. This culture must be owned by the company in order to align internal and external perceptions of various goals.
7. Conclusions
Author Contributions
Funding
Institutional Review Board Statement
Informed Consent Statement
Data Availability Statement
Conflicts of Interest
References
- Datareportal. Digital 2021: Indonesia. Available online: http://datareportal.com/reports/digital-2021-indonesia (accessed on 31 January 2022).
- Nielsen. Nielsen CMO Report 2018: The Roadmap for Marketers Who Lead. Available online: https://www.nielsen.com/us/en/insights/report/2018/cmo-report-2018-digital-media-roi-measurement-omnichannel-marketing-technology/ (accessed on 12 February 2020).
- Chaffey, D.; Chadwick, F. Digital Marketing: Strategy, Implementation and Practice, 6th ed.; Pearson: London, UK, 2016. [Google Scholar]
- Trainor, K.J.; Rapp, A.; Beitelspacher, L.S.; Schillewaert, N. Integrating information technology and marketing: An examination of the drivers and outcomes of e-Marketing capability. Ind. Mark. Manag. 2010, 40, 162–174. [Google Scholar] [CrossRef]
- BCG. The Dividends of Digital Marketing Maturity. 2019. Available online: https://image-src.bcg.com/Images/BCG-Dividends-Digital-Marketing-Maturity-Feb-2019_tcm9-214202.pdf (accessed on 20 July 2020).
- Masrianto, A.; Hartoyo, I.; Vitayala, A.; Hasabah, N. Model for Improving Digital Marketing Capabilities Based on Adoption Ecosystem Readiness and Digital Transformation. In Proceedings of the CEO International Congress, Georgia, Turkey, 19–12 August 2021. [Google Scholar]
- Yaseen, H.; Al-Adwan, A.S.; Al-Madadha, A. Digital Marketing Adoption among SMEs in Jordan: A Mixed-Method Approach. J. Theor. Appl. Inf. Technol. 2019, 97, 1396–1407. [Google Scholar]
- De Vries, L.; Gensler, S.; Leeflang, P.S.H. Effects of Traditional Advertising and Social Messages on Brand-Building Metrics and Customer Acquisition. J. Mark. 2017, 81, 1–15. [Google Scholar] [CrossRef]
- Gillpatrick, T. The Digital Transformation of Marketing: Impact on Marketing Practice & Markets. Economics 2020, 7, 139–156. [Google Scholar]
- Gibson, C. The Most Effective Digital Marketing Strategies & Approaches: A Review of Literature. Int. J. Sci. Res. Publ. 2018, 8, 12. [Google Scholar]
- Bala, M.; Verma, D. A Critical Review of Digital Marketing. Int. J. Manag. 2018, 8, 321–339. [Google Scholar]
- Srividhya, V. E-commerce as a toolkit for digital marketing trends. Int. J. Adv. Res. Ideas Innov. Technol. 2019, 5, 535–537. [Google Scholar]
- Morakanyane, R.; O’Reilly, P.; Mcavoy, J.; Grace, A. Determining Digital Transformation Success Factors. In Proceedings of the 53rd Hawaii International Conference on System Sciences, Maui, HI, USA, 7–10 January 2020; Volume 3, pp. 4356–4365. [Google Scholar]
- Vial, G. Understanding digital transformation: A review and a research agenda. J. Strateg. Inf. Syst. 2019, 28, 118–144. [Google Scholar] [CrossRef]
- Westerman, G.; Bonnet, D.; McAfee, A. Leading Digital: Turning Technology into Business Transformation; HBR Press: Boston, MA, USA, 2014. [Google Scholar]
- Doe, J.; Wetering, R.; Honyenuga, V.D.B.; Versendaal, J. Firm Technology Adoption Model (F-TAM) Among SME’S: An Interactive Eco-System Perspective. IADIS Int. J. Comput. Sci. Inf. Syst. 2018, 14, 70–91. [Google Scholar]
- Doe, J.K.; Wetering, R.V.D.; Honyenuga, B.; Versendaal, J. Toward A Firm Technology Adoption Model (F-TAM) In A Developing Country Context. 2017. Available online: http://aisel.aisnet.org/mcis2017/23 (accessed on 12 February 2020).
- Parasuraman, A. Technology Readiness Index (TRI) a multiple-item scale to measure readiness to embrace new technologies. J. Serv. Res. 2000, 2, 307–320. [Google Scholar] [CrossRef]
- Portulans Institute. Network Readiness Index (NRI). Available online: https://networkreadinessindex.org/ (accessed on 6 August 2022).
- Ayanso, A.; Chatterjee, D.; Cho, D.I. E-Government readiness index: A methodology and analysis. Gov. Inf. Q. 2011, 28, 522–532. [Google Scholar] [CrossRef]
- Cisco. Cisco Digital Readiness Index. Available online: https://www.cisco.com/c/en/us/about/csr/research-resources/digital-readiness.html (accessed on 6 August 2022).
- Kemenperin. Indonesia Industry 4.0 Readiness Index. Available online: https://sindi4.kemenperin.go.id/assets/content/INDI4.0_Full_v1.pdf (accessed on 6 August 2022).
- EY. Digital Readiness Assessment. Available online: https://digitalreadiness.ey.com/ (accessed on 6 August 2022).
- BCG. Digital Acceleration Index. Available online: https://dai.bcg.com/ (accessed on 6 August 2022).
- Smartinsight. Digital Marketing Maturity Assessment Tool. Available online: https://www.smartinsights.com/digital-marketing-strategy/digital-marketing-maturity-assessment/ (accessed on 6 August 2022).
- ISDRI. Indonesia’s SME Digital Readiness Index. Seberapa Digital Bisnis Anda? Available online: https://isdri.id/ (accessed on 6 August 2022).
- Statista. Revenue of TV, Radio & Multimedia Segment in Indonesia from 2016 to 2025, by Segment (in Million U.S. Dollars). Available online: https://www.statista.com/forecasts/1256572/indonesia-tv-radio-and-multimedia-device-revenue (accessed on 6 August 2022).
- Forbes. TV And Digital Advertising Need to Stop Fighting and Admit They Need Each Other. Available online: https://www.forbes.com/sites/forbesagencycouncil/2019/01/31/tv-and-digital-advertising-need-to-stop-fighting-and-admit-they-need-each-other/ (accessed on 6 August 2022).
- Muraiwa, S. Voluntary sampling design. Int. J. Adv. Res. Manag. Soc. Sci. 2015, 4, 185–200. [Google Scholar]
- Smarpls. When to Use PLS-SEM (and When Not). Available online: https://www.smartpls.com/documentation/choosing-pls-sem/more-insights-on-when-to-use-pls-sem-and-when-not/ (accessed on 6 August 2022).
- Hair, J.F.; Hult, J.T.M.; Ringle, C.M.; Sarstedt, M. A Primer on Partial Least Square Structural Equation Modeling (PLS-SEM), 2nd ed.; SAGE Publications: London, UK, 2017. [Google Scholar]
- Cohen, J. A Power Primer. Quant. Methods Psychol. 1992, 112, 155–159. [Google Scholar] [CrossRef]
- Teece, D.J.; Pisano, G.; Shuen, A. Dynamic Capabilities and Strategic Management. Knowl. Strategy 1997, 18, 509–533. [Google Scholar] [CrossRef]
- Tiago, M.T.P.M.B.; Veríssimo, J.M.C. Digital marketing and social media: Why bother? Bus. Horiz. 2014, 57, 703–708. [Google Scholar] [CrossRef]
- United Nation. Max-Min Procedure to Convert Indicators into Indices. Available online: https://www.un.org/development/desa/dpad/wp-content/uploads/sites/45/max-min.pdf (accessed on 2 February 2002).
- Abi, J.; Arief, M.T.S. Examining the relationship between transformational leadership and dynamic capability to the adoption of digital marketing in consumer shopping good firms. Int. J. Econ. Manag. 2017, 11, 487–504. [Google Scholar]
- Theodosiou, M.; Kehagias, J.; Katsikea, E. Strategic orientations, marketing capabilities and firm performance: An empirical investigation in the context of frontline managers in service organizations. Ind. Mark. Manag. 2012, 41, 1058–1070. [Google Scholar] [CrossRef]
- El-Gohary, H.; Eid, R. DMA Model: Understanding Digital Marketing Adoption and Implementation by Islamic Tourism Organizations. Tour. Anal. 2012, 17, 523–532. [Google Scholar] [CrossRef]
- Hunt, S.D.; Morgan, R.M. The resource-advantage theory of competition: Dynamics, path dependencies, and evolutionary dimensions. J. Mark. 1996, 60, 107–114. [Google Scholar] [CrossRef]
- Desiana, P.M.; Ma’arif, M.S.; Puspitawati, H.; Rachmawati, R.; Prijadi, R.; Najib, M. Strategy for Sustainability of Social En-terprise in Indonesia: A Structural Equation Modeling Approach. Sustainability 2022, 14, 1383. [Google Scholar] [CrossRef]


| Evaluation | Criteria | Output | Results |
|---|---|---|---|
| Step 1: Evaluation of the Reflective Measurement Model | |||
| 1. Internal consistency reliability |
| 0.89–0.905 0.915–0.921 | Supported Supported |
| 2. Convergent validity |
| 0.574–0.848 0.544–0.624 | Supported Supported |
| 3. Discriminant validity | Heterotrait-Monotrait Ratio (HTMT) < 0.90 | 0.371–0.894 | Supported |
| Step 2: Evaluation of the Structural Model | |||
| 1. Collinearity | Variance Inflation Factor (VIF) = 0.20–5 | 1.227–2.615 | Supported |
| 2. Size and significance of path coefficients | p-values < 0.05 | p-values < 0.05 | Supported |
| 3. Coefficients of Determination (R2) | Weak = 0.25–0.50, moderate = 0.5–0.75, strong > 0.75 | 0.185–0.695 | Weak and moderate category |
| Step 3: Model fit Evaluation | |||
| Standardized root mean square residual (SRMR) | SRMR < 0.08 | 0.067 | Supported |
| Items and Constructs 1 | Outer Loading | T Statistics | p Values |
|---|---|---|---|
| Innovation Ecosystem Readiness | |||
| Employees of our company find it simple to implement digital marketing innovations (Perceived ease of use). | 0.779 | 24.145 | 0.000 |
| Digital marketing innovations benefit our employees’ work (Perceived usefulness). | 0.815 | 27.153 | 0.000 |
| Our company is prepared to implement digital marketing innovation (Organizational readiness). | 0.842 | 38.648 | 0.000 |
| Our company’s management is actively introducing digital marketing innovation (Managerial innovativeness). | 0.834 | 34.101 | 0.000 |
| Our customers are already using digital marketing innovations (Need of customer). | 0.590 | 20.131 | 0.000 |
| Our competitors will be superior if we don’t implement digital marketing innovation (Competitive pressure). | 0.748 | 10.665 | 0.000 |
| The government has built sufficient infrastructure to support the implementation of digital marketing innovation in Indonesia (Innovation infrastructure). | 0.574 | 11.048 | 0.000 |
| In general, opinion leaders and the media very often talk about digital marketing innovation (Opinion leadership). | 0.610 | 12.086 | 0.000 |
| Digital marketing innovation is easy to implement in our business processes (Flexibility). | 0.825 | 29.340 | 0.000 |
| It is very easy to distinguish how marketing works digital with conventional marketing (Observability). | 0.685 | 16.191 | 0.000 |
| Digital Transformation | |||
| Our company uses digital channels (such as online, social media, and mobile) to market its products and services (Customer experience). | 0.723 | 18.755 | 0.000 |
| Our company’s technological innovations have enabled customers to interact with our operational processes in the new ways (Improving operation). | 0.843 | 35.629 | 0.000 |
| Our company has launched a new business model based on/using digital technology (Reinvention of business model). | 0.808 | 30.292 | 0.000 |
| Our management has a vision to digitally transform our company’s for the future (Digital vision). | 0.736 | 19.060 | 0.000 |
| Company promotes the cultural changes necessary for digital transformation (Engaging the organization). | 0.797 | 18.033 | 0.000 |
| Our company defines it by clear roles and responsibilities between departments to carry out digital initiatives (Governing the transformation). | 0.838 | 34.731 | 0.000 |
| Information technology unit performance has been able to meet the company’s need to digitally transform digital (Technology leadership). | 0.688 | 14.460 | 0.000 |
| Digital Marketing Adoption | |||
| Does your company use the following digital marketing techniques and methods? (values ranged from 0 (inexistent) to 1 (used)). | 1.000 | ||
| Variable | Old CR | New CR | Cronbach Alpha | AVE |
|---|---|---|---|---|
| Innovation ecosystem readiness | 0.921 | 0.928 | 0.905 | 0.544 |
| Digital transformation | 0.915 | 0.913 | 0.890 | 0.606 |
| Digital marketing adoption index 1 | 1.000 | 1.000 | 1.000 | 1.000 |
| Digital marketing capability | 0.920 | 0.913 | 0.899 | 0.624 |
| Variable | DMA | IER | DMC | DT |
|---|---|---|---|---|
| Digital marketing adoption index (DMA) 1 | ||||
| Innovation ecosystem readiness (IER) | 0.371 | |||
| Digital marketing capability (DMC) | 0.486 | 0.790 | ||
| Digital Transformation (DT) | 0.446 | 0.834 | 0.894 |
| Hypothesis 1 | Path Coefficients | T Statistics | p Values | Results |
|---|---|---|---|---|
| H1 | 0.772 | 24.719 | 0.000 | Supported |
| H2 | 0.114 | 0.999 | 0.318 | Not supported |
| H3 | 0.259 | 3.440 | 0.001 | Supported |
| H4 | 0.336 | 3.102 | 0.002 | Supported |
| H5 | 0.555 | 7.405 | 0.000 | Supported |
| H6 | 0.125 | 3.015 | 0.003 | Supported |
| Components 1 | Low | Medium | High |
|---|---|---|---|
| Innovation ecosystem readiness index | 65 | 78 | 91 |
| Digital transformation index | 56 | 75 | 92 |
| Digital marketing adoption index | 51 | 72 | 81 |
| Digital marketing utilization index | 55 | 74 | 86 |
| Variables | Indicators | Companies | Variables | Indicators | Companies | ||||
|---|---|---|---|---|---|---|---|---|---|
| A | B | C | A | B | C | ||||
| Innovation Ecosystem Readiness | Digital Marketing Adoption | ||||||||
| 1 | Perceived ease of use | 4 | 3 | 5 | 1 | Website | 0 | 1 | 1 |
| 2 | Perceived usefulness | 3 | 4 | 5 | 2 | Email marketing | 0 | 1 | 1 |
| 3 | Organizational readiness | 2 | 4 | 5 | 3 | Newsletter | 0 | 1 | 1 |
| 4 | Managerial innovativeness | 2 | 4 | 5 | 4 | Ecommerce | 1 | 1 | 1 |
| 5 | Need of customer | 3 | 3 | 5 | 5 | Social media marketing | 1 | 1 | 1 |
| 6 | Competitive pressure | 4 | 4 | 5 | 6 | Digital public relation | 0 | 1 | 1 |
| 7 | Innovation infrastructure | 3 | 4 | 5 | 7 | Digital advertising | 1 | 1 | 1 |
| 8 | Opinion leadership | 3 | 3 | 5 | 8 | Display advertising | 1 | 1 | 1 |
| 9 | Flexibility | 3 | 4 | 5 | 9 | Search engine optimization | 0 | 1 | 1 |
| 10 | Observability | 4 | 4 | 5 | 10 | Search engine marketing | 0 | 1 | 1 |
| 11 | Digital CRM | 0 | 1 | 1 | |||||
| 12 | Content marketing | 1 | 1 | 1 | |||||
| Digital Transformation | 13 | Affiliate marketing | 0 | 1 | 1 | ||||
| 1 | Customer experience | 4 | 4 | 5 | 14 | Mobile marketing | 0 | 1 | 1 |
| 2 | Improving operation | 2 | 4 | 5 | 15 | Digital analytic | 0 | 1 | 1 |
| 3 | Reinvention of business model | 2 | 4 | 5 | Index Score Calculation Results 1 | Index Score | |||
| 4 | Digital vision | 4 | 3 | 5 | Digital Marketing Utilization Index (DMUI) | 44 | 77 | 100 | |
| 5 | Engaging the organization | 3 | 3 | 5 | a. | Innovation Ecosystem Readiness Index | 51 | 68 | 100 |
| 6 | Governing the transformation | 3 | 4 | 5 | b. | Digital Transformation Index | 49 | 68 | 100 |
| 7 | Technology leadership | 3 | 4 | 5 | c. | Digital Marketing Adoption Index | 35 | 100 | 100 |
Publisher’s Note: MDPI stays neutral with regard to jurisdictional claims in published maps and institutional affiliations. |
© 2022 by the authors. Licensee MDPI, Basel, Switzerland. This article is an open access article distributed under the terms and conditions of the Creative Commons Attribution (CC BY) license (https://creativecommons.org/licenses/by/4.0/).
Share and Cite
Masrianto, A.; Hartoyo, H.; Hubeis, A.V.S.; Hasanah, N. Digital Marketing Utilization Index for Evaluating and Improving Company Digital Marketing Capability. J. Open Innov. Technol. Mark. Complex. 2022, 8, 153. https://doi.org/10.3390/joitmc8030153
Masrianto A, Hartoyo H, Hubeis AVS, Hasanah N. Digital Marketing Utilization Index for Evaluating and Improving Company Digital Marketing Capability. Journal of Open Innovation: Technology, Market, and Complexity. 2022; 8(3):153. https://doi.org/10.3390/joitmc8030153
Chicago/Turabian StyleMasrianto, Agus, Hartoyo Hartoyo, Aida Vitayala S. Hubeis, and Nur Hasanah. 2022. "Digital Marketing Utilization Index for Evaluating and Improving Company Digital Marketing Capability" Journal of Open Innovation: Technology, Market, and Complexity 8, no. 3: 153. https://doi.org/10.3390/joitmc8030153
APA StyleMasrianto, A., Hartoyo, H., Hubeis, A. V. S., & Hasanah, N. (2022). Digital Marketing Utilization Index for Evaluating and Improving Company Digital Marketing Capability. Journal of Open Innovation: Technology, Market, and Complexity, 8(3), 153. https://doi.org/10.3390/joitmc8030153