Article

How to Improve Performance and Diversity of Government-Funded Research Institute Ecosystem? Focus on Result Sharing and Feedback Policy

1
Technology Management, Economics and Policy Program, College of Engineering, Seoul National University, Seoul 08826, Korea
2
Department of Biomedical Convergence, College of Medicine, Chungbuk National University, Cheongju 28644, Korea
*
Author to whom correspondence should be addressed.
J. Open Innov. Technol. Mark. Complex. 2019, 5(3), 66; https://doi.org/10.3390/joitmc5030066
Submission received: 17 July 2019 / Revised: 18 August 2019 / Accepted: 20 August 2019 / Published: 5 September 2019

Abstract

:
Despite its importance to the performance outcome of an organization, there are very few studies on how feedback mechanism impacts ecosystems of government-funded research institutes (GIs). This study focuses on the effect of the feedback mechanism on the average performance and diversity of a GI ecosystem. Feedback mechanisms consisted of feedback strategy and degree of result sharing. An agent-based model that embeds a genetic algorithm to replicate a real GI ecosystem was used. It was found that relational patterns between average performance and degree of result sharing varied by type of feedback policy. In contrast, convergence time, which refers to the average period of settling the stable state in the perspective of ecosystem diversity, depends on the ratio of result openness rather than the type of feedback policy. This study suggests two plans to improve the GI assessment system by changing the degree of result sharing and feedback type.

1. Introduction

The government-funded research institute (henceforth GI) is one of the main subjects of the national innovation system and is established and operated to promote the development of the national economy by innovating national science and technology and strengthening national competitiveness [1,2]. Therefore, it is important to improve the efficiency and research performance of national research and development (R&D) investment by efficiently managing and utilizing the research performance of GIs through an optimal assessment system [3,4,5]. An attractive assessment system has been known to be an efficient way to enhance organizational performance [6,7]. However, even if there is a clear evaluation metric, it cannot always guarantee good effects [8]. The influence of feedback systems may increase when the gap between organizational goals and status quo is widened [9]. However, feedback systems cannot always guarantee good effects [8] because of antecedents such as frequency [10,11,12,13], intensity [10], and individual context [14]. Indeed, the assessment system of GIs in Korea is not an exception.
In the 1990s, the Korean government established an assessment system for GIs to improve their outcomes. Concerning this evaluation system, studies suggested several guidelines for upgrading the GI assessment system. Most suggestions emphasized only internal factors [15,16,17,18,19,20], such as validity of criteria, evaluator’s ability, and reliability of the assessment system itself, rather than the feedback mechanism. However, the feedback method of assessment should be considered because feedback is critical to improving the performance of an organization [21,22].
The present study focuses on the effect of the type of feedback policy, which has seldom been explored. This study aims to examine two aspects: (1) the effect of changing the incentive policy and (2) the degree of the result disclosure on average performance and diversity of the ecosystem of GIs. Based on the findings, this study will provide guidelines for strategies to enhance the efficiency of GIs using feedback mechanisms including feedback policy and degree of sharing assessment results.
In Section 2, previous studies of the feedback system are presented to explain the effect of the feedback system and criticism of existing feedback systems of Korea. We revisited feedback research investigating the factors which improve the impact of feedback. Furthermore, this chapter provides criticism that supports the lack of ex-post utilization of feedback results. In Section 3, the methodology of this study is introduced. This study adopted an agent based model simulation based on organizational learning. In the present study, three layers, including agent, system, and ecosystem are assumed for describing a bottom-up process. Five agent-based model (ABM) experiments are conducted by the type of feedback policy based on assessment result sharing. From this experiment, we investigate the relational patterns between the average performance and degree of result sharing determining the performance and diversity of GI’s ecosystem. In Section 4, details of the experiments’ results are given. The result of the experiments implies two ways to improve the performance of the ecosystem. Lastly, we discuss how to interpret and apply our findings to a real-world viewpoint.

2. Literature Review

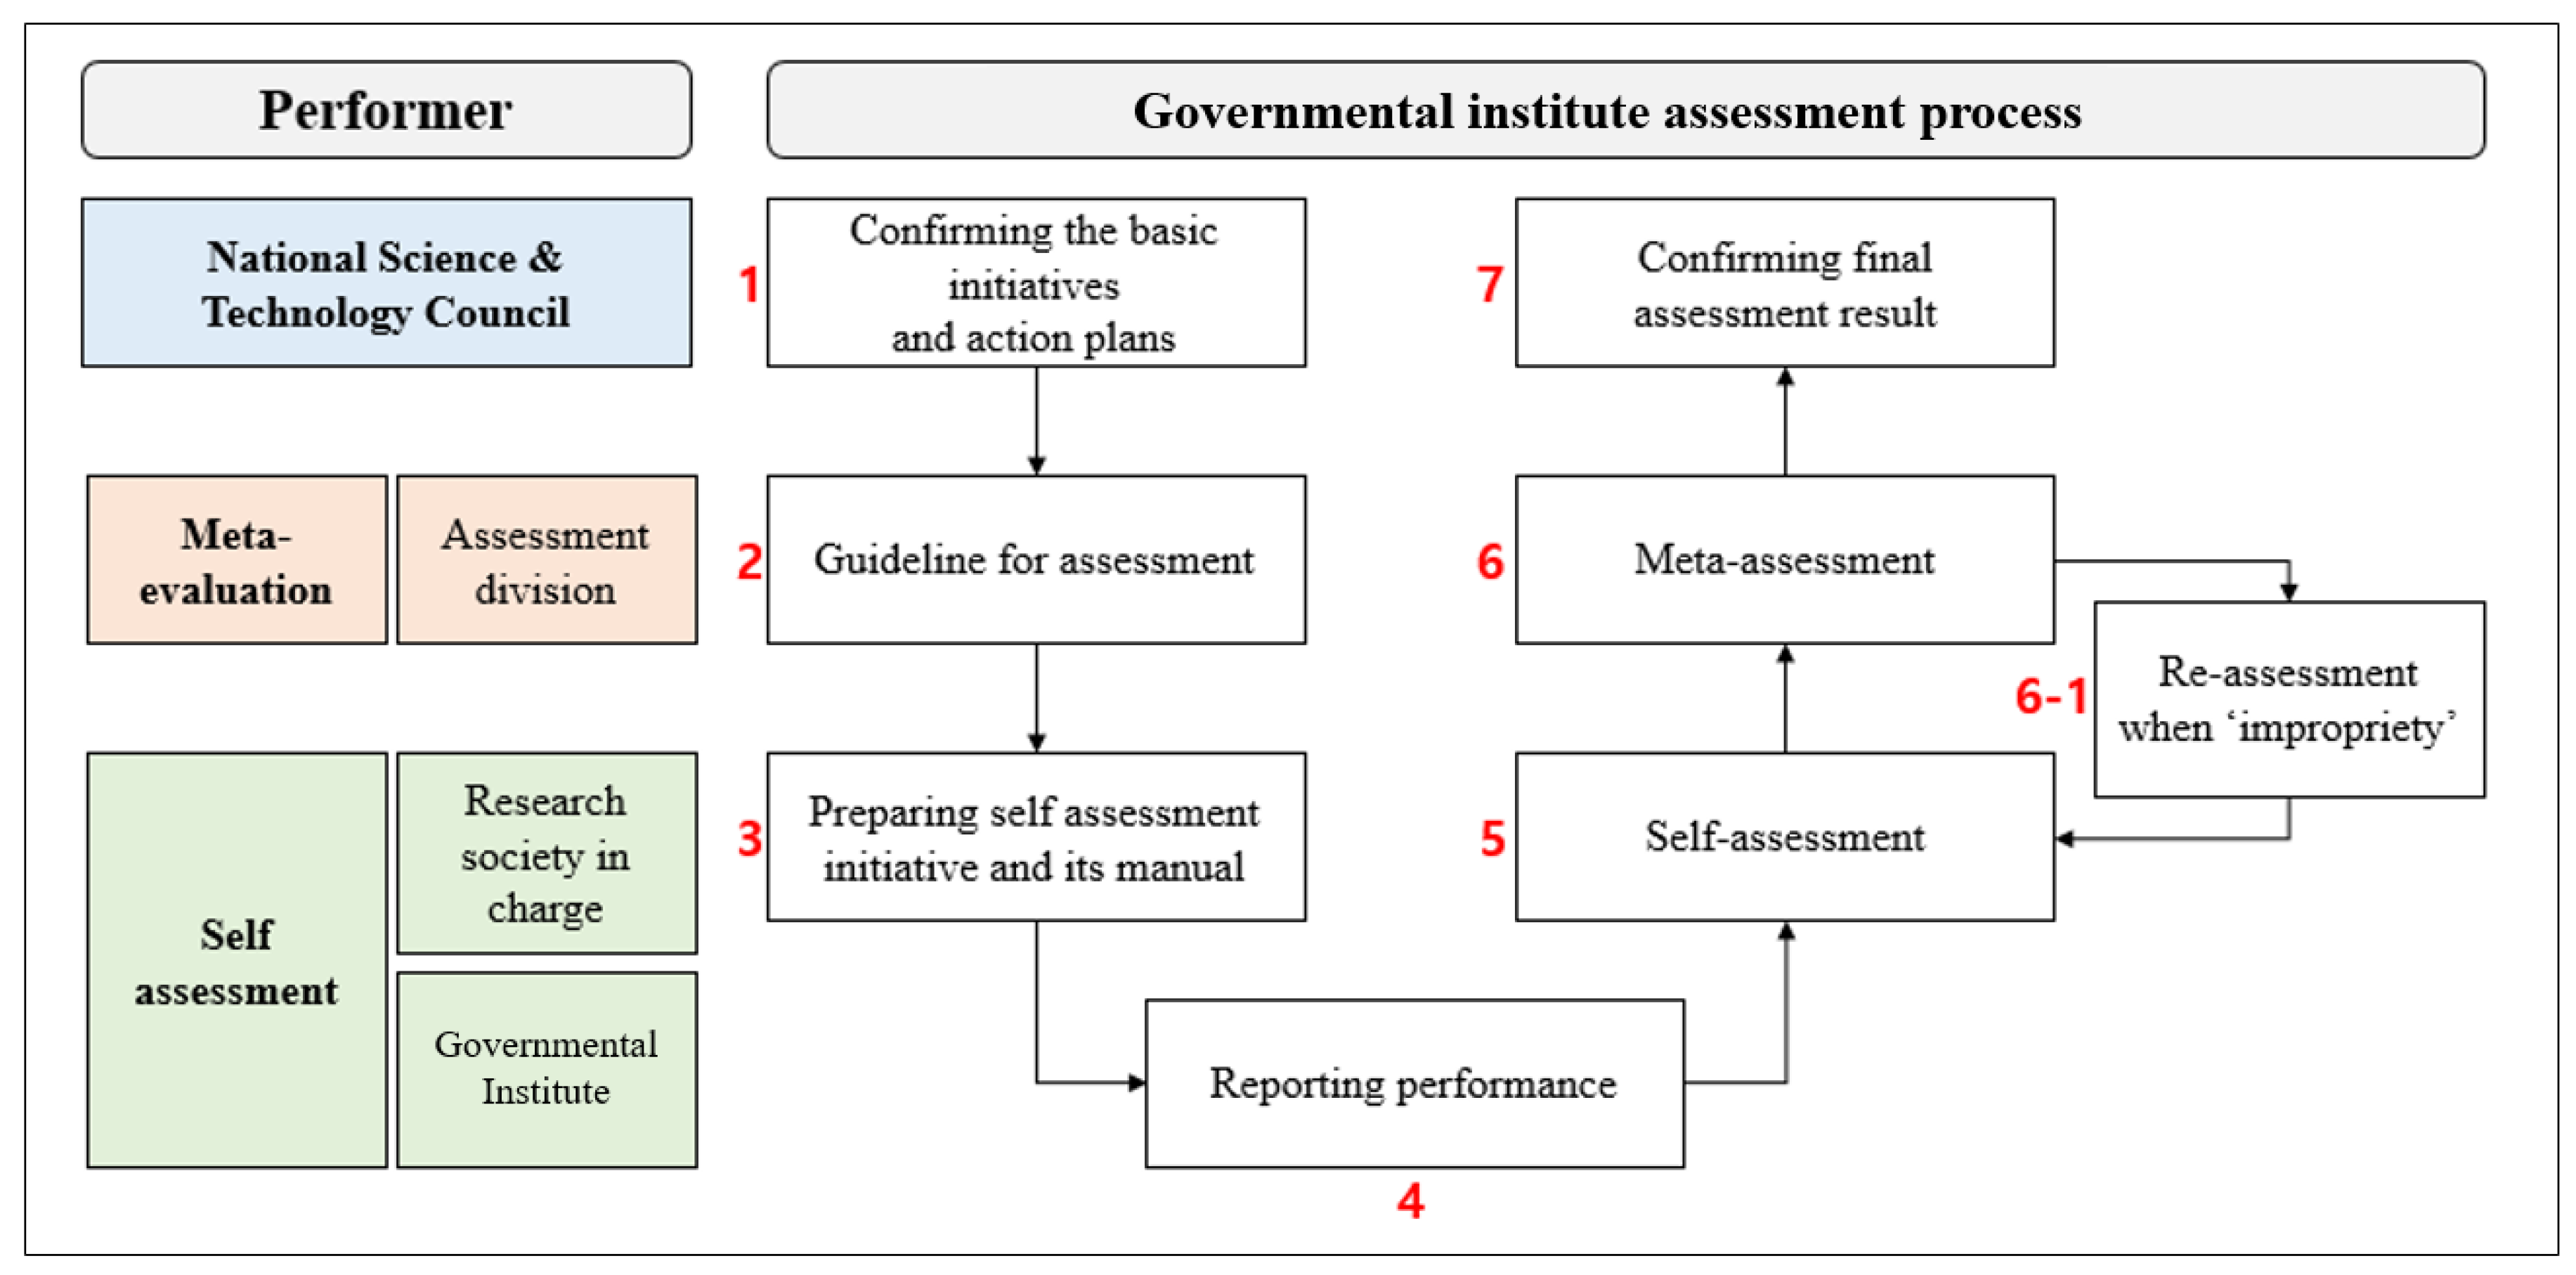
2.1. GI Assessment System and Its Critics

Organizational assessment plays a significant role in improving the quality of the organization through a self-sustaining feedback process by contributing to the organization’s goal setting and creating a competitive environment [6,7,23]. As GIs have a unique ownership structure and behavioral characteristics, their assessment and evaluation should consider inherent inefficiency, fair compensation, capacity of development of organizational members, and organizational efficiency [23].
The Korean GI assessment system was established in 1991. Since this system includes assessment and proportional response toward GIs, it assumes the role of a feedback system. Unlike private firms, GIs have focused on the science and technology of public areas that are difficult for universities and firms to access [24]. It is thus important to consider their roles and characteristics when they are evaluated. Figure 1 presents a flow chart of the feedback system for GIs in Korea. The Korean government-organized GI assessment system has three performers who assume unique responsibilities. Each actor plays the role of self-assessment, meta-evaluation, and final decision making.
Since the inception GI assessment, there has been much criticism of the effectiveness of the public institute assessment system. Critical studies mainly relate to determinants of acceptance towards assessment results, such as reliability, validity, and the utilization of results [25]. There are two major streams of critiques observed in previous studies.
The first criticism refers to problems of the assessment system, such as lack of assessment capability, inconsistent criterion, and structural faults of the operation system [16,25,26,27]. In particular, criteria of assessment have been considered critical factors in previous studies. The problem lies in the fact that various criteria do not reflect actual heterogeneous properties of GIs. To establish solutions, previous studies proposed frequent changes of the assessment metric [27], reviewing insufficient measurement of performances [28], uniformity of final assessment [26] and role of public R&D management agencies [29] as plausible causes of the problem. In addition, selecting an appropriate assessment target [16,26], size effect bias [30], networking [31], gaps between goals of assessment systems and institutes [16], and acceptability of results [25] may be considered factors for an efficient institute assessment system.
The second criticism is related to ex-post utilization of assessment results. Hwang and Kang (2004) [27] and Son (2007) [28] argued that lack of reliability of assessment results could cause unacceptability of the assessment system. Further, insufficient follow-ups [27] and lack of detailed information of feedback [16,26,27,28] could be critical issues in enhancing assessment efficiency. In addition, selecting an appropriate assessment target [16,26], size effect bias [30], networking [31], gaps between goals of assessment systems and institutes [16], and acceptability of results [25] may be considered factors for an efficient institute assessment system.

2.2. Organizational Feedback and Its Effect

Previous organizational assessment studies have focused on methods to enhance the performance and effectiveness of an organization. According to them, the feedback system and a meta-evaluation have been considered, as critical factors for improving the organizational performance and capability feedback system are based on the learning behavior of each member [12,32,33]. Hence, most studies agree with the result that the feedback system may increase organizational performance regardless of its type [21,22]. However, the effect of the feedback system can be changed by the properties of the system itself [21,22,34] or the contextual condition of the organization [35,36,37,38,39]. The factors suggested in the previous studies are distinguished into two categories. Table 1 shows the classification of factors affecting the feedback performance. The ex-ante factor is defined as an antecedent of feedback effectiveness before the assessment result is released. Contrary to that, the ex-post factor refers to the action utilizing the assessment result. Despite the previous studies that emphasized both sides of the feedback system, ex-ante and ex-post, the GI feedback system in Korea was likely to consider the ex-ante factors. In particular, the reliability of assessment process was the most important point of the system.
Previous studies relatively emphasized the ex-ante aspect of the feedback system. Despite the various ex-post factors presented in feedback theory researches (see Table 1), only the feedback detail was included in the discussion about the GI feedback system in Korea. Furthermore, in the theoretical approach of the feedback system, it was hard to find a research investigating multiple factors simultaneously. The present study has advantages in those points. This study not only focuses on the ex-post factors but also considers two aspects, these are feedback policy and the degree of result sharing at the same time.

3. Research Model

As mentioned earlier, the existing feedback system does not seriously discuss the ex-post perspective and multilateral relationships. The present study adopts an ABM simulation method to understand the feedback mechanism of the GI ecosystem. In our ABM simulation, ex-post factors of the feedback system involve result sharing activity and a type of feedback policy. Result sharing is an interactive activity that transforms a feedback system into a complex adaptive system [64].
GI’s feedback system is a complex adaptive system composited by non-linear causalities and emergent phenomenon [65]. Hence, this study built an ABM to examine the impact of the result sharing and the feedback policy on the evolution of the GI ecosystem on the performance and diversity perspectives. Therefore, constructing an ABM in this study is an effective way to describe social phenomena caused by interaction among the agents [66]. In this ABM, microscopic interactions, such as result sharing, are based on the evolutionary process using the genetic algorithm [67].

3.1. Agent Based Model Simulation (ABMS)
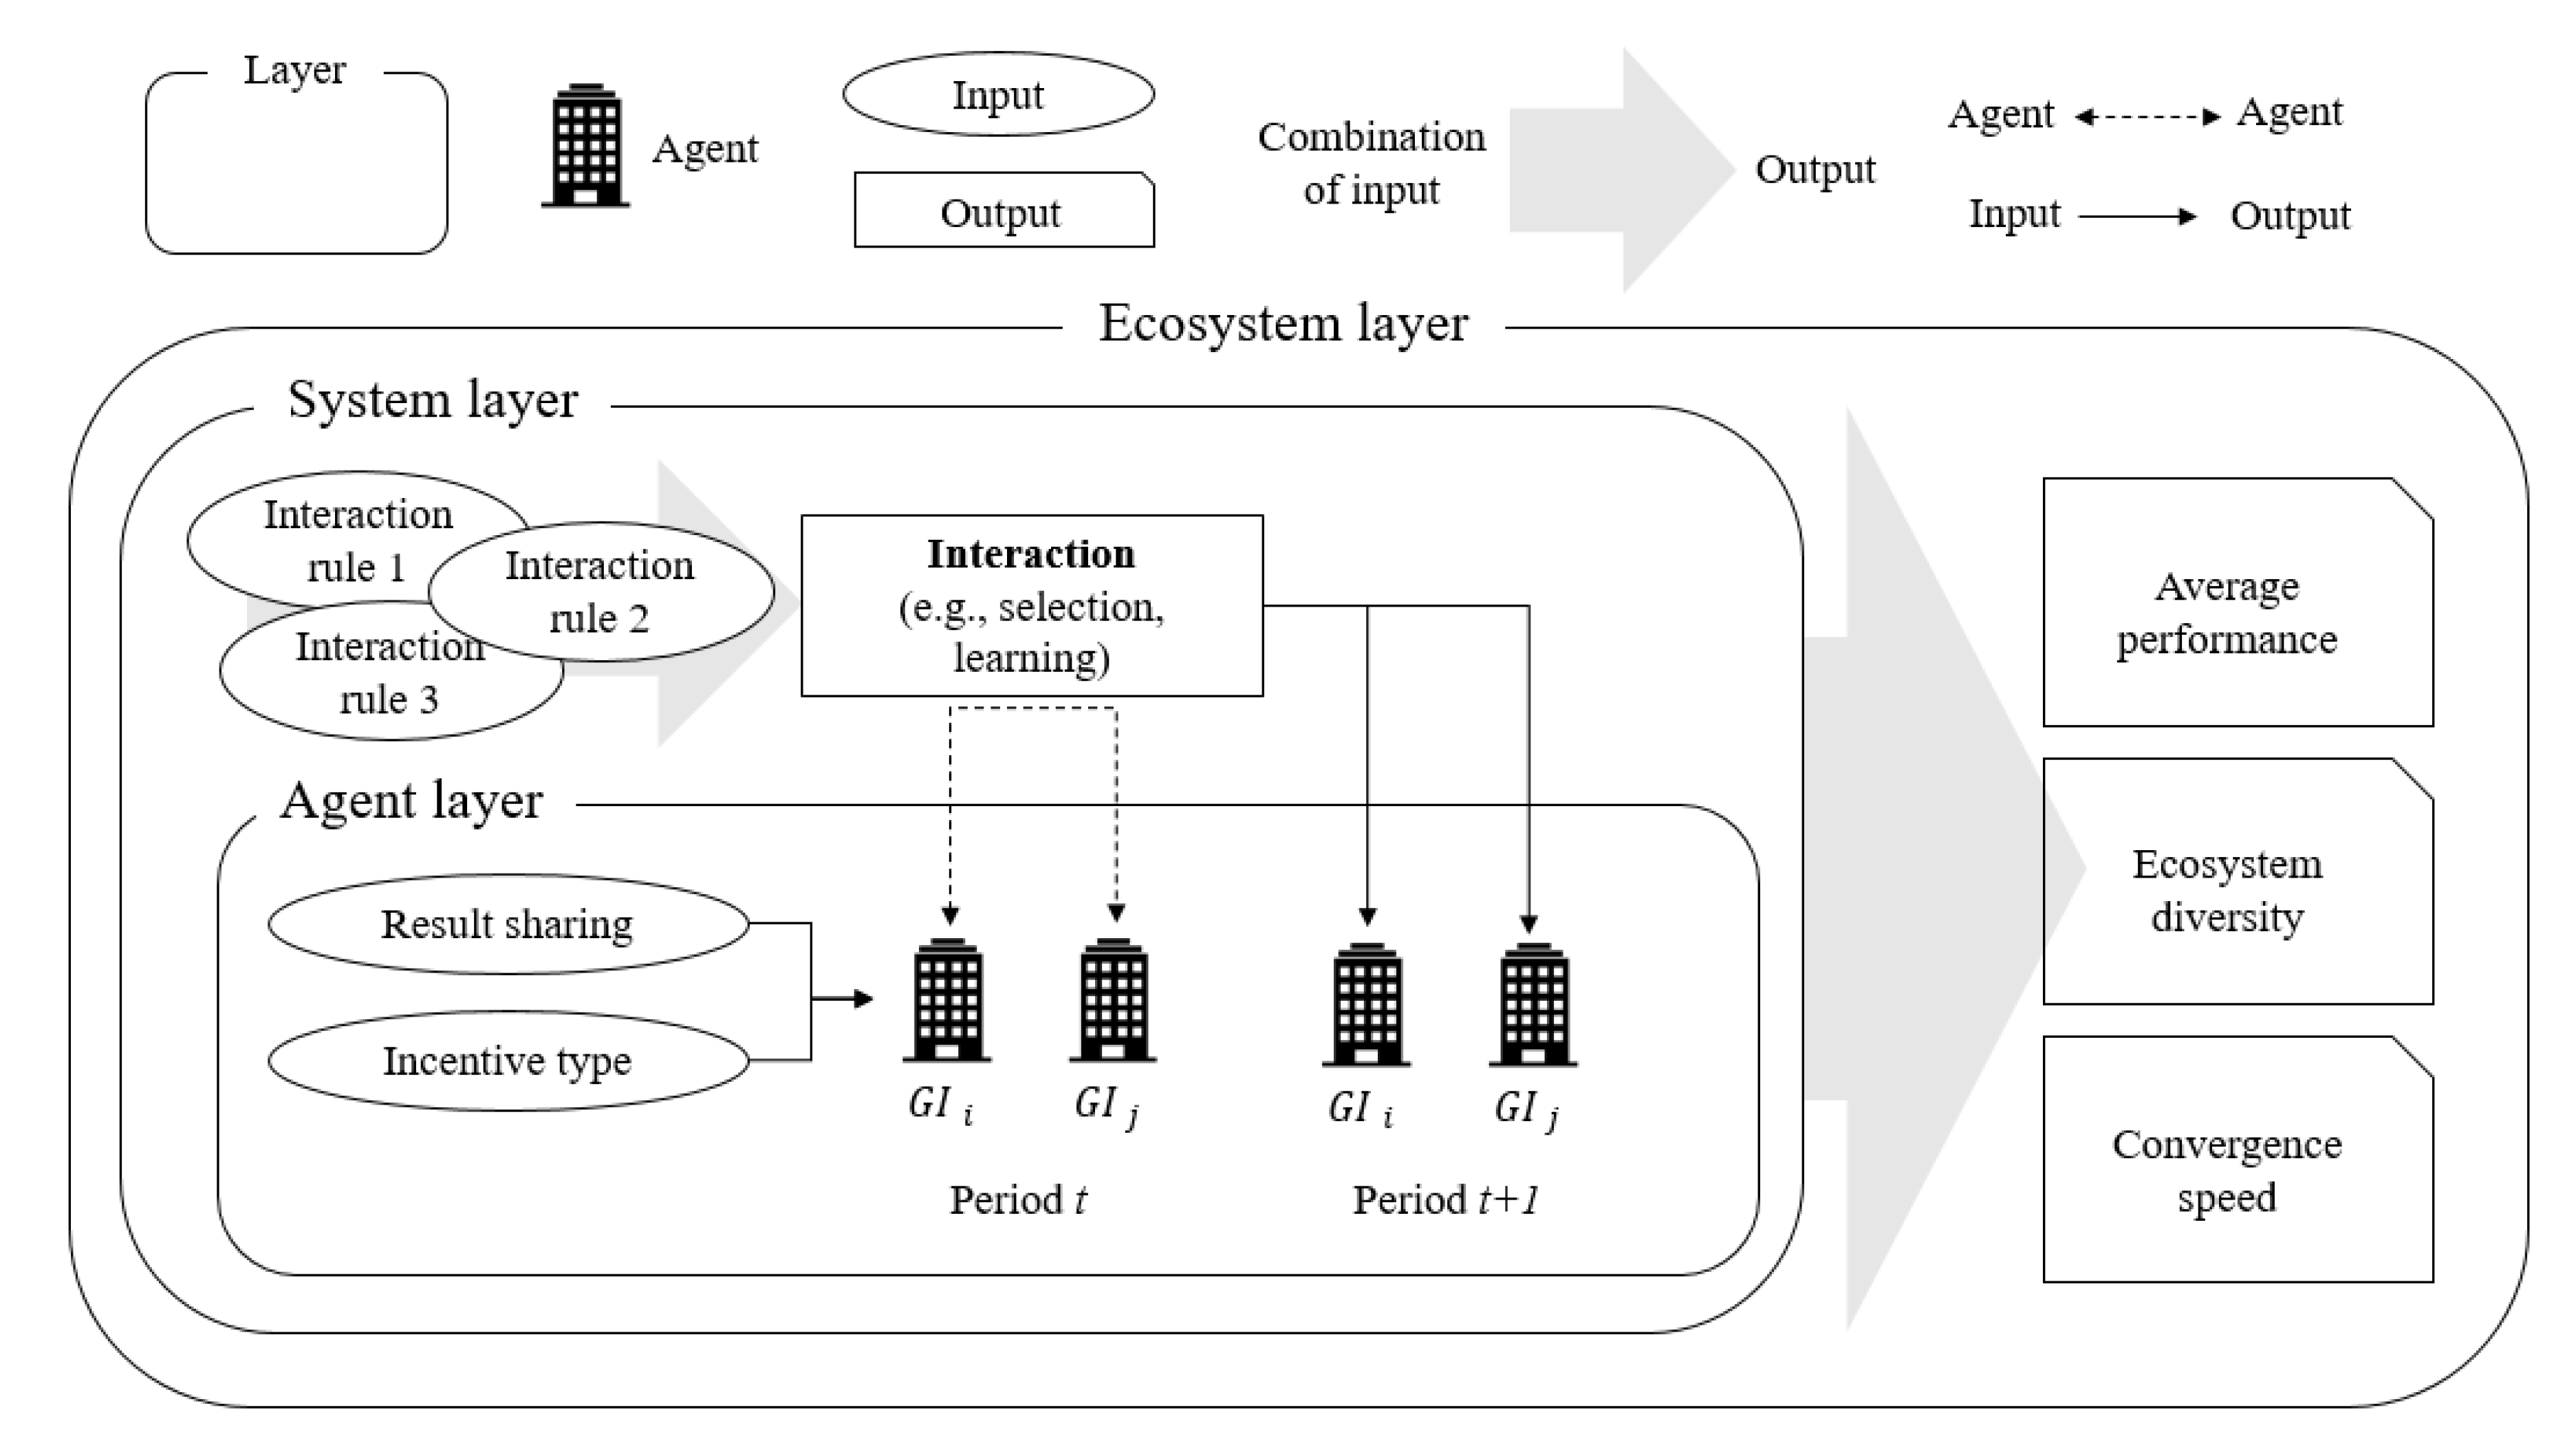
Unlike analytic methodologies, the ABM can interpret social phenomenon based on a bottom-up process. The ABM has the advantage of dealing with unstructured problems, such as ambiguous assumptions, and phenomena controlled by individual levels through simplifying complex systems [68]. Thus, ABM has been used to analyze complex and large sizes of the system through interactions of autonomous entities [69]. In the ABM simulation, since a result is not a sum of parts, the ABM simulation should be modularized into multiple layers [70]. This study assumed three layers consisting of “agent later”, “system layer,” and “ecosystem layer”. Figure 2 presents a detailed description of the ABM simulation research model. “Agent layer” refers to a microscopic level of an ecosystem and includes multiple research institutes, which is the minimum unit of the GI ecosystem. Based on the bottom-up perspective, all decisions are conducted in this layer. “System layer” defines the interaction between the agent layer and the ecosystem layer. Although no autonomous agent exists in this layer, the system layer may express how to interact among agents in given conditions. The “ecosystem layer” provides a macroscopic view to observe emergent phenomena that are being investigated. Similar to the system layer, the ecosystem layer does not have actual agents. However, this layer relays information on the current environment. This information may influence the decisions of each agent. Furthermore, this layer shows macroscopic patterns, such as average performance, diversity, or regular tendency. While each layer can manipulate its own layer, interactions between layers are possible.
Within the basic framework of the genetic algorithm (GA), various approaches depend on the method of recombination and sampling of the mating pool. We used alternative strategies because of two limitations in the basic process. First, in the biological context, it is very natural that only two entities join in the mating process. However, more than two entities can join the mating process in a social science context. Second, there is a deceptive problem. Strong searching power, which covers the entire sample space, may be effective for fast and short-term evolution. However, it not only generates a premature solution but also contradicts the assumption of bounded rationality. To solve these problems, we used a sampling ratio (β) representing the characteristic of bounded rationality to prevent the pressure vitiating the performance of the algorithm [71].

3.2. Model Layers

3.2.1. Agent Layer

The agent layer refers to the institute layer to which GIs belong. The agent layer consists of heterogeneous and autonomous entities who interact with other entities to maximize their objective function [70]. In this layer, the initial attributes of each institute are determined. A set of properties of institute i is described as a string of genes ( S i ). Each property is expressed by an integer from 0 to 2. Performance (p), learning rate (π), forgetting rate ( λ ) and self-adjustment rate ( γ ) are assigned randomly. The organizational performance, learning rate, and forgetting rate are based on Levitt and March (1988) [55], and March (1991) [56]. Individual performance is calculated through the concept of fitness in the evolutionary process.
P i = f ( S i , t , S t i d e a l S o p t , t ) = 1 2 n j = 1 n ( 2 | δ i , j δ j i d e a l | )
n = number   of   properties δ j i d e a l = j th   ideal   attribute δ i , j =   j th   attribute   of   institute   i
Self-adjustment rate “γ” is a unique attribute of this study. This attribute refers to the action of a spontaneous effort for improvement without any external interference. This study assumes that self-adjustment is determined by the performance observed just before period. Table 2 shows details of each attribute in the agent layers.

3.2.2. System Layer

The system layer manages a middle level of the ecosystem providing predefined rules of The system layer manages a middle level of the ecosystem providing predefined rules of interactions. In this layer, interaction among the institutes are presumed by an evolutionary process known as the genetic algorithm as suggested by previous studies. The GA describes an evolutionary process through mutual learning, which has special mating rules among agents. The evolutionary process based on GA has been utilized in a social context such as inter-organizational learning [72] and intra-organizational learning [73,74]. At this stage, the higher the performance of the institute i , the more likely it is to be chosen as a learning object. The imitation probability is the same as the learning rate ( π i ).
A strong searching power, which covers the entire sample space, not only generates a premature solution but also violates the assumption of bounded rationality. To solve these problems, we used a sampling ratio (β) representing the characteristics of bounded rationality to prevent the pressure vitiating the performance of the algorithm [71]. The sampling ratio β is to control the selection pressure of the GI ecosystem. In general, the network of private firms has a central node that is incumbent or most benefitted, whereas universities and public research institutes do not have nodes that play central roles in their ecosystems [75,76]. Hence, sampling ratio β is defined as a probability derived from a uniform distribution. When β is 1.0, the model considers the entire population as a sampling pool and generates the highest selection pressure, and as β closes to zero, the evolution of the system becomes a random walk process. In addition, the total number of institutes (N), time (t), and the amount of incentive (v) are defined in this layer (see Table 3).

3.2.3. Ecosystem Layer

Generally, an emergent phenomenon is likely to occur at a different hierarchy [77]. The ecosystem layer has no authority to control the parameter but plays a role as a window for observing the macroscopic phenomenon. Through this layer, we can observe the average performance and diversity of GI ecosystem. The average performance of the ecosystem refers to the overall fitness toward the environmental properties. To calculate the performance, the ecosystem layer provides an ideal status of attributes. Similar to the attribute string of each institute, ideal attributes are presented as a string. The ideal string at period t ( S t i d e a l ) is dependent on both the initial condition and internal assessment. Average performance is calculated as shown below.
P a v g , t = 1 N i = 1 N P i = 1 2 N n i = 1 N j = 1 n ( 2 | δ i , j δ o p t , j | ) N = number   of   population   in   the   ecosystem
Internal assessment is a unique characteristic of the GI feedback system in Korea. When performance and diversity are calculated, the feedback system reflects the metric of internal assessment organized by each institute. Internal assessment can be included in the initial criteria when it is approved by upper organizations. In this study, the reflection of internal assessment (c) is defined as a probability between 0 and 0.1. The list of attributes used in the ecosystem layer are shown in Table 4.
Because of its importance, maintaining diversity has been investigated in previous studies [78]. There are four representative ways to measure ecosystem diversity as shown in Table 5. In this study, the dimension of the attribute string of institutes is homogeneous. In addition, individual attributes are expressed by the form of a nominal variable. The Euclidian distance and connection matrix-based diversity are more appropriate to geometrical aspects. Information entropy is relevant to stochastic uncertainty. Thus, it is natural to adopt the “Hamming distance” as a way to measure ecosystem diversity.

3.3. Experiment

In this section, experiments based on ABM simulation are introduced. As this study assumed in a previous section, both the feedback policy and the degree of result sharing are the ex-post strategies of a feedback system. However, since the degree of result sharing is a continuous number between 0 and 1, it is hard to design the experiment model in that manner. Hence, this study organizes five experiments based on the type of feedback policy rather than the result sharing. To enhance the validity, all experiments were conducted 100 times and the results were derived from the average of repeated results.
According to previous research, there are two types of feedback: positive and negative feedback. Both types of feedback are known to be effective methods for improving organizational performance [21,22,33,34]. In addition, the target of feedback may be considered another aspect of the type of feedback. In the present research model, types of GI are distinguished by two groups involving high performer and low performer (see Table 6).

3.3.1. Experiment 1: No Policy

The first type of feedback policy is ‘no policy’, which does not have any feedback. The GIs become autonomous entities that are dependent on their decision making. Under the ‘no policy’ condition, all parameters are invariant because there is no evidence to evaluate. The function of institute i can be shown as:
Agent   i = { S i , t , P i ( S i , t 1 ) , β i , t ,   π i , t , λ i , t ,   γ i , t }   at   policy   type   =   1
S i , t : String   of   knowledge   of   institute   i   at   t ; P i ( S i , t 1 ) : Performance   of   institute   i   at   t   1 ; β i , t :   Sampling   ratio   of   institute   i   at   t ; π i , t : learning   rate   of   institute   i   at   t ; λ i , t :   forgetting   rate   of   institute   i   at   t ; γ i , t : self adjustment   rate   of   institute   i   at   t ;

3.3.2. Experiment 2: Positive Feedback to the High-Performance Group

The second type is the ‘positive feedback to the high-performance group’ policy. In this model, the positive feedback is only provided to the high-performance group. The high-performance group is filtered by the predefined ratio ( r h i g h _ p e r f ) . The amount of incentive is determined by the incentive parameter ( v ) between from −1.0 to 1.0.
Agent   i = { S i , t , P i ( S i , t 1 ) , β i , t ,   π i , t , λ i , t ,   γ i , t ( P i , t 1 , γ i , t 1 ) }
γ i , t ( P i , t 1 , γ i , t 1 ) , = { ( 1 + v ) × γ i , t 1     i f   P i ,   t 1 > ( r h i g h _ p e r f × i = 0 N P i , t 1 N ) γ i , t   e l s e w h e r e v : quantity   of   incentive r h i g h _ p e r f : ratio   of   high performance   group

3.3.3. Experiment 3: Positive Feedback to the Low-Performance Group

Although this policy seems to defy social common sense, it has been used in non-industrial areas, such as an international aid programs, technology, and public education. The definition of a low-performance group follows the experiment 2.
Agent   i = { S i , t , P i ( S i , t 1 ) , β i , t ,   π i , t , λ i , t ,   γ i , t ( P i | P i r l o w _ p e r f × mean ( P i ) ) }
f t ( P i ,   t 1 ) = { ( 1 + v ) × γ i , t 1     i f   P i ,   t 1 ( r l o w _ p e r f × i = 0 N P i , t 1 N ) γ i , t   e l s e w h e r e

3.3.4. Experiment 4: Negative Feedback to the Low-Performance Group

The third type of feedback is “negative feedback to low-performance groups,” wherein low-performance institutes receive penalties. A low-performance group is determined in the same manner as feedback policy 2. Contrary to feedback policy 2, negative feedback can pressure low-performance institutes to change their current statuses. A detailed description of the agent in feedback type 3 is shown as Equations (4) and (5).
Agent   i = { S i , t , P i ( S i , t 1 ) , β i , t ,   π i , t , λ i , t ,   γ i , t ( P i | P i r l o w _ p e r f × mean ( P i ) ) }
f t ( P i , t 1 ) = { ( 1 v ) × γ i , t 1     i f   P i , t 1 ( r l o w _ p e r f × i = 0 N P i , t 1 N ) γ i , t   e l s e w h e r e

3.3.5. Experiment 5: Positive Feedback to the High-Performance Group and Negative Feedback to the Low-Performance Group (Mixed Policy)
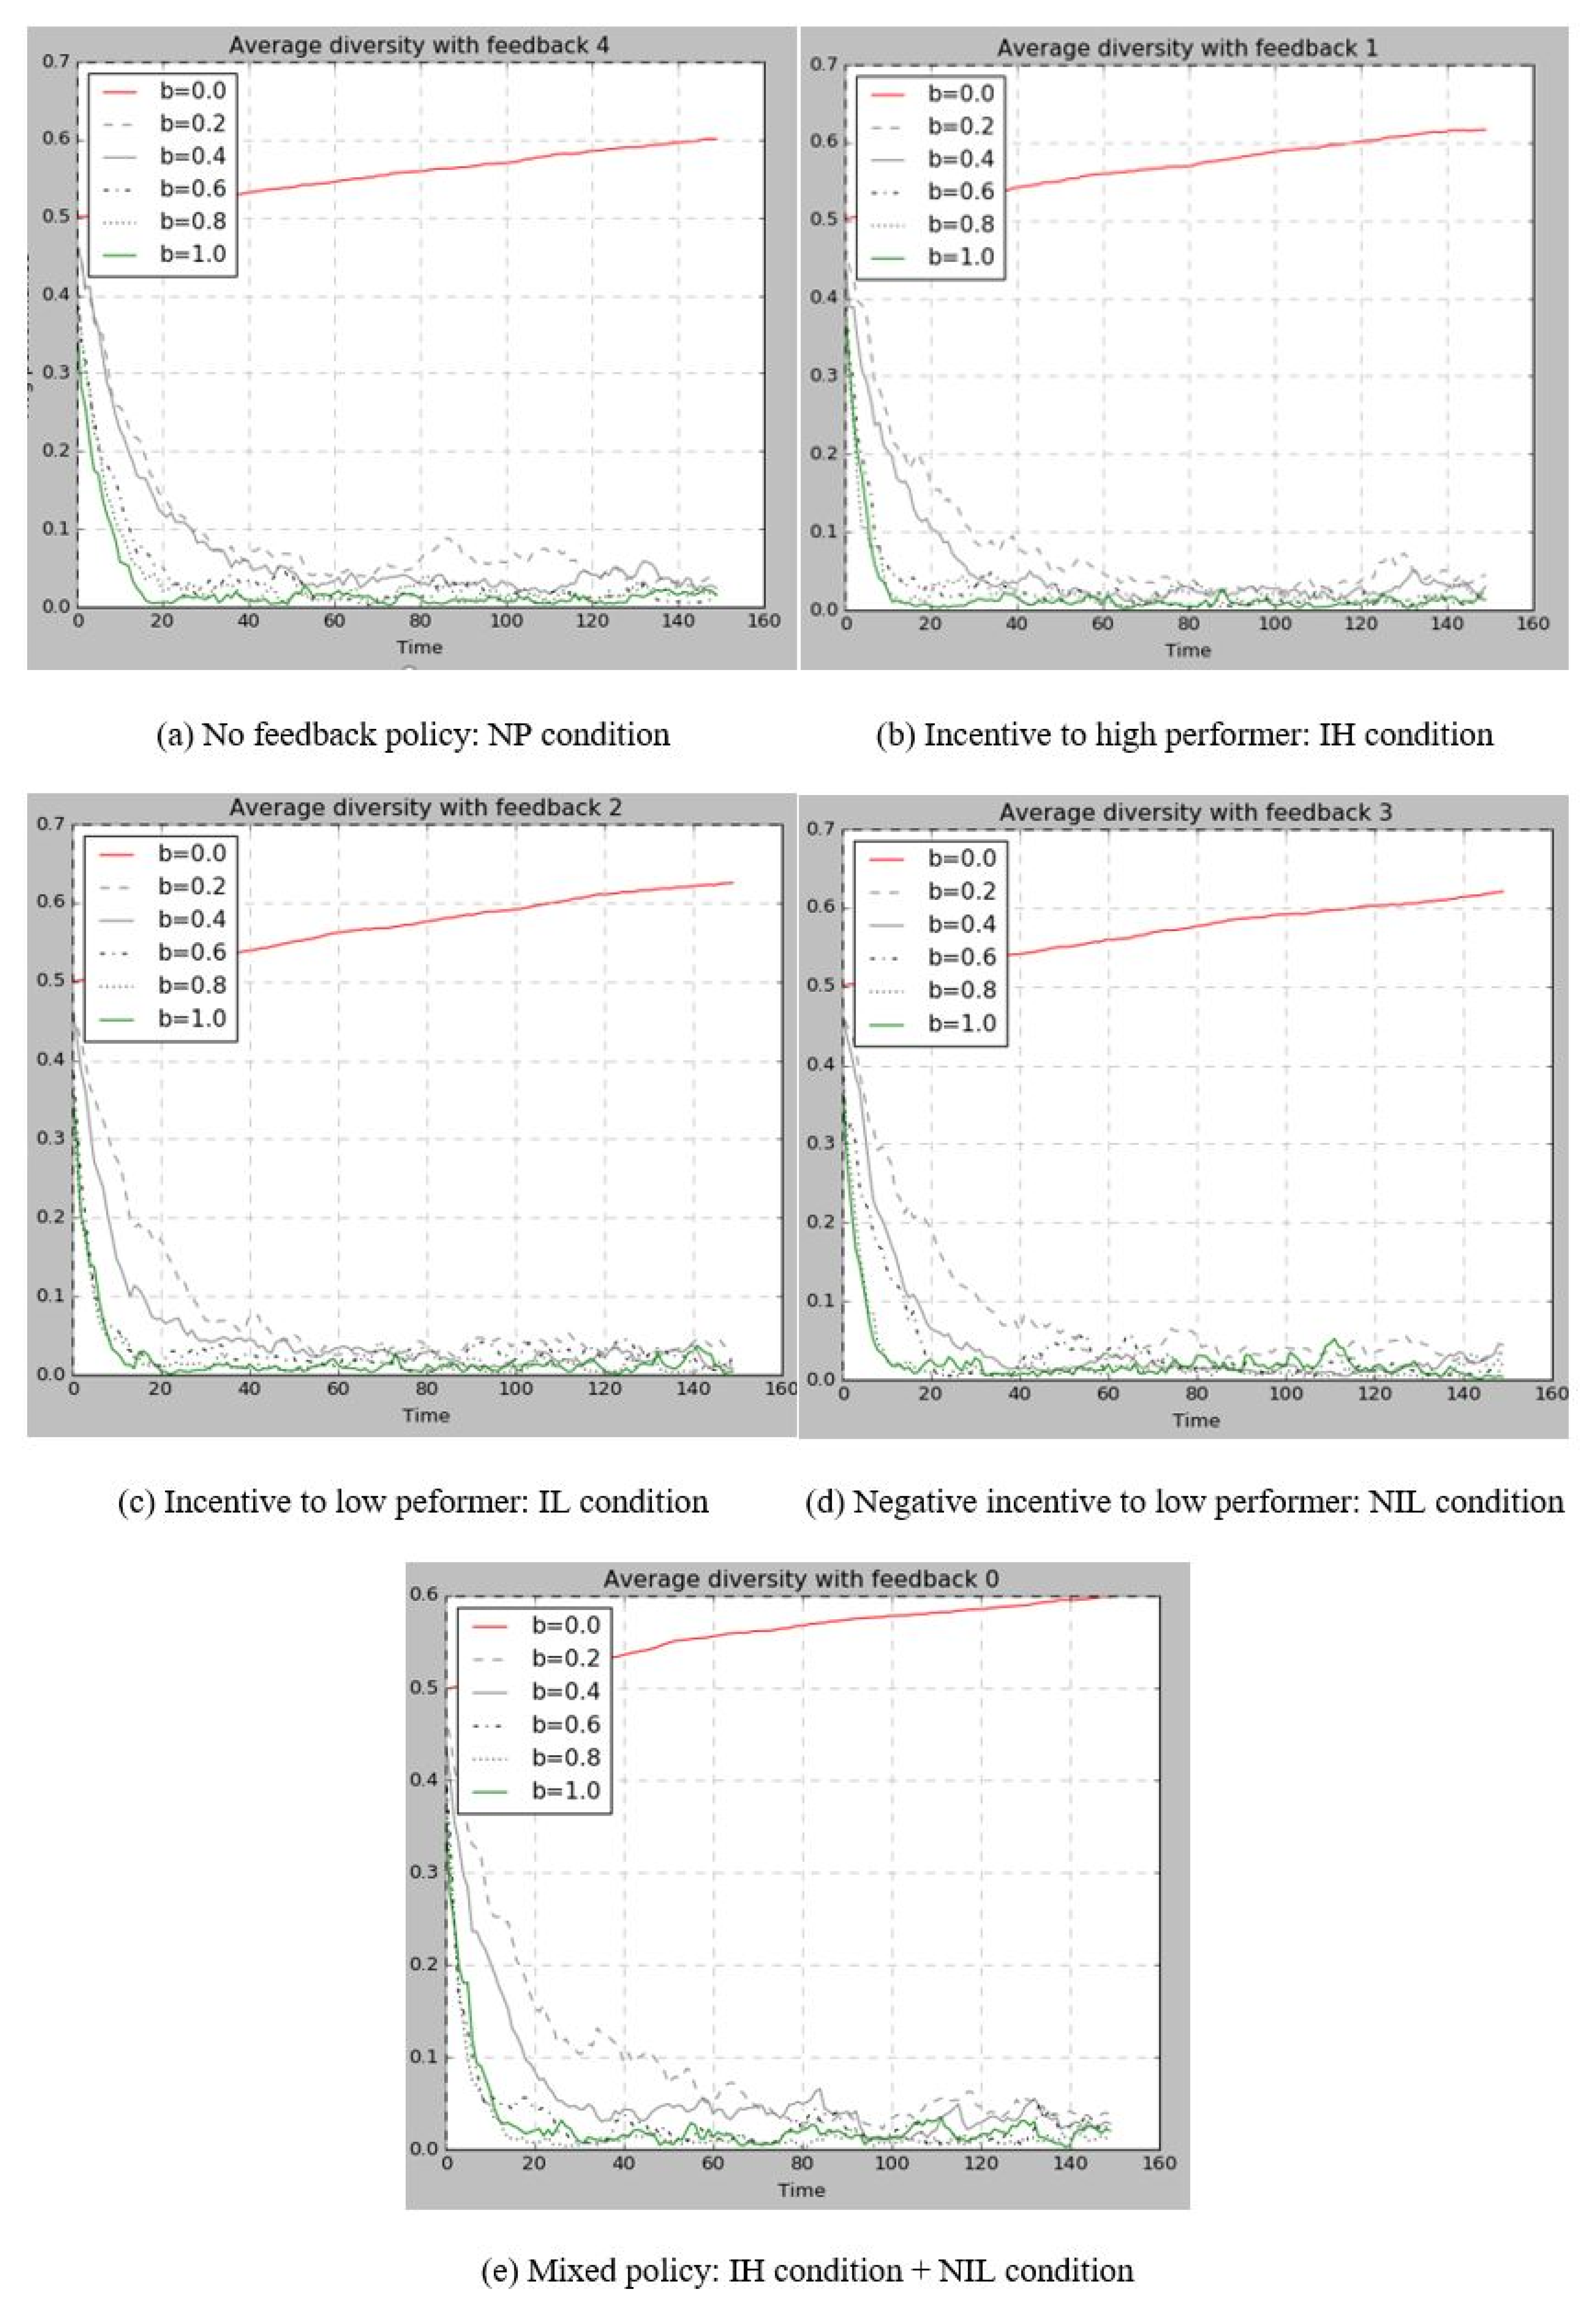
The last type of feedback policy is a mixed policy of Experiments 2 and 4. This is a similar policy with actual GI system assessment. The low-performance and high-performance entities are designated akin to or in the same manner as previous feedback polices.
Agent   i = { S i , t , P i ( S i , t 1 ) , β i , t ,   π i , t , λ i , t ,   γ i , t ( P i | P i r l o w _ p e r f × mean ( P i ) ) }
f t ( P i , t 1 ) = { ( 1 v ) × γ i , t 1     i f   P i , t 1 ( r l o w _ p e r f × i = 0 N P i , t 1 N ) ( 1 + v ) × γ i , t 1     i f   P i , t 1 > ( r l o w _ p e r f × i = 0 N P i , t 1 N ) γ i , t   e l s e w h e r e

4. Result

From the simulation experiments, we captured the effect of the degree of result sharing and the type of feedback policy toward the average performance and diversity.

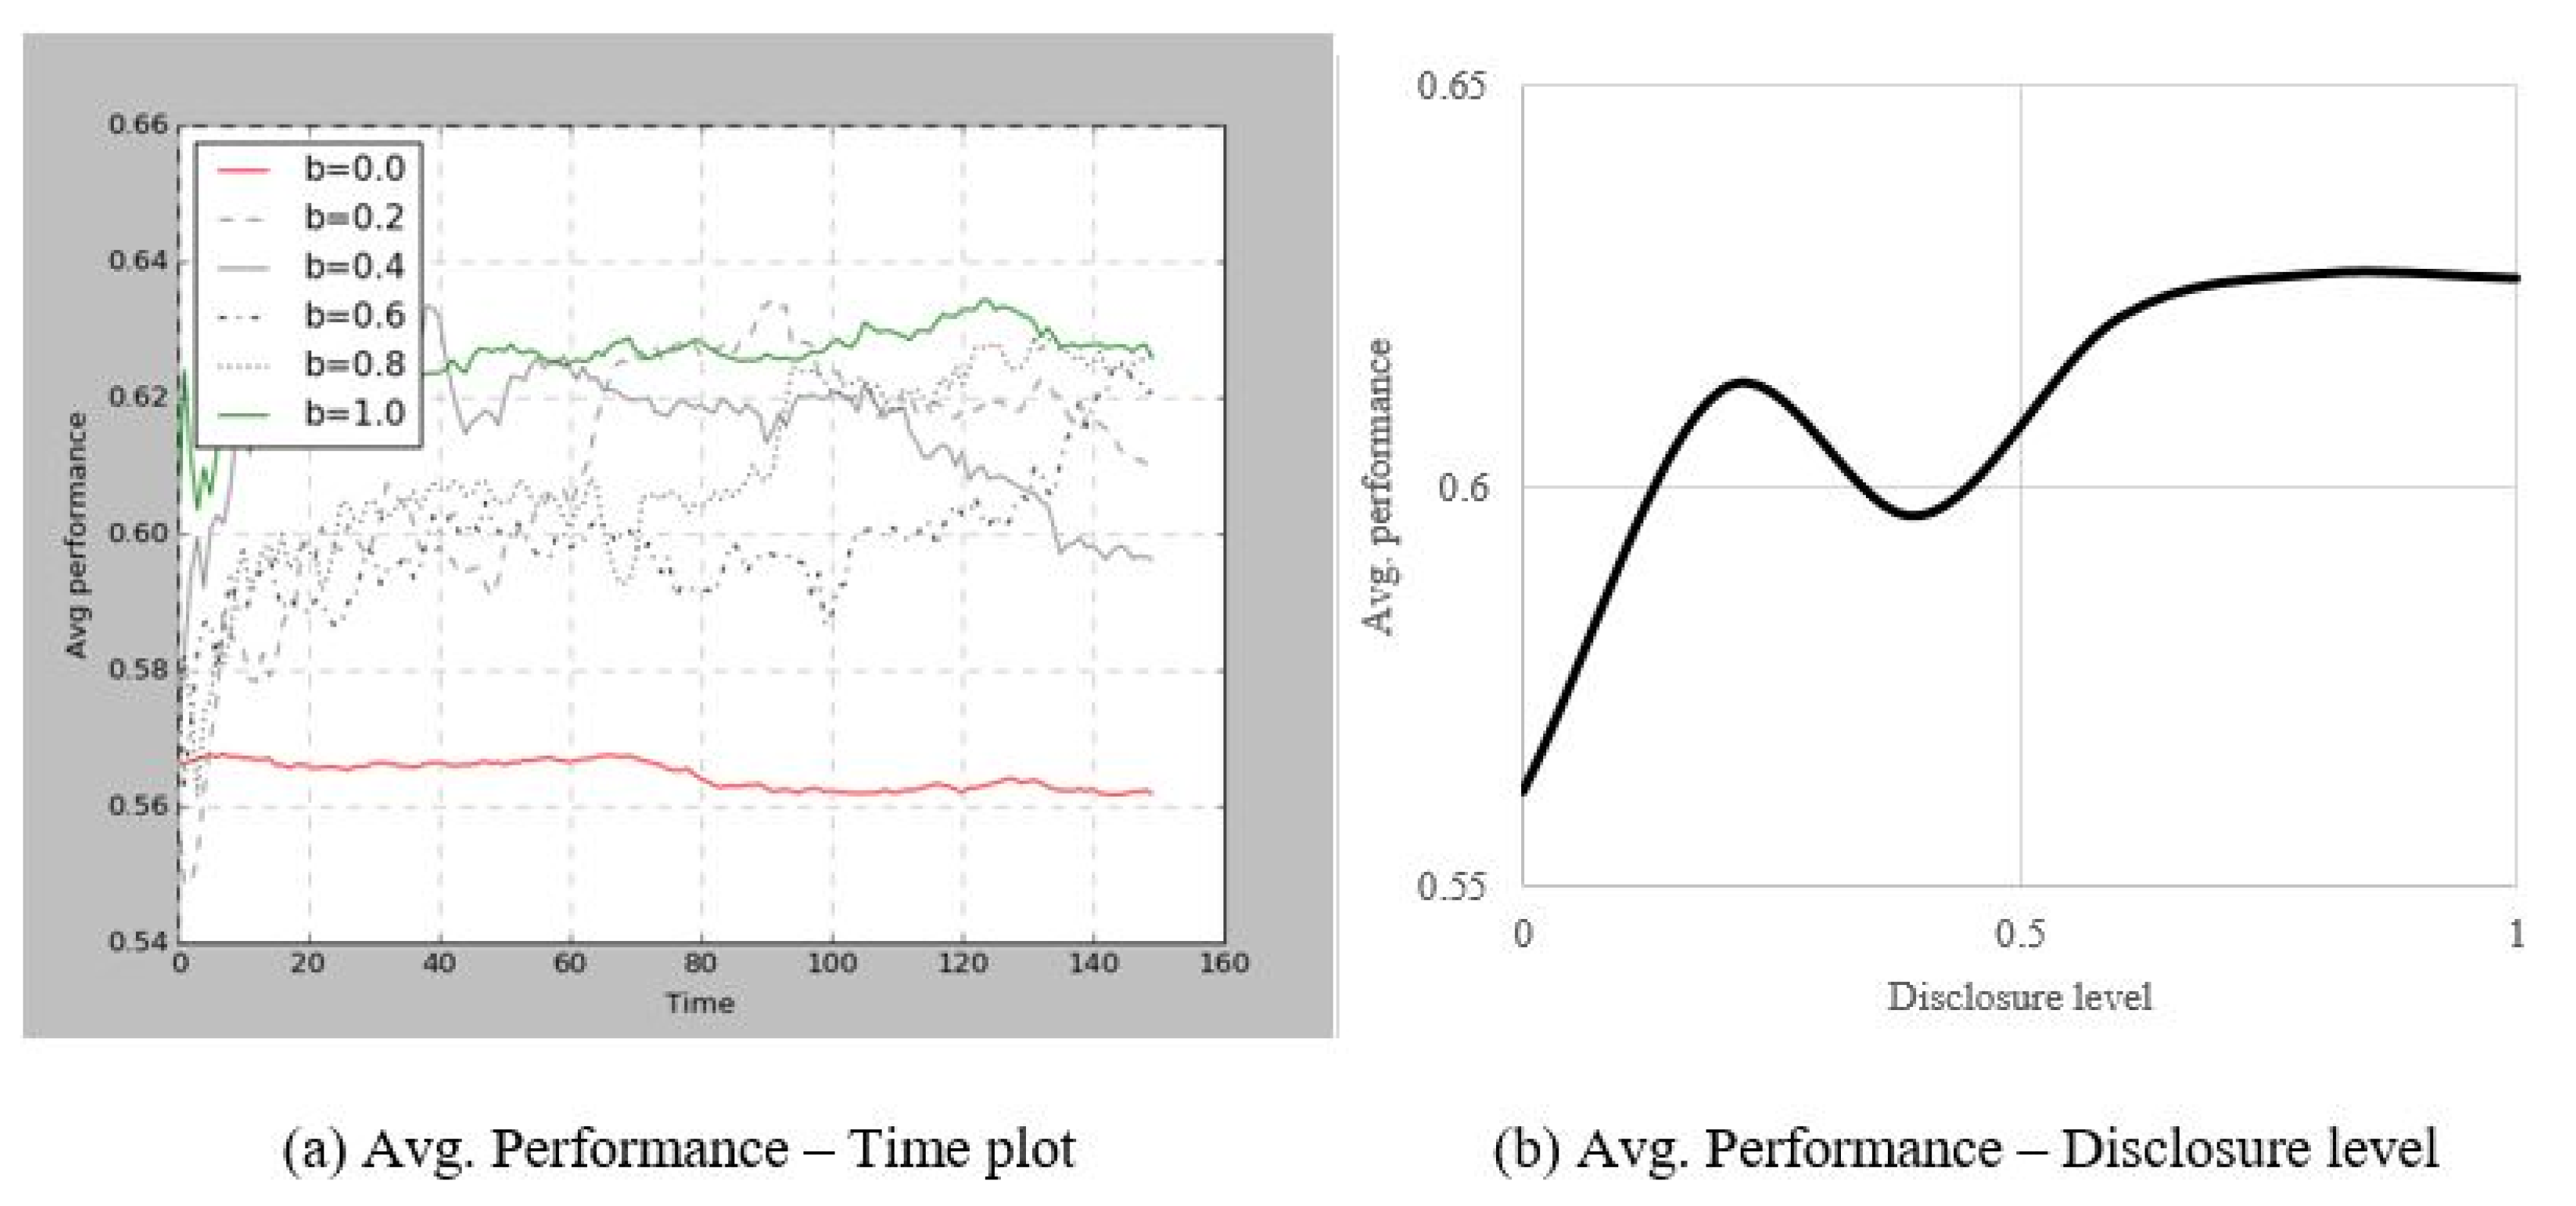
4.1. Average Performance

We captured relations between average performance and type of feedback policy with the changing of the degree of result sharing. According to results presented in Table 7, average performance of the ecosystem represents different patterns of feedback policy.

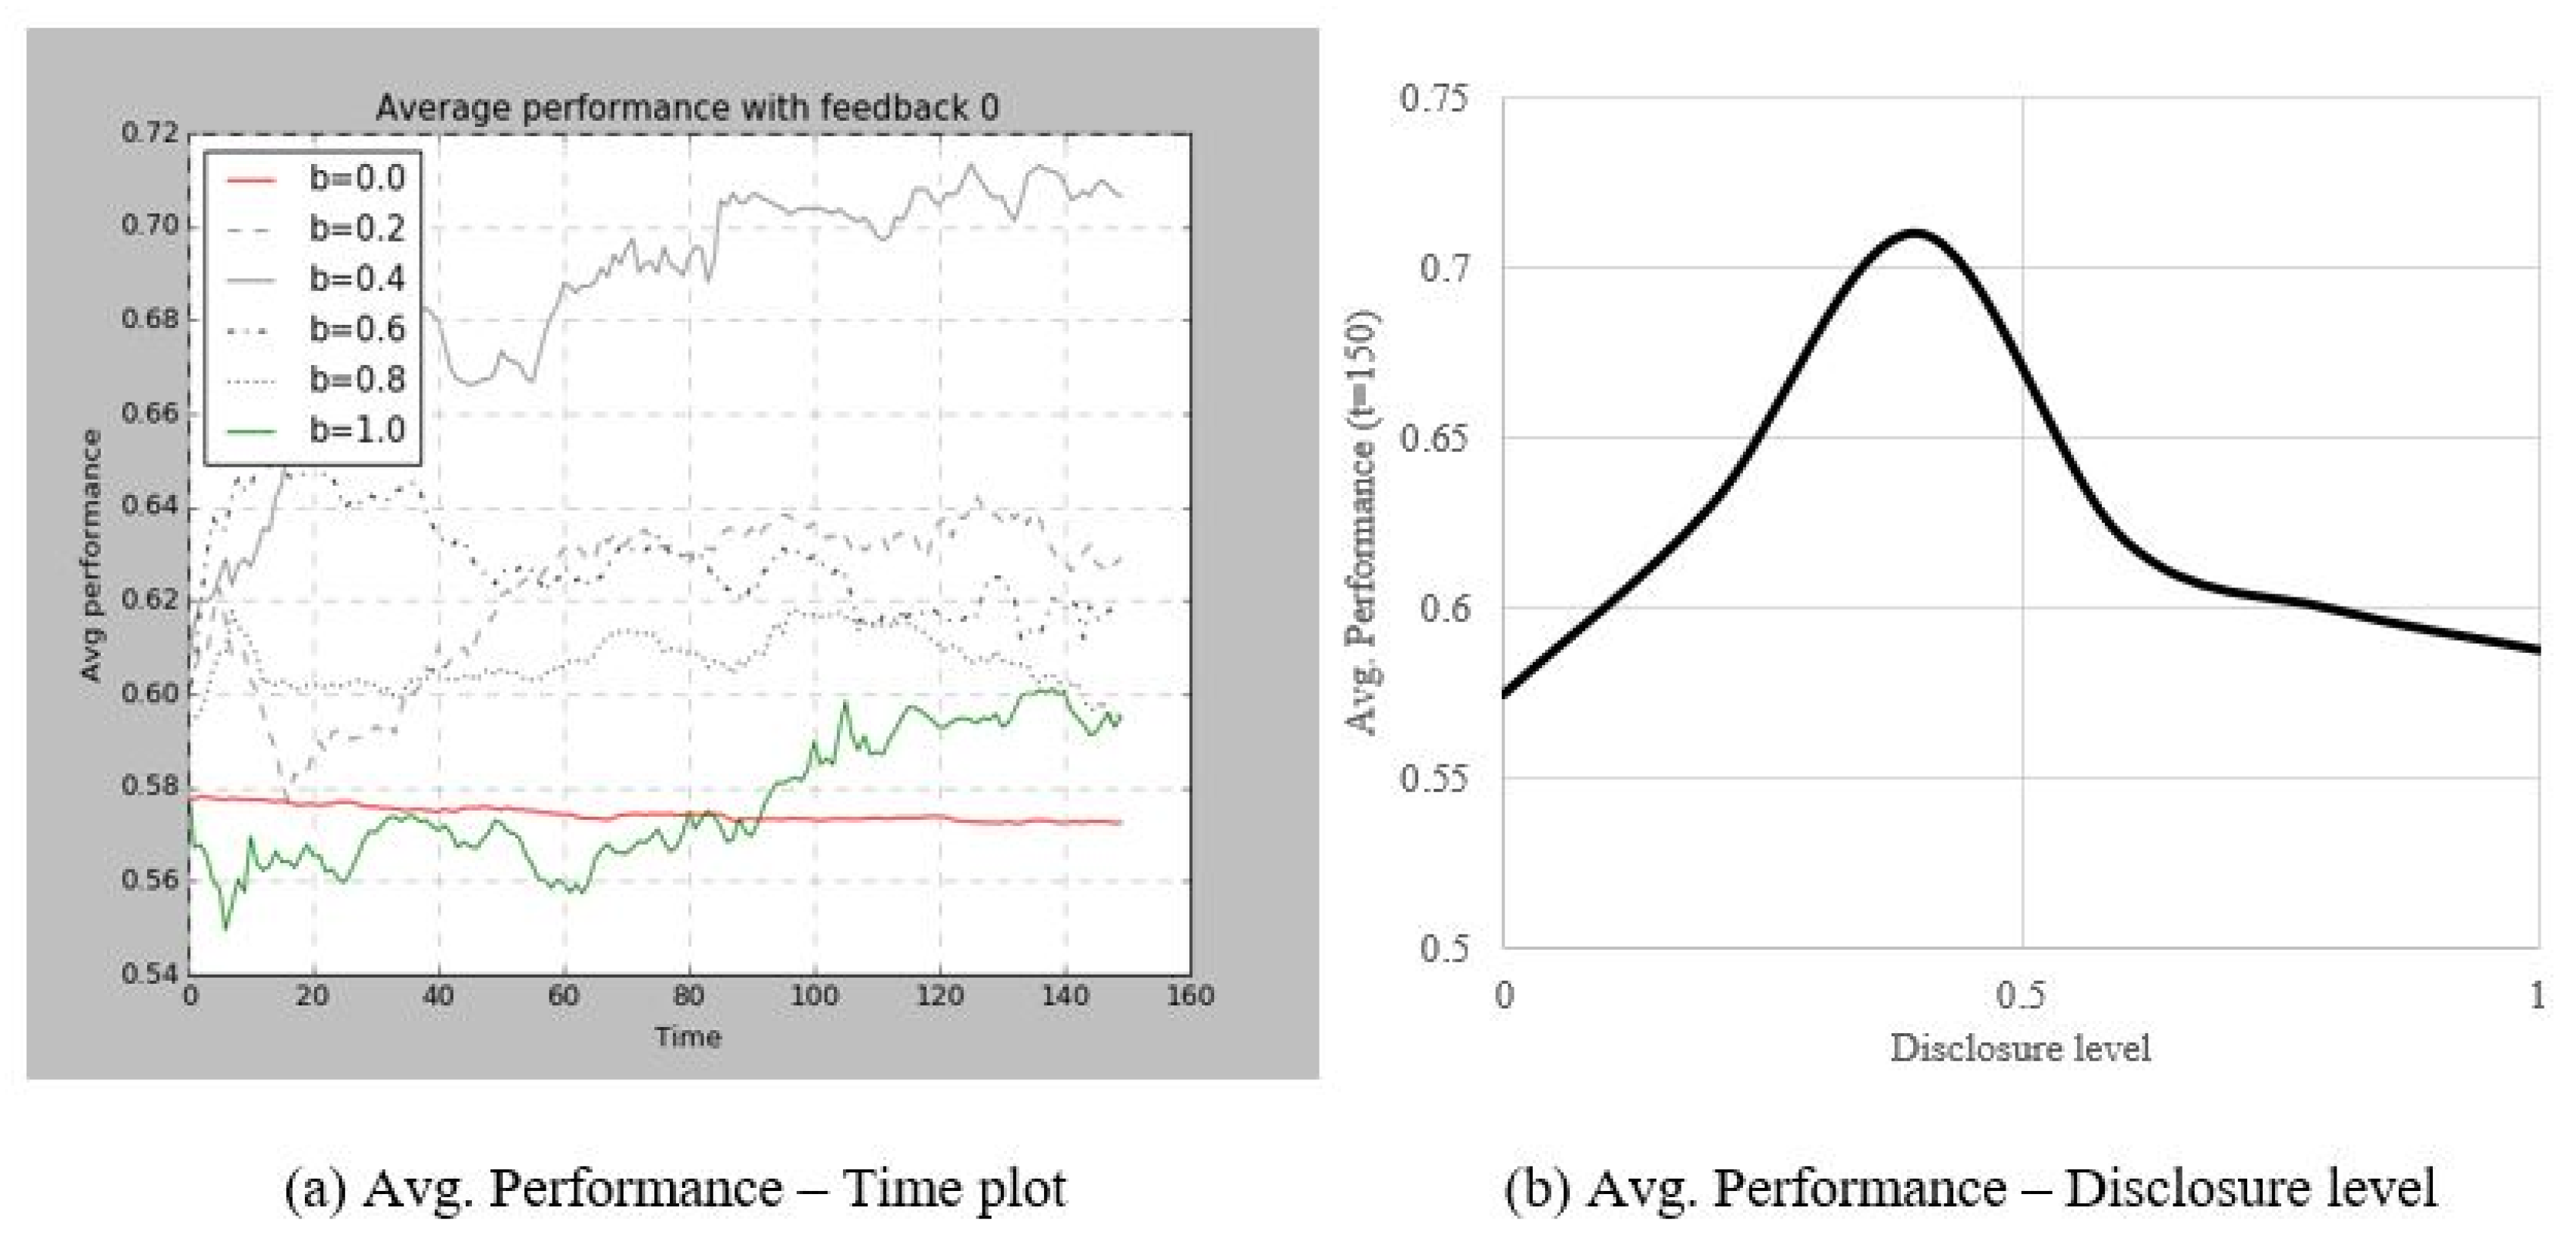
4.1.1. Experiment 1: No Policy

Under the “no feedback policy,” the average performance monotonically increases with the degree of result sharing. The reason is simple. If there is no evidence to choose a target organization, the learning behavior only depends on the sample size that can be actually used. However, unlike learning behavior involving new costs, situations without feedback do not bring any benefits to the institute. Thus, this result can be observed when institutes have other factors stimulating self-adjustment such as human resources [79] and culture [80], except feedback from the evaluation system.

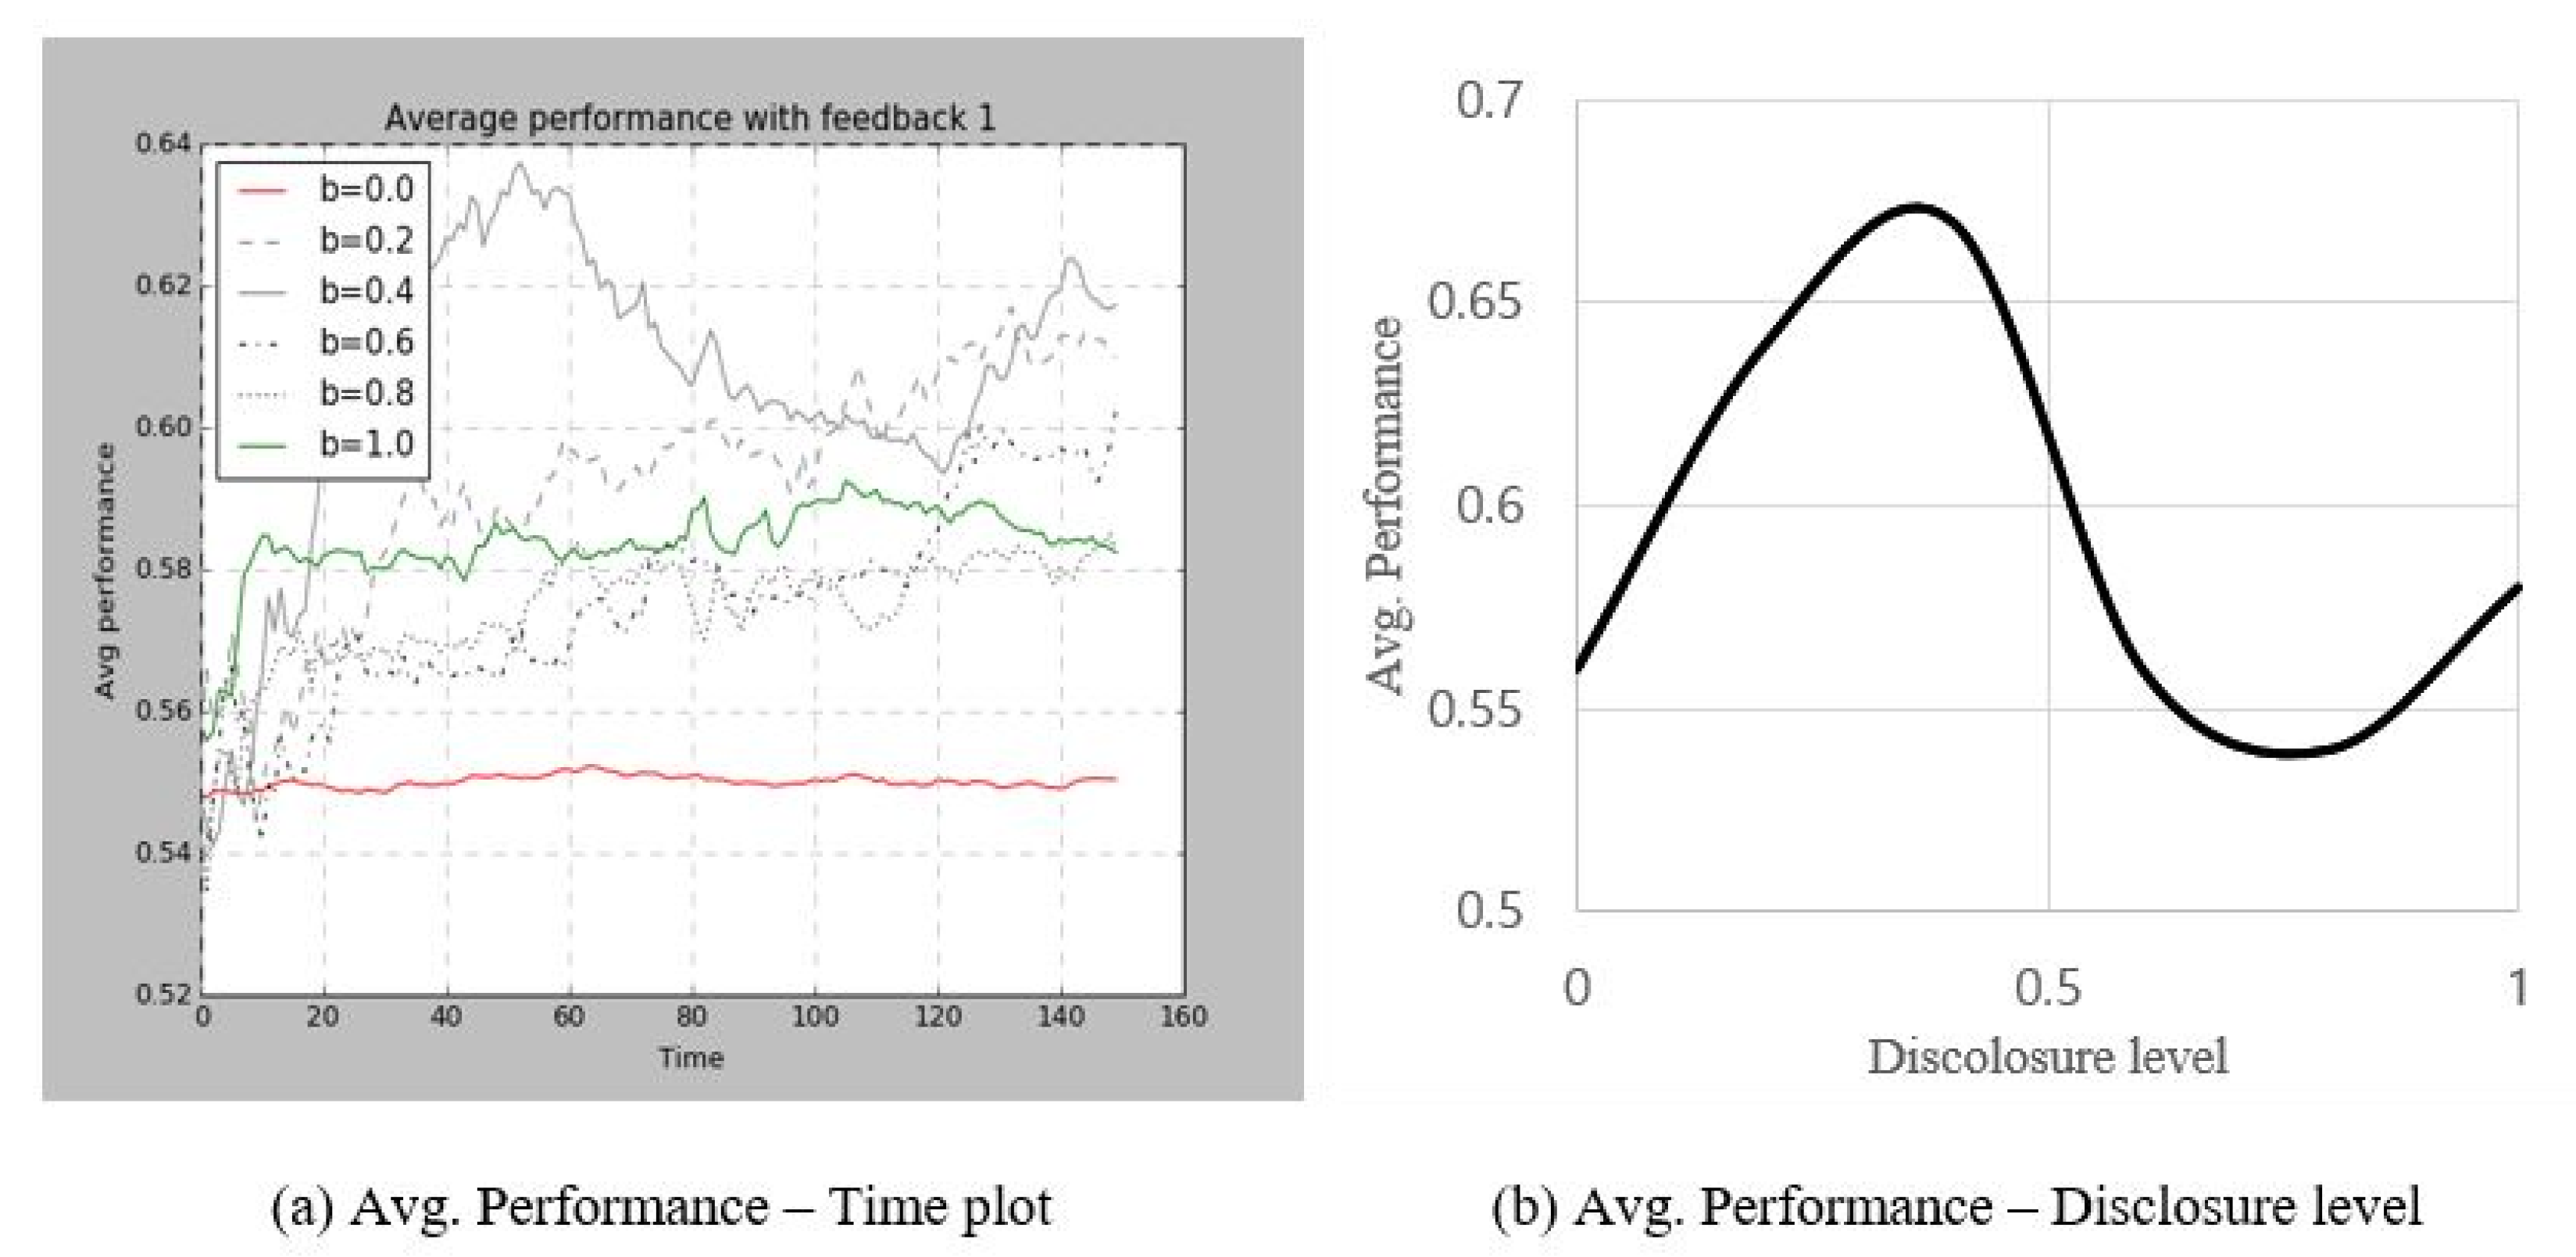
4.1.2. Experiment 2 and 3: Positive Feedback Policy

Both, the “positive feedback to high performance” model and “positive feedback to low performance” models show a rotated S-shape pattern similar to the sine graph. As positive feedback can be a catalyst in stimulating improvement in the ecosystem’s performance, each institute tries to learn from institutes that received better evaluations. In this context, providing assessment information increases the possibility that other institutions choose better institutions. Likewise, the higher the degree of sharing of evaluation results, the greater the size of samples available, and the more likely it is to select organizations with high performance institutes. However, since the perfect information of the assessment result saturates the GI ecosystem in the aspect of evolution, imperfect information is more effective to improve average performance in the long term. [74]. According to the result of our experiment, optimal sharing proportion is between 0.2 and 0.5. Relations between the sharing proportion and average performance show the same patterns regardless of performance of subjects who received positive feedback. In other words, positive feedback policy provides a rotated S-shaped pattern between sharing level of assessment and mean performance, once provided with positive feedback, regardless of whether grantees received excellent performances. Consequently, two conclusions from results of models which only embedded the positive feedback policy were found. One is a rotated S-shaped pattern between the degree of result sharing and average performance of GI ecosystem, and the other is a type of feedback that is more important than the excellence of the grantee.

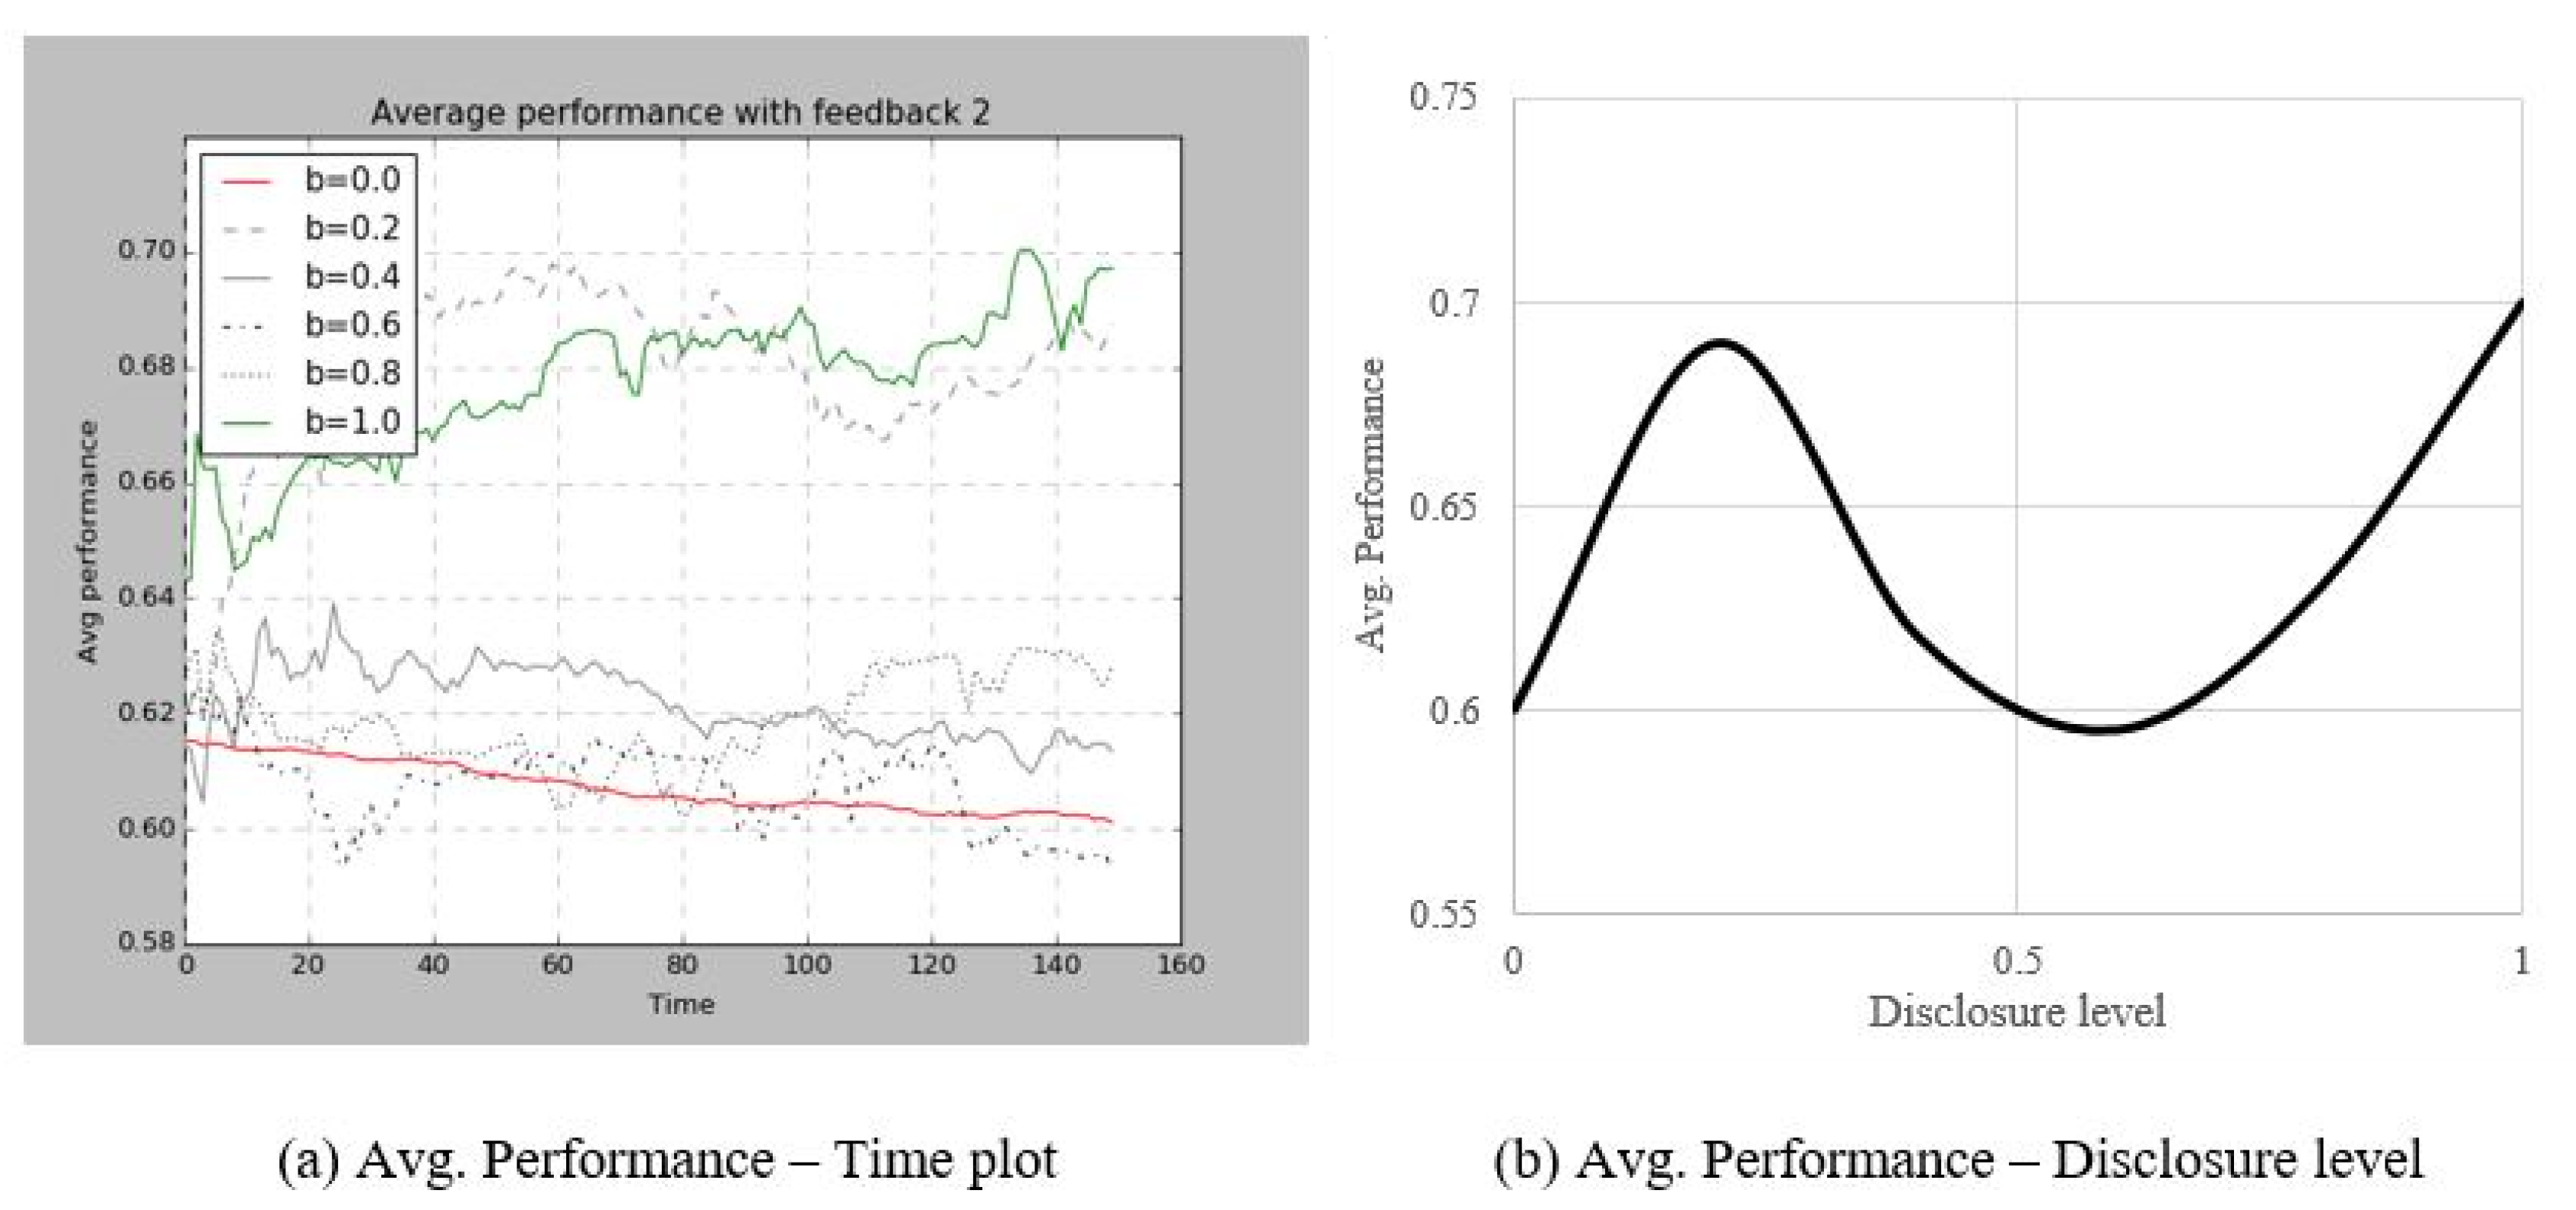
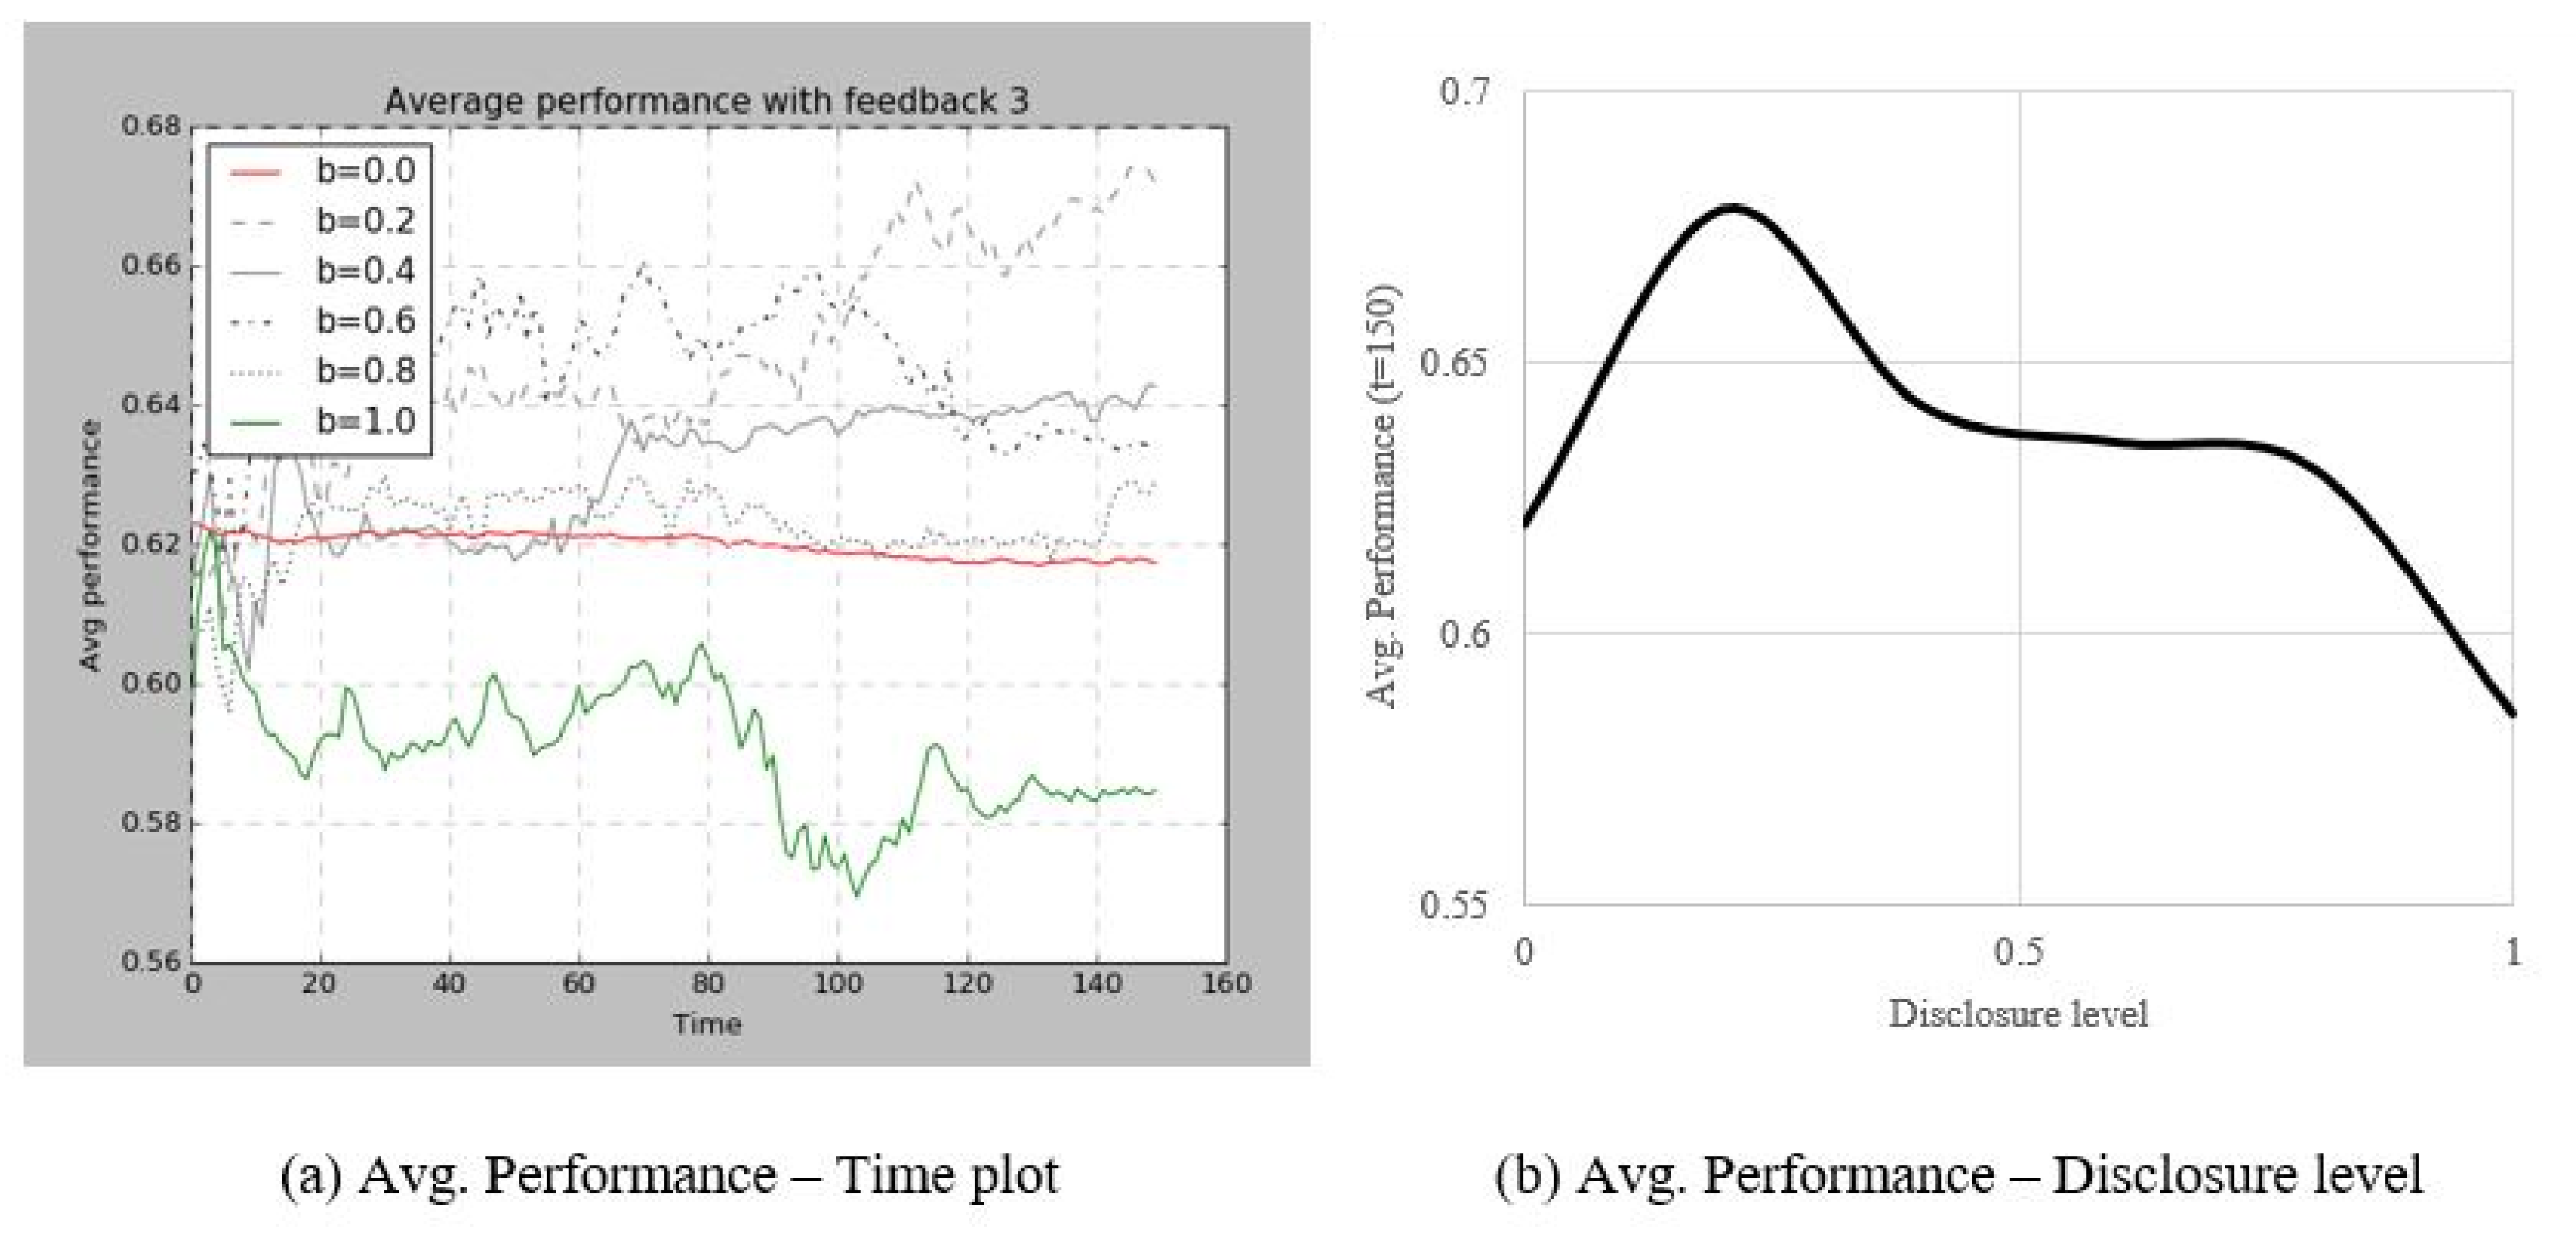
4.1.3. Experiment 4 and 5: Negative Feedback Policy

From Experiments 4 and 5, we captured the inverted U-shaped pattern. When negative feedback exists, an inverted U-shape relationship can occur between average performance and sharing level. This pattern of relationship refers to the result sharing proportion maximizing the average performance of the ecosystem that is located between 0 and 1. Therefore, we suggest that a moderate sharing level is more effective than an extreme sharing level when a “negative feedback policy” is adopted. In addition, this experiment provides evidence on the effect of simultaneous use of positive and negative feedback. The result shows that the effect of a “negative feedback policy” is more dominant than that of “positive feedback” as the same pattern emerges with the results of the “negative feedback policy” (Experiment 4).

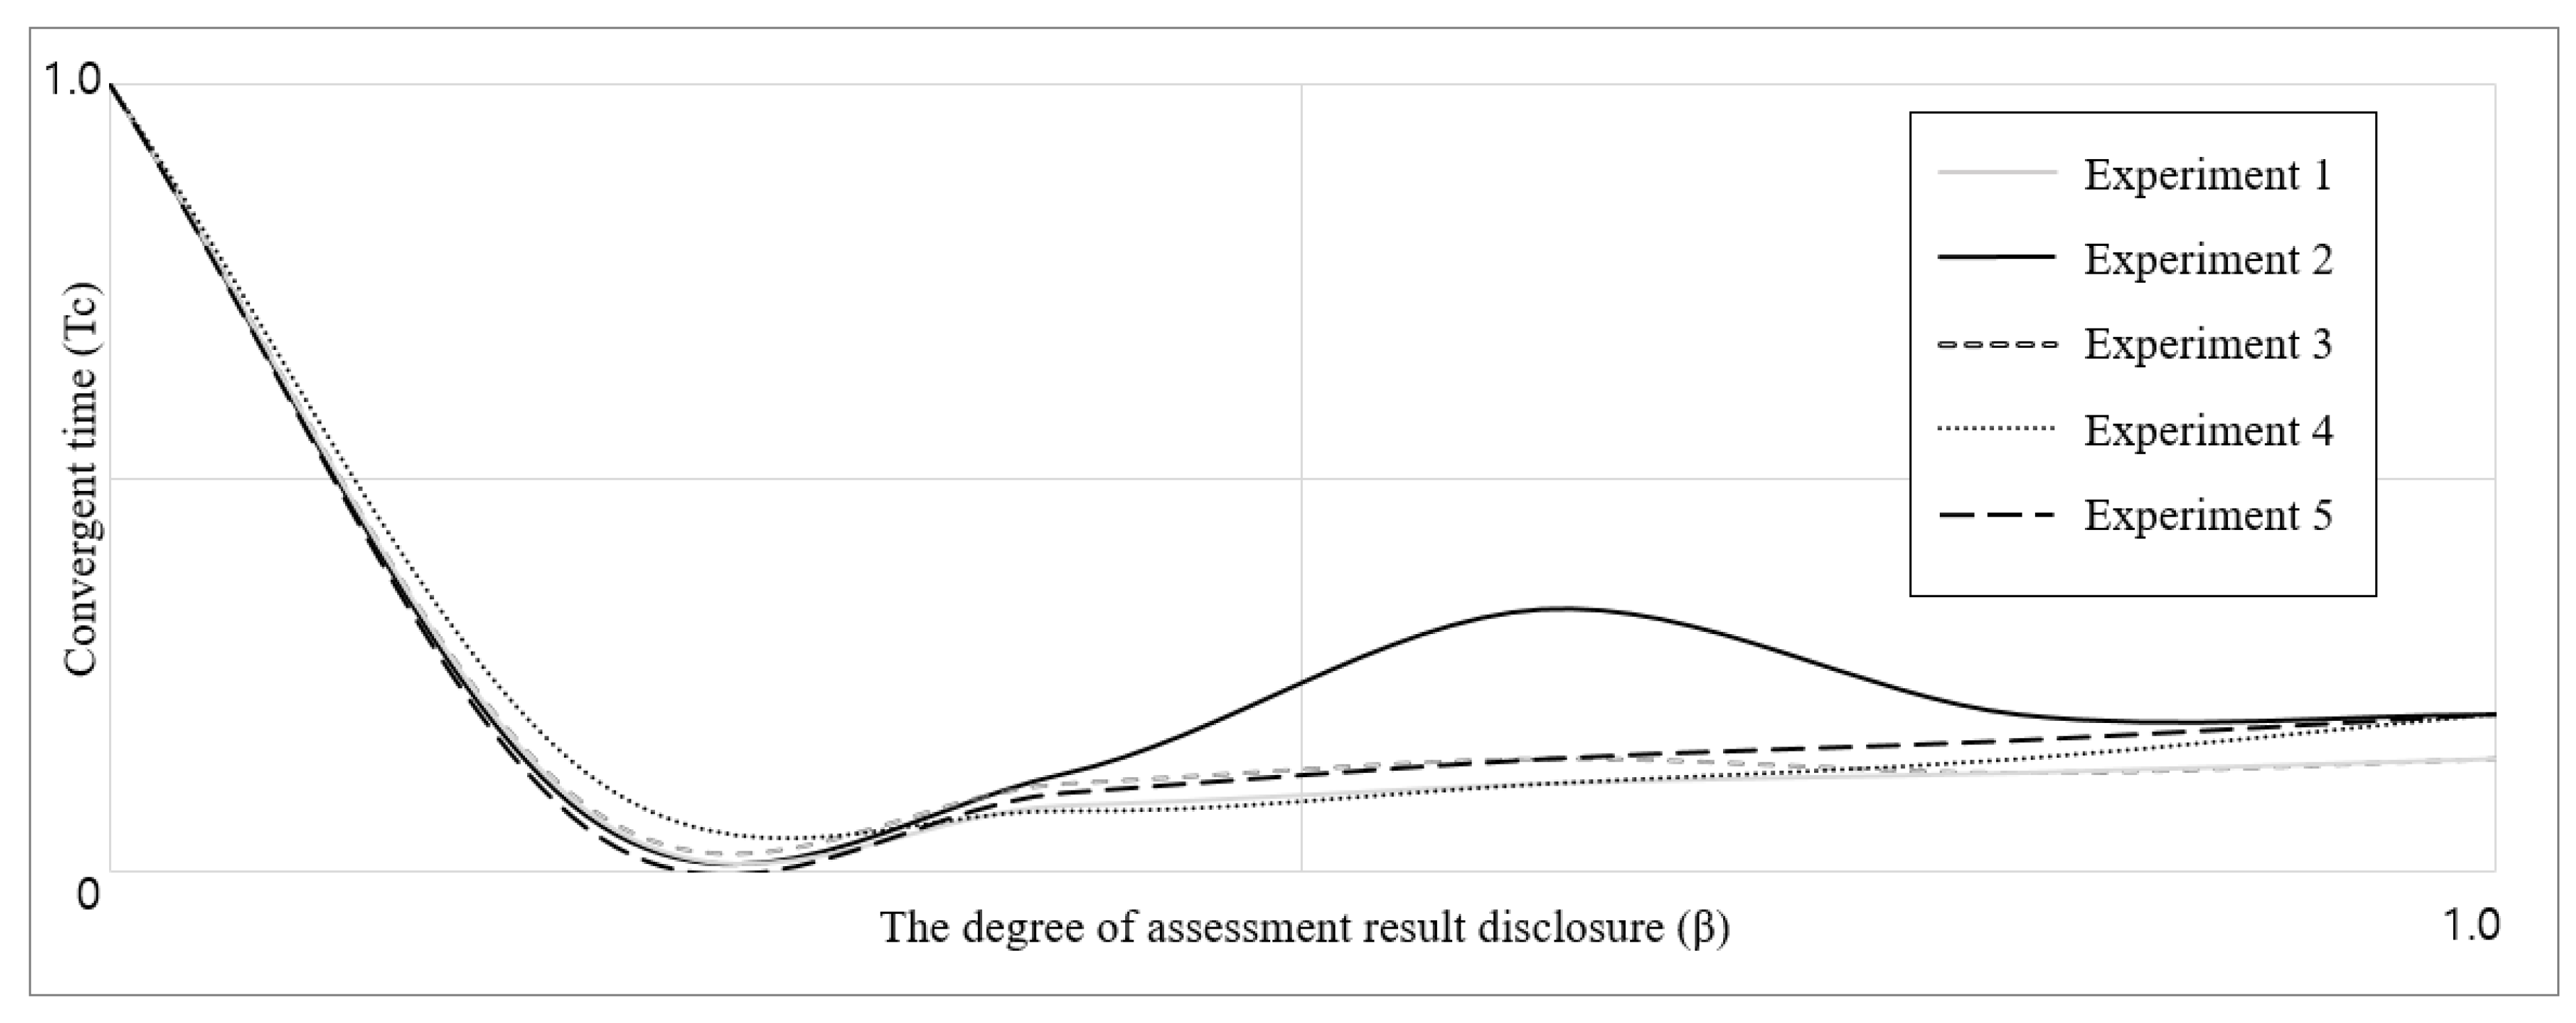
4.2. Convergence Time

Unlike results of the average performance of the ecosystem, convergence time of the GI ecosystem only relies on the degree of assessment result sharing. This result is summarized in Table 8. Indeed, a decrease in diversity of an evolutionary system is an inevitable phenomenon without powerful external interventions. The convergence time, which indicates time taken for diversity to converge, is rapidly shortened as the degree of sharing increases.
There are two interpretations of shorter convergence time. Firstly, diversity of the GI ecosystem has a higher probability to not be undermined. Maintaining diversity of ecosystems guarantees stability of the system from unexpected changes in the external environment as well as loss of current knowledge. Preservation of system diversity also increases likelihood of emerging new knowledge in the ecosystem, which may lead to improved decisions. GI ecosystem in experiments maintains quantitative diversity in the very low result sharing level According to Figure A2 in Appendix A, the diversity of GI ecosystem is highest when the degree of result disclosure (β) is 0. If the rate of openness is under 0.2, diversity begins to decrease sharply and shows similar levels of quantitative diversity in the rest of the domain. Results of convergence time show that it is hard to maintain high diversity of GI ecosystem except in the range with low degrees of result sharing. However, the loss of diversity when seeking optimum solutions is natural, so the present study emphasizes another aspect to interpret short convergence times. The second implication of the experiment result refers to the possibility of an efficient learning process. The efficiency of organizational learning is a crucial factor because it is difficult to repeat enough organizational learning processes in the actual GI ecosystem, such as in the current model of research. The short convergence time in this study model means that the GI ecosystem reaches its optimal state quickly. Figure 3 shows a relatively short convergence time when the degree of result sharing is higher than 0.2 (β > 0.2). Therefore, the GI ecosystem is efficient at the most openness proportion (β > 0.2), and the inefficiency of the learning process is observed only at a low degree of assessment result sharing.

5. Discussion and Conclusions

It was previously rare to develop policies that considered the influence of feedback type and sharing level in regard to assessment results. Likewise, assessment systems of GIs in Korea have seldom considered systematic or multi-dimensional perspectives for the effect of the result sharing level and type of the feedback policy. Hence, this study aims to determine the effect of changing feedback policy and the degree of result sharing on the average performance and diversity of GI ecosystems. Ultimately, several practical strategies are suggested based on results of ABM experiments. Based on results of five experiments, this study proposes a practical method to enhance the effectiveness of the assessment system of organizations with similar goals in terms of feedback type and sharing levels of assessment results.
According to experiments in this study, switching types of feedback policy transform unique patterns between degrees of disclosing assessment results and average performance of GI ecosystems. With the exception of Experiment 1 (no policy), the middle level of result sharing is likely to maximize average performances rather than extreme levels. Relatively, positive feedback is likely to decrease optimum levels of result sharing as compared to negative feedback. The result of this study shows that there is no absolutely dominant strategy. This is a different argument compared to previous studies that emphasized the effect of negative feedback [54,56,57,60].
When an organization adopts positive feedback policy, two types of strategies can be considered. The first strategy shares complete results of assessments to all participants and can provide transparency of the assessment system, mutual trust, and reliability towards the GI assessment system. Due to this advantage, a broader range of learning objectives are acquired, and the probability of discovering optimal target institutes in a specific time period increases. Contrary to this method, another strategy uses a low ratio of result sharing. Indeed, fluctuation in the environment requires a new capability that was not crucial in the past. However, the current metric of the GI assessment system may not include all factors, which must be evaluated. From the perspective of handling uncertainty of future environments, providing only a part of the sample is necessary to preserve the potentially beneficial attributes that each GI possesses.
The GI assessment system in Korea has applied both negative and positive incentive policies utilizing fully opened assessment results. As aforementioned, the Korean GI assessment system can be improved by changing either the type of feedback policy or the degree of result openness. At first, since the effect of negative incentive is dominant, mixed feedback policy shows a similar trend to the negative one as seen in the previous experiment 3. If the government only focuses on the aspect of the performance, it is effective to change the current policy based on the result of Experiment 5 in the present study. However, transparency should be handled carefully because it determines external acceptance of the GI assessment system. Consequently, this strategic decision making entails a dilemma between transparency and effectiveness. When the government decreases sharing rates of assessment results to maximize performance, the monitoring function of assessment systems will be weakened. In other words, smooth acceptance of policies is threatened by lack of transparency. However, another strategy is possible to maintain the sharing level and to choose “positive feedback to high performance” feedback type. Although this is not the best solution in the context of efficiency, transparency toward GIs can thus be acquired. From the perspective of GIs, this alternative can resolve cognitive threat of unfair disclosure of results. This strategy is effective in improving social trust and acceptance of the evaluation system, jeopardizing some improvements in organizational performance. However, absence of negative feedback may not only abate the power of correction and tangible effectiveness but also lead to inefficient exploration of an optimal solution. Of course, we can consider the “negative feedback to low-performance group” policy as another solution, but this type of policy is realistically difficult. If new feedback or self-motivation are not provided, each GI makes an effort to lower its own performance to minimize costs. Table 9 describes the summarization of these strategies.
Despite theoretical contributions of this study, empirical evidence of the feedback theory is required. In fact, experiments based on computer simulation have an advantage on prediction of social phenomenon and analysis on the basis of complex adaptive systems [81,82]. However, simulation methodology is not suitable to verify and generalize existing theories. This study has a similar limitation. Future studies should focus on ex-post analysis, such as real-world case studies or empirical analyses. Further practical research will provide more implementable solutions. It is thus important to figure out the exact point of result sharing ratio to maximize objective functions such as sales, patents, knowledge, and products.

Author Contributions

Conceptualization, N.C. and J.H.; methodology, N.C.; validation, E.K.; literature review, N.C. and E.K.; writing—original draft preparation, N.C.; writing—review and editing, E.K. and J.H.; supervision, J.H.

Funding

This research received no external funding.

Conflicts of Interest

The authors declare no conflict of interest.

Appendix A

Figure A1. Average performance result of ‘no feedback policy’ condition model.
Joitmc 05 00066 g0a1
Figure A2. Average performance result of ‘positive feedback to high-performed group’ condition model.
Joitmc 05 00066 g0a2
Figure A3. Average performance result of ‘positive feedback to low-performed group’ condition model.
Joitmc 05 00066 g0a3
Figure A4. Average performance result of ‘negative feedback to low-performed group’ condition model.
Joitmc 05 00066 g0a4
Figure A5. Average performance result of ‘positive feedback to high-performed group and negative feedback to low-performed group’ condition model.
Joitmc 05 00066 g0a5
Figure A6. Changes of ecosystem’s diversity over time.
Joitmc 05 00066 g0a6

References

  1. Pavitt, K. The Social Shaping of the National Science Base. Res. Policy. 1998, 27, 793–805. [Google Scholar] [CrossRef]
  2. Kim, E.; Lee, D.; Kim, J.H. How Collaboration Networks Affect Innovation in Korea’s Information and Communication Technology Industry in the Era of Internet of Things. Asian J. Technol. Innov. 2016, 24, 201–221. [Google Scholar] [CrossRef]
  3. Gang, K.W.; Abetti, P.A. The Global Competitiveness of South Korea: The Role of Government-Funded Research Institutes. World Rev. Sci. Technol. Sustain. Dev. 2010, 8, 1–28. [Google Scholar] [CrossRef]
  4. Bourgeois, I.; Whynot, J.; Thériault, É. Application of an Organizational Evaluation Capacity Self-Assessment Instrument to Different Organizations: Similarities and Lessons Learned. Eval. Program Plann. 2015, 50, 47–55. [Google Scholar] [CrossRef]
  5. Kim, E.; Kim, S.; Kim, H. Development of an Evaluation Framework for Publicly Funded R&D Projects: The Case of Korea’s Next Generation Network. Eval. Program Plann. 2017, 63, 18–28. [Google Scholar]
  6. Downs, G.W.; Larkey, P.D. The Search for Governement Efficiency: From Hubris to Helplessness; Random House: New York, NY, USA, 1986. [Google Scholar]
  7. Osborne, D.; Gaebler, T. Reinventing Government: How the Entrepreneurial Spirit Is Transforming Government; Adison Wesley: Boston, MA, USA, 1992. [Google Scholar]
  8. Rhydderch, M.; Edwards, A.; Elwyn, G.; Marshall, M.; Engels, Y.; Van Den Hombergh, P.; Grol, R. Organizational Assessment in General Practice: A Systematic Review and Implications for Quality Improvement. J. Eval. Clin. Pract. 2005, 11, 366–378. [Google Scholar] [CrossRef]
  9. Matsui, T.; Okada, A.; Inoshita, O. Mechanism of Feedback Affecting Task Performance. Organ. Behav. Hum. Perform. 1983, 31, 114–122. [Google Scholar] [CrossRef]
  10. Salmoni, A.W.; Schmidt, R.A.; Walter, C.B. Knowledge of Results and Motor Learning: A Review and Critical Reappraisal. Psychol. Bull. 1984, 95, 355–386. [Google Scholar] [CrossRef]
  11. Schmidt, A.M.; Dolis, C.M. Something’s Got to Give: The Effects of Dual-Goal Difficulty, Goal Progress, and Expectancies on Resource Allocation. J. Appl. Psychol. 2009, 94, 678–691. [Google Scholar] [CrossRef]
  12. Ilgen, D.R.; Fisher, C.D.; Taylor, M.S. Consequences of Individual Feedback on Behavior in Organizations. J. Appl. Psychol. 1979, 64, 349–371. [Google Scholar] [CrossRef]
  13. Reichheld, F. The Ultimate Question; Harvard Business School Press: Boston, MA, USA, 2006. [Google Scholar]
  14. Ashford, S.J.; Northcraft, G.B. Conveying More (or Less) than We Realize: The Role of Impression-Management in Feedback-Seeking. Organ. Behav. Hum. Decis. Process. 1992, 53, 310–334. [Google Scholar] [CrossRef]
  15. Choi, Y.; Beg, J. Evaluating Government Research Institutes: Developing an Exploratory, Research-Centered Model for Applying the Balanced Score Cards Method. J. Gov. Study 2006, 12, 163–193. [Google Scholar] [CrossRef]
  16. Kong, B. Explanatory Research on Governmental Institute Assessement Policy. Korean Repub. Adm. Rev. 2003, 12, 147–176. [Google Scholar]
  17. Lee, B.; Yoon, S.A. Study on Positive Application of the Evaluating Method of R & D Organizations. Korean Soc. Innov. Manag. Econ. 2001, 3, 133–154. [Google Scholar]
  18. Lee, S.; Lee, H. Measuring and Comparing the R&D Performance of Government Research Institutes: A Bottom-up Data Envelopment Analysis Approach. J. Informetr. 2015, 9, 942–953. [Google Scholar]
  19. Rho, W.J.; Rno, S.P.; Kim, T.I. A Study of Modeling the Evaluation System of Public Research Institutes. Korean Repub. Adm. Rev. 1996, 5, 30–54. [Google Scholar]
  20. Yi, C. Application of Intellectual Capital Model to the Evaluation System on Public Research Institutes. Korean Repub. Adm. Rev. 2005, 39, 195–217. [Google Scholar]
  21. Alvero, A.M.; Bucklin, B.R.; Austin, J. Performance Feedback in Organizational Settings (1985–1998) An Objective Review of the Effectiveness and Essential Characteristics of Performance Feedback in Organizational Settings. J. Organ. Behav. Manag. 2001, 21, 3–29. [Google Scholar]
  22. Kluger, A.N.; DeNisi, A. Effects of Feedback Intervention on Performance: A Historical Review, a Meta-Analysis, and a Preliminary Feedback Intervention Theory. Psychol. Bull. 1996, 119, 254–284. [Google Scholar] [CrossRef]
  23. Dodgson, M. Organizational Learning: A Review of Some Literatures. Organ. Stud. 1990, 14, 375–394. [Google Scholar] [CrossRef]
  24. Park, J.; Jeong, S.; Yoon, Y.; Lee, H. The Evolving Role of Collaboration in Developing Scientific Capability: Evidence from Korean Government-Supported Research Institutes. Sci. Public Policy 2015, 42, 255–272. [Google Scholar] [CrossRef]
  25. Oh, Y.A. Study of the Factors Influencing Acceptance of Evaluation of Government-Funded Research Institutions. Korean J. Public Adm. 2015, 9, 151–170. [Google Scholar]
  26. Kim, M.A. Critical Examination of Evaluating Korean Central Government Agencies. Korean Adm. Policy Anal. Eval. 2003, 13, 1–21. [Google Scholar]
  27. Hwang, B.; Kang, K. Meta-Evaluation of the Government Funded Research Institute Assessment System. In Summer Conference of Korean Public Administraion Review. 2004. Available online: http://www.dbpia.co.kr/journal/articleDetail?nodeId=NODE06710643 (accessed on 19 August 2019).
  28. Son, H. A Study on Establishment of a Performance Based Evaluation System for the Government-Supported Research Institutes (GSRIs) in Korea. Audit Insp. 2007, 12, 73–106. [Google Scholar]
  29. Hwang, B.; Bae, E.; Hong, H.; Kim, D. Operational-Efficiency Improvement of Public R and D Management Agencies in South Korea. J. Open Innov. Technol. Mark. Complex. 2019, 5, 13. [Google Scholar] [CrossRef]
  30. Jang, H.; Park, J. Institute Size Effect Analysis on the Management Performance of the Public Institute. Korean Public Adm. Rev. 2015, 24, 1–25. [Google Scholar]
  31. Ruiz-Martin, C.; Paredes, A.L.; Wainer, G.A. Applying Complex Network Theory to the Assessment of Organizational Resilience. IFAC-PapersOnLine 2015, 28, 1224–1229. [Google Scholar] [CrossRef]
  32. Ammons, R.B. Effects of Knowledge of Performance: A Survey and Tentative Theoretical Formulation. J. Gen. Psychol. 1956, 54, 279–299. [Google Scholar] [CrossRef]
  33. Forss, K.; Cracknell, B.; Samset, K. Can Evaluation Help an Organization to Learn? Eval. Rev. 1994, 18, 574–591. [Google Scholar] [CrossRef]
  34. Balcazar, F.; Hopkins, B.L. A Critical, Objective Review of Performance Feedback. J. Organ. Behav. Manag. 1985, 7, 65–89. [Google Scholar] [CrossRef]
  35. Bandura, A.L. Self-Efficay: Toward a Unifying Theory of Behavioral Change. Psychol. Rev. 1977, 84, 191–215. [Google Scholar] [CrossRef]
  36. Carver, C.S.; Scheier, M.F. Control Theory: A Useful Conceptual Framework for Personality-Social, Clinical, and Health Psychology. Psychol. Bull. 1982, 92, 111–135. [Google Scholar] [CrossRef]
  37. Igbaria, M.; Zinatelli, N.; Cragg, P.; Cavaye, A.L.M.; Street, W.G. Personal Computing Acceptance Factors in Small Firms: A Structural Equation. MIS Q. 1997, 21, 279–305. [Google Scholar] [CrossRef]
  38. Ilies, R.; Judge, T.A. Goal Regulation across Time: The Effects of Feedback and Affect. J. Appl. Psychol. 2005, 90, 453–467. [Google Scholar] [CrossRef]
  39. Locke, E.A.; Latham, G.P. A Theory of Goal Setting & Task Performance; Prentice-Hall: Upper Saddle River, NJ, USA, 1990. [Google Scholar]
  40. Ashford, S.J.; Cummings, L.L. Feedback as an Individual Resource: Personal Strategies of Creating Information. Organ. Behav. Hum. Perform. 1983, 32, 370–398. [Google Scholar] [CrossRef]
  41. Levy, P.E.; Albright, M.D.; Cawley, B.D.; Williams, J.R. Situational and Individual Determinants of Feedback Seeking: A Closer Look at the Process. Organ. Behav. Hum. Decis. Process. 1995, 62, 23–37. [Google Scholar] [CrossRef]
  42. Hanna, A.; Wells, C.; Maurer, P.; Friedland, L.; Shah, D.; Matthes, J. Partisan Alignments and Political Polarization Online: A Computational Approach to Understanding the French and US Presidential Elections. In Proceedings of the 2nd Workshop on Politics, Elections and Data; ACM: New York, NY, USA, 2013; pp. 15–22. [Google Scholar]
  43. Tafkov, I.D. Private and Public Relative Performance Information under Different Compensation Contracts. Account. Rev. 2012, 88, 327–350. [Google Scholar] [CrossRef]
  44. Hannan, R.L.; McPhee, G.P.; Newman, A.H.; Tafkov, I.D. The Effect of Relative Performance Information on Performance and Effort Allocation in a Multi-Task Environment. Account. Rev. 2012, 88, 553–575. [Google Scholar] [CrossRef]
  45. Becker, L.J. Joint Effect of Feedback and Goal Setting on Performance: A Field Study of Residential Energy Conservation. J. Appl. Psychol. 1978, 63, 428–433. [Google Scholar] [CrossRef]
  46. Hogg, M.A.; Hains, S.C. Friendship and Group Identification: A New Look at the Role of Cohesiveness in Groupthink. Eur. J. Soc. Psychol. 1998, 28, 323–341. [Google Scholar] [CrossRef]
  47. Mento, A.J.; Steel, R.P.; Karren, R.J. A Meta-Analytic Study of the Effects of Goal Setting on Task Performance: 1966-1984. Organ. Behav. Hum. Decis. Process. 1987, 39, 52–83. [Google Scholar] [CrossRef]
  48. Sprinkle, G.B. The Effect of Incentive Contracts on Learning and Performance. Account. Rev. 2000, 75, 299–326. [Google Scholar] [CrossRef] [Green Version]
  49. Matsui, T.; Okada, A.; Mizuguchi, R. Expectancy Theory Prediction of the Goal Theory Postulate, “The Harder the Goals, the Higher the Performance”. J. Appl. Psychol. 1981, 66, 54–58. [Google Scholar] [CrossRef]
  50. Simon, D.; Knie, A. Can Evaluation Contribute to the Organizational Development of Academic Institutions? An International Comparison. Eval. Rev. 2013, 19, 402–418. [Google Scholar] [CrossRef]
  51. Kang, K.; Kang, K.; Oah, S.; Oah, S.; Dickinson, A.M. The Relative Effects of Different Frequencies of Feedback on Work Performance. J. Organ. Behav. Manage. 2005, 23, 21–53. [Google Scholar] [CrossRef]
  52. Bohn, R. Stop Fighting Fires. Havard Bus. Rev. 2000, 78, 82–91. [Google Scholar]
  53. Lurie, N.H.; Swaminathan, J.M. Is Timely Information Always Better? The Effect of Feedback Frequency on Decision Making. Organ. Behav. Hum. Decis. Process. 2009, 108, 315–329. [Google Scholar] [CrossRef]
  54. Anderson, N.H. Foundations of Information Integration Theory; Academic Press: Cambridge, MA, USA, 1981. [Google Scholar]
  55. Hair, J.F.; Black, W.C.; Babin, B.J.; Anderson, R.E. Multivariate Data Analysis; Prentice Hall: Upper Saddle River, NJ, USA, 2006. [Google Scholar]
  56. Peeters, G.; Czapinski, J. Positive-Negative Asymmetry in Evaluations: The Distinction between Affective and Informational Negativity Effects. Eur. Rev. Soc. Psychol. 1990, 1, 33–60. [Google Scholar] [CrossRef]
  57. Stanton, M.; Amsel, A. Adjustment to Reward Reduction (but No Negative Contrast) in Rats 11, 14, and 16 Days of Age. J. Comp. Physiol. Psychol. 1980, 94, 446–458. [Google Scholar] [CrossRef]
  58. Kahneman, D.; Tversky, A. Prospect Theory: An Analysis of Decision under Risk Author(s): Daniel Kahneman and Amos. Tver. Source. 2014, 47, 263–292. [Google Scholar]
  59. Carpenter, J.P. Punishing Free-Riders: The Role of Monitoring-Group Size, Second-Order Free-Riding and Coordination; Middlebury College: Bonn, Germany, 2000. [Google Scholar]
  60. Dickinson, D.L. The Carrot vs. the Stick in Work Team Motivation. Exp. Econ. 2001, 4, 107–124. [Google Scholar] [CrossRef]
  61. Eldenburg, L. The Use of Information in Total Cost Management. Account. Rev. 1994, 69, 96–121. [Google Scholar]
  62. Kolstad, J.T. When Motivation Is Intrinsic: Evidence from Surgeon Report Cards. Am. Econ. Assoc. Inf. Qual. 2016, 103, 2875–2910. [Google Scholar]
  63. Goodman, J.S.; Wood, R.E. Feedback Specificity, Learning Opportunities, and Learning. J. Appl. Psychol. 2004, 89, 809–821. [Google Scholar] [CrossRef]
  64. Riccobono, F.; Bruccoleri, M.; Größler, A. Groupthink and Project Performance: The Influence of Personal Traits and Interpersonal Ties. Prod. Oper. Manag. 2016, 25, 609–629. [Google Scholar] [CrossRef]
  65. Andreas, P.; Mueller, M.; Kudic, M. Regional Innovation Systems in Policy Laboratories. J. Open Innov. Technol. Mark. Complex. 2018, 4, 44. [Google Scholar] [CrossRef]
  66. Simmel, G. On Individuality and Social Forms: Selected Writings; University of Chicago Press: Chicago, IL, USA, 1971. [Google Scholar]
  67. Levitt, B.; March, J. Organizational Learning. Annu. Rev. Sociol. 1988, 14, 319–340. [Google Scholar] [CrossRef]
  68. Rand, W.; Rust, R.T. Agent-Based Modeling in Marketing: Guidelines for Rigor. Int. J. Res. Mark. 2011, 28, 181–193. [Google Scholar] [CrossRef]
  69. Miller, J.H.; Page, S.E. Complex Adaptive Systems: An Introduction to Computational Models of Social Life; Princeton University Pres: Princeton, NJ, USA, 2007. [Google Scholar]
  70. North, M.J.; Macal, C.M. Managing Business Complexity: Discovering Strategic Solutions with Agent-Based Modeling and Simulation; Oxford University Press: Oxford, UK, 2007. [Google Scholar]
  71. Brad, L.M.; Goldberg, D.E. Genetic Algorithms, Tournament Selection, and the Effects of Noise. Complex Syst. 1995, 9, 193–212. [Google Scholar]
  72. March, J.G. Exploration and Exploitation in Organizational Learning. Organ. Sci. 1991, 2, 71–87. [Google Scholar] [CrossRef]
  73. Jiménez-Jiménez, D.; Sanz-Valle, R. Innovation, Organizational Learning and Performance. J. Bus. Res. 2011, 64, 408–417. [Google Scholar] [CrossRef]
  74. Posen, H.E.; Lee, J.; Yi, S. The Power of Imperfect Imitation. Strateg. Manag. J. 2013, 164, 12. [Google Scholar] [CrossRef]
  75. Cantner, U.; Graf, H.; Toepfer, S. Structural Dynamics of Innovation Networks in German Leading-Edge Clusters. Jena Econ. Res. Pap. 2015, 26, 1–24. [Google Scholar]
  76. Rothgang, M.; Cantner, U.; Dehio, J.; Engel, D.; Fertig, M.; Graf, H.; Hinzmann, S.; Linshalm, E.; Ploder, M.; Scholz, A.M. Cluster Policy: Insights from the German Leading Edge Cluster Competition. J. Open Innov. Technol. Mark. Complex. 2017, 3, 1–20. [Google Scholar] [CrossRef]
  77. Grimm, V.; Revilla, E.; Berger, U.; Jeltsch, F.; Mooij, W.M.; Railsback, S.F.; Thulke, H.H.; Weiner, J.; Wiegand, T.; DeAngelis, D.L. Pattern-Oriented Modeling of Agent Based Complex Systems: Lessons from Ecology. Am. Assoc. Adv. Sci. 2005, 310, 987–991. [Google Scholar] [CrossRef]
  78. Chang, P.C.; Huang, W.H.; Ting, C.J. Dynamic Diversity Control in Genetic Algorithm for Mining Unsearched Solution Space in TSP Problems. Expert Syst. Appl. 2010, 37, 1863–1878. [Google Scholar] [CrossRef]
  79. Becker, B.; Gerhart, B. The Impact of Human Resource Management on Organizational Performance: Progress and Prospects. Acad. Manag. J. 1996, 39, 779–801. [Google Scholar]
  80. Wilkins, A.L.; Ouchi, W.G. Efficient Cultures: Exploring the Relationship Between Culture and Organizational Performance; Sage Publications: Thousand Oaks, CA, USA, 1983. [Google Scholar]
  81. Gilbert, N.; Terna, P. How to Build and Use Agent-Based Models in Social Science. Mind Soc. 2000, 1, 57–72. [Google Scholar] [CrossRef]
  82. Latané, B.; Nowak, A. Attitudes as Catastrophes: From Dimensions to Categories with Increasing Involvement. In Dynamical Systems in Social Psychology; Academic Press: San Diego, CA, USA, 1994; pp. 219–249. [Google Scholar]
Figure 1. Flow chart of the feedback system for governmental institutes in Korea.
Joitmc 05 00066 g001
Figure 2. Description of the research model.
Joitmc 05 00066 g002
Figure 3. Comparison of convergence time between the different feedback policies.
Joitmc 05 00066 g003
Table 1. Two category of factors determining the effect of feedback.
CategoryContentReference
Ex-ante factorDefensive deposition decreases feedback performance.[40]
Public self-consciousness increases the needs of feedback[41]
Individualism increases feedback performance[42,43,44]
Difficult goal increases feedback performance[45,46,47,48]
Gap between goal and status of quo increases feedback performance[9,49]
Large scale of goal increases feedback performance[50]
Frequent assessment increase feedback performance[21,22,34,51]
Frequent assessment decrease feedback performance[52,53]
Reliability increases feedback performance[12]
Ex-post factorNegative feedback system is more effective than positive one[54,55,56,57,58,59,60]
Positive feedback system is more effective than negative one[22,39,48,61,62]
Positive delivery method increases acceptability of feedback result[38]
High result sharing decreases the needs of feedback[14]
Detail feedback increases short-term feedback performance[10,63]
Table 2. The list of attribute in the agent layer.
Variable.NotationDescription
Institute idii ∈ {1, 2, …., N}
Attribute string S i S i = { a 0 , i , a 1 , i , a 2 , i …., a n , i }
a i {0, 1, 2}
Performance P i P i = f ( a 0 , i , a 1 , i a n , i ,   S t i d e a l )
S t i d e a l   i s   a n   i d e a l   c o n d i t i o n   o f   a t t r i b u t e   s t r i n g
Learning rate π i 0 π i 1.0 , π i —uniform distribution
Forgetting rate λ i 0 λ i 0.1 , λ i —uniform distribution
Self-adjustment rate γ i 0 γ i , 0 0.1 , γ i , t = f ( P i , t 1 )
Table 3. The list of attributes in the system layer.
VariableNotationDescription
PopulationNnumber of institutes in the institute layer
Incentivevamount of incentive to high performance group
Timett ∈ {1, 2, …., max iteration}
Sampling ratio β i 0 β i 1.0 , β i = β j   w h e n   i j
Table 4. The list of attribute in the ecosystem layer.
VariableNotationDescription
Ideal attribute string S t i d e a l S i = { a 0 , 1 , a 1 , 1 , a 2 , 1 …., a n , 1 }
a i {0, 1, 2}
Reflection ratioc 0 c 0.1
Average performance P A V G 1 N i = 1 N p i
Diversity D t Hamming distance at period t
Table 5. Measuring the diversity.
Hamming Distance Between Vector X and Y: D ( X , Y ) Euclidian Distance Between Vector X and Y: D ( X , Y )
I = j = 0 L I j ,       I j = { 0   i f   x j = y j 1   i f   x j y j
D ( X , Y ) = I L
D ( X , Y ) = i = 0 N ( x i y i ) 2
Connection matrix: D(X,Y)Information entropy: PD
S(X,Y) = i , j ( x i j | x i j = y i j = 1 ) n
D(X,Y) = 1 − S(X,Y)
H i = c C p r i c l n ( p r i c ) ,   where   p r i c = n a i c N
n a i c : number   of   appearance   of   c   at   locus   i
C : number   of   cities   should   be   visited
PD = D ( X , Y ) N
Table 6. ABM experiment design.
TypeTargetExperiment
No feedbackHigh and low performance groupExperiment 1
Positive feedbackHigh performance groupExperiment 2
Low performance groupExperiment 4
Negative feedbackLow performance groupExperiment 3
Positive and negative feedbackHigh and low performance groupExperiment 5
Table 7. Summation of the simulation results.
Model.Experiment 1Experiment 2Experiment 3Experiment 4Experiment 5
No FeedbackPositive Feedback to High-PerformerPositive Feedback To Low-PerformerNegative Feedback to Low PerformerMixed Policy
Average Performance Joitmc 05 00066 i001 Joitmc 05 00066 i002 Joitmc 05 00066 i003 Joitmc 05 00066 i004 Joitmc 05 00066 i005
Note: horizontal-axis refers to “the degree of result sharing” and vertical-axis refers to “the average performance of ecosystem”.
Table 8. Summation of the simulation results.
ModelExperiment 1Experiment 2Experiment 3Experiment 4Experiment 5
No FeedbackPositive Feedback to High-PerformerPositive Feedback to Low-PerformerNegative Feedback to Low PerformerMixed Policy
Convergence speed Joitmc 05 00066 i006 Joitmc 05 00066 i007 Joitmc 05 00066 i008 Joitmc 05 00066 i009 Joitmc 05 00066 i010
Note: horizontal-axis refers to “the time(period)” and vertical-axis refers to “the convergence time.
Table 9. Comparison between different improvement strategy of the GI assessment system.
StrategyChanging The degree of Result SharingChanging the Type of Feedback Policy
Perfect Sharing → Low SharingMixed Policy → Positive feedback to High-Performance Group
GoalMid ~ Long-term objectivesShort ~ Mid-term objectives
Benefit- Maximizing effectiveness of assessment system on the aspect of both performance and diversity
- Relatively strong correction towards individual and organizational behavior
- Relatively improving effectiveness of the assessment system on the aspect of both performance and diversity
- Keeping public transparency and trust toward the GI assessment system
- Fair sharing of the assessment results
Cost- Declining transparency and trust towards the GI assessment system
- Unfair selection of institute
- Relative weak correction power toward organizational and individual behavior
- Inefficiency of the optimal solution exploration

