Article

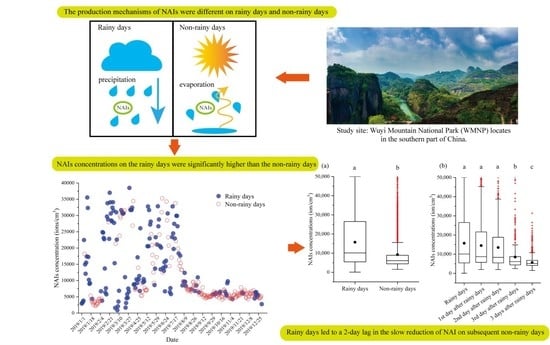
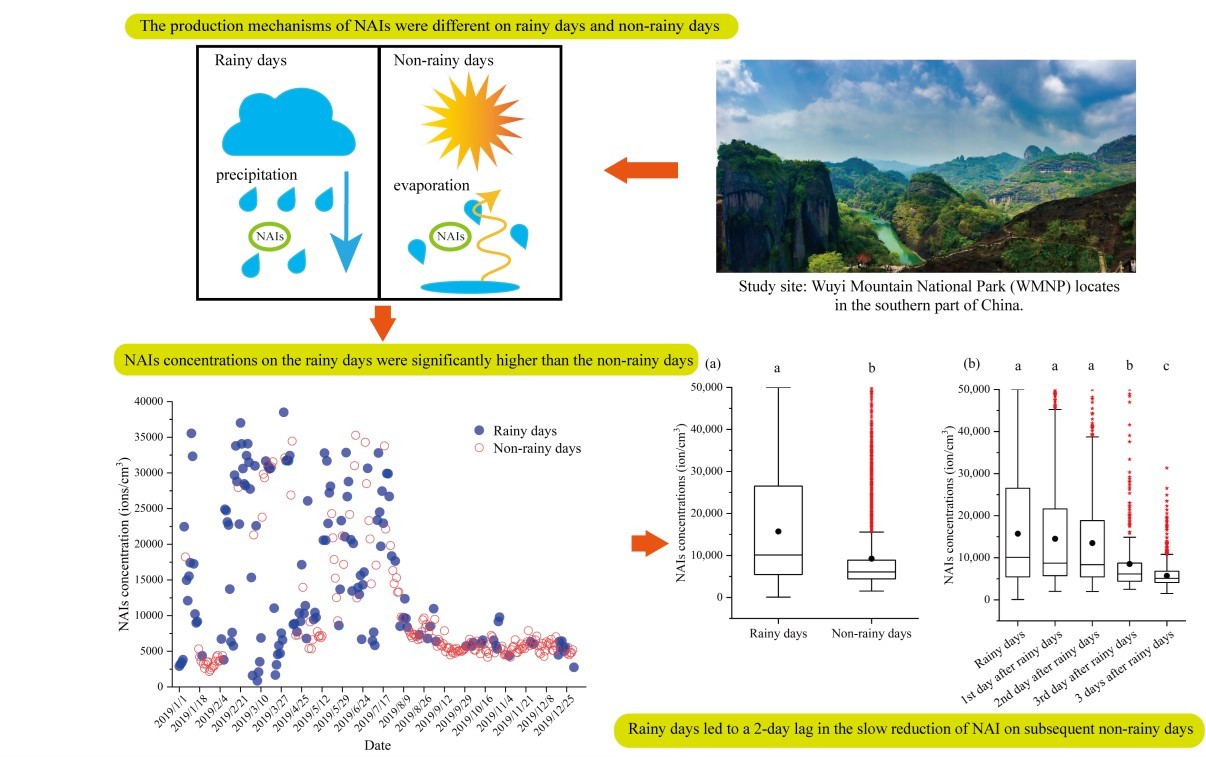
The Lagging Effect of Precipitation on NAIs Concentrations on Rainy Days in Wuyi Mountain National Park, China

1
College of Forestry, Fujian Agriculture and Forestry University, Fuzhou 350002, China
2
Key Laboratory of Fujian Universities for Ecology and Resource Statistics, Fuzhou 350002, China
3
Fujian Meteorological Service Center, Fuzhou 350001, China
*
Authors to whom correspondence should be addressed.
Atmosphere 2023, 14(2), 377; https://doi.org/10.3390/atmos14020377
Submission received: 23 December 2022 / Revised: 10 February 2023 / Accepted: 10 February 2023 / Published: 14 February 2023
(This article belongs to the Section Atmospheric Techniques, Instruments, and Modeling)

Abstract

:
Precipitation (PRE) is an essential factor that affects the negative air ions (NAIs) concentrations. However, the mechanism of NAIs concentrations and their influencing factors on rainy and non-rainy days remains unclear. Here, we used hourly data of NAIs concentrations and meteorological data in 2019 to analyze the distribution of NAIs concentrations and its influencing factors on rainy and non-rainy days in the Wuyi Mountain National Park (WMNP) of China, which was listed as a World Cultural and Natural Heritage Site in 1999. The results indicated that the NAIs concentrations on rainy days were significantly higher than on non-rainy days. However, the NAIs concentrations on rainy days were slightly higher than on the first and second days after rainy days. Then, the NAIs concentrations were significantly reduced on the third day and after that. Thus, rainy days lead to a 2-day lag in the smooth reduction of NAIs on non-rainy days after rainy days. NAIs concentrations were significantly correlated with the relative humidity (RHU) on both rainy and non-rainy days. By analyzing the meteorological factors on NAIs for ranking the feature importance scores on rainy and non-rainy days, PRE was ranked first on rainy days, and sea level pressure (PRS_Sea) and temperature (TEM) were ranked first and second on non-rainy days, respectively. Based on the univariate linear regression model (ULRM), NAIs concentrations responded strongly (higher absolute slope values) to RHU on rainy days and to pressure (PRS), visibility (VIS), water vapor pressure (VAP), TEM, and ground surface temperature (GST) on non-rainy days. The results highlight the importance of PRE in the lag time of NAIs concentrations on rainy and non-rainy days.

Graphical Abstract

1. Introduction

Negative air ions (NAIs) received widespread attention because of their air clean function. NAIs could sink particulate matter (PM) [1,2] and have beneficial effects on the human body, such as treating seasonal affective disorder [3] and improving sleep quality [4]. NAIs are also considered as an indicator of air quality [5]. NAIs could also prevent the spread of COVID-19 through small-sized droplets/aerosols [6].
NAIs are normally generated by cosmic rays, corona discharge, or the shearing force of water (Lenard force) [7,8]. The Lenard force could generate a type of NAIs called superoxide ions (O2-) and combine them with water molecules and then form a NAIs–water cluster structure such as O2-(H2O)n [9]. The structure of the NAIs–water cluster was stable and had a long lifespan [10,11]. Lenard force is generated from water droplets’ collision with waterfall, spray, and rainfall [12]. A tornado could produce a number of NAIs on rainy days [13]. These factors result in NAIs concentrations being higher on rainy days. Marko et al. proved that NAIs concentrations were higher than positive air ions (PAIs) on rainy days [14]. Wang et al. found NAIs concentrations were higher on rainy days than non-rainy days in transitional seasons and were lower on rainy days in the summer and winter [15]. Deng reported that NAIs concentrations had increased significantly after rainfall, due to air refreshing and that the lifespan of NAIs was expended by Lenard force [16]. The process in which NAIs concentrations remain higher after rainy days is referred to as the lagging effect of rainy days. However, the longer period of NAIs concentrations and their impact factors after rainy days remain unclear. It is necessary to investigate the distribution of NAIs concentrations and the factors that influence rainy days and after rainy days.
Wuyi Mountain National Park (WMNP) is located in the southern part of Fujian Province, China. The park has a total area of 1001.41 km2, and its geographical coordinates are 117°24′13″–117°59′19″ longitude and 27°31′20″–27°55′49″ latitude. WMNP was listed as a World Cultural and Natural Heritage Site by the United Nations Educational, Scientific and Cultural Organization (UNESCO) in 1999. WMNP also became one of the first groups of national parks in China in 2021. In addition, it was announced as the AAAAA National Tourist Area and has long been an enchanted place for beautiful sightseeing and summer resorts. WMNP has an average annual precipitation of 1684 to 1780 mm [17]. The relative humidity (RHU) is 83.5% and over 100 days of fog [18]. The meteorological environment contributes to NAIs’ structural stability and longevity. NAIs in natural landscapes are more influenced by meteorological factors than in cities [19]. The NAIs concentrations and meteorological factors data were collected from an automatic negative oxygen ion monitor and automatic weather station. We previously predicted trends in NAIs concentrations over the timeline using weekly data and found that NAIs concentrations always suddenly increased on rainy days [20]. However, the mechanisms of environmental factors influencing NAIs were unknown on rainy days. Here, we further analyze the effect of meteorological factors on NAIs on rainy and non-rainy days, thus (1) analyzing the NAIs concentrations on rainy and non-rainy days (2) to reveal the meteorological factors’ influence on NAIs during rainy and non-rainy days.

2. Methods

2.1. Instrumentation

The automatic negative air ions station allowed 24-h monitoring of the NAIs concentrations in WMNP (Located at 117°57′45″, 27°40′8″). The elevation of the NAIs monitor site is 408 m. NAIs monitoring instruments are built on relatively smooth ground. Vegetation at the monitoring site includes Michelia maudiae and Castanopsis eyrei in the arbor layer, Maesa japonica in the shrub layer, and Adiantum capillusveneris and Cyperus rotundus in the herb layer. The soil is dominated by ferric acrisols. There are many waterfalls in WNMP, of which, a waterfall is about 50 m distance from the FR500 station. The hourly data of NAIs concentrations were selected from 1 January 2019 00:00–31 December 2019 23:00. The monitoring instrument for NAIs concentrations was the FR500 negative oxygen ion monitor (Huatron Corporation, Beijing, China) [20]. The FR500 negative oxygen ion monitor could automatically monitor NAIs concentrations for the 24 h and protect against external wind and condensation. The FR500 has a servo system with intelligent ventilation and cooling, heating, and dehumidification functions. It also has a measurement system with programmable NAIs calibrations, ion standard deviation, insulation control, automatic up and down, etc. The above features make it reliable, accurate, maintenance-free, with a long working cycle, and ample capacity storage in harsh field environments. The monitoring measurements ranged from 0 to 50,000 ions/cm3. The minimum resolution was one ion/cm3; the mobility of the ions was below 0.4 cm2/(V.s). The FR500 can operate in extreme environments with temperatures of −40 to +50 °C, air pressure of 450 to 1060 hPa, and humidity from 0% to 100% RH. The negative ion monitor was manufactured according to the “Requirements for Functional Specifications of Atmospheric Negative Ion Automatic Observer”, issued by the China Meteorological Administration (Version 2) to ensure monitoring accuracy.
Similar is the DZZ4 automatic weather station (Jiangsu Radio Scientific Institute CO., LTD, Nanjing, China) [20]. The DZZ4 automatic weather station was used to monitor the hourly data of 12 meteorological factors synchronously, including the precipitation (PRE), relative humidity (RHU), temperature (TEM), air pressure (PRS), sea level pressure (PRS_Sea), water vapor pressure (VAP), mean wind speed (WIN_S), mean wind direction (WIN_D), maximum wind speed (WIN_S_Max), ground surface temperature (GST), evaporation (EVP), and visibility (VIS).

2.2. Outlier and Invalid Data Detection and Filtering

The study selected raw hourly data as hourly values for NAIs concentrations from 00:00 on 1 January 2019 to 23:00 on 31 December 2019. Due to the large variation in NAIs concentrations and the volume of data, outliers need to be identified. This study modified the methodology of other studies regarding identifying outliers [21]. The details of the outlier data selection method were as follows:
(1)
Invalid data (missing values) due to machine failure and storage failure.
(2)
Outliers of 99,999 and 0 in NAIs concentrations due to instrument failure and voltage instability.
(3)
Twelve consecutive values with the same data are seen as outliers.
The raw hourly data was 8760, of which 7420 were valid values, 1340 were missing values, and no outlier was found. This indicated that the quality of the NAIs data was available for analysis.

2.3. Division of Rainy and Non-Rainy Days

When the cumulative daily precipitation is above 0 mm, this day is defined as a rainy day; when the cumulative daily precipitation is 0 mm, this day defined as a non-rainy day [22]. The study averaged the valid hourly data per day (00:00–23:00) as daily values. We explored the impact of variations of NAIs concentrations on and after rainy days. The non-rainy days were further divided chronologically into the 1st day after rainy days, the 2nd day after rainy days, the 3rd day after rainy days, and the three days after rainy days.

2.4. Data Analysis

The hourly and daily means of NAIs concentrations on rainy and non-rainy days did not meet the normality test (Shapiro–Wilk test, p < 0.001). Here, we used the nonparametric analysis to test the significance and correlation analysis. For the NAIs concentrations on rainy and non-rainy days, we used the Wilcoxon independent two-sample rank sum test of significance at 95% confidence. For the NAIs concentrations on rainy days and various non-rainy days, we used the Kruskal–Wallis independent multiple-sample rank sum test with a significance at 95% confidence. The nonparametric correlation analysis (Spearman’s two-tailed test at 95% confidence) was performed between rainy and non-rainy days based on the daily values of the NAIs concentrations.
Scatter plots were created based on the meteorological factors and NAIs concentrations using a one-dimensional linear regression equation. To compare the degree of response of NAIs to the meteorological factors on rainy and non-rainy days. The formula for the regression–fit line was y = kx + b, k for the slope, b for the intercept, x for the meteorological factors, y for the NAIs concentrations, and R2 for the linear fit. The regression effects were tested using analysis of variance (ANOVA), with p < 0.05 as significant.

2.5. The Feature Importance Scores of Meteorological Elements in the NAIs Concentrations

2.5.1. Introduction of the Random Forest Model

The random forest (RF) model was evaluated for the feature importance scores. The RF model had a high predictive ability and better performance between NAIs concentrations and environmental factors [23]. Here, we used the RF model to calculate and rank the feature importance scores of the meteorological factors on the NAIs concentrations on rainy and non-rainy days.

2.5.2. Data Normalization

The RF model requires that the differences in the order of magnitude between the input factors are not too significant. Otherwise, it would result in a poor model fit. Therefore, the input factors should be normalized, thus reducing the error introduced by different factor orders and units for the RF model. Here, we use the min–max normalized method and data scaling between 0 and 1 [24].
y = x y m i n x m a x x m i n
In the formula, y represents the normalized value, x represents the original value, xmax represents the maximum value of the original data, and xmin represents the minimum value of the original data.

2.5.3. Parameter Selection and Feature Importance Scores

To explore the contribution of meteorological factors to NAIs concentrations on rainy and non-rainy days, we used the RF model to calculate the feature importance score of the meteorological factors. First, we normalized the daily values of the NAIs concentrations and meteorological factors on rainy and non-rainy days. The meteorological factors include PRE, RHU, TEM, PRS, PRS_Sea, VAP, WIN_S, WIN_D, WIN_S_Max, GST, EVP, and VIS on rainy days, except for PRE on non-rainy days.
For the principle of the feature importance score in the RF model, we calculated the feature contributions to each tree in the RF and used the average. Finally, we compared the contribution sizes between features. We also used the feature_importance function of the scikit-learn library of Python 3.6 software to rank the calculated feature importance score. The scikit-learn library obtained the importance of the features by combining the proportion of samples contributed by features with a reduction in purity [25]. For the explanation of the following parameters in the scikit-learn library, this study used the functions (its range of parameters) with n_estimators (5, 10, 20, 50, 100, and 200) as the amount of trees, max_feature (0.6, 0.7, 0.8, and 1) as the amount of features to consider when defining the best split, max_depth (3, 5, and 7) as the maximum depth of the trees, and cv (3) in GridSearchCV represented a 3-fold cross-validation using the cross-validation splitting strategy [25,26].

2.5.4. RF Model Evaluation

This study used the mean squared error (MSE), root mean squared error (RMSE), coefficient of determination (R2), and mean absolute deviation (MAE) to evaluate the fit accuracy of the RF model [27,28].

3. Results

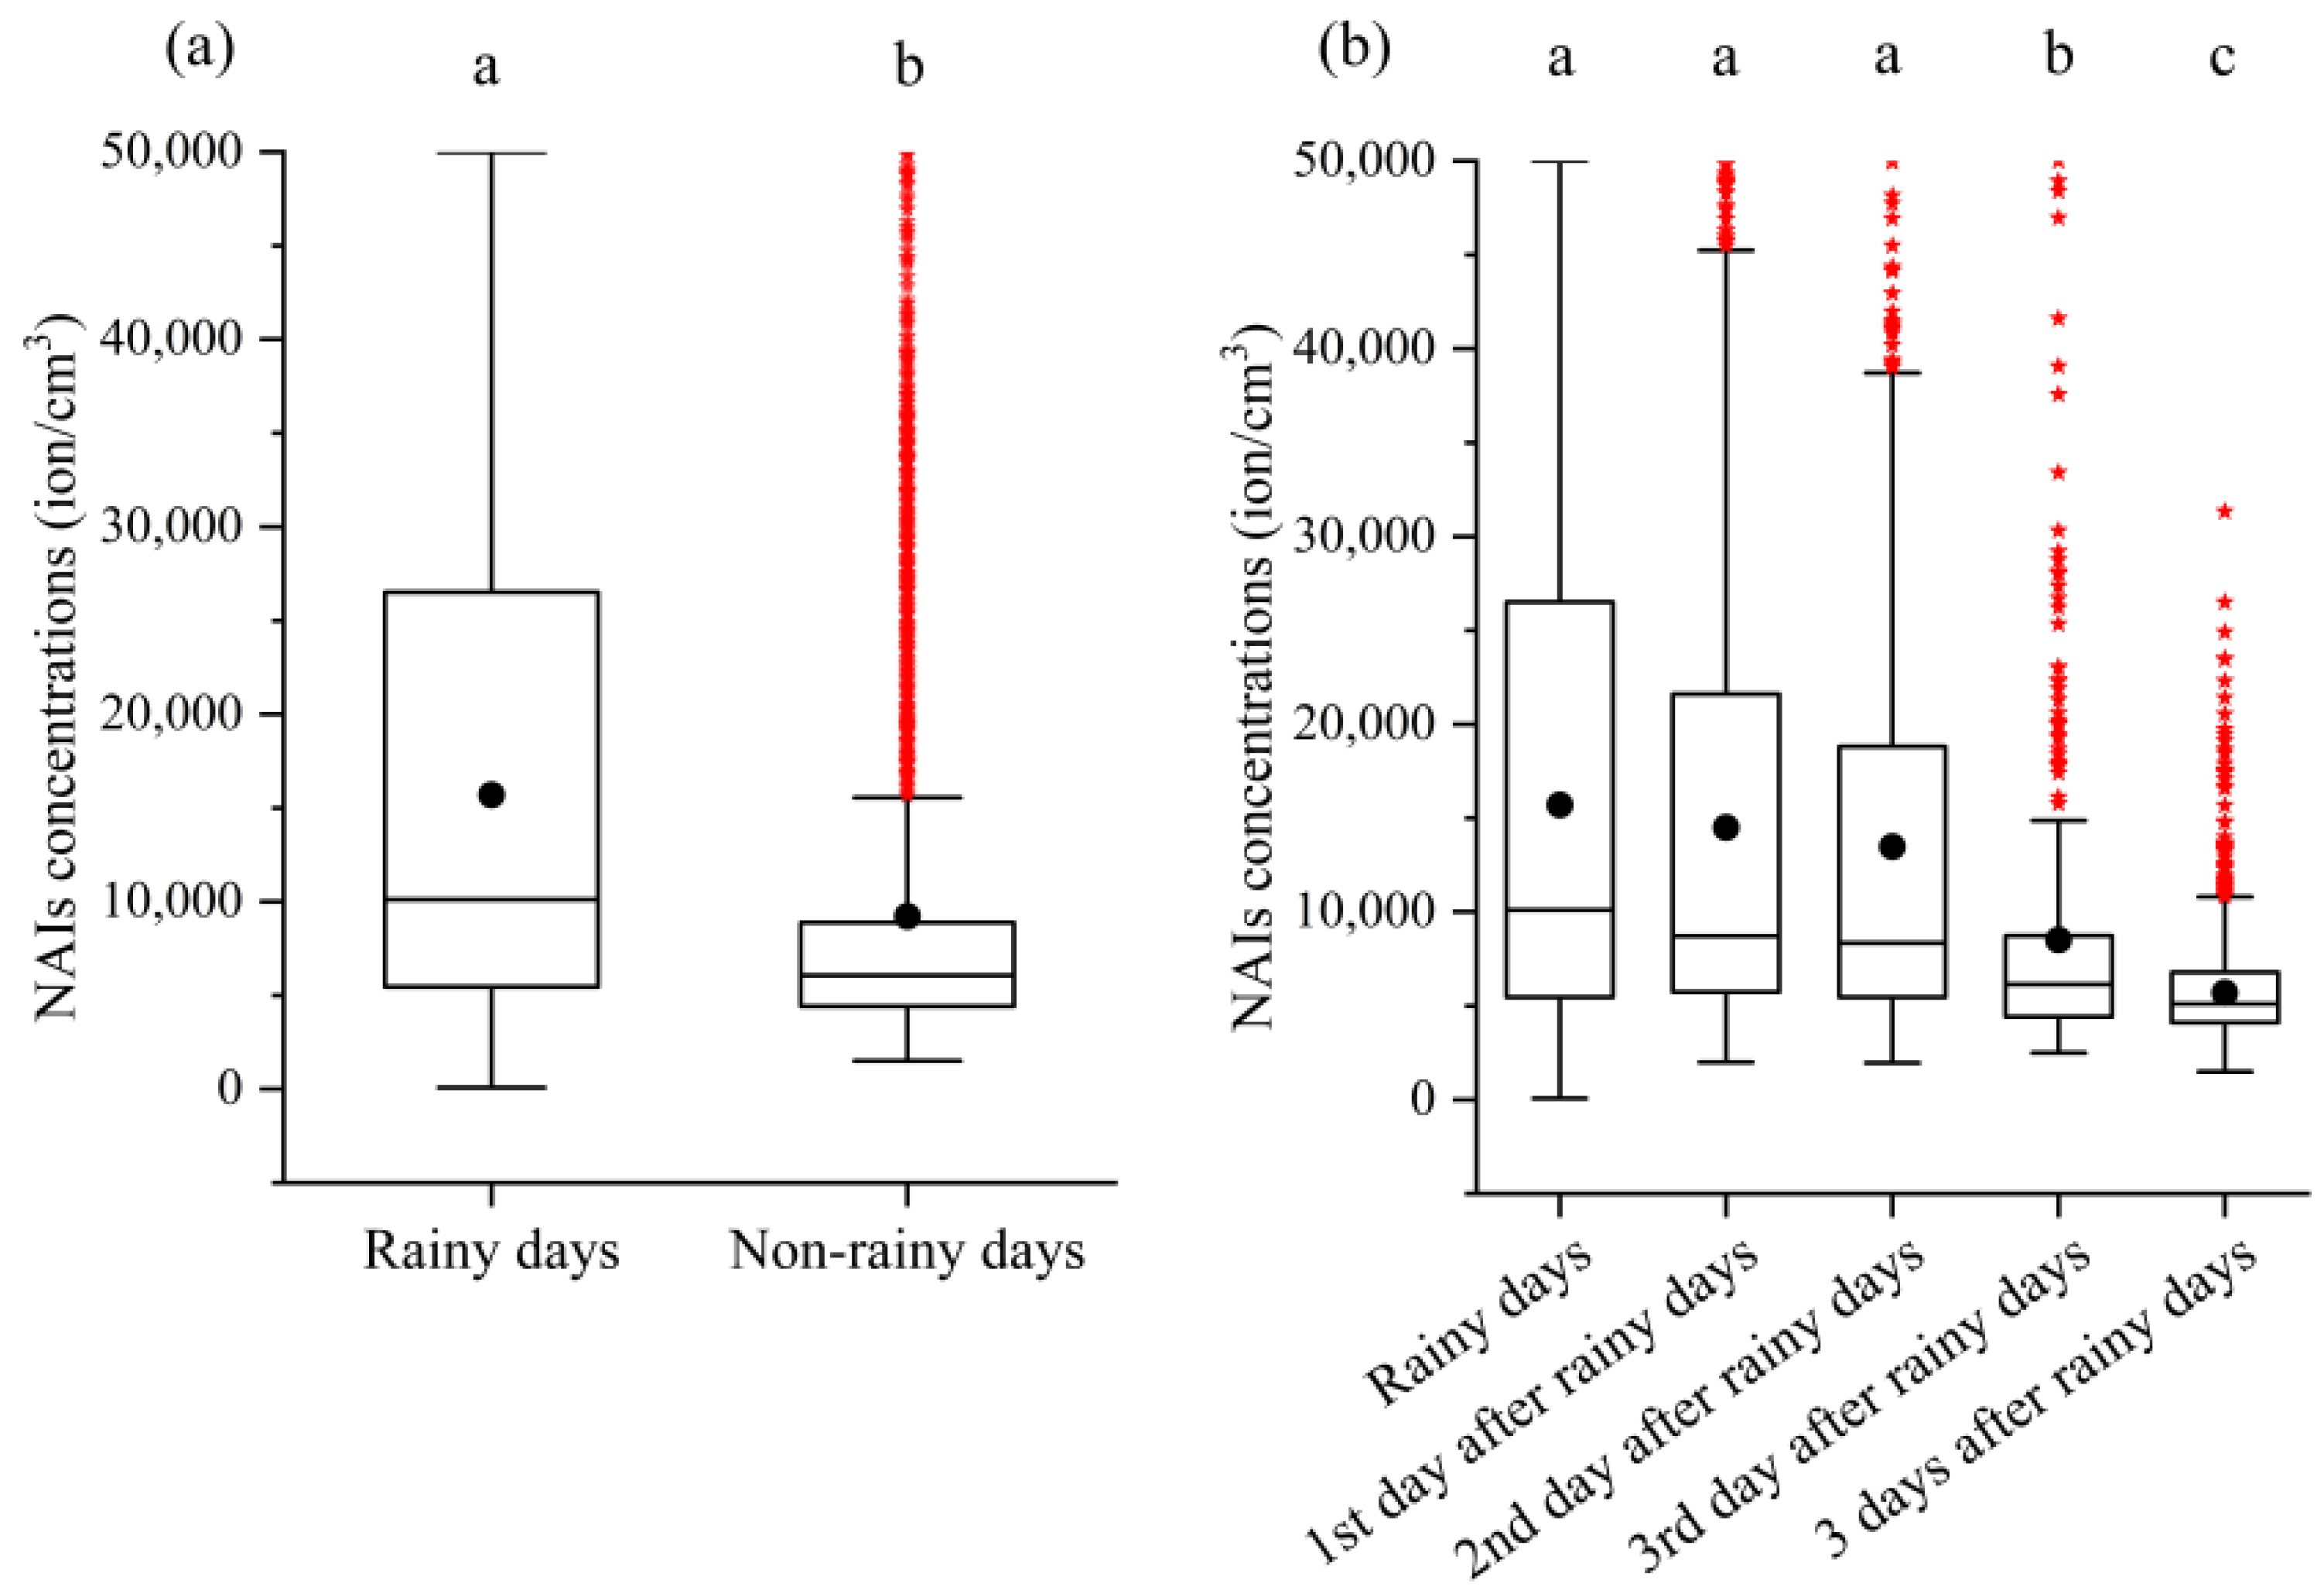
3.1. NAIs Concentrations on Rainy and Non-Rainy Days

We divided the NAIs concentrations as 146 rainy days and 185 non-rainy days, with 35 days of invalid data. The NAIs concentrations values on rainy days were significantly higher than on non-rainy days (Figure 1a). Both the median and mean values of the NAIs concentrations decreased sequentially from the rainy days to the following non-rainy days (Figure 1b). The mean values of the NAIs concentrations ranked as follows, Rainy days > 1st day after rainy days > 2nd day after rainy days > 3rd after rainy days > three days after rainy days. The NAIs concentrations were not significantly higher on rainy days, the 1st day after rainy days, and the 2nd day after rainy days (p > 0.05). However, the NAIs concentrations were significantly higher on rainy days than on the 3rd day after rainy days and three days after rainy days (p < 0.05).
The nonparametric Wilcoxon independent two-sample rank sum test was used (Table 1). The NAIs concentrations on rainy days were significantly higher than on non-rainy days. The study compared the various types of NAIs concentrations between rainy and non-rainy days, with a median (25th percentile, 75th percentile) of 10,109.17 (5464.17, 26,513.50) on rainy days. The median (25th percentile, 75th percentile) was 6067.70 (4416.09, 8894.13) on non-rainy days. The general significance was z = 22.171, p < 0.05 for rainy and non-rainy days of NAIs concentrations.
According to the nonparametric Kruskal–Wallis independent multiple-sample rank sum test (Table 2), no significant differences in NAIs concentrations were detected among the rainy days and the 1st and 2nd day after rainy days (p value ≥ 0.05). However, the NAIs concentrations on the 3rd day and the three days after rainy days were significantly lower than those on rainy days and the 1st and 2nd day after rainy days. This implied that the time lag of the NAIs concentrations was two days after rainy days.

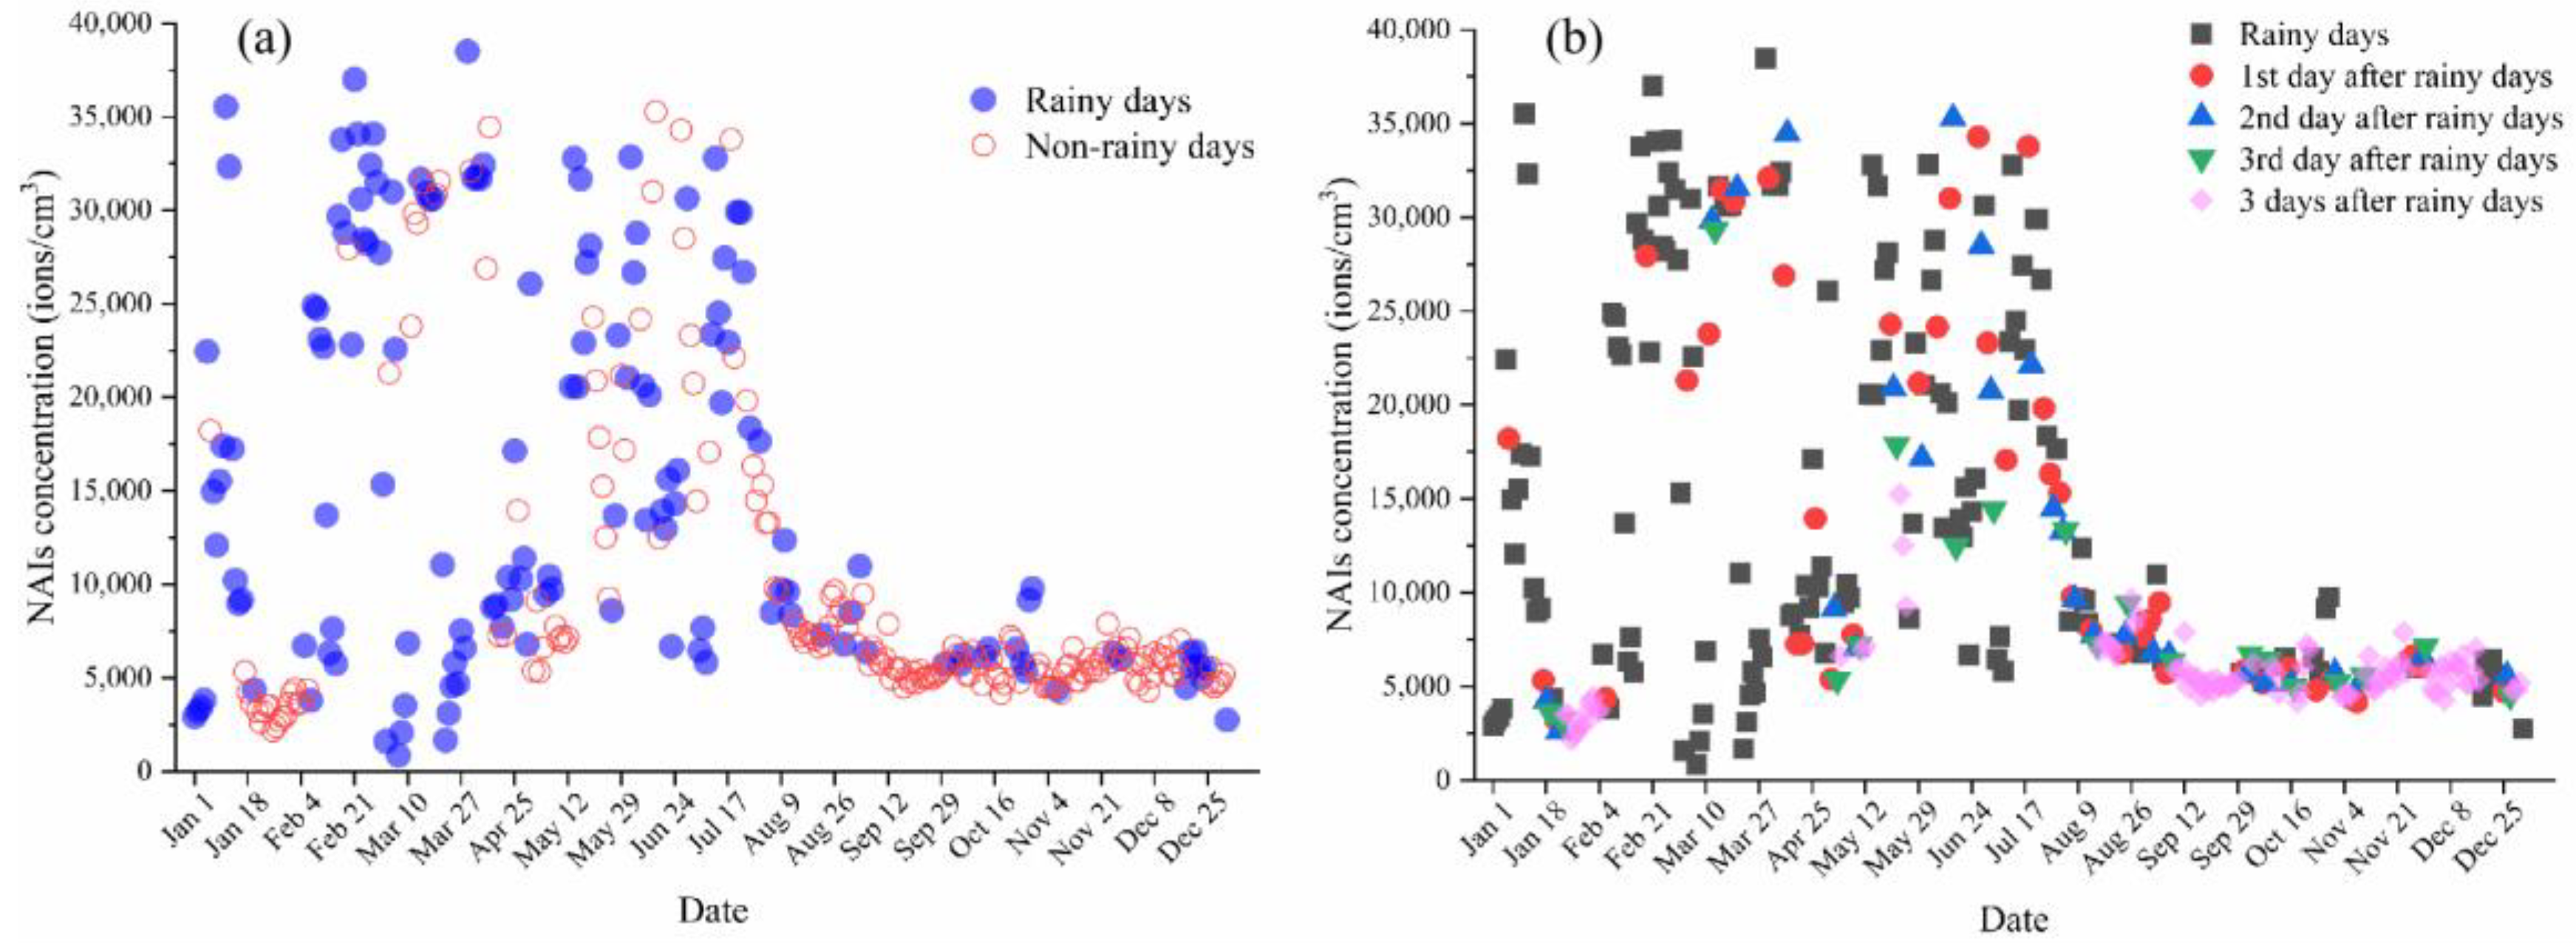
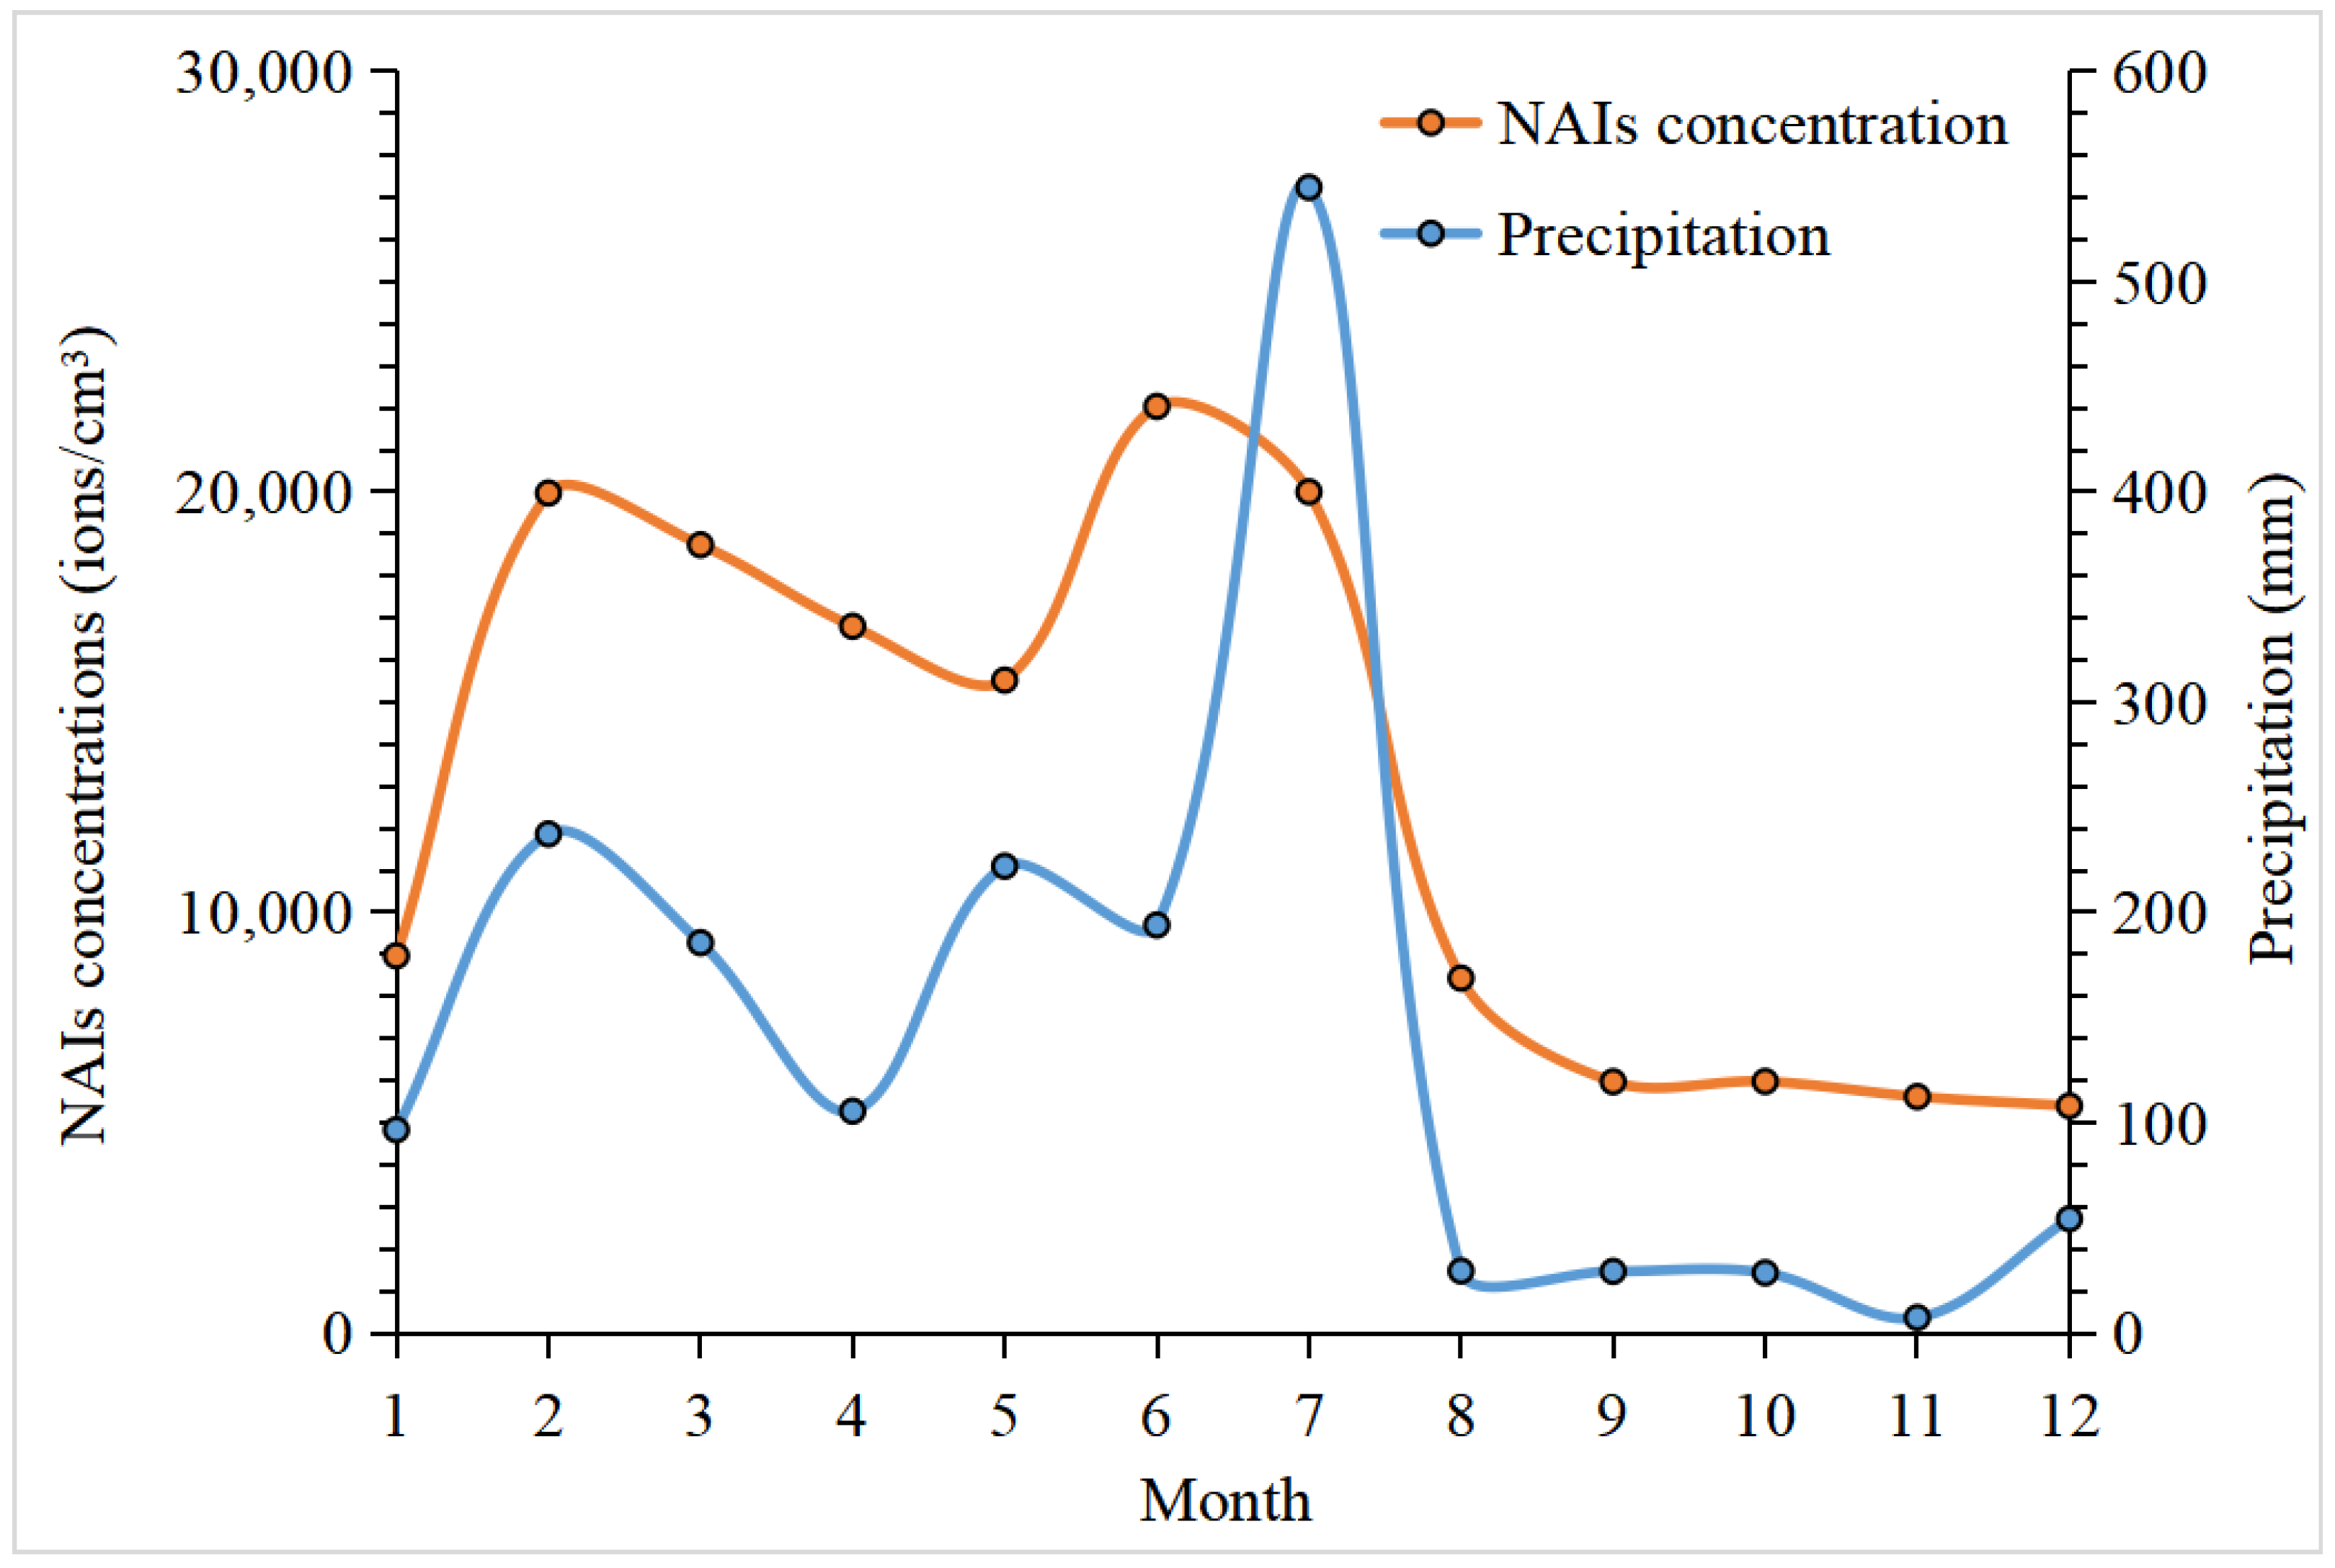
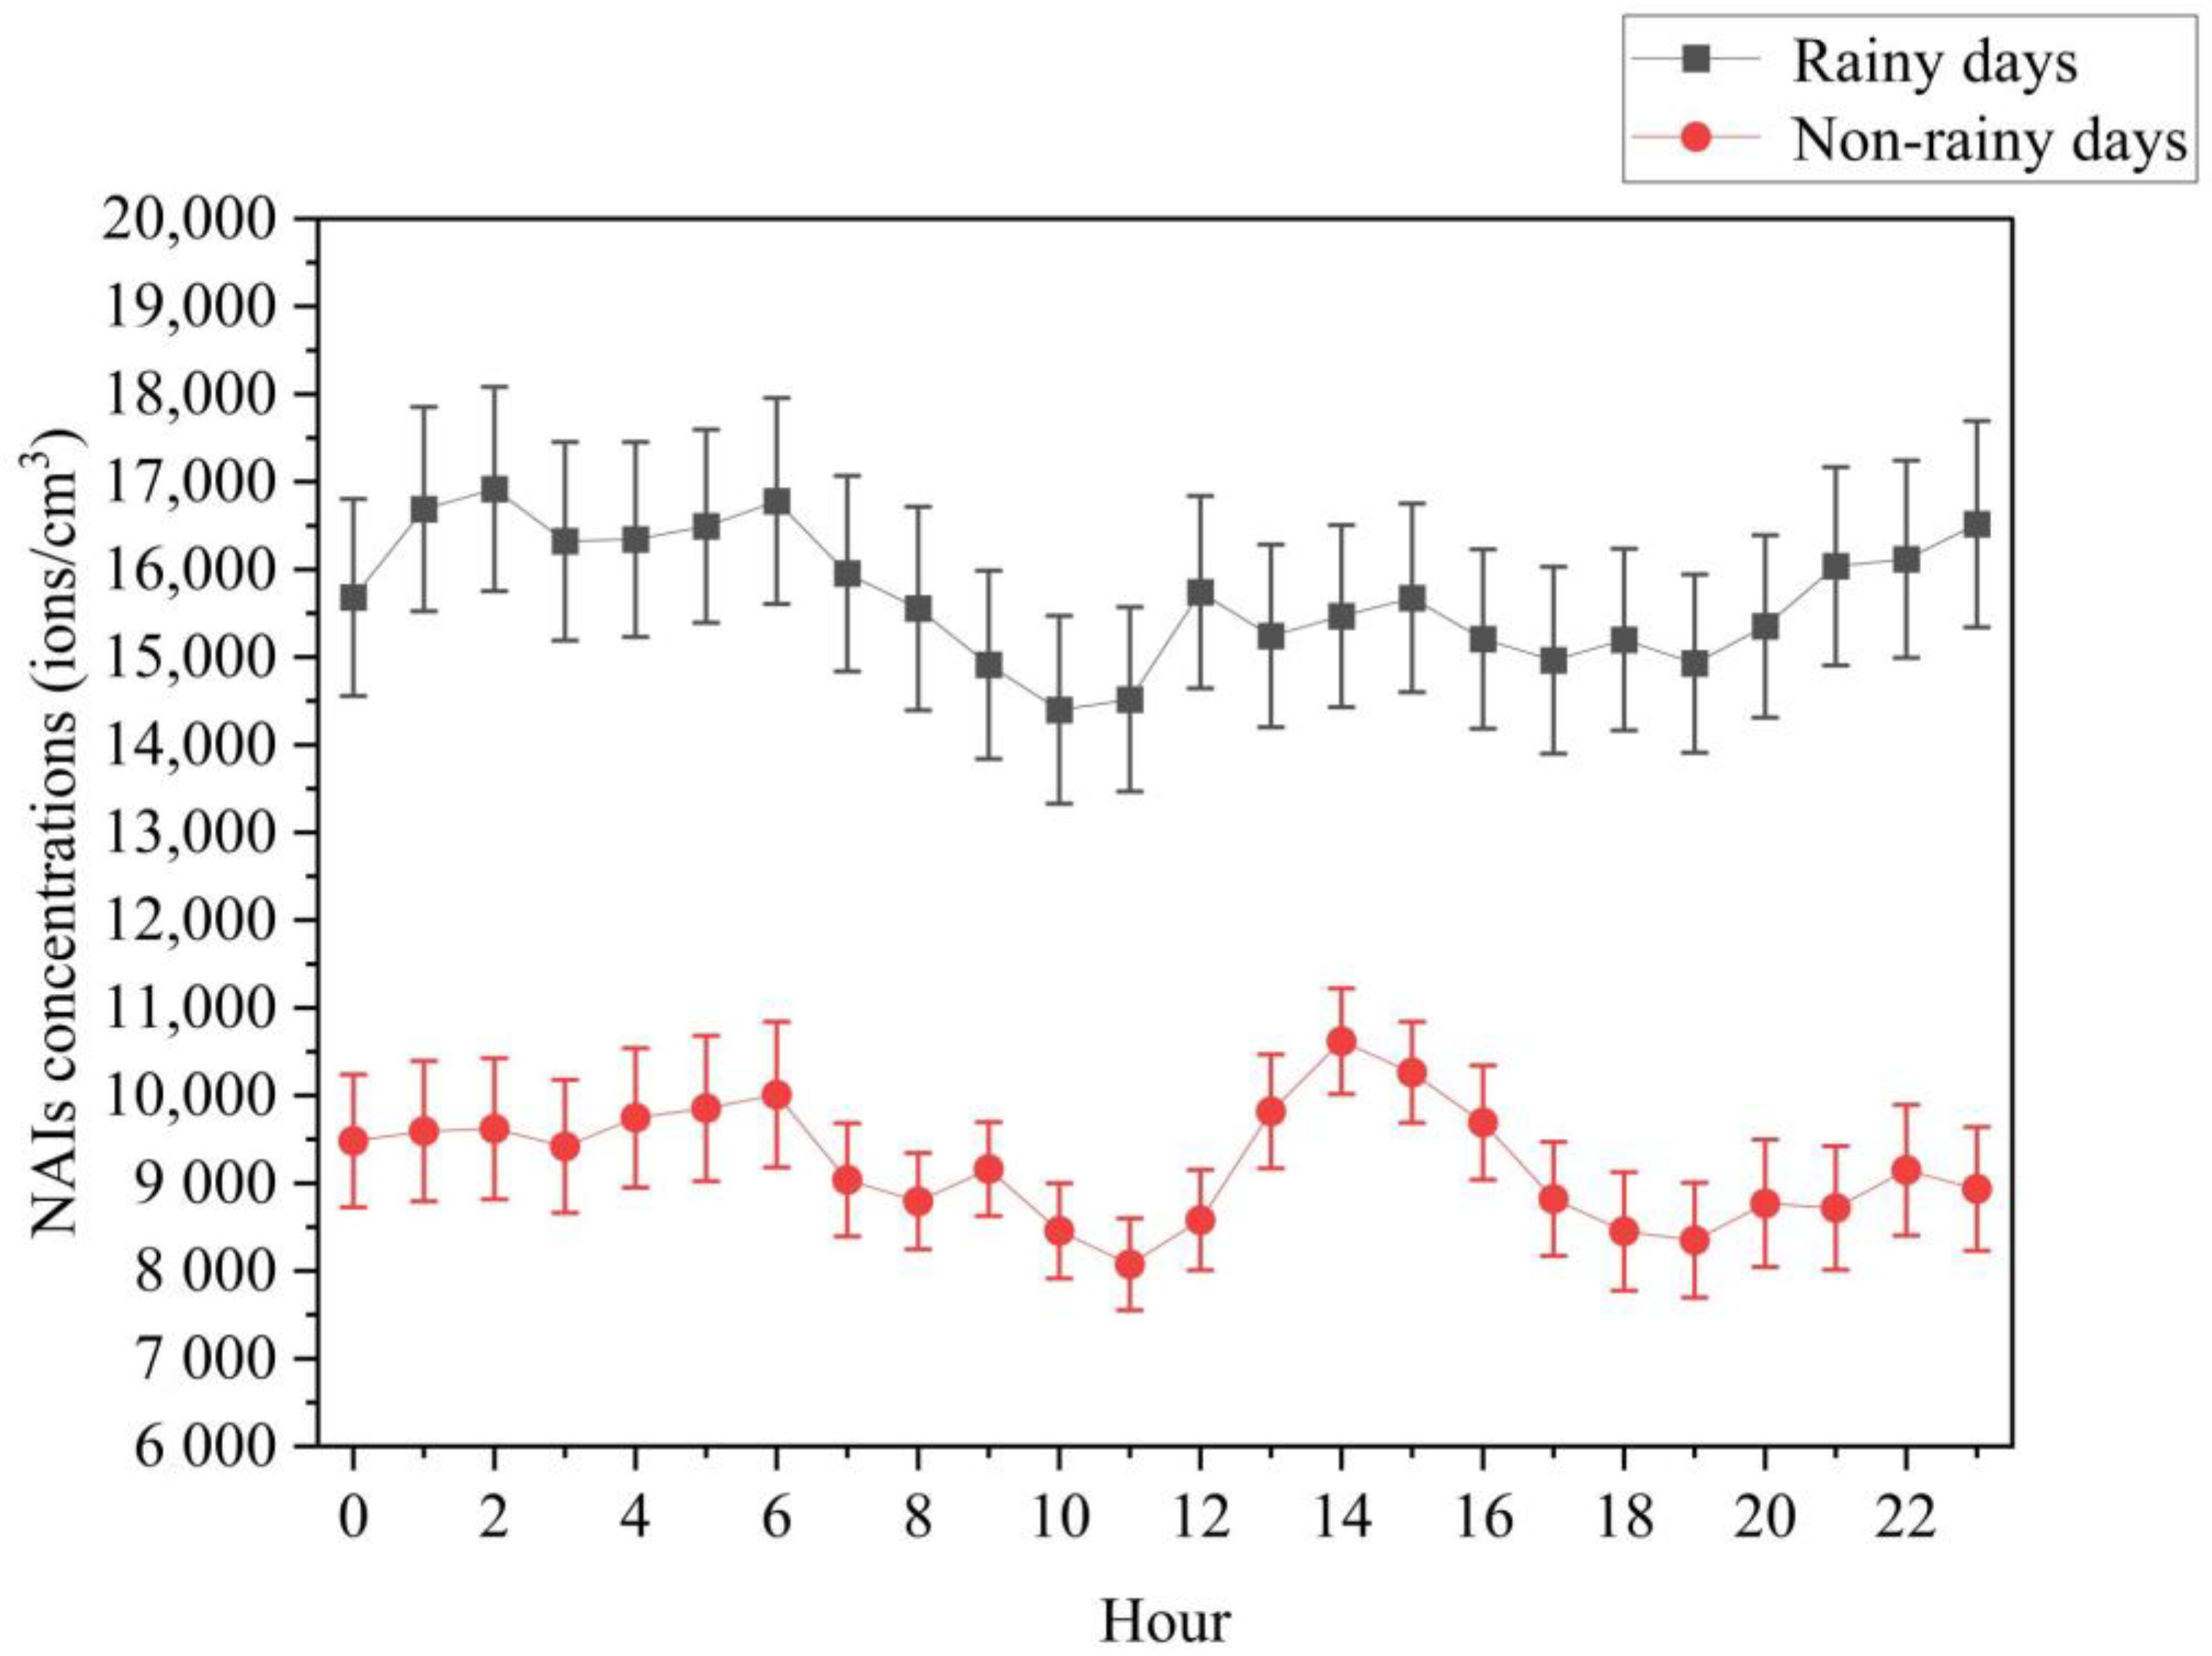
3.2. Time Series Distribution of NAIs Concentrations on Rainy and Non-Rainy Days

As mentioned in Table 1 and Figure 1, the NAIs concentrations were significantly higher on rainy days than on non-rainy days (p < 0.05). Additionally, Figure 2a showed that NAIs concentrations were higher on rainy days than on non-rainy days when we compared the NAIs concentrations for neighboring dates, especially during the period of 1 January 2019 to 5 January 2019. Additionally, there were fewer rainy days and lower NAIs concentrations after 31 July 2019. The reason was that the study site experienced a severe drought from August to December 2019, resulting in reduced precipitation and, therefore, lower NAIs concentrations produced by water, as shown in Figure 3. Overall, the majority of the values of the NAIs concentrations were higher on rainy days than on non-rainy days. Moreover, we divided the non-rainy days into the 1st day, 2nd day, 3rd day, and three days after rainy days (Figure 2b). Then, we analyzed the time-lag effect of the NAIs concentrations on rainy and non-rainy days. We found similar distributions that NAIs concentrations on rainy days were the highest, followed by the 1st day, 2nd day, 3rd day, and three days after rainy days.
Precipitation showed profound differences during 2019: more precipitation from January to July 2019 and less precipitation from August to December 2019, resulting in severe drought. To further analyze the effect of drought on NAIs, we constructed a graph of the monthly distribution of the NAIs concentrations and precipitation (Figure 3). The figure showed that the NAIs concentrations decreased rapidly with precipitation beginning in August 2019. Furthermore, the overall trend in the NAIs concentrations was similar to that of precipitation.
The NAIs concentrations on rainy days were higher than on non-rainy days at every hour every day (Figure 4). On rainy days, high NAIs concentrations occurred at dawn and night (01:00–06:00 and 21:00–23:00), and low values occurred in the morning (10:00–11:00). On non-rainy days, the high NAIs occurred at dawn (04:00–06:00) and in the afternoon (13:00–16:00), and the low values occurred at 10:00–12:00 and 18:00–19:00.

3.3. Correlation Analysis of NAIs Concentrations with Meteorological Factors on Rainy and Non-Rainy Days

The Spearman correlation coefficient was used to examine and determine the relationships between NAIs concentrations and meteorological factors. A two-tailed bivariate analysis was applied at a 95% confidence interval. The NAIs concentrations were significantly correlated with PRE and RHU at the 0.01 level, with PRS and PRS_Sea at the 0.05 level on rainy days (Table 3). Furthermore, the NAIs concentrations were significantly correlated with TEM, GST, PRS, PRS_Sea, VAP, RHU, and VIS at the 0.01 level, with EVP at the 0.05 level on non-rainy days.
We used the linear regression equation to analyze the significant correlation level at 0.01 between the NAIs concentrations and meteorological factors on rainy and non-rainy days. The meteorological factors of PRS, VIS, VAP, TEM, and GST responded more to NAIs concentrations (higher absolute value of slope k) on non-rainy days, and RHU responded more to NAIs concentrations on rainy days (Figure 5).

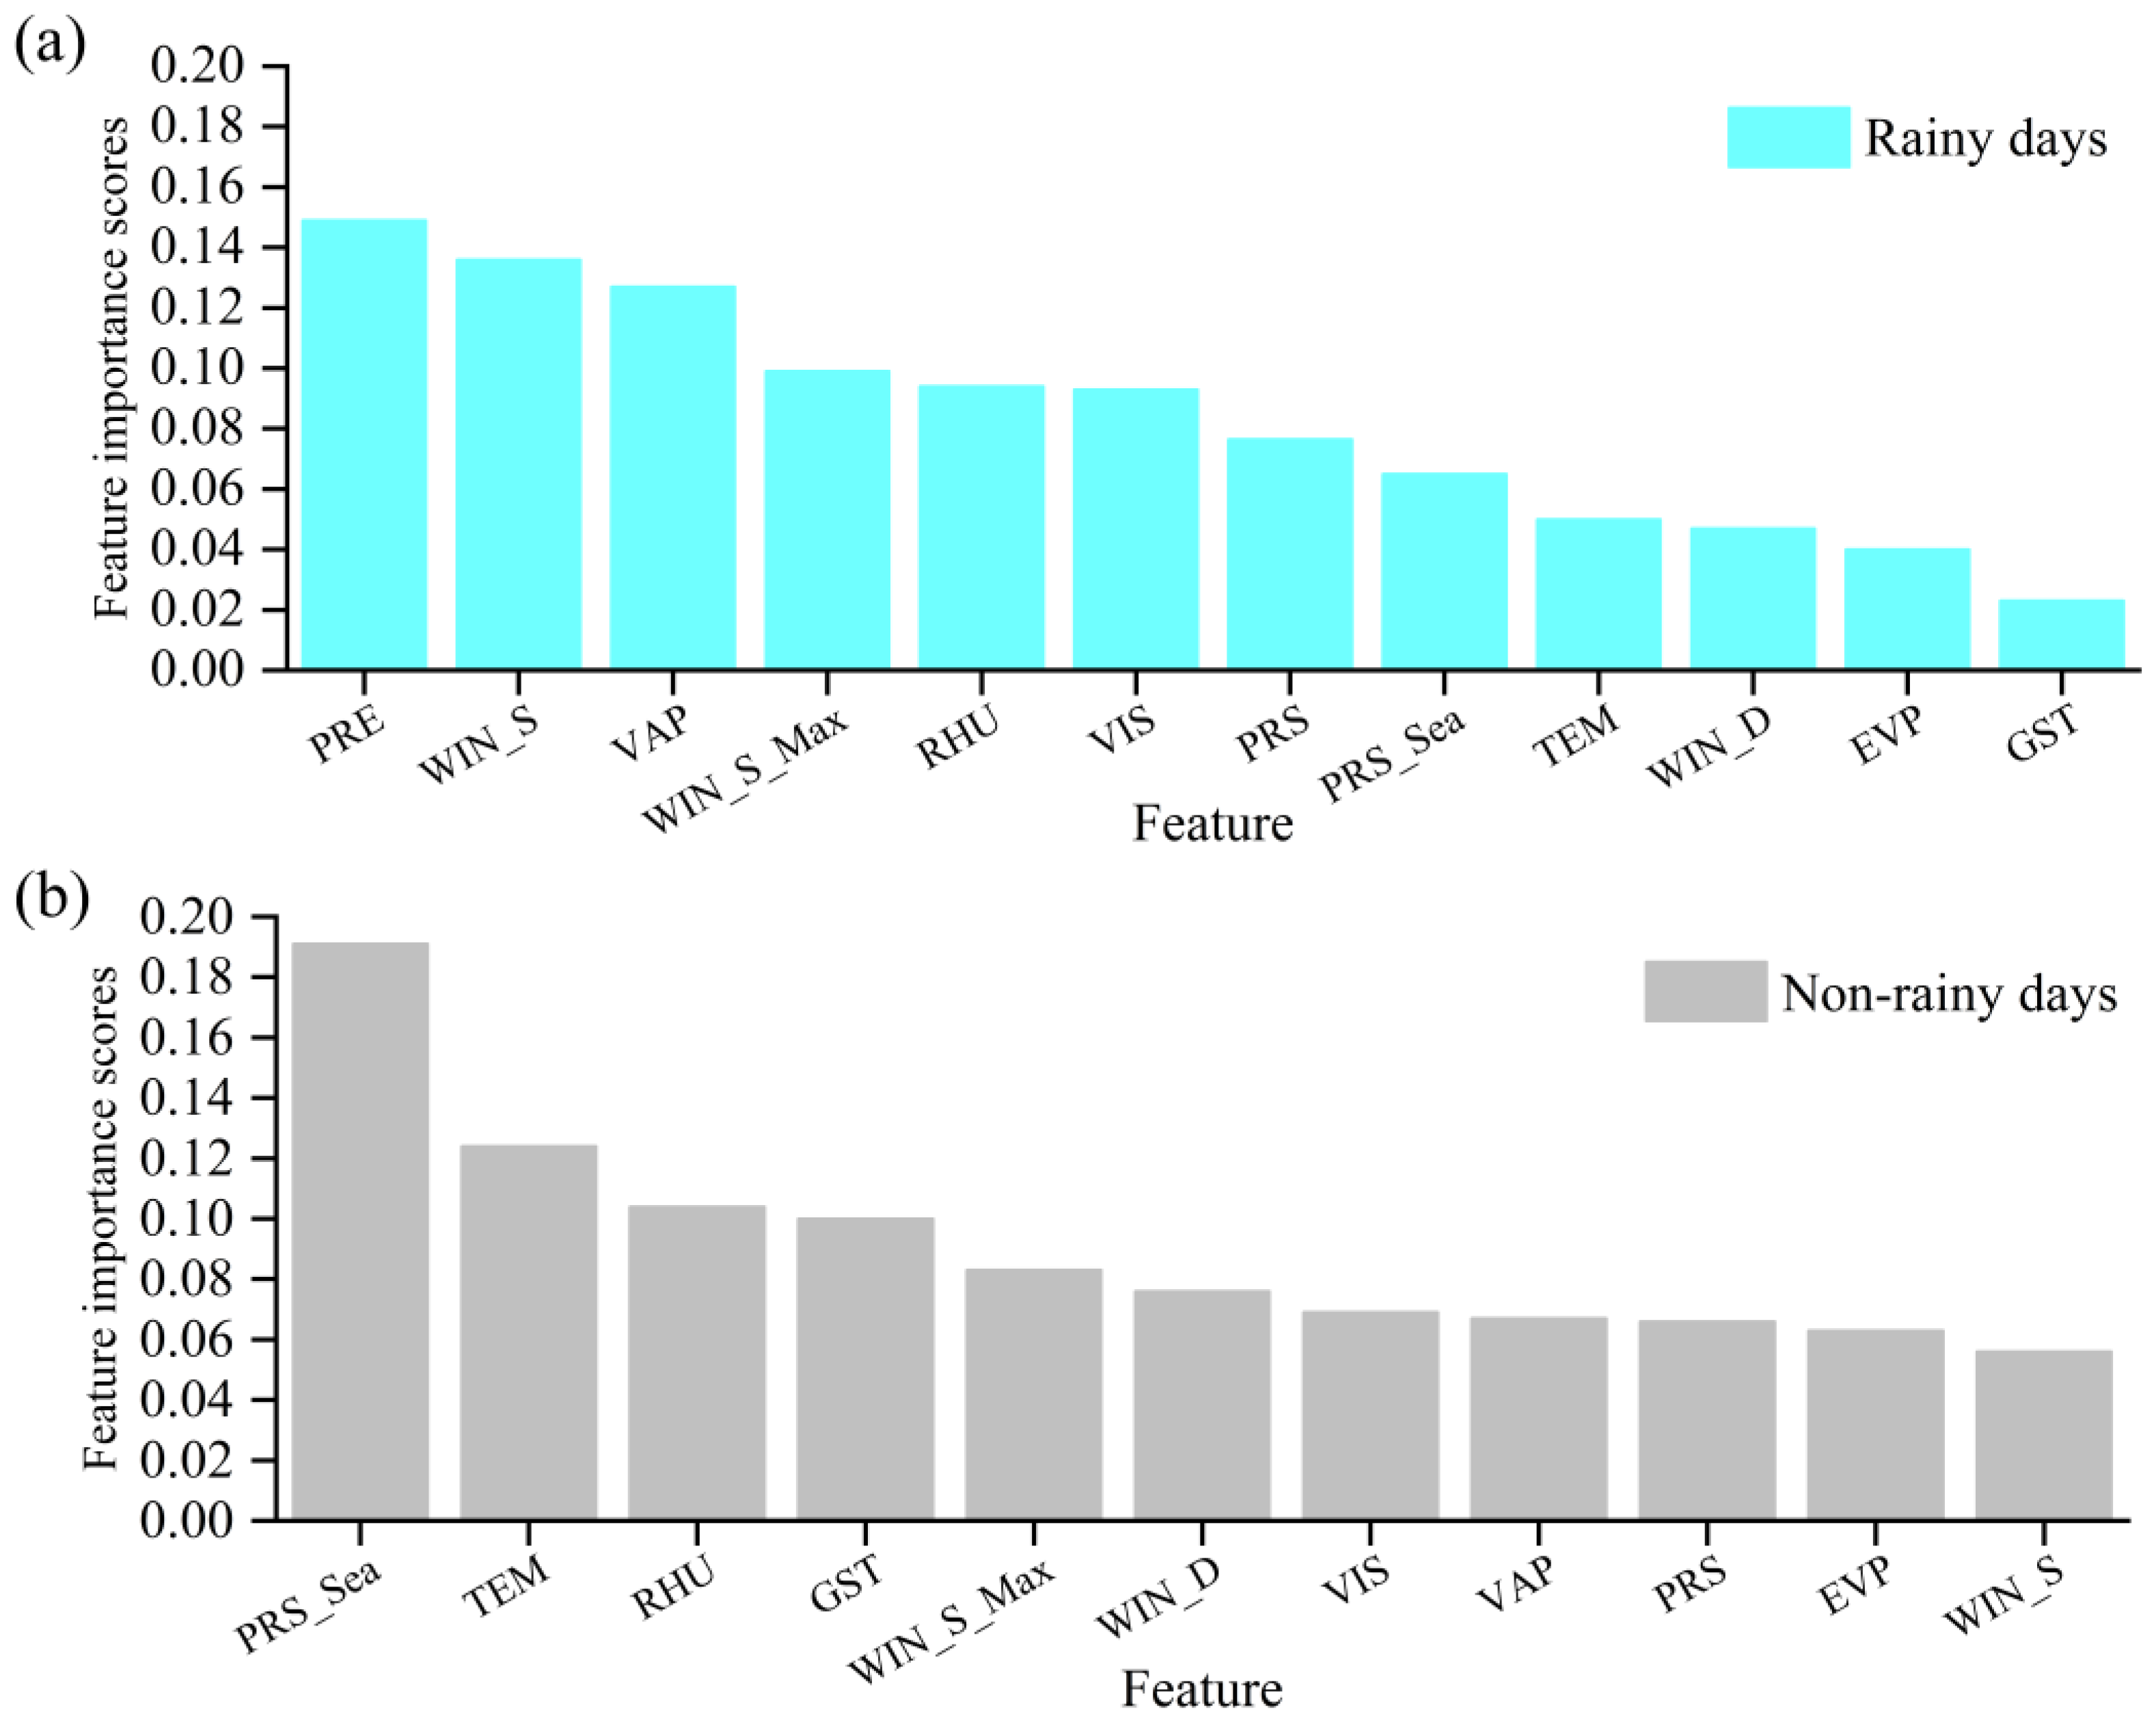
3.4. Important Values of Meteorological Factors That Affect NAIs Concentrations on Rainy and Non-Rainy Days

The RF model could automatically select the model corresponding to the optimal parameters. The parameters for rainy days were n_estimators for 20, max_features for 0.7, and max_depth for 7. Meanwhile, the parameters for non-rainy days were n_estimators for 20, max_features for 1, and max_depth for 7, respectively.
The feature importance scores on rainy and non-rainy days are ranked in Figure 6. The feature importance scores of PRE, WIN_S, and VAP ranked the top three on rainy days, and PRS_Sea, TEM, and RHU ranked the top three among the meteorological factors on non-rainy days.
The RF models on rainy and non-rainy days fit well with R2 > 0.600, and the MSE, RMSE, and MAE values were relatively low (Table 4). Furthermore, the Pearson’s correlation coefficients for rainy and non-rainy days were above 0.8 under the significance level of 0.05.

4. Discussion

4.1. NAIs Concentrations on Rainy and Non-Rainy Days

The NAIs concentrations were significantly higher on rainy days than on non-rainy days (p < 0.05). Furthermore, the environmental factors that contributed to NAIs concentrations differed on rainy and non-rainy days. As Wuyi Mountain National Park (WMNP) is famous for its beautiful scenic and air quality, we further analyzed the relationship between Visibility (VIS) and NAIs concentrations and found that VIS is highly correlated with NAIs concentrations on non-rainy days (Figure 5d), which confirms that NAIs could reduce particulate matter (PM). The forest environment has better air quality, and the mechanism is that NAIs could absorb PM with positive charges, making PM gain weight and fall out of the air, reducing secondary particle generation and purifying the atmosphere [29]. Additionally, NAIs could reduce the adsorption of volatile organic compounds (VOCs) and thus prevent further chemical reactions and the formation of PM2.5 pollutants [30]. Moreover, higher concentrations of NAIs could translate PMs from gas to particle conversion under high humidity and high saturation [19]. Therefore, NAIs could improve the air quality and VIS by eliminating air pollutants.
NAIs concentrations increased as the RHU increased, in agreement with another mountain tourist place [16]. However, the origins of the relative humidity (RHU) differed on rainy and non-rainy days. On rainy days, the RHU was raised as the rainfall increased, and then, the NAIs concentrations increased. Furthermore, cloudiness and thunderstorms could also significantly infect the electrical state of the surface atmosphere and generate NAIs during rainfall [8,31]. On non-rainy days (especially at and after noon), the RHU increased as stagnant water evaporated as a result of the temperature increase, which also resulted in NAIs concentrations increasing. Moreover, we found that the ranking of feature importance of the temperature (TEM) and ground temperature (GST) was relatively higher on non-rainy days, according to the RF model, and with a positive correlation between the NAIs concentrations and evaporation (EVP). For instance, NAIs concentrations improved rapidly and reached the peak value with the TEM and GST during 11:00–14:00 during the whole day on non-rainy days. The reason was that WMNP is located in a subtropical region, where vegetation, heat, and water resources are abundant, and the peak temperature appears after noon, which consequently leads to water evaporating massively from different sources, eventually raising the NAIs concentrations to the peak value. This conclusion agreed with the distribution of NAIs in various landscapes in the Dapeng Peninsula of Southern China [32].

4.2. NAIs Concentrations in Different Types of Non-Rainy Days

To understand NAIs concentrations on different types of non-rainy days, we divided the non-rainy days into the 1st day after rainy days, 2nd day after rainy days, 3rd day after rainy days, and three days after rainy days. The results verified that the NAIs concentrations were similar among the rainy days, the 1st day, and the 2nd day after rainy days, with no significant differences. However, the NAIs concentrations on the 3rd day and three days after rainy days were significantly lower than on the 1st and 2nd days after rainy days. As the rainfall stopped, the NAIs concentrations declined nonlinearly for the subsequent non-rainy days, descending slowly at the beginning and then sharply. This exciting finding further emphasized that rainfall exerted a lag effect of two days on the decline of NAIs concentrations on non-rainy days, especially on the recent non-rainy days after the rain.
The mechanism of NAIs purifies the air, and NAIs attract and deposit PM in the air [1,33]. The air quality was better on non-rainy days in WMNP. The reason was that VIS occupied relatively high feature important scores on non-rainy days. Simultaneously, VIS was significantly positively correlated with NAIs concentrations, reflecting that the higher the NAIs, the better the air quality. WMNP has excellent air quality, is rich in RHU and NAIs concentrations, and is the most famous tourist and forest recreation place in China.

4.3. The Effect of Precipitation on Relative Humidity and NAIs

With the water scissor force (Lenard effect) generated by rainfall on rainy days, the increase in the flow rate of waterfalls and streams generated more water scissor force and a longer lifespan of NAIs [10]. The balloelectric effect could produce numerous negative ions on the splash of water drops during rain [34]. On non-rainy days, especially those close to recent rainy days, rainwater with rising temperatures evaporates in large quantities and produces large amounts of NAIs. Furthermore, NAIs tend to form clusters of water with water molecules, which increases the stability and useful life of NAIs [11]. Fog and mist weather conditions could affect the electric field of the surrounding atmosphere and produce more NAIs [7]. In addition, WMNP has more than 100 days of fog [18]. As the RHU increased, vegetation leaves transpired less, and stomata opened to promote photosynthesis to produce NAIs [35]. WMNP has had abundant plant biodiversity and increased annual precipitation in the last 30 years [36]. Additionally, NAIs concentrations could also be produced by the Lenard effect of the water molecules from waterfalls [10]. The nearest waterfall is located about 50 m from the FR500 station. Therefore, its environment benefits NAIs production and keeps them at high levels. In future works, more negative ion monitoring instruments will help us to gain more useful information to understand the influence of meteorological factors on NAIs during rainy and non-rainy days.

5. Conclusions

The negative air ions (NAIs) concentrations were higher on rainy days than on non-rainy days in Wuyi Mountain National Park in China. The NAIs concentrations decreased slowly within two days after rainy days, indicating that rainy days have a lag effect on the subsequent non-rainy days. On rainy days, the increase in NAIs concentrations was mainly due to PRE and the resulting rapid increase in RHU. On non-rainy days, especially midday and afternoon after rainy days, the air relative humidity (RHU) increased as the accumulated rainwater evaporated, further leading to increased NAIs concentrations. Our study gives insight into the distribution of NAIs concentrations and their influencing factors on rainy days, and we will study the duration and intensity of rainfall on NAIs concentrations in the future.

Author Contributions

Z.X., C.L. and Z.H. designed the study and experiment. C.L., Z.H. and Y.L. collected the data. Z.H. and C.L. conducted the data analysis. Z.X. conducted the visualization. Z.X., Z.H. and C.L. provided the statistical methods. Z.X. tested the existing code components. Z.X., Z.H. and C.L. implemented the random forest (RF) model. Z.X., C.L. and Z.H. drafted the paper. Z.X., Z.H., C.L. and J.L. edited the paper. All authors have read and agreed to the published version of the manuscript.

Funding

This study was funded by the “Smart Weather Service Capacity Building” of the Mountain Floods and Geological Disasters Meteorological Protection Project of China Meteorological Administration (FJYS2018-062), “Characterization of NAIs concentrations distribution in scenic areas of Fujian Province” of the Fujian Meteorological Service Center Project of 2019 (201903), “Research on the characteristics of NAIs concentrations distribution in natural scenic spots: the case of 5A-level scenic spots in Fujian Province” of open the project of the Institute of Meteorological Big Data-Digital Fujian (202010702), and Forestry Peak Discipline Construction Project of Fujian Agriculture and Forestry University (72202200205), “Study on spatial adaptation between AQI and climate tourism” of National Natural Science Foundation of China (42101238).

Institutional Review Board Statement

Not applicable.

Informed Consent Statement

Not applicable.

Data Availability Statement

The data presented in this study are within the article.

Acknowledgments

We wish to express our thanks for the support from the Meteorological Bureau of Wuyishan City and Wuyi Mountain National Park. The authors also sincerely appreciate the helpful and constructive comments provided by the three reviewers of the manuscript.

Conflicts of Interest

The authors declare no conflict of interest.

References

  1. Nadali, A.; Arfaeinia, H.; Asadgol, Z.; Fahiminia, M. Indoor and outdoor concentration of PM10, PM2.5 and PM1 in residential building and evaluation of negative air ions (NAIs) in indoor PM removal. Environ. Pollut. Bioavailab. 2020, 32, 47–55. [Google Scholar] [CrossRef]
  2. Liu, W.; Huang, J.; Lin, Y.; Cai, C.; Zhao, Y.; Teng, Y.; Mo, J.; Xue, L.; Liu, L.; Xu, W.; et al. Negative ions offset cardiorespiratory benefits of PM2.5 reduction from residential use of negative ion air purifiers. Indoor Air. 2021, 31, 220–228. [Google Scholar] [CrossRef]
  3. Bowers, B.; Flory, R.; Ametepe, J.; Staley, L.; Patrick, A.; Carrington, H. Controlled trial evaluation of exposure duration to negative air ions for the treatment of seasonal affective disorder. Psychiatry Res. 2018, 259, 7–14. [Google Scholar] [CrossRef]
  4. Liu, R.; Lian, Z.; Lan, L.; Qian, X.; Chen, K.; Hou, K.; Li, X. Effects of negative oxygen ions on sleep quality. Proc. Eng. 2017, 205, 2980–2986. [Google Scholar] [CrossRef]
  5. Yan, X.; Wang, H.; Hou, Z.; Wang, S.; Zhang, D.; Xu, Q.; Tokola, T. Spatial analysis of the ecological effects of negative air ions in urban vegetated areas: A case study in Maiji, China. Urban For. Urban Green. 2015, 14, 636–645. [Google Scholar] [CrossRef]
  6. Suwardi, A.; Ooi, C.C.; Daniel, D.; Tan, C.K.I.; Li, H.; Liang, O.Y.Z.; Tang, Y.K.; Chee, J.Y.; Sadovoy, A.; Jiang, S.; et al. The Efficacy of Plant-Based Ionizers in Removing Aerosol for COVID-19 Mitigation. Research 2021, 2021, 2173642. [Google Scholar] [CrossRef]
  7. Hoppel, W.A.; Anderson, R.V.; Willet, J.C. Atmospheric Electricity in the Planatary Boundary Layer. In The Earth’s Electrical Environment; National Academy Press: Washington, DC, USA, 1986; pp. 195–205. [Google Scholar]
  8. Borra, J.P.; Roos, R.A.; Renard, D.; Lazar, H.; Goldman, A.; Goldman, M. Electrical and chemical consequences of point discharges in a forest during a mist and a thunderstorm. J. Phys. D Appl. Phys. 1997, 30, 84–93. [Google Scholar] [CrossRef]
  9. Kosenko, E.A.; Kaminsky, Y.G.; Stavrovskaya, I.G.; Sirota, T.V.; Kondrashova, M.N. The stimulatory effect of negative air ions and hydrogen peroxide on the activity of superoxide dismutase. FEBS Lett. 1997, 410, 309–312. [Google Scholar] [CrossRef]
  10. Iwama, H. Negative air ions created by water shearing improve erythrocyte deformability and aerobic metabolism. Indoor Air. 2004, 14, 293–297. [Google Scholar] [CrossRef]
  11. Yamada, R.; Yanoma, S.; Akaike, M.; Tsuburaya, A.; Sugimasa, Y.; Takemiya, S.; Imada, T. Water-generated negative air ions activate NK cell and inhibit carcinogenesis in mice. Cancer Lett. 2006, 239, 190–197. [Google Scholar] [CrossRef]
  12. Jiang, S.Y.; Ma, A.; Ramachangran, S. Negative air ions and their effects on human health and air quality improvement. Int. J. Mol. Sci. 2018, 19, 2966. [Google Scholar] [CrossRef] [PubMed]
  13. Zhang, X.; Cao, J.; Zhang, S. Distribution Characteristics of Air Anions in Beidaihe in Different Ecological Environments. J. Geosci. Environ. Prot. 2018, 6, 133–150. [Google Scholar] [CrossRef]
  14. Vana, M.; Ehn, M.; Petäjä, T.; Vuollekoski, H.; Aalto, P.; Leeuw, G.D.; Ceburnis, D.; O’Dowd, C.D.; Kulmala, M. Characteristic features of air ions at Mace Head on the west coast of Ireland. Atmos. Res. 2008, 90, 278–286. [Google Scholar] [CrossRef]
  15. Wang, W.; Xia, S.; Zhu, Z.; Wang, T.; Cheng, X. Spatiotemporal distribution of negative air ion and PM2.5 in urban residential areas. Indoor Built Environ. 2022, 31, 1127–1141. [Google Scholar] [CrossRef]
  16. Ling, D. Review on Research of the Negative Air Ion Concentration Distribution and its Correlation with Meteorological Elements in Mountain Tourist Area. Earth Sci. 2019, 8, 60. [Google Scholar] [CrossRef]
  17. Lin, S.; Hu, X.; Chen, H.; Wu, C.; Hong, W. Spatio-temporal variation of ecosystem service values adjusted by vegetation cover: A case study of Wuyishan National Park Pilot, China. J. For. Res. 2021, 33, 851–863. [Google Scholar] [CrossRef]
  18. Xu, X.; Zhou, Y.; Ruan, H.; Luo, Y.; Wang, J. Temperature sensitivity increases with soil organic carbon recalcitrance along an elevational gradient in the Wuyi Mountains, China. Soil Biol. Biochem. 2010, 42, 1811–1815. [Google Scholar] [CrossRef]
  19. Jizhi, W.; Yuanqin, Y.; Xiaofei, J.; Yang, X.; Guo, D.; Yanzhen, Q.; Xiaoli, G. Influence of meteorological conditions on the negative oxygen ion characteristics of well-known tourist resorts in China. Sci. Total Environ. 2021, 819, 152021. [Google Scholar] [CrossRef]
  20. Li, C.; Xie, Z.; Chen, B.; Kuang, K.; He, Z. Different time scale distribution of negative air ions concentrations in Mount Wuyi National Park. Int. J. Environ. Res. Public Health 2021, 18, 5037. [Google Scholar] [CrossRef]
  21. Li, A.; Li, Q.; Zhou, B.; Ge, X.; Cao, Y. Temporal dynamics of negative air ion concentration and its relationship with environmental factors: Results from long-term on-site monitoring. Sci. Total Environ. 2022, 832, 155057. [Google Scholar] [CrossRef]
  22. Liu, Z.; Liu, Y.; Murphy, J.; Maghirang, R. Estimating Ambient Ozone Effect of Kansas Rangeland Burning with Receptor Modeling and Regression Analysis. Environments 2017, 4, 14. [Google Scholar] [CrossRef]
  23. Shi, G.; Zhou, Y.; Sang, Y.; Huang, H.; Zhang, J.; Meng, P.; Cai, L. Modeling the response of negative air ions to environmental factors using multiple linear regression and random forest. Ecol. Inform. 2021, 66, 101464. [Google Scholar] [CrossRef]
  24. Munkhdalai, L.; Munkhdalai, T.; Park, K.H.; Lee, H.G.; Li, M.; Ryu, K.H. Mixture of activation functions with extended min-max normalization for forex market prediction. IEEE Access. 2019, 7, 183680–183691. [Google Scholar] [CrossRef]
  25. Pedregosa, F.; Varoquaux, G.; Gramfort, A.; Michel, V.; Thirion, B.; Grisel, O.; Blondel, M.; Prettenhofer, P.; Weiss, R.; Dubourg, V.; et al. Scikit-learn: Machine Learning in Python. J. Mach. Learn. Res. 2011, 12, 2825–2830. [Google Scholar]
  26. Ramayanti, D.; Salama, H.U. Text Classification on Dataset of Marine and Fisheries Sciences Domain using Random Forest Classifier. Int. J. Comput. Tech. 2018, 5, 1–7. [Google Scholar]
  27. Aslam, S.; Ayub, N.; Farooq, U.; Alvi, M.J.; Albogamy, F.R.; Rukh, G.; Haider, S.I.; Azar, A.T.; Bukhsh, R. Towards Electric Price and Load Forecasting Using CNN-Based Ensembler in Smart Grid. Sustainability 2021, 13, 12653. [Google Scholar] [CrossRef]
  28. Li, W.; Wu, H.; Duan, S.; Li, Z.; Liu, Q. Selection of Predictor Variables in Downscaling Land Surface Temperature using Random Forest Algorithm. In Proceedings of the IGARSS 2019—2019 IEEE International Geoscience and Remote Sensing Symposium, Yokohama, Japan, 28 July–2 August 2019; pp. 1817–1820. [Google Scholar]
  29. Su, W. Spatial-temporal Distribution Characteristics of PM2.5 and PM10 in Nanchang City and the Mechanism Blocked by Urban Forest. Ph.D. Dissertation, Jiangxi Agricultural University, Nanchang, China, 2017. [Google Scholar]
  30. Zhang, C.; Wu, Z.; Li, Z.; Li, H.; Lin, J. Inhibition effect of negative air ions on adsorption between volatile organic compounds and environmental particulate matter. Langmuir 2020, 36, 5078–5083. [Google Scholar] [CrossRef]
  31. Kalchikhin, V.; Kobzev, A.; Nagorskiy, P.; Oglezneva, M.; Pustovalov, K.; Smirnov, S.; Filatov, D. Connected Variations of Meteorological and Electrical Quantities of Surface Atmosphere under the Influence of Heavy Rain. Atmosphere 2020, 11, 1195. [Google Scholar] [CrossRef]
  32. Wang, Y.; Ni, Z.; Di, W.; Fan, C.; Lu, J.; Xia, B. Factors influencing the concentration of negative air ions during the year in forests and urban green spaces of the Dapeng Peninsula in Shenzhen, China. J. For. Res. 2019, 31, 2537–2547. [Google Scholar] [CrossRef]
  33. Grinshpun, S.A.; Mainelis, G.; Trunov, M.; Adhikari, A.; Reponen, T.; Willeke, K. Evaluation of ionic air purifiers for reducing aerosol exposure in confined indoor spaces. Indoor Air. 2005, 15, 235–245. [Google Scholar] [CrossRef]
  34. Tammet, H.; Komsaare, K.; Hõrrak, U. Intermediate ions in the atmosphere. Atmos. Res. 2014, 135–136, 263–273. [Google Scholar] [CrossRef]
  35. Miao, S.; Zhang, X.; Han, Y.; Sun, W.; Liu, C.; Yin, S. Random Forest Algorithm for the Relationship between Negative Air Ions and Environmental Factors in an Urban Park. Atmosphere 2018, 9, 463. [Google Scholar] [CrossRef]
  36. Xu, Z.; Ma, L.; Chen, M.; Bai, J.; Chen, P.; Han, Y.; Lu, X.; Wang, B.; Zhao, D.; Luo, X.; et al. The avian community structure of Wuyi Mountains is sensitive to recent climate warming. Sci. Total Environ. 2021, 776, 145825. [Google Scholar] [CrossRef]
Figure 1. Box–Whisker plot representing the values of NAIs concentrations on rainy and non-rainy days. The Box–Whisker plot contains statistical values from the bottom to the top as the minimum value, 3rd quartile value, median value, 1st quartile value, and maximum value. The 3rd quartile value represents the value below which contains the lower 25% of the dataset. The 1st quartile value represents the value above which contains the upper 25% of the dataset. The black spot represents the mean value. The red star dot represents the outlier value. (a) NAIs concentrations on rainy and non-rainy days. (b) NAIs concentrations on rainy days and different types of non-rainy days (the non-rainy days divided into the 1st day after rainy days, the 2nd day after rainy days, the 3rd day after rainy days, and three days after rainy days).
Atmosphere 14 00377 g001
Figure 2. Time series distribution of the daily average NAIs concentrations on rainy and non-rainy days. (a) NAIs concentrations on rainy and non-rainy days. (b) NAIs concentrations on rainy days and multiple types of non-rainy days. Various non-rainy days include the 1st day after rainy days, the 2nd day after rainy days, the 3rd day after rainy days, and three days after rainy days.
Atmosphere 14 00377 g002
Figure 3. The monthly data of NAIs concentrations and precipitation in 2019. Monthly data of NAIs concentrations is the mean value of the daily NAIs concentrations, and monthly data of precipitation is the cumulative value of the hourly precipitation.
Atmosphere 14 00377 g003
Figure 4. Time series distribution of hourly data (mean value ± standard error) of NAIs concentrations per day (24 h) on rainy and non-rainy days.
Atmosphere 14 00377 g004
Figure 5. Scatter plot of NAIs concentrations versus meteorological factors on rainy and non-rainy days. (af) Scatter plots of PRS, RHU, VAP, VIS, TEM, and GST with NAIs concentrations.
Atmosphere 14 00377 g005
Figure 6. Feature importance scores ranking of the importance of the meteorological factors on (a) rainy and (b) non-rainy days.
Atmosphere 14 00377 g006
Table 1. Wilcoxon independent two-sample rank sum test for NAIs concentrations on rainy and non-rainy days.
TypeMedian (P25, P75)Wilcoxon Test
z Valuep-Value
Rainy days10,109.17 (5464.17, 26,513.50)22.171<0.05
Non-rainy days6067.70 (4416.09, 8894.13)
Note: The z value indicated a standard normal distribution test statistic value. The p-value is the probability that the null hypothesis is valid. The median value is 1/2 of the dataset. The value of P25 is the 25th percentile of the dataset, and the value of P75 value is the 75th percentile of the dataset.
Table 2. Kruskal–Wallis test for NAIs concentrations on rainy days and different types of non-rainy days.
TypeKruskal–Wallis Test
z Valuep-Value
Rainy days—1st day after rainy days0.3951.000
Rainy days—2nd day after rainy days1.9770.481
Rainy days—3rd day after rainy days9.915<0.05
Rainy days—3 days after rainy days31.427<0.05
1st day after rainy days—2nd day after rainy days1.4041.000
1st day after rainy days—3rd day after rainy days8.675<0.05
1st day after rainy days—3 days after rainy days22.315<0.05
2nd day after rainy days—3rd day after rainy days6.978<0.05
2nd day after rainy days—3 days after rainy days17.385<0.05
3rd day after rainy days—3 days after rainy days5.928<0.05
Table 3. Spearman correlation for the NAIs concentrations and related meteorological factors on rainy and non-rainy days.
FactorRainy DaysNon-Rainy DaysFactorRainy DaysNon-Rainy Days
rprprprp
PRE0.256 **0.002--WIN_D0.010.9080.1220.098
TEM0.050.5520.457 **0WIN_S−0.1020.22−0.1210.101
PRS−0.183 *0.027−0.595 **0WIN_S_Max−0.0570.492−0.110.139
PRS_Sea−0.172 *0.037−0.587 **0GST0.0390.6420.416 **0
RHU0.241 **0.0030.386 **0EVP−0.0590.480.149 *0.043
VAP0.1390.0930.539 **0VIS0.1120.1790.345 **0
Note: ** indicated correlation significant level 0.01 (two-tailed), * indicated correlation significant level 0.05 (two-tailed), r indicated correlation coefficient, and p indicated significance (two-tailed). The meteorological factors included precipitation (PRE), relative humidity (RHU), temperature (TEM), air pressure (PRS), sea level pressure (PRS_Sea), water vapor pressure (VAP), mean wind speed (WIN_S), mean wind direction (WIN_D), maximum wind speed (WIN_S_Max), ground temperature (GST), evaporation (EVP), and visibility (VIS).
Table 4. Comparison of the parameters fitted by the RF model on rainy and non-rainy days.
MSERMSEMAER2Pearson’s Correlation Coefficient
Correlation CoefficientSignificance
Rainy days0.0280.1660.1300.6520.839<0.05
Non-rainy days0.0180.1340.0830.6790.841<0.05
Disclaimer/Publisher’s Note: The statements, opinions and data contained in all publications are solely those of the individual author(s) and contributor(s) and not of MDPI and/or the editor(s). MDPI and/or the editor(s) disclaim responsibility for any injury to people or property resulting from any ideas, methods, instructions or products referred to in the content.

