Abstract
Based on the analysis of air quality data in Yunnan Province from 2015 to 2020, combined with spatial interpolation analysis and geographic detector factor analysis, the spatial–temporal evolution characteristics of air quality in Yunnan Province have been studied, and the main driving factors, the mechanisms, and the impact of regional COVID-19 control measures affecting air quality have been discussed. The results show that the air quality in Yunnan Province was generally good (superior rate > 98%) from 2015 to 2020, that the Air Quality Index (AQI) value is better in the wet season than in the dry season, and that the concentration of major pollutants shows a decreasing trend. AQI values are spatially high in the east and low in the west. The relative humidity, precipitation, population density, building construction area, and civil vehicles have a greater degree of explanation for the spatial differentiation of AQI, whereas the synergistic influence (maximum value 0.92) of socio-economic factors and meteorological factors is significantly greater than that of a single factor (maximum value 0.80) by the geographic detector model. The control measures for COVID-19 in 2020 reduced the concentration of major pollutants in the atmosphere to a certain extent. Controlling regional air pollution in urban agglomerations in low-latitude plateau areas can improve their air quality by reducing human activities. However, the control of O3 concentration is more complex, and more restrictive factors need to be considered. The results will provide a scientific basis for the prevention and control of air pollution in plateau cities.
1. Introduction
Air quality is closely related to people’s production, life, and health. In recent years, with rapid socio-economic development and massive increases in human emissions, environmental incidents have been occurring in several densely populated areas of the world [1,2]. These incidents have become one of the most significant challenges facing humanity in recent decades. Air Quality Index (AQI), as one of the essential indicators to describe the cleanliness and pollution level of air, has been widely monitored and studied in various regions of China since January 2013 [3]. Currently, studies related to air quality in China are focused mainly on regions with poor air quality and with more developed economies, such as Northern China [4,5,6], the Yellow River Basin [7,8,9], the Yangtze River Basin [10,11,12], the Pearl River Delta [13,14], and coastal areas [15]. The spatial–temporal distribution characteristics of air quality in each region and the influencing mechanisms are explored using various methods such as Environmental Kuznets Curve (EKC) [16], Multivariate regression model [17], Grey Relational Analysis (GRA) [5], and Spatial Error Model (SEM) [18]. Relevant studies have shown that China’s spatial differentiation of air quality is obvious. It is characterised regionally in that the air quality of the North is higher than that of the South, and that of the eastern coast is higher than that of the western interior [19,20], although the overall air quality in China has improved in recent years [21,22]. However, seasonal differences are evident, with air quality being better in the wet season than in the dry season [23]. Further studies on the factors influencing air quality found that precipitation, temperature, relative humidity [24], population concentration, economic growth, and industrialisation [25] are the main factors influencing air quality in China.
The geographic detector method can reflect the intrinsic causal relationship more accurately than traditional regression analysis, variance analysis, causal analysis method, grey-relational degree, partial correlation analysis method, and the Tobit model in studying the characteristics of regional spatial differentiation and revealing the main driving forces and influencing mechanism [8,26,27]. Therefore, in recent years, regional heterogeneity of population aging [28], assessment of epidemiological mortality factors of COVID-19 [29], quantitative estimation of regional soil erosion [30], studies on the formation mechanism of regional poverty [31], and analysis on the driving factors of the spatial–temporal distribution of mountain floods [32] have been widely applied.
Yunnan, located on the southeastern edge of the Qinghai–Tibet Plateau in China, is a typical representative of the latitudinal plateau region. It is influenced by the South Asian monsoon (SASM), the East Asian monsoon (EAM), and the Qinghai–Tibet Plateau, and its complex geomorphic characteristics, resulting in the complex regional atmospheric circulation system [33]. In recent years, the lack of rain in the dry season, the significant temperature difference between day and night, and the increase in exogenous pollutants have led to occasional air pollution events in Yunnan [34,35]. However, for the regions where many studies have been carried out on air quality in China, the research on the primary factors and driving mechanism of air pollution in plateau cities in Southwest China needs further strengthened.
In this study, the analysis of air quality indicators (PM2.5, PM10, SO2, NO2, O3, CO) in 16 cities of Yunnan from 2015 to 2020 was combined with spatial interpolation and the geographic detector model to study the spatial-temporal distribution characteristics of the air quality in the area. The aim was to explore the influencing factors and driving mechanisms of air quality in Yunnan. The results will provide a scientific basis for air quality control policies in plateau cities of China and ecological poverty alleviation in Yunnan.
2. Materials and Methods
2.1. Study Area
The Yunnan Province (21°8′~29°15′ N, 97°31′~106°11′ E) is located at the southeast end of the Qinghai–Tibetan Plateau, with the Tropic of Cancer cutting through it (Figure 1a). It is a low-latitude plateau region; the land surface is like a staircase descending from northwest to southeast at elevations between 1850 and 2100 m (Figure 1b). Such elevation differences yield a sharp climatic gradient across the province. The subtropical monsoon climate of the region is characterised by a cool and relatively dry climate between September and April, with a warmer and wetter season between May and October. The mean annual precipitation (MAP) is 1260 mm. Most of the precipitation falls as rain during the summer and autumn months (from May to October), which supplies 80% of the annual precipitation [36]. The mean annual temperature (MAT) is between 12 and 22 degrees Celsius. Yunnan Province governs 16 prefecture-level administrative regions with a population of nearly 47 million at the end of 2020. The gross domestic product (GDP) is approximately CNY 2452 billion, with an urbanisation ratio of 50.05 percent. In the last few years, with accelerated urbanisation, the rapid growth of urban population, and increasing human activities, the ecological environment, especially air quality, has been facing increasing pressure.
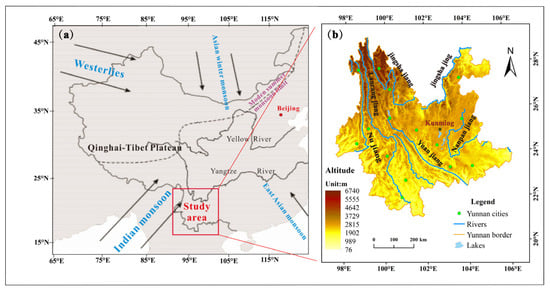
Figure 1.
(a) Location of the study area. (b) Distribution of meteorological sites in Yunnan.
2.2. Data Sources
(1) Air quality data
The daily data of AQI, PM2.5, PM10, CO, NO2, SO2, and O3 of 16 cities of Yunnan Province are from a Chinese air quality online monitoring and analysis platform (https://www.aqistudy.cn/historydata/ (accessed on 15 October 2021)).
(2) Meteorological and socio-economic data
AQI is influenced by both geographical and socio-economic factors [8]. For example, the primary sources of PM2.5, PM10, SO2, NO2, and CO are burning [37,38] (residential energy use, vehicle emissions, biomass burning), with PM2.5 and PM10 also being closely related to dust [39]. The sources of these pollutants are all related to socio-economic factors such as population density, building construction area, GDP, and civilian vehicle (CV). Meanwhile, pollutant emission, decomposition, and transport are highly correlated with geographical environmental factors. Accordingly, taking into account the research results on the AQI in recent years [25,40] and the data availability, we have selected several geographical and socio-economic factors to analyse the factors that influence the AQI variations.
Annual air temperature (°C), annual precipitation (mm), annual sunshine duration (h), relative humidity (%), sunshine hours (h), annual minimum relative humidity (%), wind speed (m/s), and wind direction (°) data for the years 2015−2020 were obtained from the China Meteorological Data Service Center (http://data.cma.cn/ (accessed on 15 October 2021)). The data of eight socio-economic factors: regional GDP, GDP of primary industry (GDP1), GDP of secondary industry (GDP2), GDP of tertiary industry (GDP3), civilian vehicle (CV), population density (people per square mile), and construction land area (million hectares) data are all from the Yunnan Statistical Yearbook in 2015–2020 (http://stats.yn.gov.cn/ (accessed on 16 October 2021)).
2.3. Methods
This paper uses three main research methods: Air Quality Index, Ordinary Kriging, and Geographical detector factor analysis (Figure 2). AQI is used to evaluate air quality, Ordinary Kriging is used to characterise the spatial distribution of AQI and pollutants, and Geographical detector factor analysis is used to identify the main influencing factors of air quality variation. The details of each method are described below.
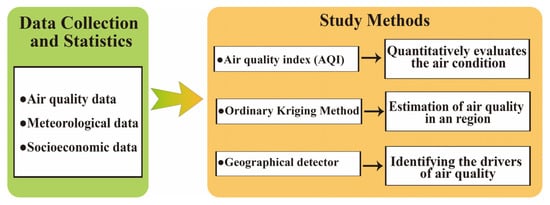
Figure 2.
Roadmap of methods.
2.3.1. Air Quality Index
AQI is an index that quantitatively evaluates air condition. It first calculates the Individual Air Quality Index (IAQI) for each participation factor (CO, NO2, SO2, O3, PM2.5, PM10) and uses the maximum value of each IAQI as the value of AQI:
The individual AQI of pollutions is defined as:
IAQIP is the individual AQI of pollution;
Cp is the concentration of pollution;
BPHi is the high value of the concentration limit of pollutant P and is similar to Cp;
BPLo is the low value of the concentration limit of pollutant P and is similar to Cp;
IAQIHi refers to the IAQI corresponding to BPHi;
IAQILo is IAQI corresponding to BPLo;
The air condition was scored on a six-grade arbitrary scale, depending on the “Ambient air quality standards” (GB 3095-2012).
2.3.2. Ordinary Kriging Method
The Ordinary Kriging method (OKM), also known as Kriging spatial interposition, is a method for the best unbiased prediction of regionalised variables in a finite region, based on variogram theory and structural analysis [41]. This interpolation method is better than inverse distance interpolation in terms of continuity of results and accuracy [3]. It is the best unbiased prediction of the random field at an unobserved location from observations after considering the shape, size, and spatial orientation of the sample points, their spatial relationship with one another, and the structural information provided by the variogram [42]. The Ordinary Kriging method is calculated as [43]:
where (w0) refers to the predicted value of the site W0 to be predicted; Z(Wi) is the measurement at position Wi of the sample point at n identified positions (i = 1, 2, ……, n); and λi is the weight of the residual corresponding to the measured value.
2.3.3. Geographical Detector
Spatial stratified heterogeneity (SSH) refers to the phenomenon that the within strata are more similar than the between strata. Geographic detector factor analysis is a statistical tool to measure spatial stratified heterogeneity (SSH) and reveals the driving forces behind it. This paper focuses on using the method to reveal the influence of geographical and socio-economic factors on AQI and the interactions between the factors.
If an independent variable X has a significant effect on a dependent variable Y, there should be some similarity in the spatial distribution of the independent and dependent variables, and it can be defined as [44]:
The study area is stratified into H stratums, denoted by j = 1, 2, ……, H. Nj and N are the number of cells in strata j and the whole area, respectively; and are the variances of the Y for strata j and the entire area, respectively. The values of q are in the range [0, 1], and greater values indicate a more pronounced spatial heterogeneity of Y. If the stratification is generated by the independent variable X, a higher value of q indicates a stronger explanatory strength of the independent variable X for attribute Y.
3. Results
3.1. Spatial–Temporal Variation Characteristics of Air Quality
3.1.1. Temporal Variation Characteristic
The AQI values in Yunnan fluctuated between 10 and 258 from 2015 to 2020, with an average value of 48.3 and a slight variation in annual average values (Figure 3). The values of the AQI are the smallest in 2018 and the largest in 2020. The superior rate (ratio of days with superior air quality to total days) of air quality in Yunnan from 2015 to 2020 is 97.52% to 99.78%.
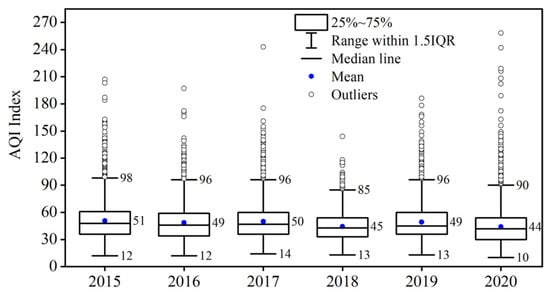
Figure 3.
The characteristics of AQI in Yunnan from 2015 to 2020.
Further analysis of the monthly AQI variation characteristics of Yunnan from 2015 to 2020 reveals (Figure 4) that the AQI values are small (<50) from June to November, and the minimum AQI values occur from July to September. However, December to May of the following years are relatively high, and the maximum AQI values occur from March to April. This is significantly different from changes in Northeastern, Northern, and Southwestern China [45].
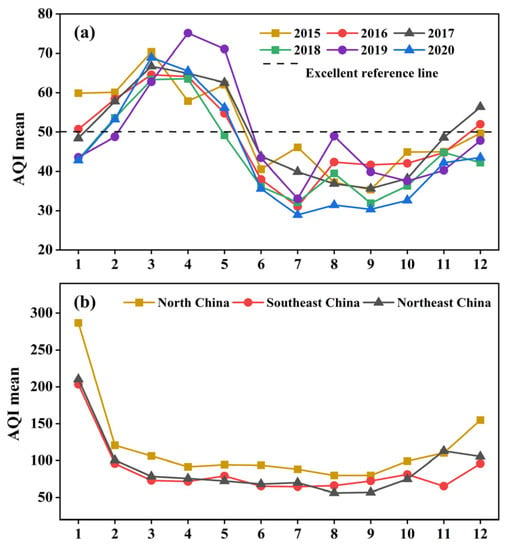
Figure 4.
Monthly AQI variation characteristics (a) in Yunnan and (b) other regions of China from 2015 to 2020.
The median monthly AQI data for Yunnan indicate a clear increase trend (63~43) in the dry season (November to April) and a clear lowering trend (57~31) in the wet season, according to the analysis of the AQI values for January–December 2015–2020 in Yunnan (Figure 5). Simultaneously, there are more outliers in the dry season than in the wet season, indicating that AQI values fluctuate significantly in the dry season.
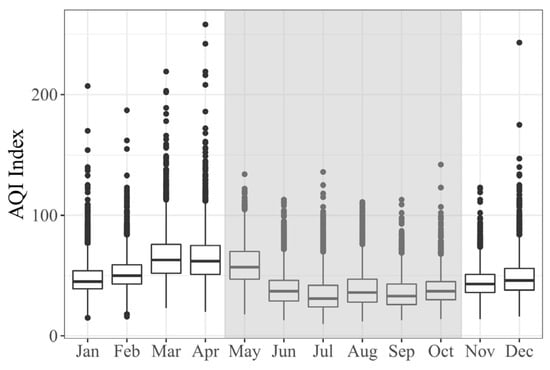
Figure 5.
Characteristics of monthly AQI changes from 2015–2020, with shaded areas indicating the wet season (May–October).
3.1.2. Spatial Variation Characteristics
Analysis of the year-by-year spatial variation of the air quality (AQI) index of the Yunnan urban agglomeration from 2015 to 2020 using kriging interpolation revealed (Figure 6) that the spatial variability of AQI values in the study area is significant, with the overall performance is higher in the east–west region than in the central part, with the maximum AQI value occurring in Northeastern Yunnan.
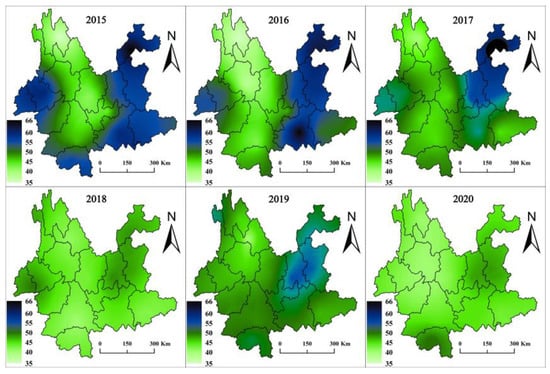
Figure 6.
Distribution of annual average AQI values in Yunnan from 2015 to 2020.
Moreover, a further study of AQI values for the dry season (November to April of the following year) and the wet season (May to October) in Yunnan from 2015 to 2020 also showed (Figure S1) that the dry season AQI is significantly higher than the wet season AQI in the same year; this means that the maximum AQI of the year occurs in the dry season.
3.2. Spatial-Temporal Variation Characteristics of Main Pollutant Concentrations
3.2.1. Temporal Variation Characteristics
Based on the interannual variation characteristics of major pollutant concentrations in Yunnan from 2015 to 2020 (Table 1), there is little difference in the annual average concentration of the six pollutants, and most of the pollutants except O3 show a decrease.

Table 1.
The average concentration of major air pollutants from 2015 to 2020.
Meanwhile, the analysis of the monthly changes in the concentration of main air pollutants in Yunnan from 2015 to 2020 shows a significant difference between each month (Figure 7). Values of ρ(PM2.5) and ρ(PM10) showed an “N” shape, with low values from June to November and high values from November to April in the next year. The characteristics of the changes were similar to the monthly change in AQI. Values of ρ(SO2) and ρ(CO) showed a “V” shape and showed a decreasing trend from January to June and an increasing trend from July to December. ρ(NO2) has a similar trend with ρ(SO2) and ρ(CO), but it shows a sharp decrease in February. The concentration of ρ(O3) was lower in monthly variation except from March to May, when the concentration was higher. The concentration of main pollutants, especially ρ(SO2), showed a decreasing trend.
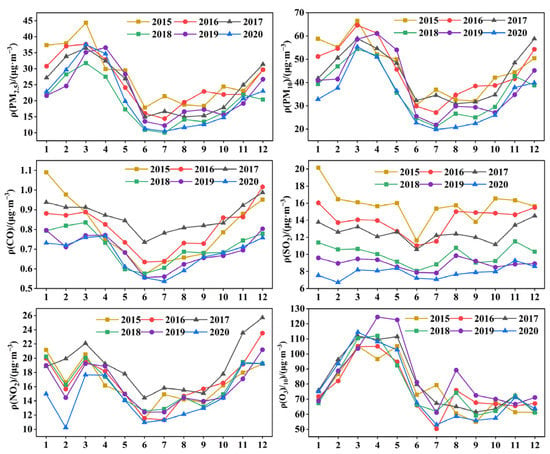
Figure 7.
Monthly variation of air pollutant concentration in Yunnan from 2015 to 2020.
3.2.2. Spatial Variation Characteristics
The study focused on the spatial-temporal variation characteristics of the main atmospheric pollutants in Yunnan from 2015 to 2020 (Figure S2), and it was found that different pollutants had spatial-temporal differentiation. PM2.5, PM10, and SO2 are generally lower in the central and midwestern parts of the country and higher in the eastern and western parts of the country. However, the concentrations of NO2, O3 and CO were higher in the country’s north and lower in the south.
3.2.3. The Effect of Wind Direction and Wind Speed on Main Pollutant Concentrations
Studies have revealed a considerable correlation between the dispersion and distribution of key contaminants and wind direction and speed (especially particulate pollutants) [46]. To illustrate the impact of wind direction and speed on pollutants, we used a bivariate polar plot (Figure 8 and Figure 9). Yunnan experiences south-westerly winds throughout the year, with wind speeds greater in the dry season than in the wet season [47]. During the dry season, PM2.5 and PM10 have similar distribution characteristics, with enrichment occurring at higher wind speeds with south-westerly and north-easterly winds. Higher south-westerly wind speeds are correlated with high NO2, CO, and SO2 concentrations. O3 is more evenly distributed between wind directions and speeds.
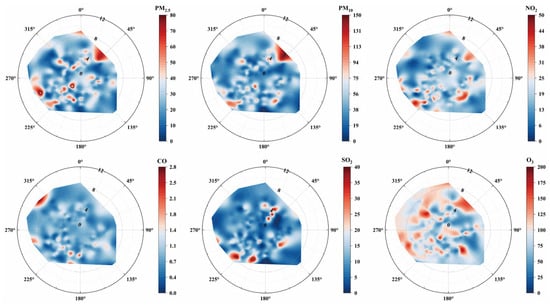
Figure 8.
Polar plots of mean concentrations of main pollutant concentrations in the dry season.
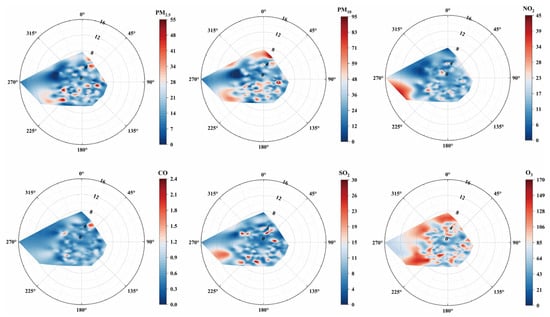
Figure 9.
Polar plots of mean concentrations of main pollutant concentrations in the wet season.
During the wet season, high concentrations of PM2.5 and PM10 are influenced by high wind speeds from the Southwest and the North. High concentrations of NO2 and SO2 are mainly from the Southwest at high wind speeds. High concentrations of O3 are distributed similarly to the dry season, maintaining a uniform distribution.
3.3. Influencing Factors of Air Quality in Yunnan
Single-factor analysis of meteorological and socio-economic factors in the cities of Yunnan during the period of 2015–2020 via the geographical detector method shows that the influence of the four main driving factors of meteorological and social is between 0.1 and 0.4 and between 0.2 and 0.8, respectively (Figure 10). Humidity, precipitation, population density, construction, and the number of civilian vehicles were the main control factors from the perspective of a single-factor explanation ratio.
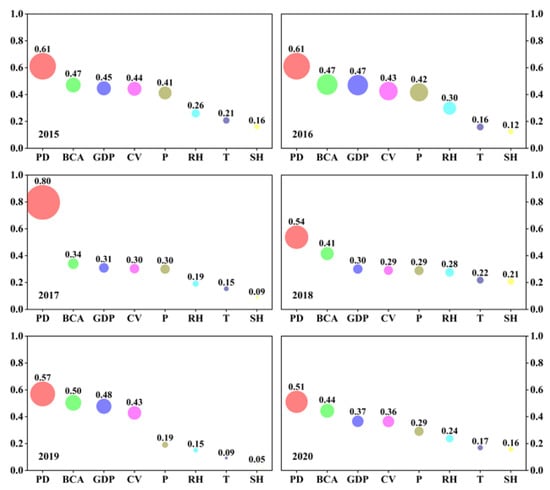
Figure 10.
Variation characteristics of AQI driving force in Yunnan from 2015 to 2020 (RH: relative humidity; SH: sunshine hours; P: precipitation; T: temperature; PD: population density; BCA: building construction area; GDP: gross domestic product; CV: civilian vehicle).
The study of the interaction of the driving forces affecting the spatial differentiation of AQI in Yunnan revealed (Figure 11) that the influence of each factor under the interaction ranged from 0.22 to 0.92, and the interaction was significantly greater than that of a single factor. The interaction factors of population density, relative humidity, and building area were the largest from 2015 to 2019, but the civil vehicle and temperature exceeded that of population density and relative humidity in 2020, becoming the most important interaction factor affecting Yunnan air quality.
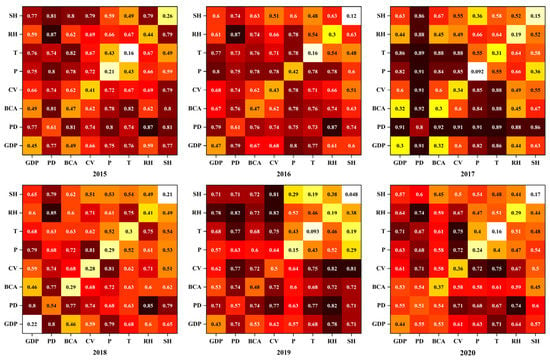
Figure 11.
Interactive change characteristics of driving factors in Yunnan from 2015 to 2020(RH: relative humidity; SH: sunshine hours; P: precipitation; T: temperature; PD: population density; BCA: building construction area; GDP: gross domestic product; CV: civilian vehicle).
4. Discussion
Urban air quality is often affected by natural and socio-economic factors, and it is also affected by the interaction between different kinds of pollutants [22]. The primary pollutants in the air of Yunnan from 2015 to 2020 were mainly PM2.5, PM10, and O3 (Figure S1), and this result is different from those of other regions in China [48]. Furthermore, due to the local control measures for COVID-19 in 2020, both human social activity and productive activity have significantly decreased in the Yunnan region. AQI and the main atmospheric pollutants are at a lower concentration than in the five years from 2015 to 2019 (Figure 3 and Figure 7, Table 1). In addition, the impact of socio-economic factors on air quality in 2020 shows a significant decline, and the impact of geographical environmental factors on air quality has increased (Figure 10 and Figure 11). All of the above data show the improvement in air quality in Yunnan due to COVID-19 in 2020. Meanwhile, regional air quality can be controlled by reducing human activities under the joint influence of meteorological and socio-economic factors. Numerous studies comparing the AQI in 2020 with earlier years have been performed in various parts of China. Interestingly, the findings of the studies for Yunnan and other regions of China all point to an improvement in air quality in 2020 [49,50]. The improvement is mainly caused by COVID-19 control measures that limit human interaction, transportation, and construction activities.
According to the studies, the decline in PM2.5 and PM10 in 2020 may be attributed to long-term environmental regulations dominated by the government. Another essential factor may be the decrease in human activities due to the impact of COVID-19. However, the trend was for decreasing concentrations of many pollutants in Yunnan in 2020, but O3 concentrations did not change significantly. The relevant data show that O3 has been on an uptrend in China in recent years [49], possibly hiding a declining trend in O3 in 2020. Meanwhile, it has been suggested that a reduction in PM2.5 may lead to an increase in O3 [51,52], that is, an increase in PM2.5 causes a decrease in surface radiation, which can reduce the formation of O3. Solar radiation is one of the most important meteorological factors in Yunnan, so reductions in particulate matter concentrations in the region are likely to have a significant effect on O3 concentrations.
The most obvious feature of O3 for 2015–2020 is the higher values in March–May (Figure 7). Yunnan is located on the Yunnan–Guizhou Plateau in Southwestern China, where regional solar radiation is relatively abundant, and O3 is produced mainly by photochemical reactions in the lower layers of the atmosphere [22]. The increase in O3 concentration tends to be accelerated by the more significant solar radiation and surface temperature during the dry season. In the wet season, there is more precipitation and a thicker layer of cloud cover, which reduces solar radiation and inhibits the synthesis of O3. Therefore, in the urban agglomerations in the low-latitude plateau region, measures for controlling O3 in the atmosphere need to consider the limitations of various natural factors rather than simple emission reduction.
The monthly variation of AQI (Figure 4 and Figure 5) and the temporal distribution characteristics of major atmospheric pollutants (Figure 7) are consistent with the impact of the Indian Ocean monsoon on the region [46]. It also shows that regional humidity is the leading natural factor in the control of air quality based on the analysis of the geographical detector model (Figure 10). Meanwhile, the spatial distribution pattern of air quality in Yunnan indicates that altitude and population density are the main influencing factors (Figure 6). The population of Central and Eastern Yunnan accounts for about 64.5% of the total, and its population density is more than twice that of other regions. This has led to a large amount of factory emissions, vehicle emissions, construction dust, and other air pollutants entering the regional atmosphere directly and indirectly, thus increasing the concentration of air pollutants. Therefore, the AQI of Yunnan from 2015 to 2020 appears to have a spatial distribution pattern of high in the east and low in the west. On the other hand, the interaction between the drivers suggests that the synergistic effect of socio-economic and meteorological factors has a more significant influence on regional air quality factors, which indicates that the control of regional human activity patterns under specific meteorological conditions needs to be taken into particular consideration in the management of regional air. In addition, the special geographical environment in Northern Yunnan, with a relatively high altitude and intense ultraviolet light exposure, renders the annual mean value of O3 concentration higher in the Northeast and lower in the Southwest (Figure S2), and high temperature and low humidity weather conditions further exacerbate the photochemical reaction. Relevant studies have also confirmed this finding in other high-altitude regions in China [53].
The different meteorological factors (e.g., the intensity of precipitation, solar radiation, temperature, and relative humidity) contribute differently to air quality [54,55]. The monthly changes in AQI and the temporal distribution characteristics of major pollutants in Yunnan Province from 2015 to 2020 were generally consistent with the changes in seasonal temperature and dry and wet seasons in the southwest monsoon region. High regional air quality values occur mainly from December to May (Figure 4 and Figure 5), and the slight difference between the timing of the dry and rainy seasons are explained by the delayed wet season in most of Southwest China (entering the rainy season after late May) [56,57,58], with pollutant concentrations slowly increasing at the end of the rainy season in November. Polar plots of wind direction and speed with major pollutants during the wet and dry seasons in Yunnan Province (Figure 8 and Figure 9) show that high wind speeds and south-westerly wind directions significantly influence major pollutants (especially particulate pollutants). O3 is relatively less affected by wind direction and speed, probably because O3 is more controlled by temperature, precipitation, solar radiation, and other indicators [59]. Each year, Yunnan is prone to fires from March to May because of its dry climate and limited rainfall, and the southwest monsoon’s confluence with particle pollution from springtime burning in neighbouring Southeast Asian nations (Figure 8 and Figure 9) causes poorer air quality at that time [60]. According to this, particulate pollution is higher in the South and lower in the north during the dry season (Figure S1).
5. Conclusions
Based on the analysis of AQI in Yunnan from 2015 to 2020, combined with the factor analysis of geographical detectors, the spatial–temporal distribution characteristics of AQI and major pollutants in Yunnan have been studied. This article has discussed the main factors and driving mechanisms that affected the air quality in Yunnan from 2015 to 2020, and this study also probed into the impact of the local control measures of COVID-19 in 2020. The main results are as follows:
(1) The excellent rate of air quality in Yunnan Province from 2015 to 2020 was 97.52~99.78%, and the AQI is significantly higher in the dry season than in the wet season. The concentrations of the main pollutants decreased to some extent. Moreover, in spatial variation, AQI shows the distribution characteristics of high in the east and low in the west of Yunnan.
(2) The relative humidity, precipitation, population density, building construction area, and civil vehicles have a greater degree of explanation for the spatial differentiation of AQI, whereas the synergistic influence of socio-economic factors and meteorological factors is significantly greater than that of single factor by the geographic detector model.
(3) The control measures of COVID-19 in 2020 have reduced the concentration of major pollutants in the atmosphere to a certain extent, but the reduction of O3 affected by its precursors is insignificant. Therefore, controlling regional air pollution in urban agglomerations in low latitude plateau areas can improve their air quality by reducing human activities, but the control of O3 concentration is more complex, and more restrictive factors need to be considered.
Supplementary Materials
The following supporting information can be downloaded at: https://www.mdpi.com/article/10.3390/atmos14020378/s1, Figure S1: AQI dry-wet season distribution in Yunnan from 2015 to 2020; Figure S2: Spatial distribution characteristics of main pollutants in Yunnan from 2015 to 2020.
Author Contributions
Conceptualisation, W.Z. and J.N.; methodology, W.Z. and S.L.; software, S.L.; validation, W.Z., S.L. and Q.L.; formal analysis, W.Z., S.L. and J.N.; writing—original draft preparation, W.Z., S.L., J.Y., Q.H. and Q.L.; writing—review and editing, W.Z., S.L., J.Y., Q.H., Q.L. and J.N.; visualisation, S.L. All authors have read and agreed to the published version of the manuscript.
Funding
This research was funded by the Applied Basic Research Key Project of Yunnan (No. 202101AS070019) and the National Natural Science Foundation of China (No. 42161017).
Institutional Review Board Statement
Not applicable.
Informed Consent Statement
Not applicable.
Data Availability Statement
Not applicable.
Conflicts of Interest
The authors declare no conflict of interest.
References
- Luo, H.; Guan, Q.; Lin, J.; Wang, Q.; Yang, L.; Tan, Z.; Wang, N. Air Pollution Characteristics and Human Health Risks in Key Cities of Northwest China. J. Environ. Manag. 2020, 269, 110791. [Google Scholar] [CrossRef] [PubMed]
- Han, C.; Xu, R.; Zhang, Y.; Yu, W.; Zhang, Z.; Morawska, L.; Heyworth, J.; Jalaludin, B.; Morgan, G.; Marks, G.; et al. Air Pollution Control Efficacy and Health Impacts: A Global Observational Study from 2000 to 2016. Environ. Pollut. 2021, 287, 117211. [Google Scholar] [CrossRef] [PubMed]
- Wang, Z.; Fang, C.; Xu, G.; Pan, Y. Spatial-Temporal Characteristics of the PM2.5 in China in 2014. Acta Geogr. Sin. 2015, 70, 1720–1734. (In Chinese) [Google Scholar] [CrossRef]
- Chen, Z.; Cai, J.; Gao, B.; Xu, B.; Dai, S.; He, B.; Xie, X. Detecting the Causality Influence of Individual Meteorological Factors on Local PM2.5 Concentration in the Jing-Jin-Ji Region. Sci. Rep. 2017, 7, 40735. [Google Scholar] [CrossRef] [PubMed]
- Fu, B.; Gao, X.H.; Wu, L. Grey Relational Analysis for the AQI of Beijing, Tianjin, and Shijiazhuang and Related Countermeasures. Grey Syst. Theory Appl. 2018, 8, 156–166. [Google Scholar] [CrossRef]
- Li, C.; Li, H.; Feng, S.; Liu, X.; Guo, S. A Study on the Spatiotemporal Characteristics and Change Trend of the Atmospheric Environmental Carrying Capacity in the Jing-Jin-Ji Region, China. J. Clean. Prod. 2019, 211, 27–35. [Google Scholar] [CrossRef]
- He, Q.; Yan, Y.; Guo, L.; Zhang, Y.; Zhang, G.; Wang, X. Characterization and Source Analysis of Water-Soluble Inorganic Ionic Species in PM2.5 in Taiyuan City, China. Atmos. Res. 2017, 184, 48–55. [Google Scholar] [CrossRef]
- Jiang, W.; Gao, W.; Gao, X.; Ma, M.; Zhou, M.; Du, K.; Ma, X. Spatio-Temporal Heterogeneity of Air Pollution and Its Key Influencing Factors in the Yellow River Economic Belt of China from 2014 to 2019. J. Environ. Manag. 2021, 296, 113172. [Google Scholar] [CrossRef]
- Zhou, H.; Lü, C.; He, J.; Gao, M.; Zhao, B.; Ren, L.; Zhang, L.; Fan, Q.; Liu, T.; He, Z.; et al. Stoichiometry of Water-Soluble Ions in PM2.5: Application in Source Apportionment for a Typical Industrial City in Semi-Arid Region, Northwest China. Atmos. Res. 2018, 204, 149–160. [Google Scholar] [CrossRef]
- Chen, P.; Wang, T.; Dong, M.; Kasoar, M.; Han, Y.; Xie, M.; Li, S.; Zhuang, B.; Li, M.; Huang, T. Characterization of Major Natural and Anthropogenic Source Profiles for Size-Fractionated PM in Yangtze River Delta. Sci. Total Environ. 2017, 598, 135–145. [Google Scholar] [CrossRef]
- Ye, L.; Ou, X. Spatial-Temporal Analysis of Daily Air Quality Index in the Yangtze River Delta Region of China During 2014 and 2016. Chin. Geogr. Sci. 2019, 29, 382–393. [Google Scholar] [CrossRef]
- Zhou, W.; Wu, X.; Ding, S.; Cheng, Y. Predictive Analysis of the Air Quality Indicators in the Yangtze River Delta in China: An Application of a Novel Seasonal Grey Model. Sci. Total Environ. 2020, 748, 141428. [Google Scholar] [CrossRef] [PubMed]
- Gao, H.; Yang, W.; Yang, Y.; Yuan, G. Analysis of the Air Quality and the Effect of Governance Policies in China’s Pearl River Delta, 2015–2018. Atmosphere 2019, 10, 412. [Google Scholar] [CrossRef]
- Peng, G.; Wang, X.; Wu, Z.; Wang, Z.; Yang, L.; Zhong, L.; Chen, D. Characteristics of Particulate Matter Pollution in the Pearl River Delta Region, China: An Observational-Based Analysis of Two Monitoring Sites. J. Environ. Monit. 2011, 13, 1927–1934. [Google Scholar] [CrossRef] [PubMed]
- Xu, L.; Chen, X.; Chen, J.; Zhang, F.; He, C.; Zhao, J.; Yin, L. Seasonal Variations and Chemical Compositions of PM2.5 Aerosol in the Urban Area of Fuzhou, China. Atmos. Res. 2012, 104–105, 264–272. [Google Scholar] [CrossRef]
- Buehn, A.; Farzanegan, M.R. Hold Your Breath: A New Index of Air Pollution. Energy Econ. 2013, 37, 104–113. [Google Scholar] [CrossRef]
- Hien, P.D.; Bac, V.T.; Tham, H.C.; Nhan, D.D.; Vinh, L.D. Influence of Meteorological Conditions on PM2.5 and PM2.5−10 Concentrations during the Monsoon Season in Hanoi, Vietnam. Atmos. Environ. 2002, 36, 3473–3484. [Google Scholar] [CrossRef]
- Li, Q.; Song, J.; Wang, E.; Hu, H.; Zhang, J.; Wang, Y. Economic Growth and Pollutant Emissions in China: A Spatial Econometric Analysis. Stoch. Environ. Res. Risk Assess. 2014, 28, 429–442. [Google Scholar] [CrossRef]
- Kong, F.; Lv, L.; Fang, J.; Xu, H. Spatiotemporal Pattern of the Air Pollution Index and Its Trend in China from 2001 to 2015. J. Catastrophology 2017, 32, 117–123. (In Chinese) [Google Scholar] [CrossRef]
- Li, X.; Zhang, M.; Wang, S.; Zhao, A.; Ma, Q. Variation Characteristics and Influencing Factors of Air Pollution Index in China. Chin. J. Environ. Sci. 2012, 33, 1936–1943. (In Chinese) [Google Scholar] [CrossRef]
- Guo, P.; Umarova, A.B.; Luan, Y. The Spatiotemporal Characteristics of the Air Pollutants in China from 2015 to 2019. PLoS ONE 2020, 15, e0227469. [Google Scholar] [CrossRef] [PubMed]
- Zhao, C.; Sun, Y.; Zhong, Y.; Xu, S.; Liang, Y.; Liu, S.; He, X.; Zhu, J.; Shibamoto, T.; He, M. Spatio-Temporal Analysis of Urban Air Pollutants throughout China during 2014–2019. Air Qual. Atmos. Health 2021, 14, 1619–1632. [Google Scholar] [CrossRef] [PubMed]
- Xu, W.; Tian, Y.; Liu, Y.; Zhao, B.; Liu, Y.; Zhang, X. Understanding the Spatial-Temporal Patterns and Influential Factors on Air Quality Index: The Case of North China. Int. J. Environ. Res. Public Health 2019, 16, 2820. [Google Scholar] [CrossRef]
- Song, Z.; Deng, Q.; Ren, Z. Correlation and Principal Component Regression Analysis for Studying Air Quality and Meteorological Elements in Wuhan, China. Environ. Prog. Sustain. Energy 2020, 39, 13278. [Google Scholar] [CrossRef]
- Lin, X.; Wang, D. Spatiotemporal Evolution of Urban Air Quality and Socioeconomic Driving Forces in China. J. Geogr. Sci. 2016, 26, 1533–1549. [Google Scholar] [CrossRef]
- He, B.; Wang, S.; Guo, L.; Wu, X. Aridity Change and Its Correlation with Greening over Drylands. Agric. For. Meteorol. 2019, 278, 107663. [Google Scholar] [CrossRef]
- Qiao, Z.; Wu, F.; Xu, X.; Yang, J.; Liu, L. Mechanism of Spatiotemporal Air Quality Response to Meteorological Parameters: A National-Scale Analysis in China. Sustainability 2019, 11, 3957. [Google Scholar] [CrossRef]
- Xu, X.; Zhao, Y.; Zhang, X.; Xia, S. Identifying the Impacts of Social, Economic, and Environmental Factors on Population Aging in the Yangtze River Delta Using the Geographical Detector Technique. Sustainability 2018, 10, 1528. [Google Scholar] [CrossRef]
- Yue, H.; Hu, T. Geographical Detector-Based Spatial Modeling of the COVID-19 Mortality Rate in the Continental United States. Int. J. Environ. Res. Public Health 2021, 18, 6832. [Google Scholar] [CrossRef]
- Wang, H.; Gao, J.; Hou, W. Quantitative Attribution Analysis of Soil Erosion in Different Geomorphological Types in Karst Areas: Based on the Geodetector Method. J. Geogr. Sci. 2019, 29, 271–286. [Google Scholar] [CrossRef]
- Zhou, L.; Zhen, F.; Wang, Y.; Xiong, L. Modeling the Spatial Formation Mechanism of Poverty-Stricken Counties in China by Using Geographical Detector. Sustainability 2019, 11, 4752. [Google Scholar] [CrossRef]
- Liu, Y.; Yuan, X.; Guo, L.; Huang, Y.; Zhang, X. Driving Force Analysis of the Temporal and Spatial Distribution of Flash Floods in Sichuan Province. Sustainability 2017, 9, 1527. [Google Scholar] [CrossRef]
- Zhang, W.; Ming, Q.; Shi, Z.; Chen, G.; Niu, J.; Lei, G.; Chang, F.; Zhang, H. Lake Sediment Records on Climate Change and Human Activities in the Xingyun Lake Catchment, SW China. PLoS ONE 2014, 9, e102167. [Google Scholar] [CrossRef]
- Deng, Q.; Han, X.; Shi, Z.; Yan, K.; Li, J.; Shi, J. Characteristics and Source Analysis of Water Soluble Ions in Atmospheric PM2.5 in Low Latitude Plateau Cities of Yunnan Province. Environ. Chem. 2020, 39, 3306–3317. (In Chinese) [Google Scholar] [CrossRef]
- Guo, R.; Li, C.; Deng, C.; Peng, Q.; Xiang, F. Meteorological Causes for a Wide Range of Air Pollution in Yunnan Province on March 22, 2015. J. Catastrophology 2017, 32, 91–95. (In Chinese) [Google Scholar] [CrossRef]
- Niu, J.; Wang, L.; Yang, K.; Liu, S.; Yin, J.; Liang, Q.; Zhang, W. Spatial–Temporal Characteristics of Drought and Flood Disasters in Yunnan Province on the Margin of the Tibetan Plateau over the Past 620 Years. Int. J. Clim. 2021, 42, 1388–1398. [Google Scholar] [CrossRef]
- Yang, X.; Jiang, L.; Zhao, W.; Xiong, Q.; Zhao, W.; Yan, X. Comparison of Ground-Based PM2.5 and PM10 Concentrations in China, India, and the U.S. Int. J. Environ. Res. Public Health 2018, 15, 1382. [Google Scholar] [CrossRef]
- Sun, X.; Luo, X.-S.; Xu, J.; Zhao, Z.; Chen, Y.; Wu, L.; Chen, Q.; Zhang, D. Spatio-Temporal Variations and Factors of a Provincial PM2.5 Pollution in Eastern China during 2013–2017 by Geostatistics. Sci. Rep. 2019, 9, 3613. [Google Scholar] [CrossRef]
- Huang, Y.; Wang, L.; Zhang, S.; Zhang, M.; Wang, J.; Cheng, X.; Li, T.; He, M.; Ni, S. Source Apportionment and Health Risk Assessment of Air Pollution Particles in Eastern District of Chengdu. Environ. Geochem. Health 2020, 42, 2251–2263. [Google Scholar] [CrossRef]
- Pu, H.; Luo, K.; Wang, P.; Wang, S.; Kang, S. Spatial Variation of Air Quality Index and Urban Driving Factors Linkages: Evidence from Chinese Cities. Environ. Sci. Pollut. Res. 2017, 24, 4457–4468. [Google Scholar] [CrossRef]
- Zhang, A.; Qi, Q.; Jiang, L.; Zhou, F.; Wang, J. Population Exposure to PM2.5 in the Urban Area of Beijing. PLoS ONE 2013, 8, e63486. [Google Scholar] [CrossRef] [PubMed]
- Wu, Y.; Li, C.; Dai, Z.; Wu, Z. Spatial and Temporal Distribution Characteristics and Influencing Mechanisms of Air Quality Index in Urban Areas. Bull. Surv. Mapp. 2020, 81–86. (In Chinese) [Google Scholar] [CrossRef]
- Zhang, L.; An, J.; Liu, M.; Li, Z.; Liu, Y.; Tao, L.; Liu, X.; Zhang, F.; Zheng, D.; Gao, Q.; et al. Spatiotemporal Variations and Influencing Factors of PM2.5 Concentrations in Beijing, China. Environ. Pollut. 2020, 262, 114276. [Google Scholar] [CrossRef] [PubMed]
- Wang, J.-F.; Hu, Y. Environmental Health Risk Detection with GeogDetector. Environ. Model. Softw. 2012, 33, 114–115. [Google Scholar] [CrossRef]
- Zhang, X.; Luo, S.; Li, X.; Li, Z.; Fan, Y.; Sun, J. Spatio-Temporal Variation Features of Air Quality in China. Sci. Geogr. Sin. 2020, 40, 190–199. (In Chinese) [Google Scholar] [CrossRef]
- Shelton, S.; Liyanage, G.; Jayasekara, S.; Pushpawela, B.; Rathnayake, U.; Jayasundara, A.; Jayasooriya, L.D. Seasonal Variability of Air Pollutants and Their Relationships to Meteorological Parameters in an Urban Environment. Adv. Meteorol. 2022, 2022, 5628911. [Google Scholar] [CrossRef]
- Yang, Q.; Zhao, T.; Tian, Z.; Kumar, K.R.; Chang, J.; Hu, W.; Shu, Z.; Hu, J. The Cross-Border Transport of PM2.5 from the Southeast Asian Biomass Burning Emissions and Its Impact on Air Pollution in Yunnan Plateau, Southwest China. Remote Sens. 2022, 14, 1886. [Google Scholar] [CrossRef]
- Huang, X.; Shao, T.; Zhao, J.; Cao, J.; Yue, D.; Lv, X. Spatial-Temporal Distribution of Air Quality and Its Influencing Factors in the Yangtze River Economic Belt. China Environ. Sci. 2020, 40, 874–884. (In Chinese) [Google Scholar] [CrossRef]
- Xu, K.; Cui, K.; Young, L.-H.; Wang, Y.-F.; Hsieh, Y.-K.; Wan, S.; Zhang, J. Air Quality Index, Indicatory Air Pollutants and Impact of COVID-19 Event on the Air Quality near Central China. Aerosol Air Qual. Res. 2020, 20, 1204–1221. [Google Scholar] [CrossRef]
- Zhang, J.; Cui, K.; Wang, Y.-F.; Wu, J.-L.; Huang, W.-S.; Wan, S.; Xu, K. Temporal Variations in the Air Quality Index and the Impact of the COVID-19 Event on Air Quality in Western China. Aerosol Air Qual. Res. 2020, 20, 1552–1568. [Google Scholar] [CrossRef]
- Sassen, K. Indirect Climate Forcing over the Western US from Asian Dust Storms. Geophys. Res. Lett. 2002, 29, 103-1-103–104. [Google Scholar] [CrossRef]
- Shao, P.; Xin, J.; An, J.; Wang, J. An Analysis on the Relationship between Ground-Level Ozone and Particulate Matter in an Industrial Area in the Yangtze River Delta during Summertime. Chin. J. Atmos. Sci. 2017, 41, 618–628. (In Chinese) [Google Scholar] [CrossRef]
- Cong, Z.; Kang, S.; Kawamura, K.; Liu, B.; Wan, X.; Wang, Z.; Gao, S.; Fu, P. Carbonaceous Aerosols on the South Edge of the Tibetan Plateau: Concentrations, Seasonality and Sources. Atmos. Chem. Phys. 2015, 15, 1573–1584. [Google Scholar] [CrossRef]
- Hu, J.; Zhao, T.; Liu, J.; Cao, L.; Xia, J.; Wang, C.; Zhao, X.; Gao, Z.; Shu, Z.; Li, Y. Nocturnal Surface Radiation Cooling Modulated by Cloud Cover Change Reinforces PM2.5 Accumulation: Observational Study of Heavy Air Pollution in the Sichuan Basin, Southwest China. Sci. Total Environ. 2021, 794, 148624. [Google Scholar] [CrossRef]
- Sun, Y.; Zhao, C.; Su, Y.; Ma, Z.; Li, J.; Letu, H.; Yang, Y.; Fan, H. Distinct Impacts of Light and Heavy Precipitation on PM2.5 Mass Concentration in Beijing. Earth Space Sci. 2019, 6, 1915–1925. [Google Scholar] [CrossRef]
- Liao, Y.; Wang, L.; Wang, Z.; Ye, D.; Zhou, B. Climatic Characteristics and Major Meteorological Events over China in 2015. Meteorol. Mon. 2016, 43, 472–480. (In Chinese) [Google Scholar] [CrossRef]
- Feng, A.; Zeng, H.; Yin, Y.; Song, Y. Climatic Characteristics and Major Meteorological Events over China in 2017. Meteorol. Mon. 2018, 44, 548–555. (In Chinese) [Google Scholar] [CrossRef]
- Dai, T.; Wang, Q.; Wang, G.; Chen, Y. Climatic Characteristics and Major Meteorological Events over China in 2020. Meteorol. Mon. 2021, 47, 478–487. (In Chinese) [Google Scholar] [CrossRef]
- Yang, G.; Liu, Y.; Li, X. Spatiotemporal Distribution of Ground-Level Ozone in China at a City Level. Sci. Rep. 2020, 10, 7229. [Google Scholar] [CrossRef]
- Reid, J.S.; Hyer, E.J.; Johnson, R.S.; Holben, B.N.; Yokelson, R.J.; Zhang, J.; Campbell, J.R.; Christopher, S.A.; Di Girolamo, L.; Giglio, L.; et al. Observing and Understanding the Southeast Asian Aerosol System by Remote Sensing: An Initial Review and Analysis for the Seven Southeast Asian Studies (7SEAS) Program. Atmos. Res. 2013, 122, 403–468. [Google Scholar] [CrossRef]
Disclaimer/Publisher’s Note: The statements, opinions and data contained in all publications are solely those of the individual author(s) and contributor(s) and not of MDPI and/or the editor(s). MDPI and/or the editor(s) disclaim responsibility for any injury to people or property resulting from any ideas, methods, instructions or products referred to in the content. |
© 2023 by the authors. Licensee MDPI, Basel, Switzerland. This article is an open access article distributed under the terms and conditions of the Creative Commons Attribution (CC BY) license (https://creativecommons.org/licenses/by/4.0/).