

AI-Prepared Autonomous Freshwater Monitoring and Sea Ground Detection by an Autonomous Surface Vehicle


Abstract
1. Introduction
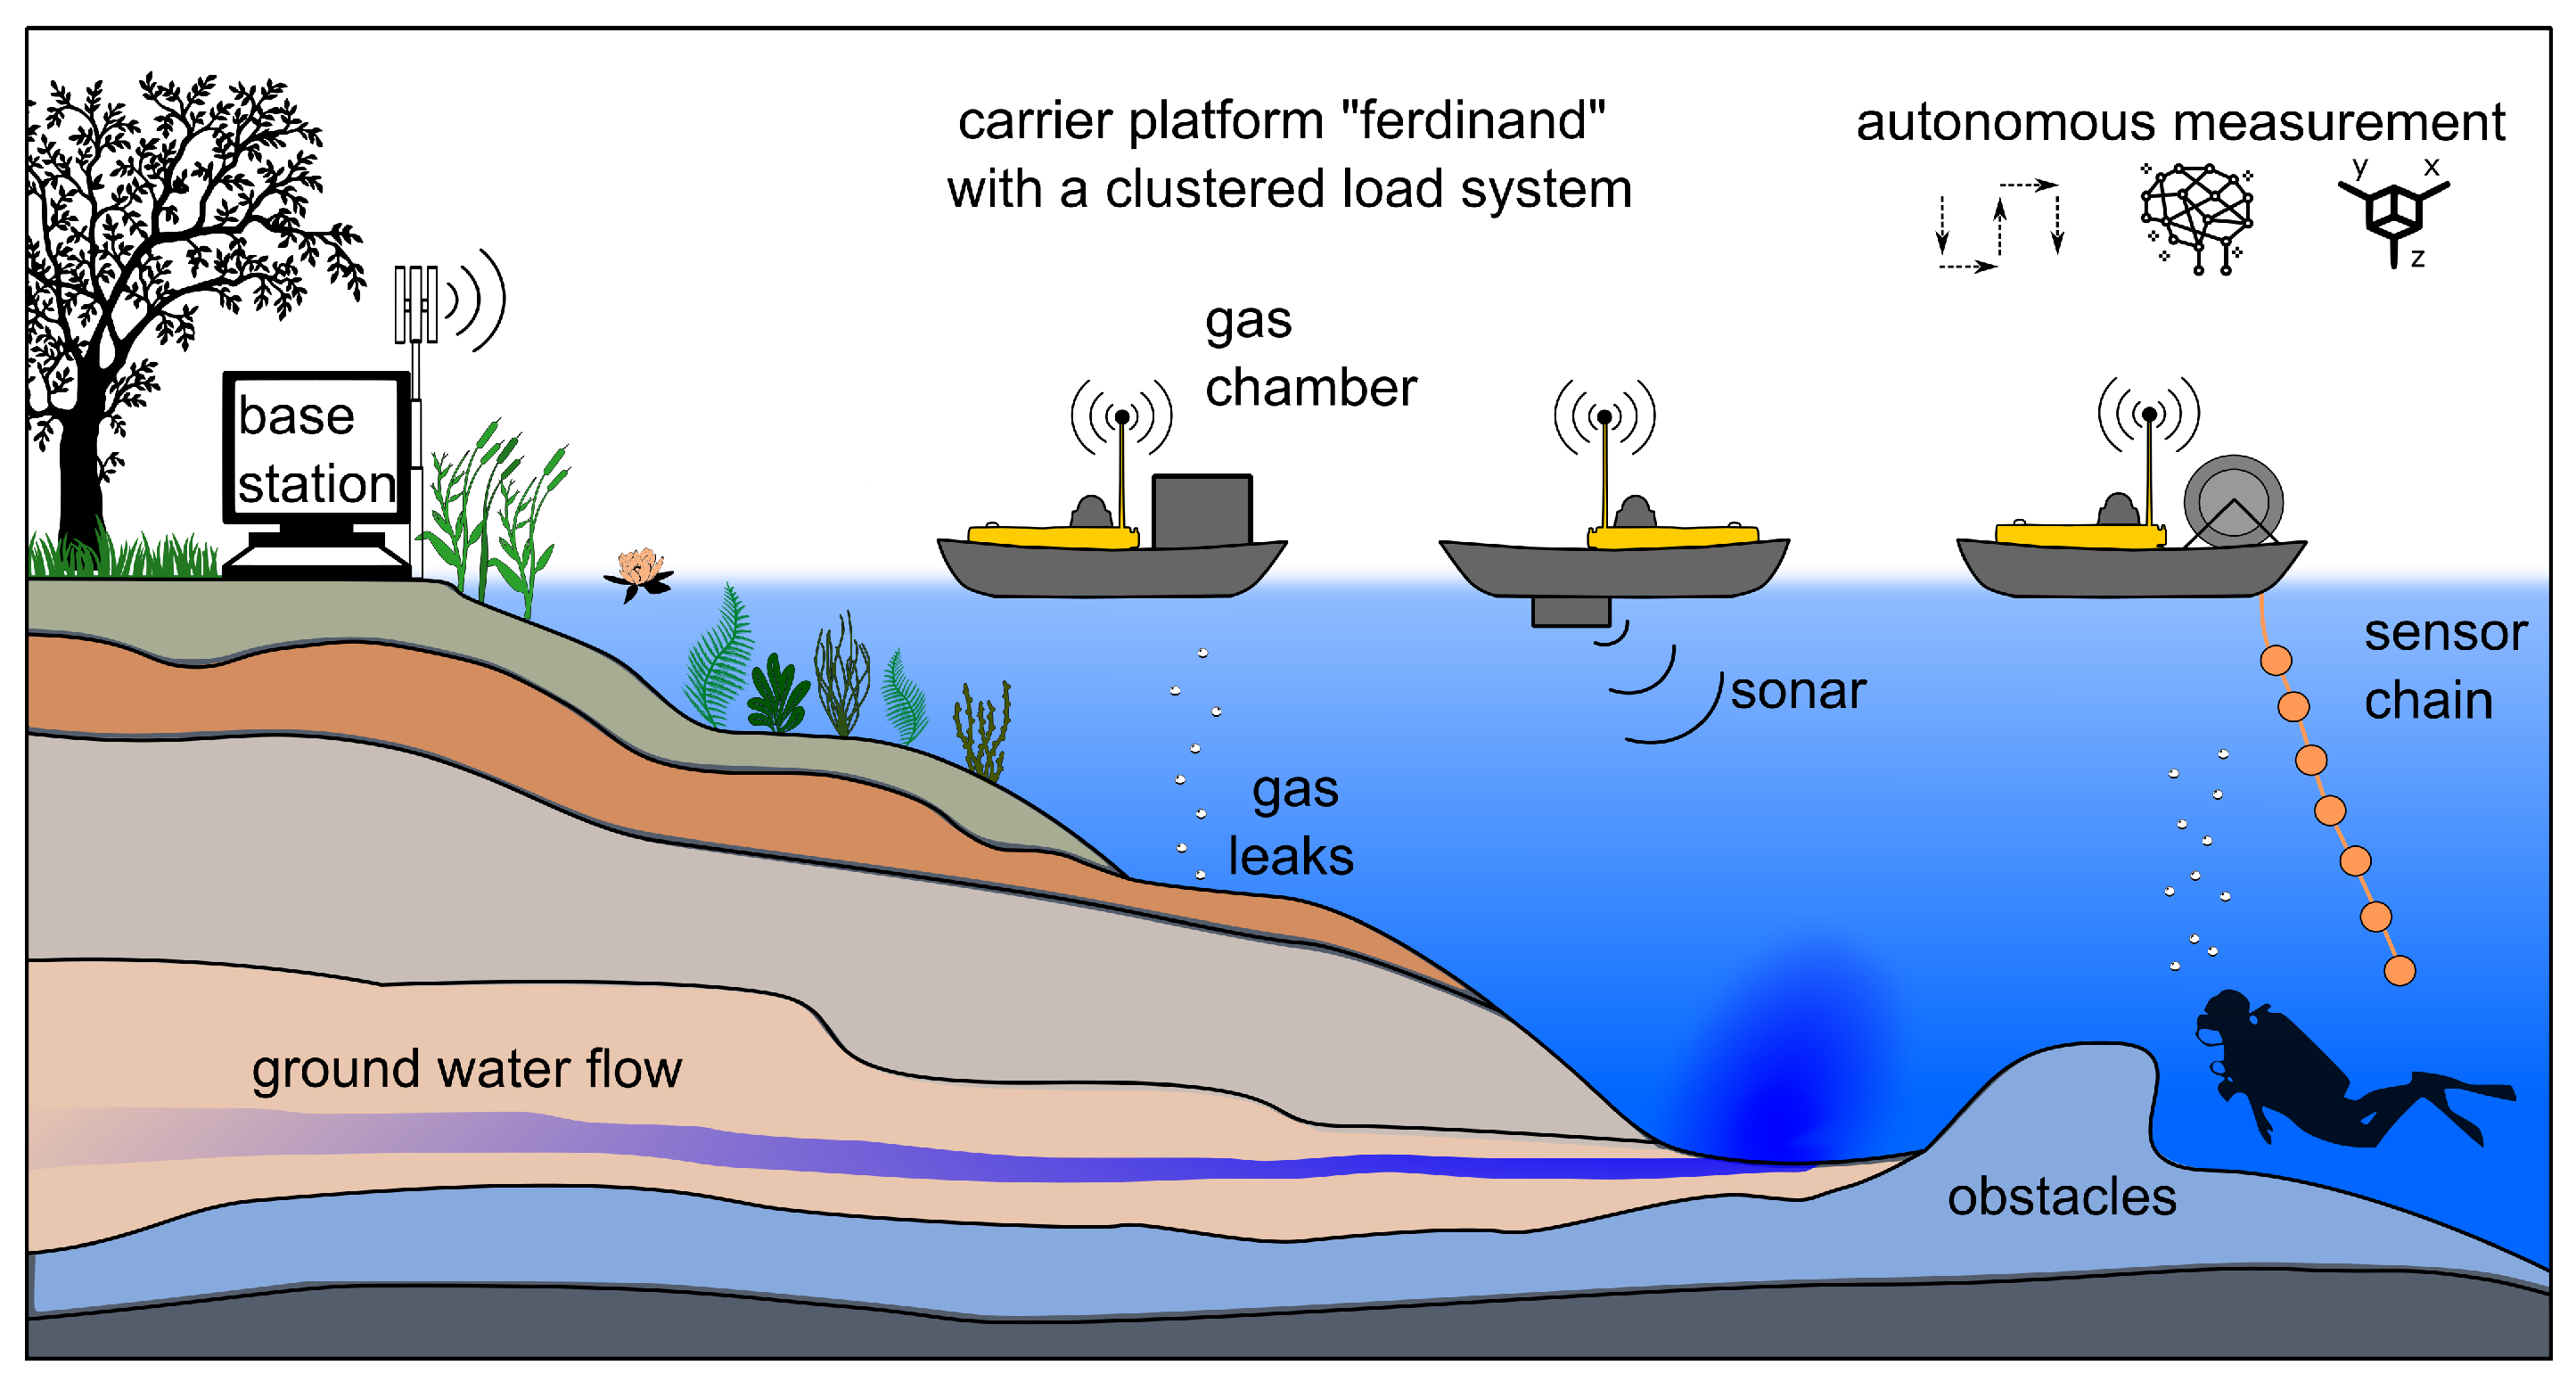
1.1. Motivation
- The 3D depth-resolved recording of inland water quality parameters with autonomously driving swimming robots.
- Validation of the results through in situ measurements and sampling conducted by scientific divers to carry out further analytical methods.
- Recording the underwater subsurface with a sonar-based system and the ASV.
- Combination of photogrammetry and sonar data under and above water for a holistic model of a water body.
- Data analysis and visualization by AI and VR.
1.2. Literature Review and State-of-the-Art
- 1.
- Remote operation underwater vehicle (RUV);
- 2.
- Remote operation swimming vehicle (RSV);
- 3.
- Autonomous operation underwater vehicle (AUV);
- 4.
- Autonomous operation swimming vehicle (ASV).
2. Materials and Methods
2.1. Investigation Concept
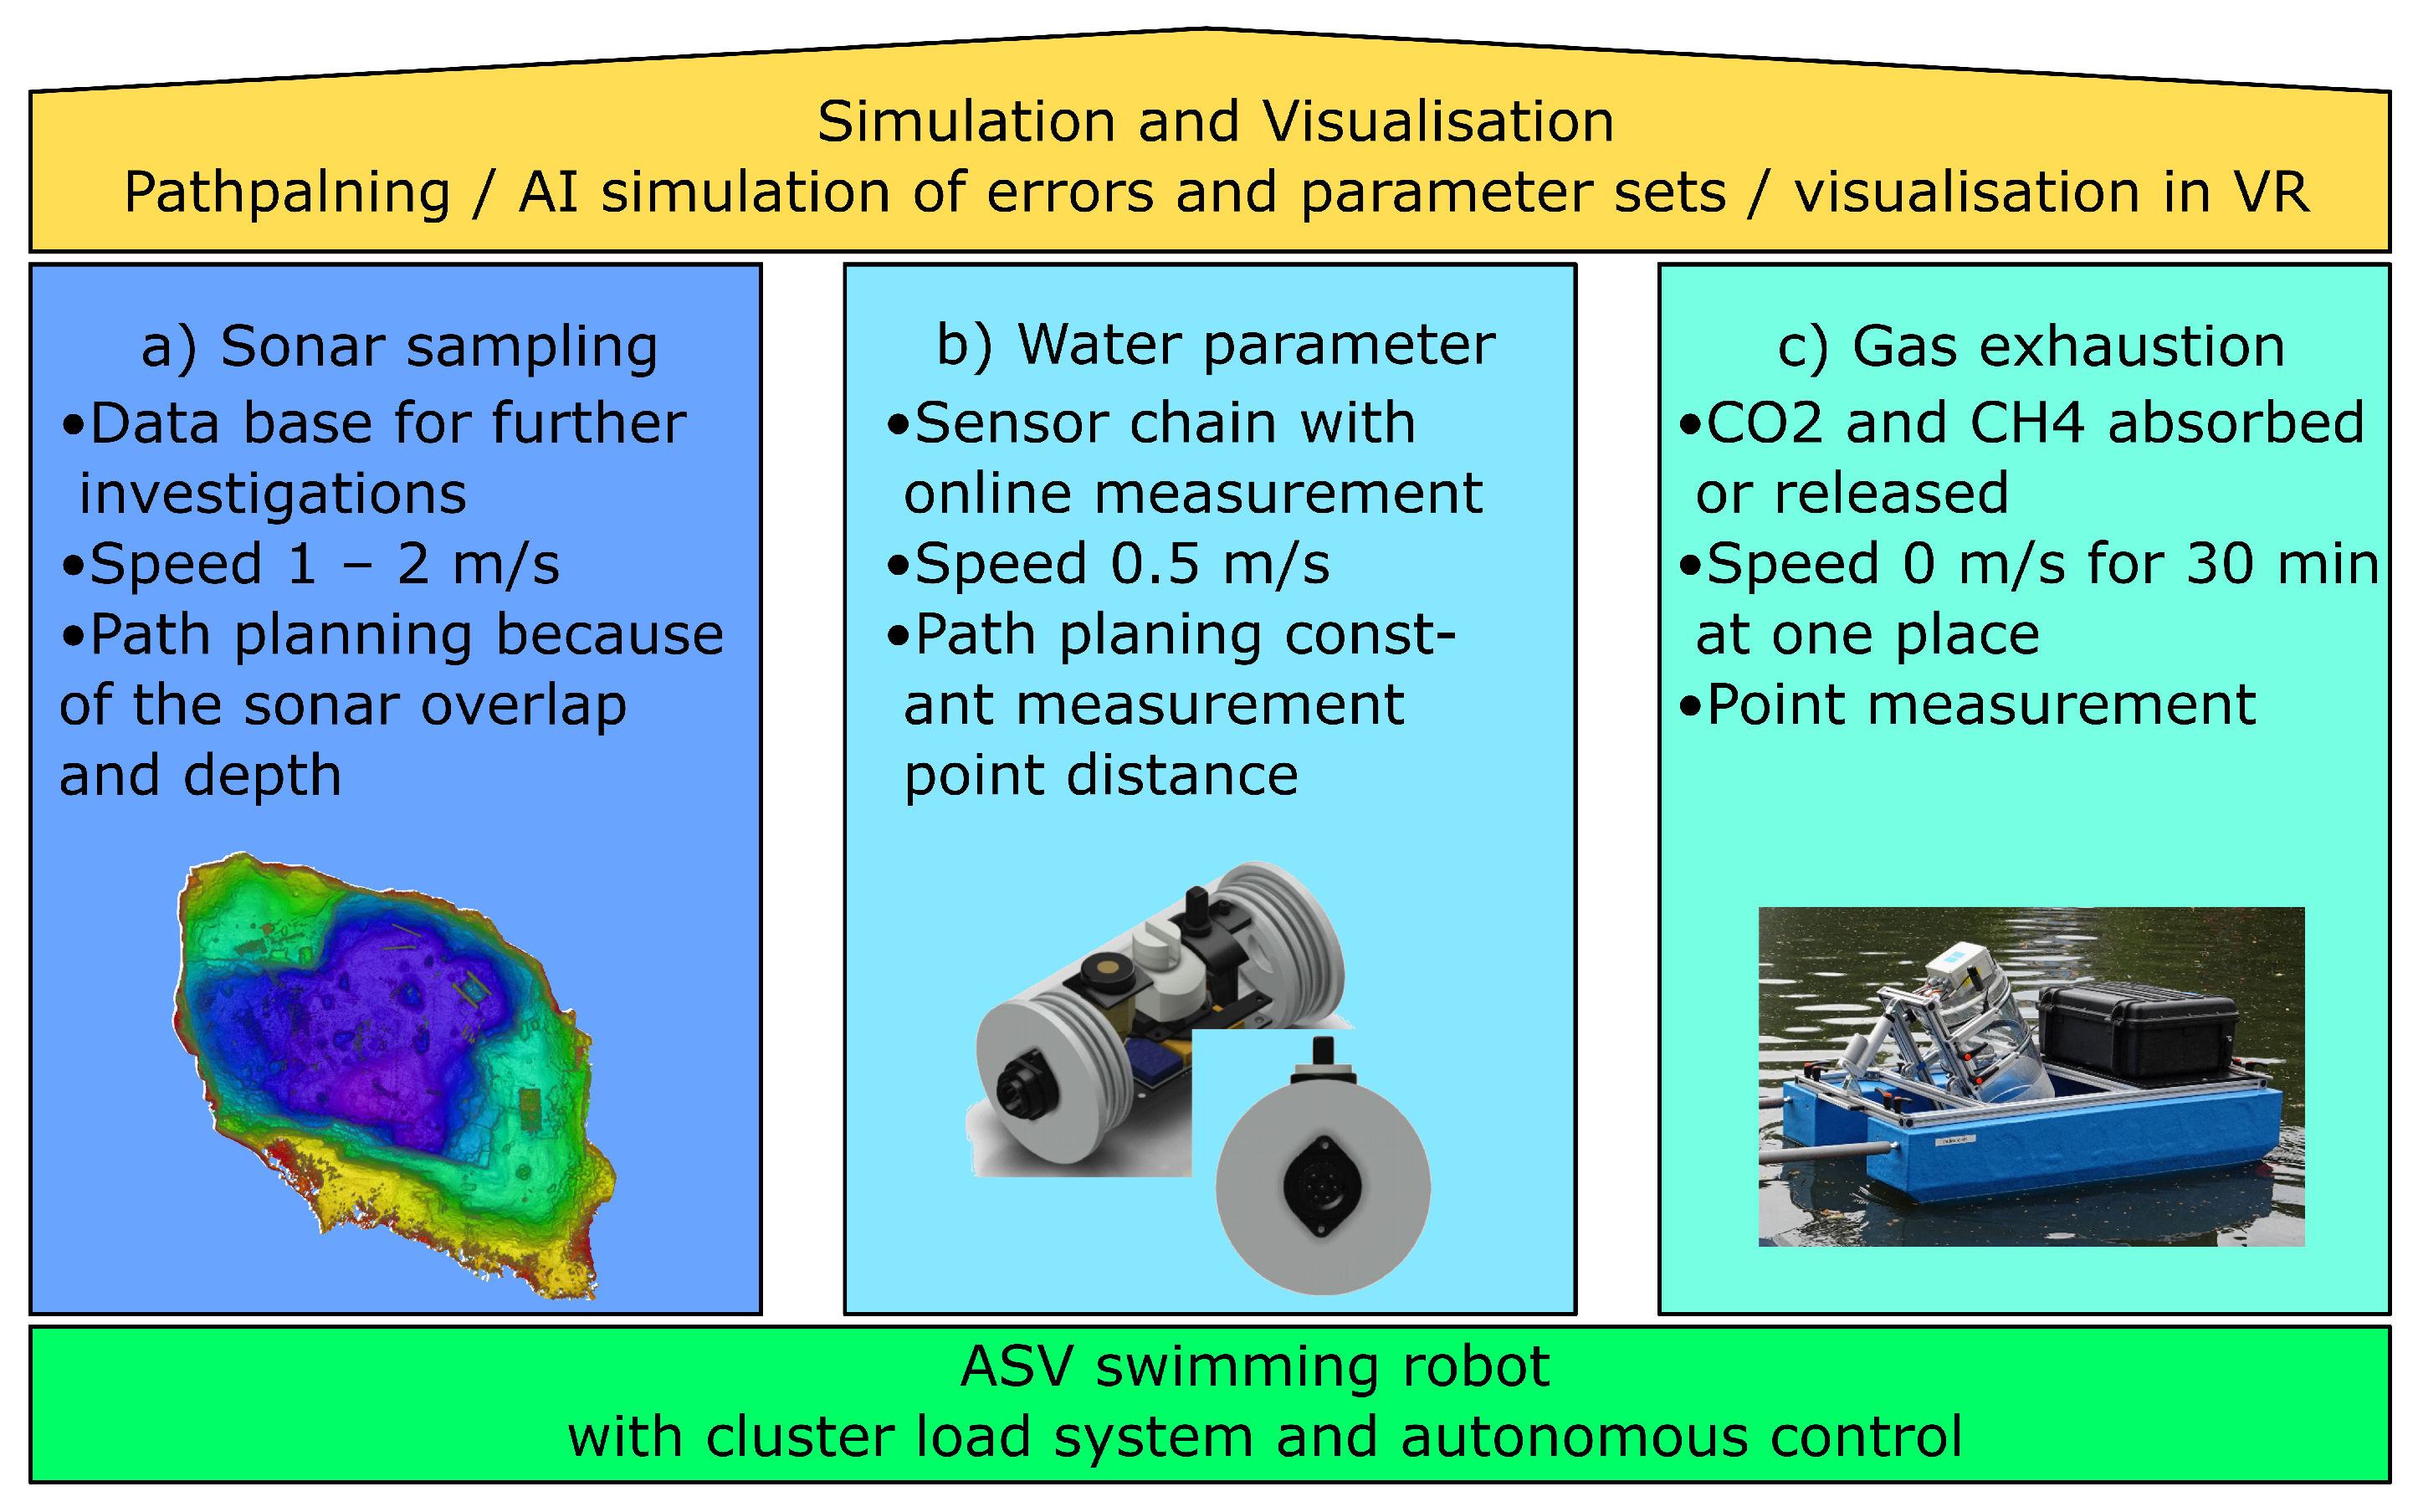
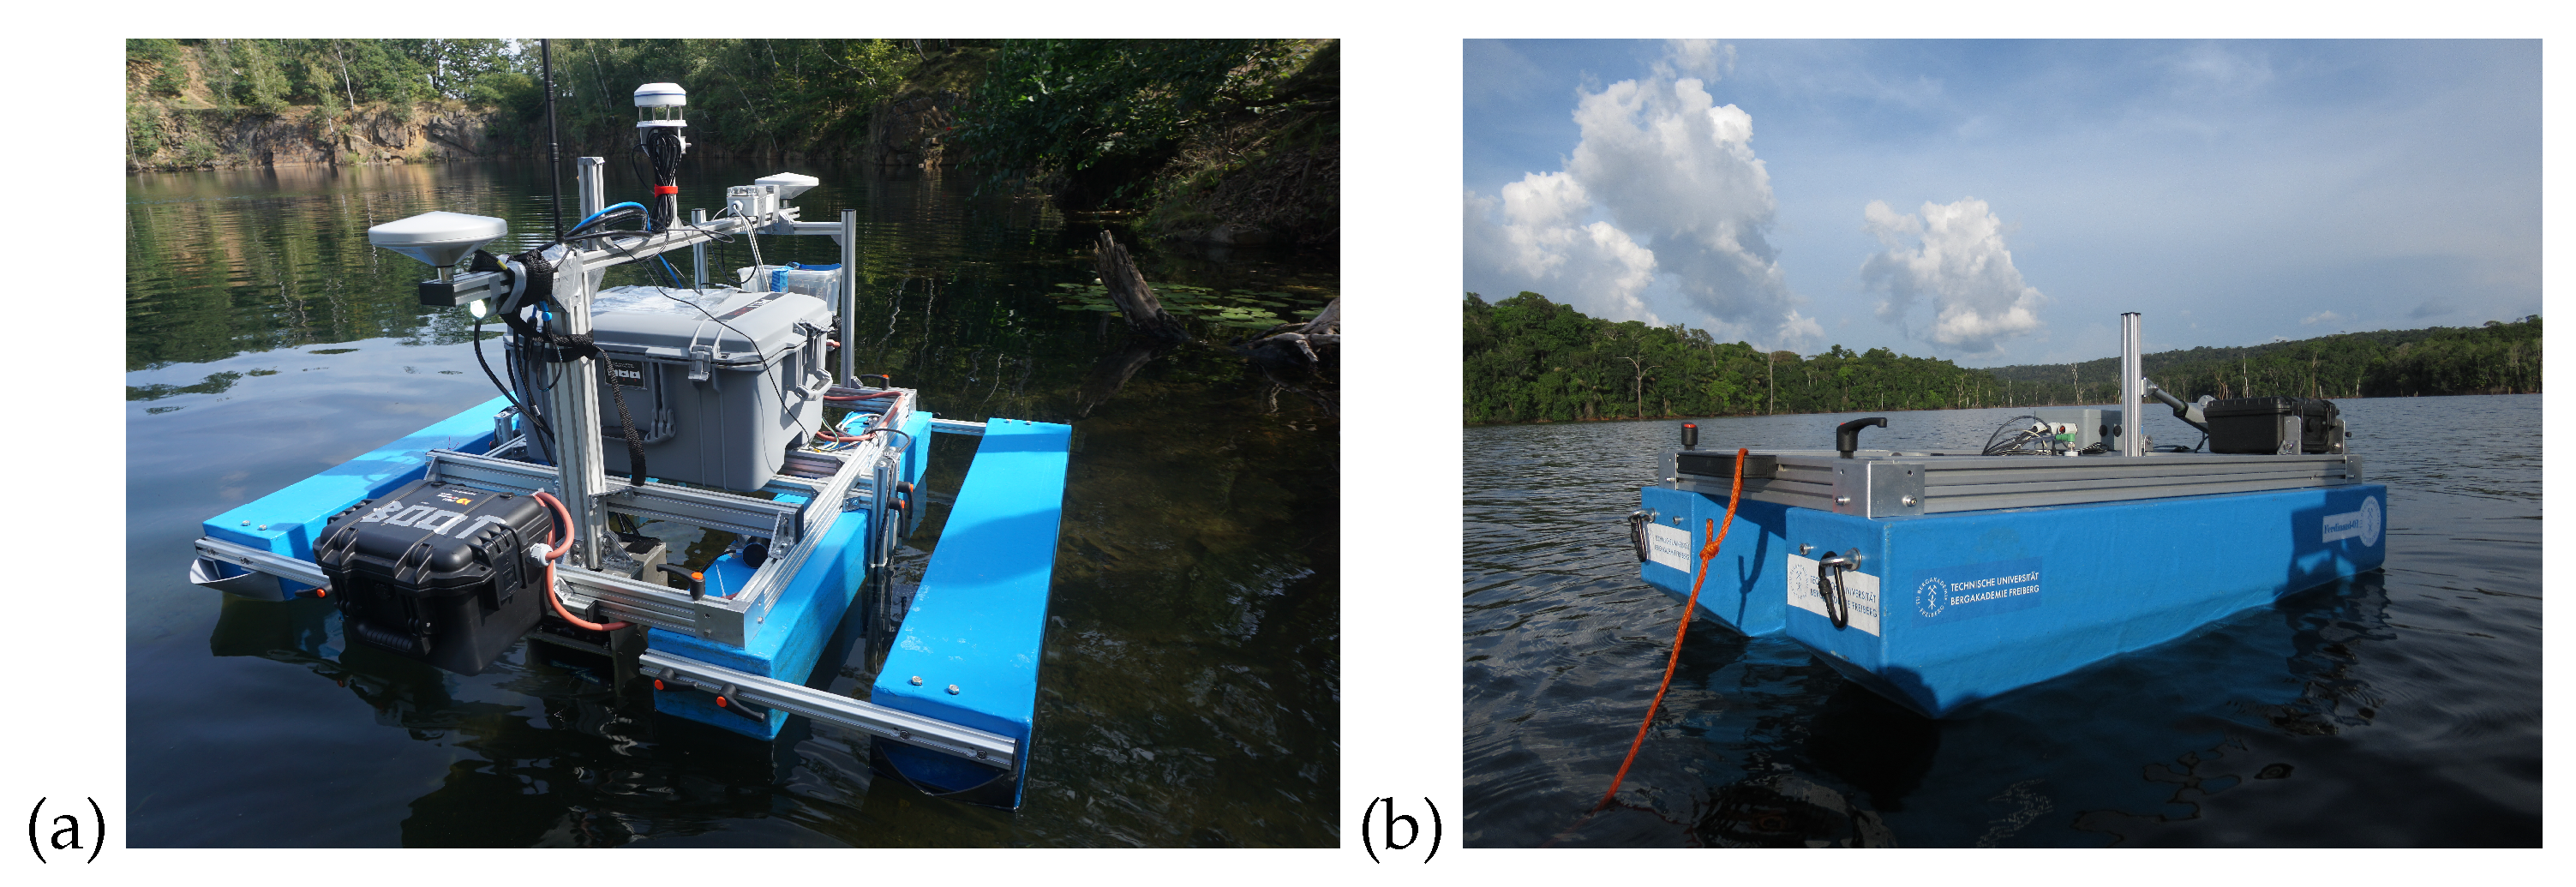
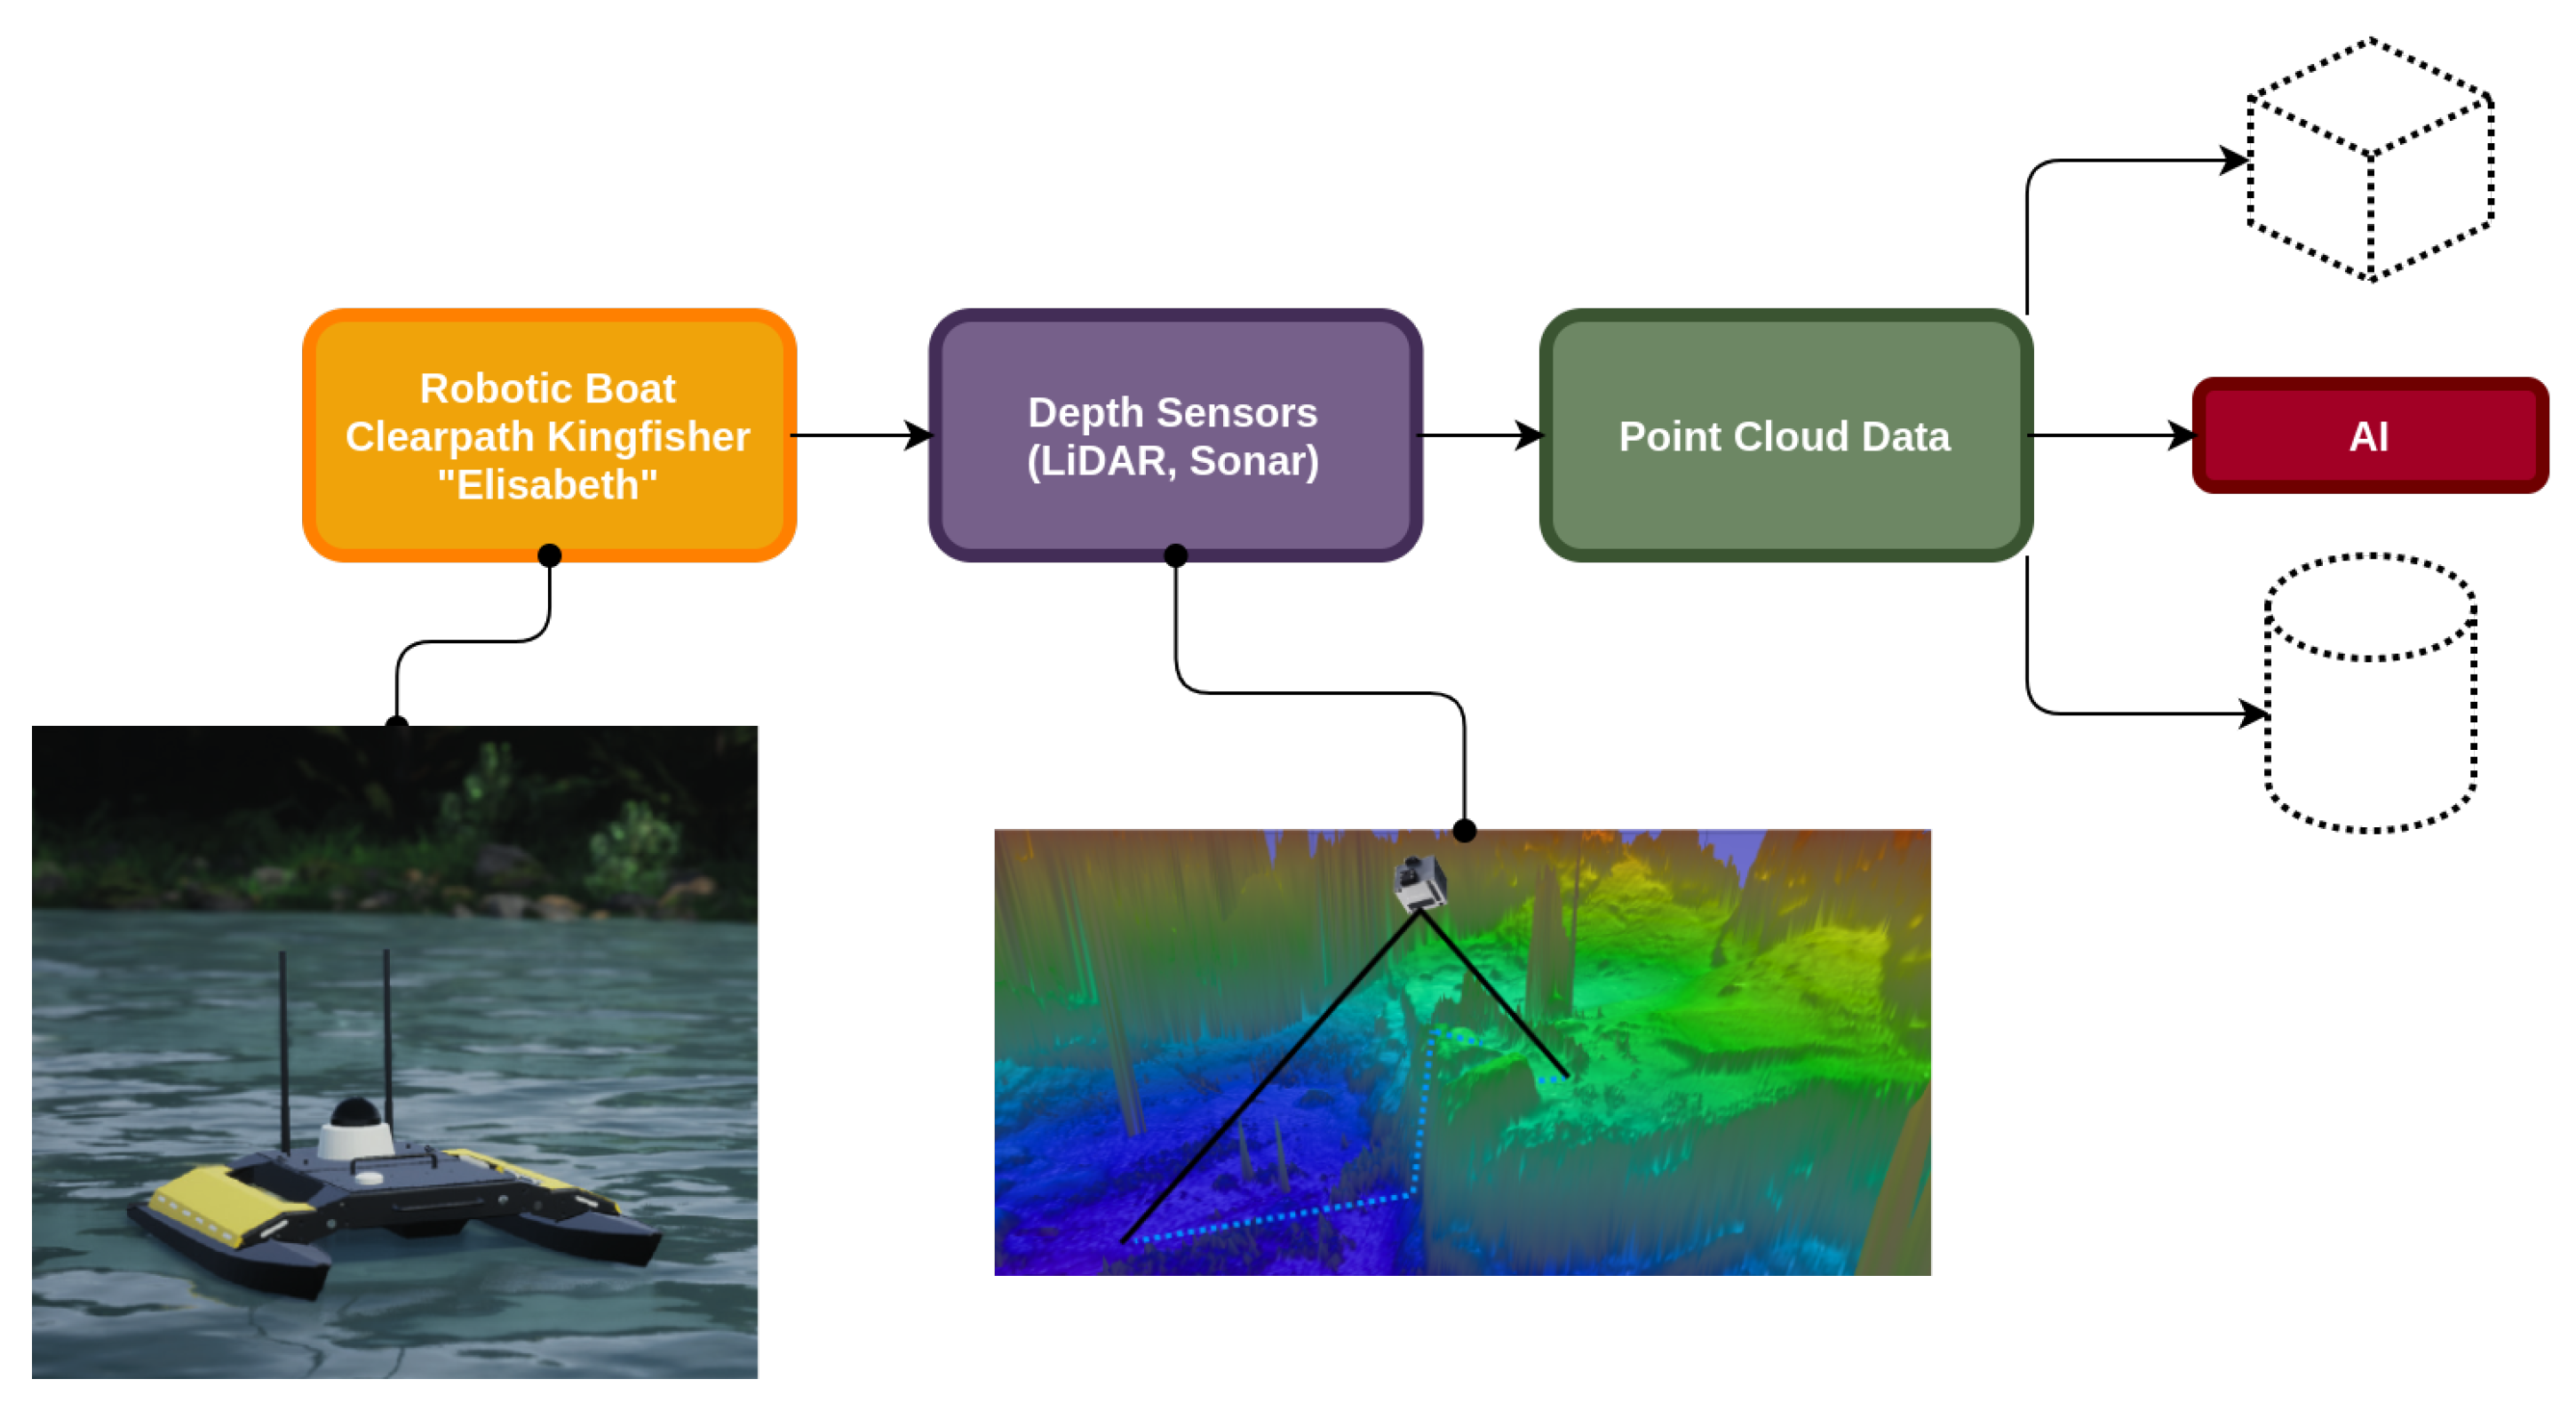
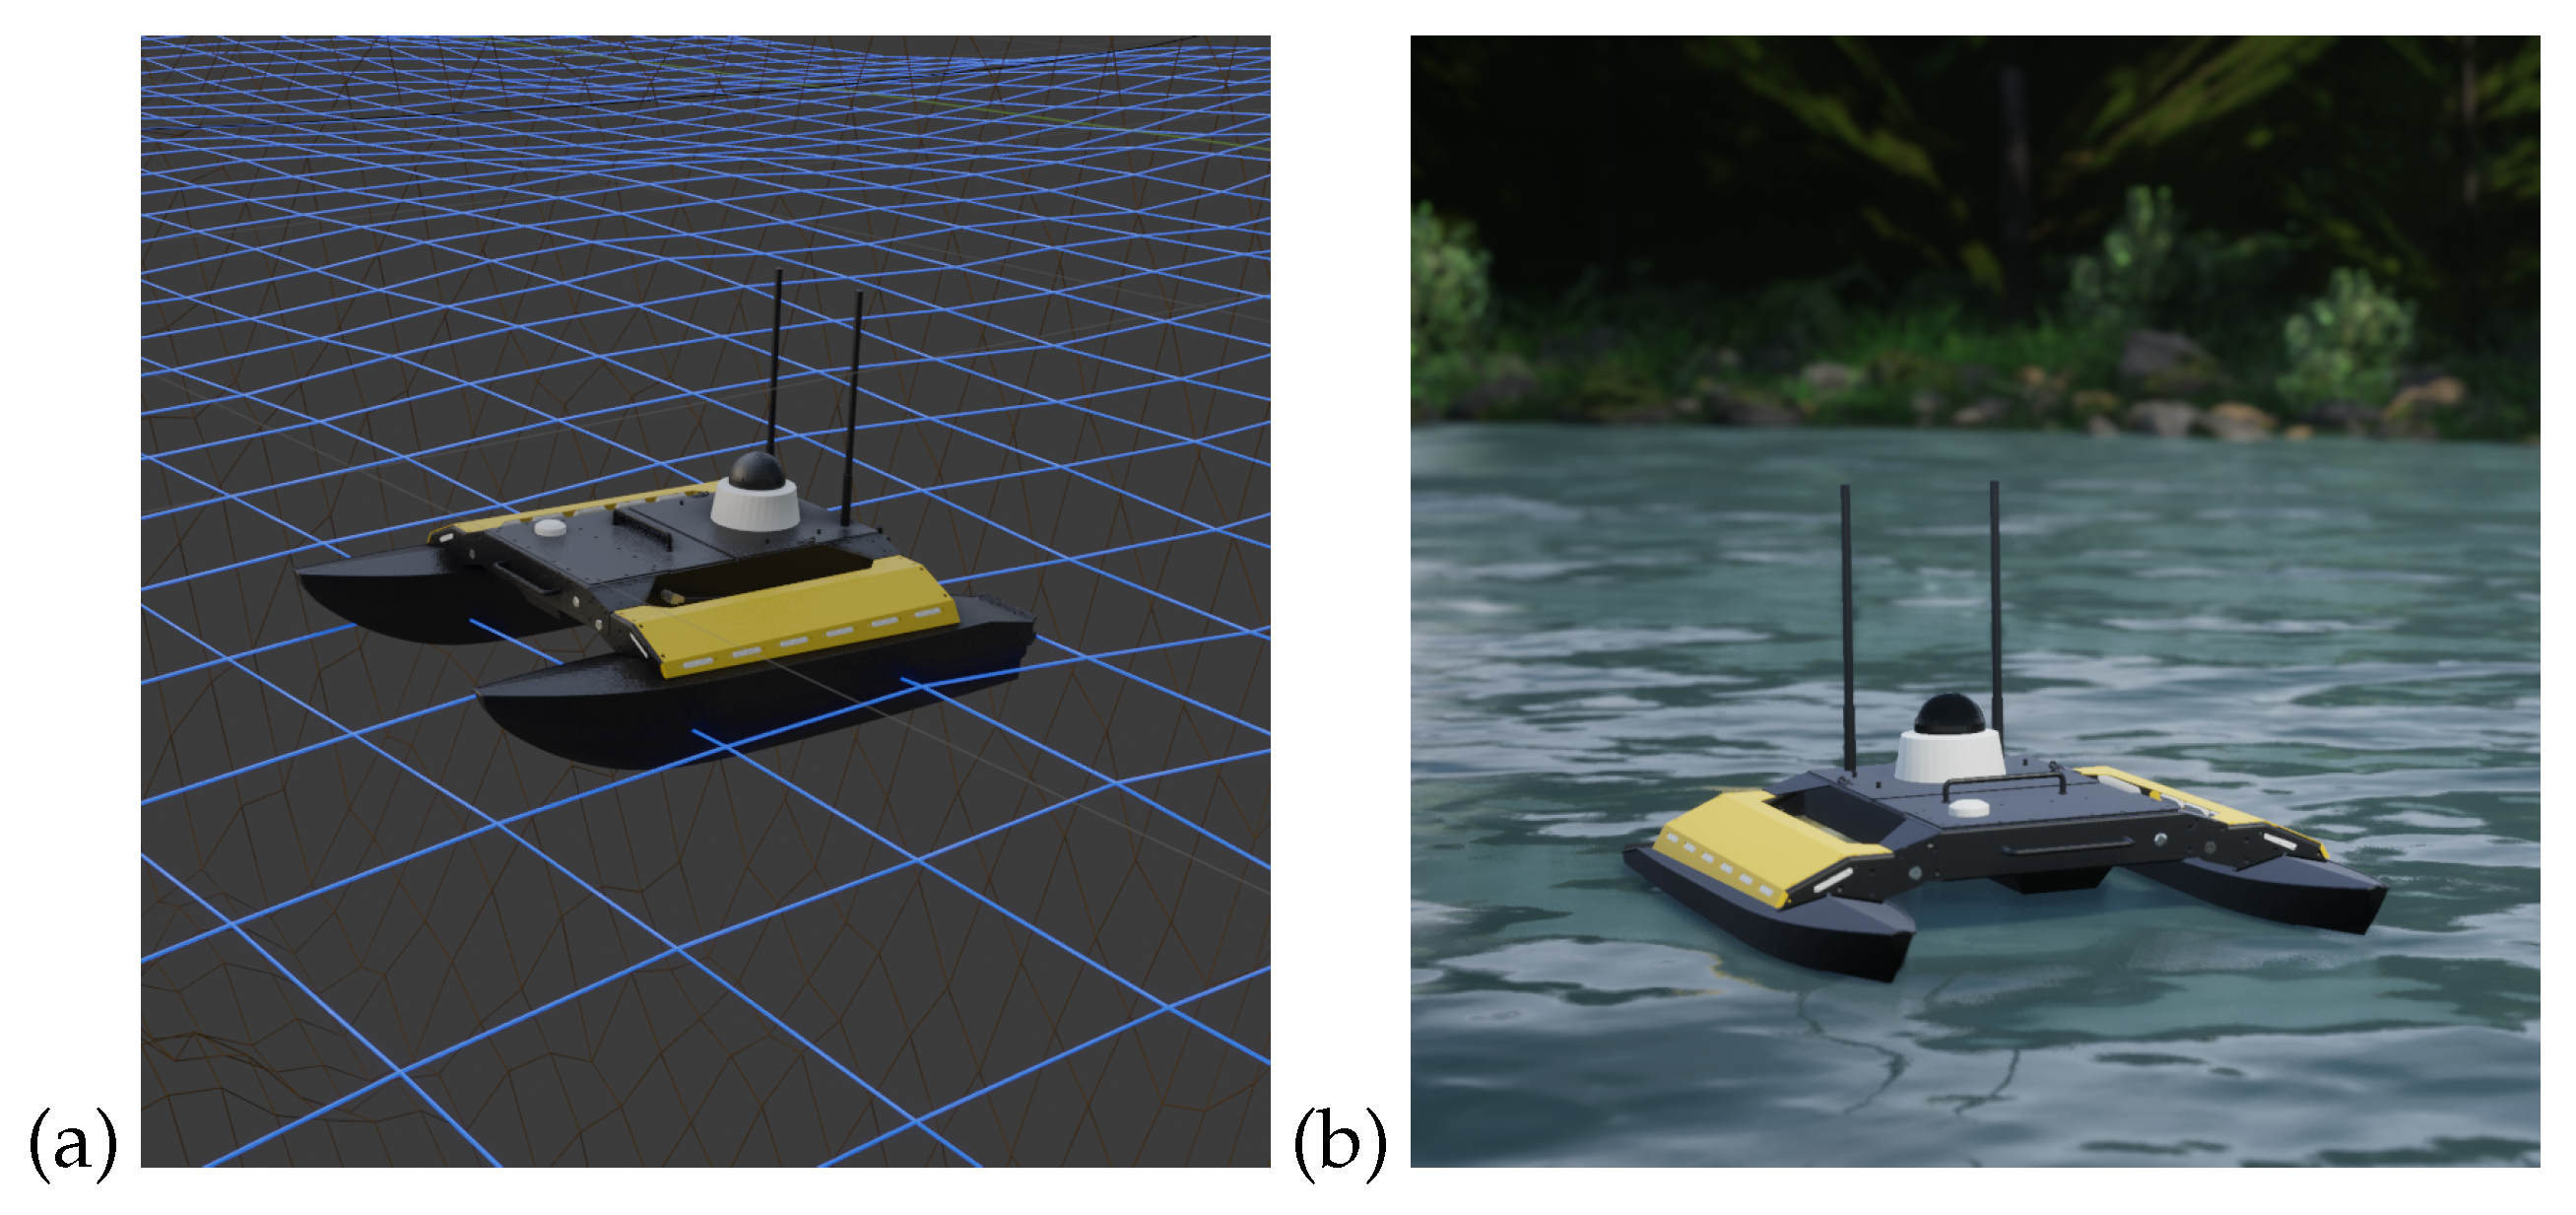
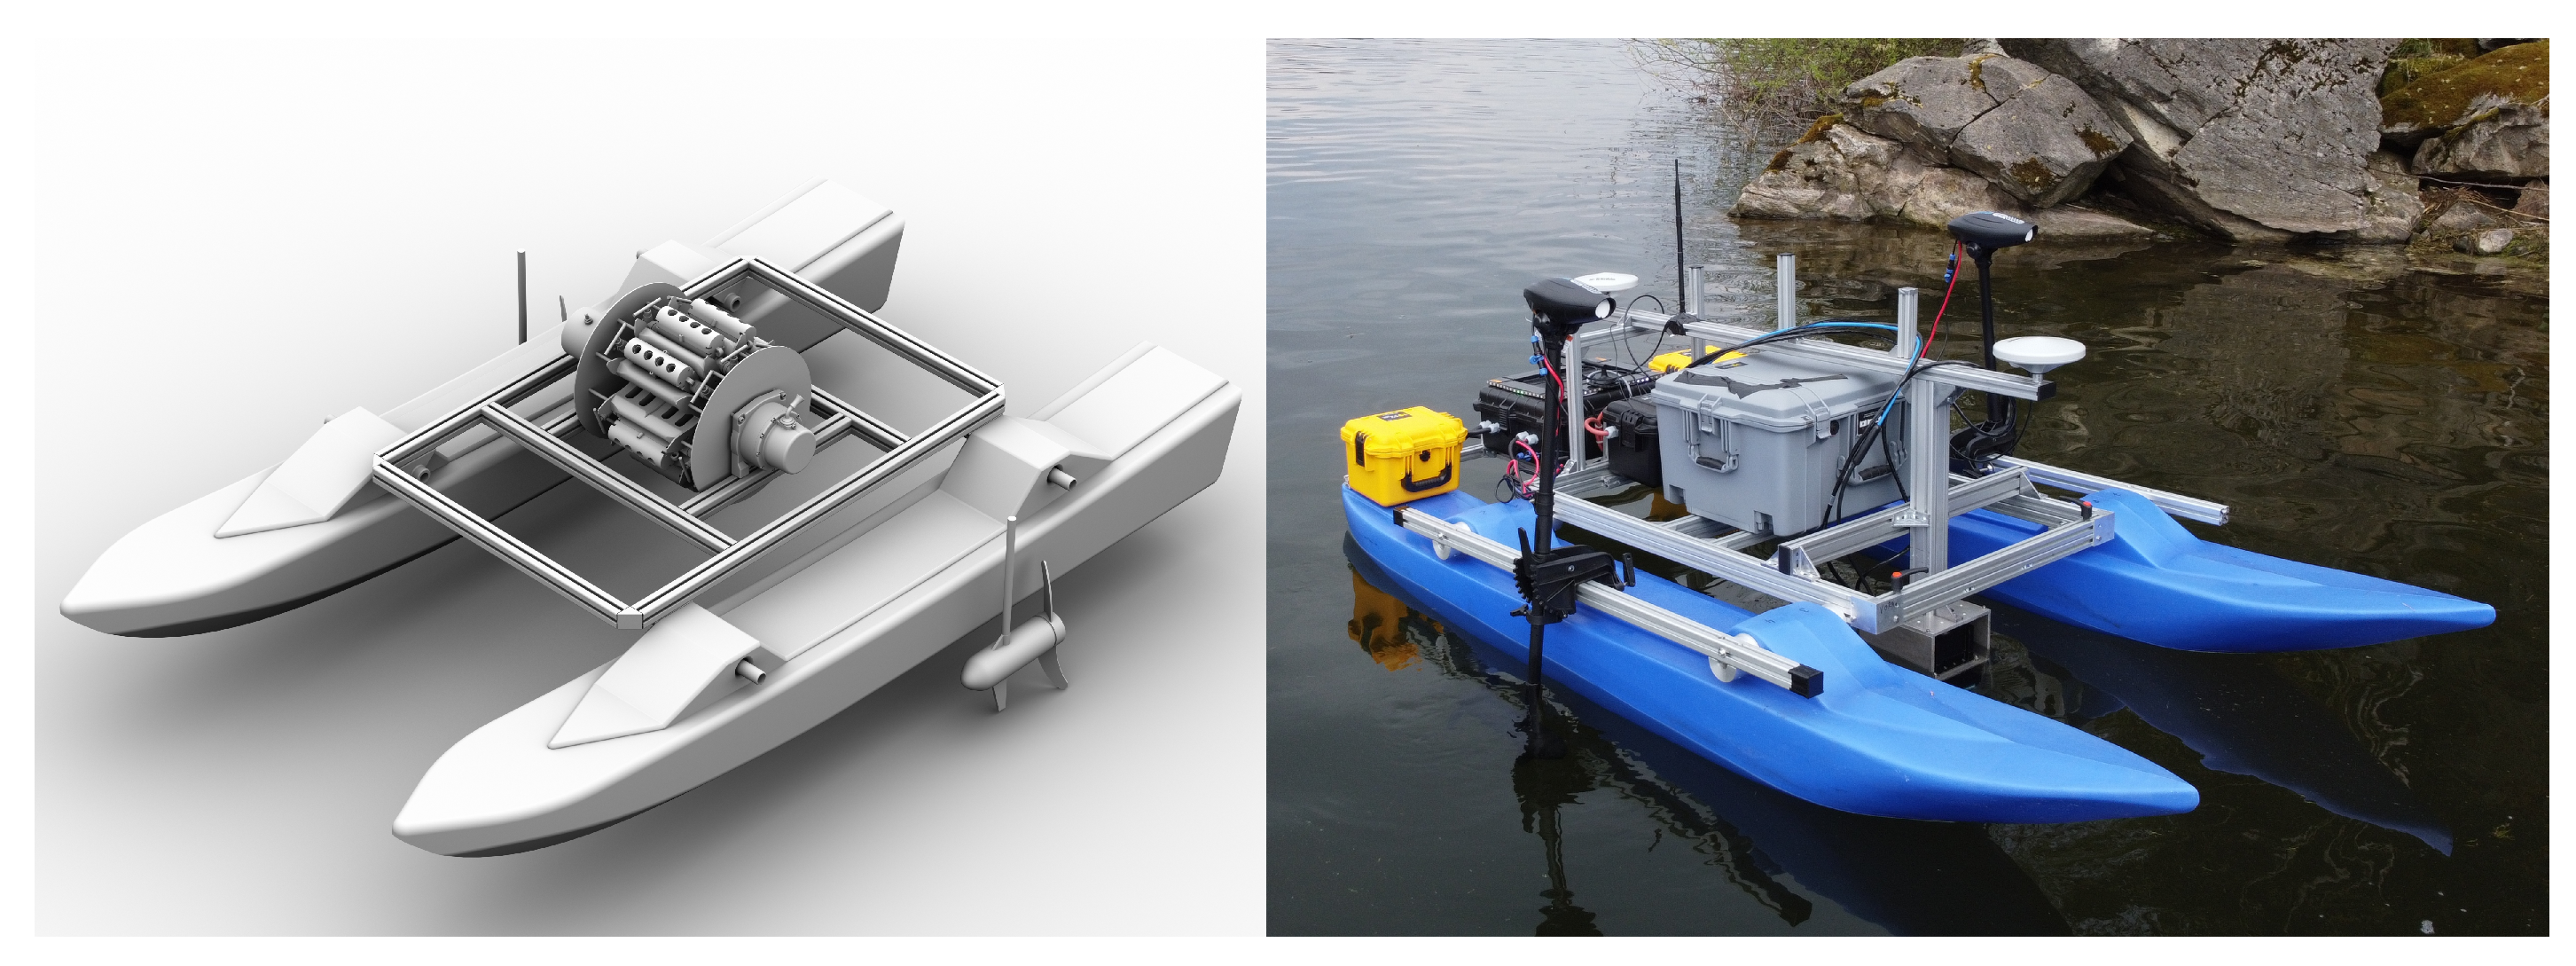
2.2. ASV–Autonomous Surface Vehicle
2.3. Sea Ground Detection
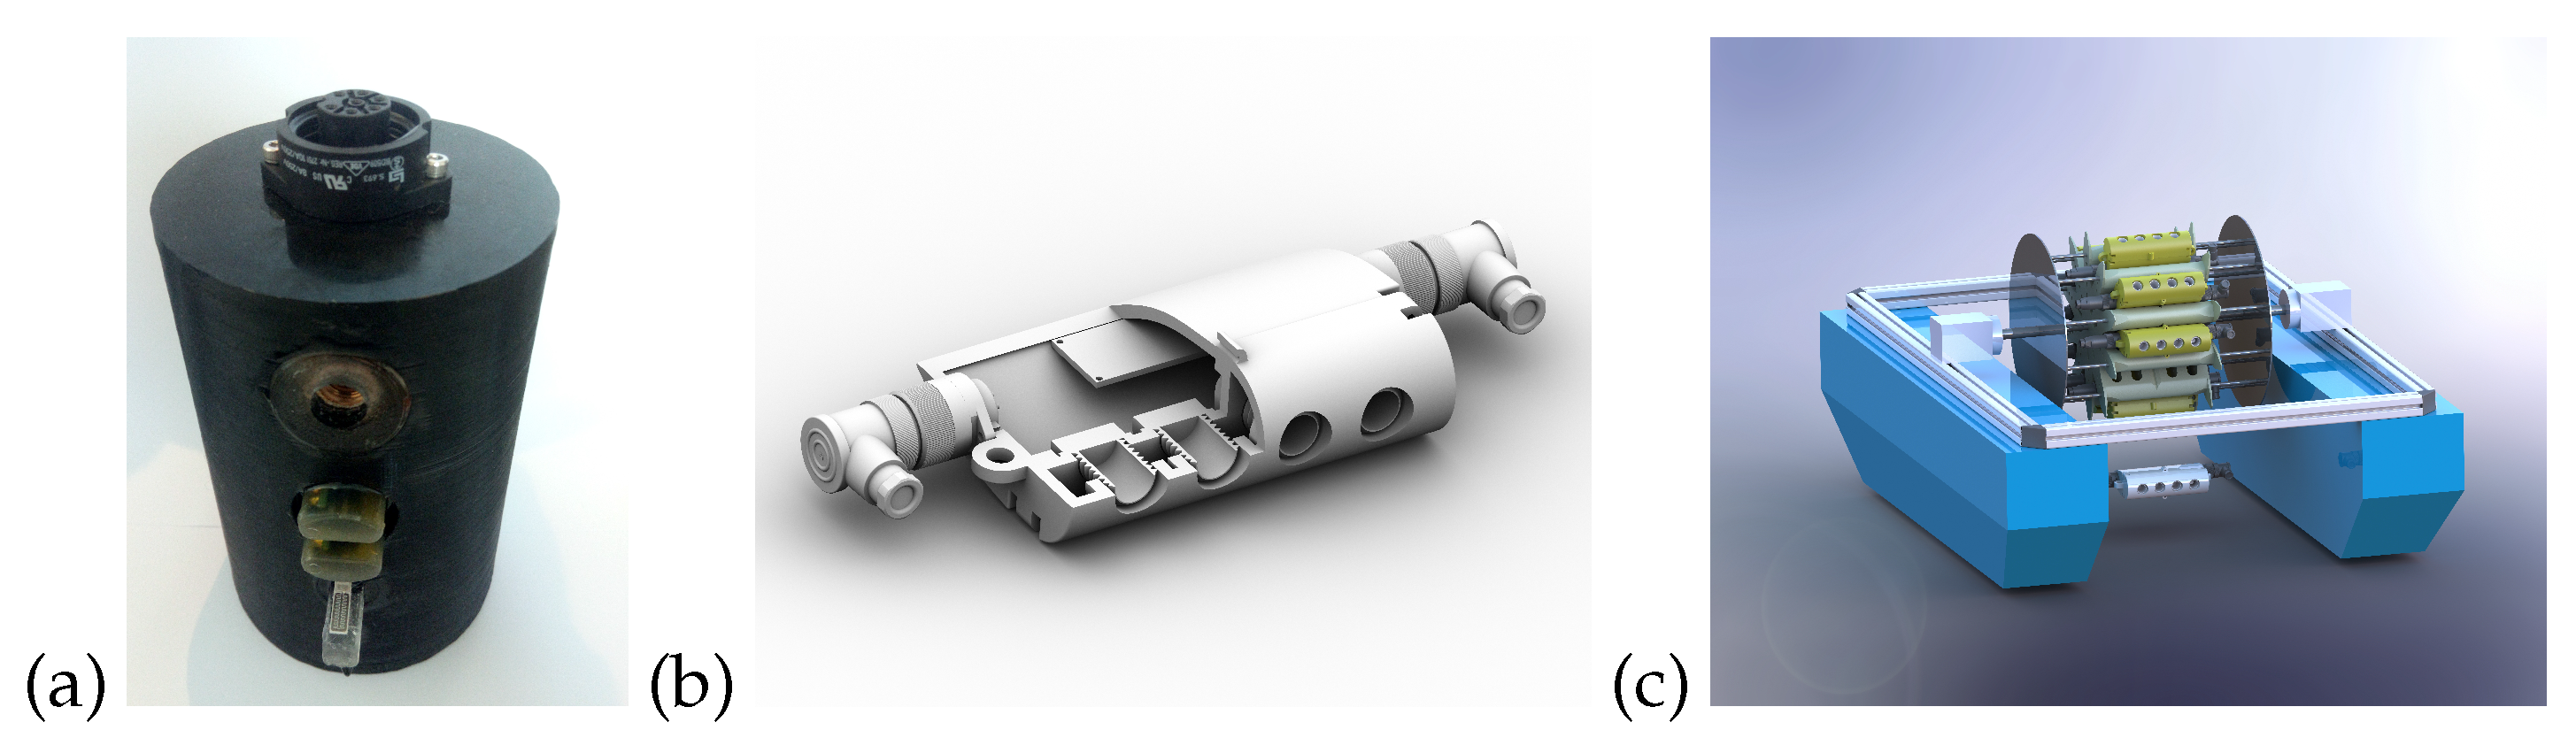
2.4. Water Parameter and Respiration Measurement

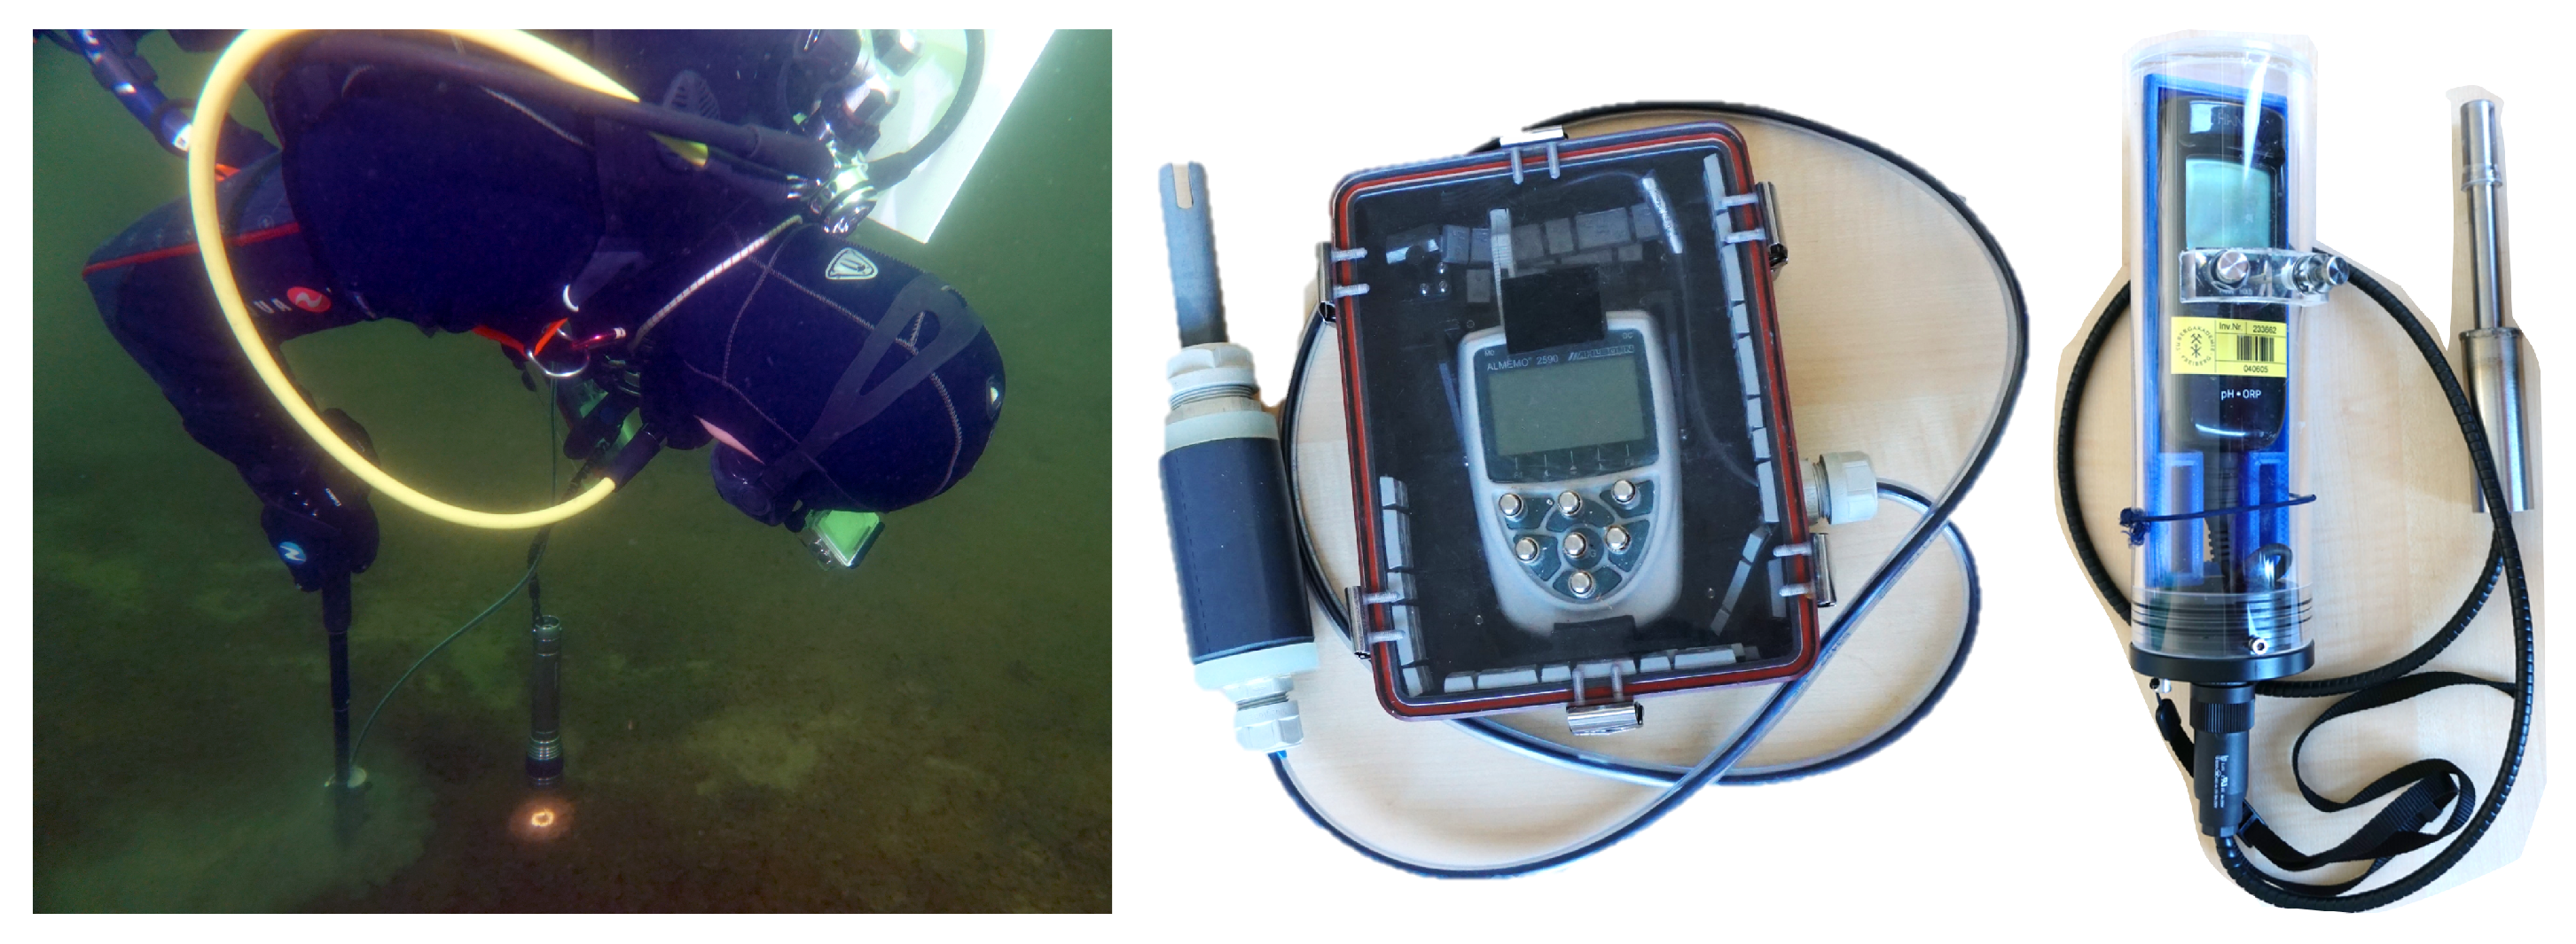
2.5. Scientific Divers Investigations
2.6. Investigation Area
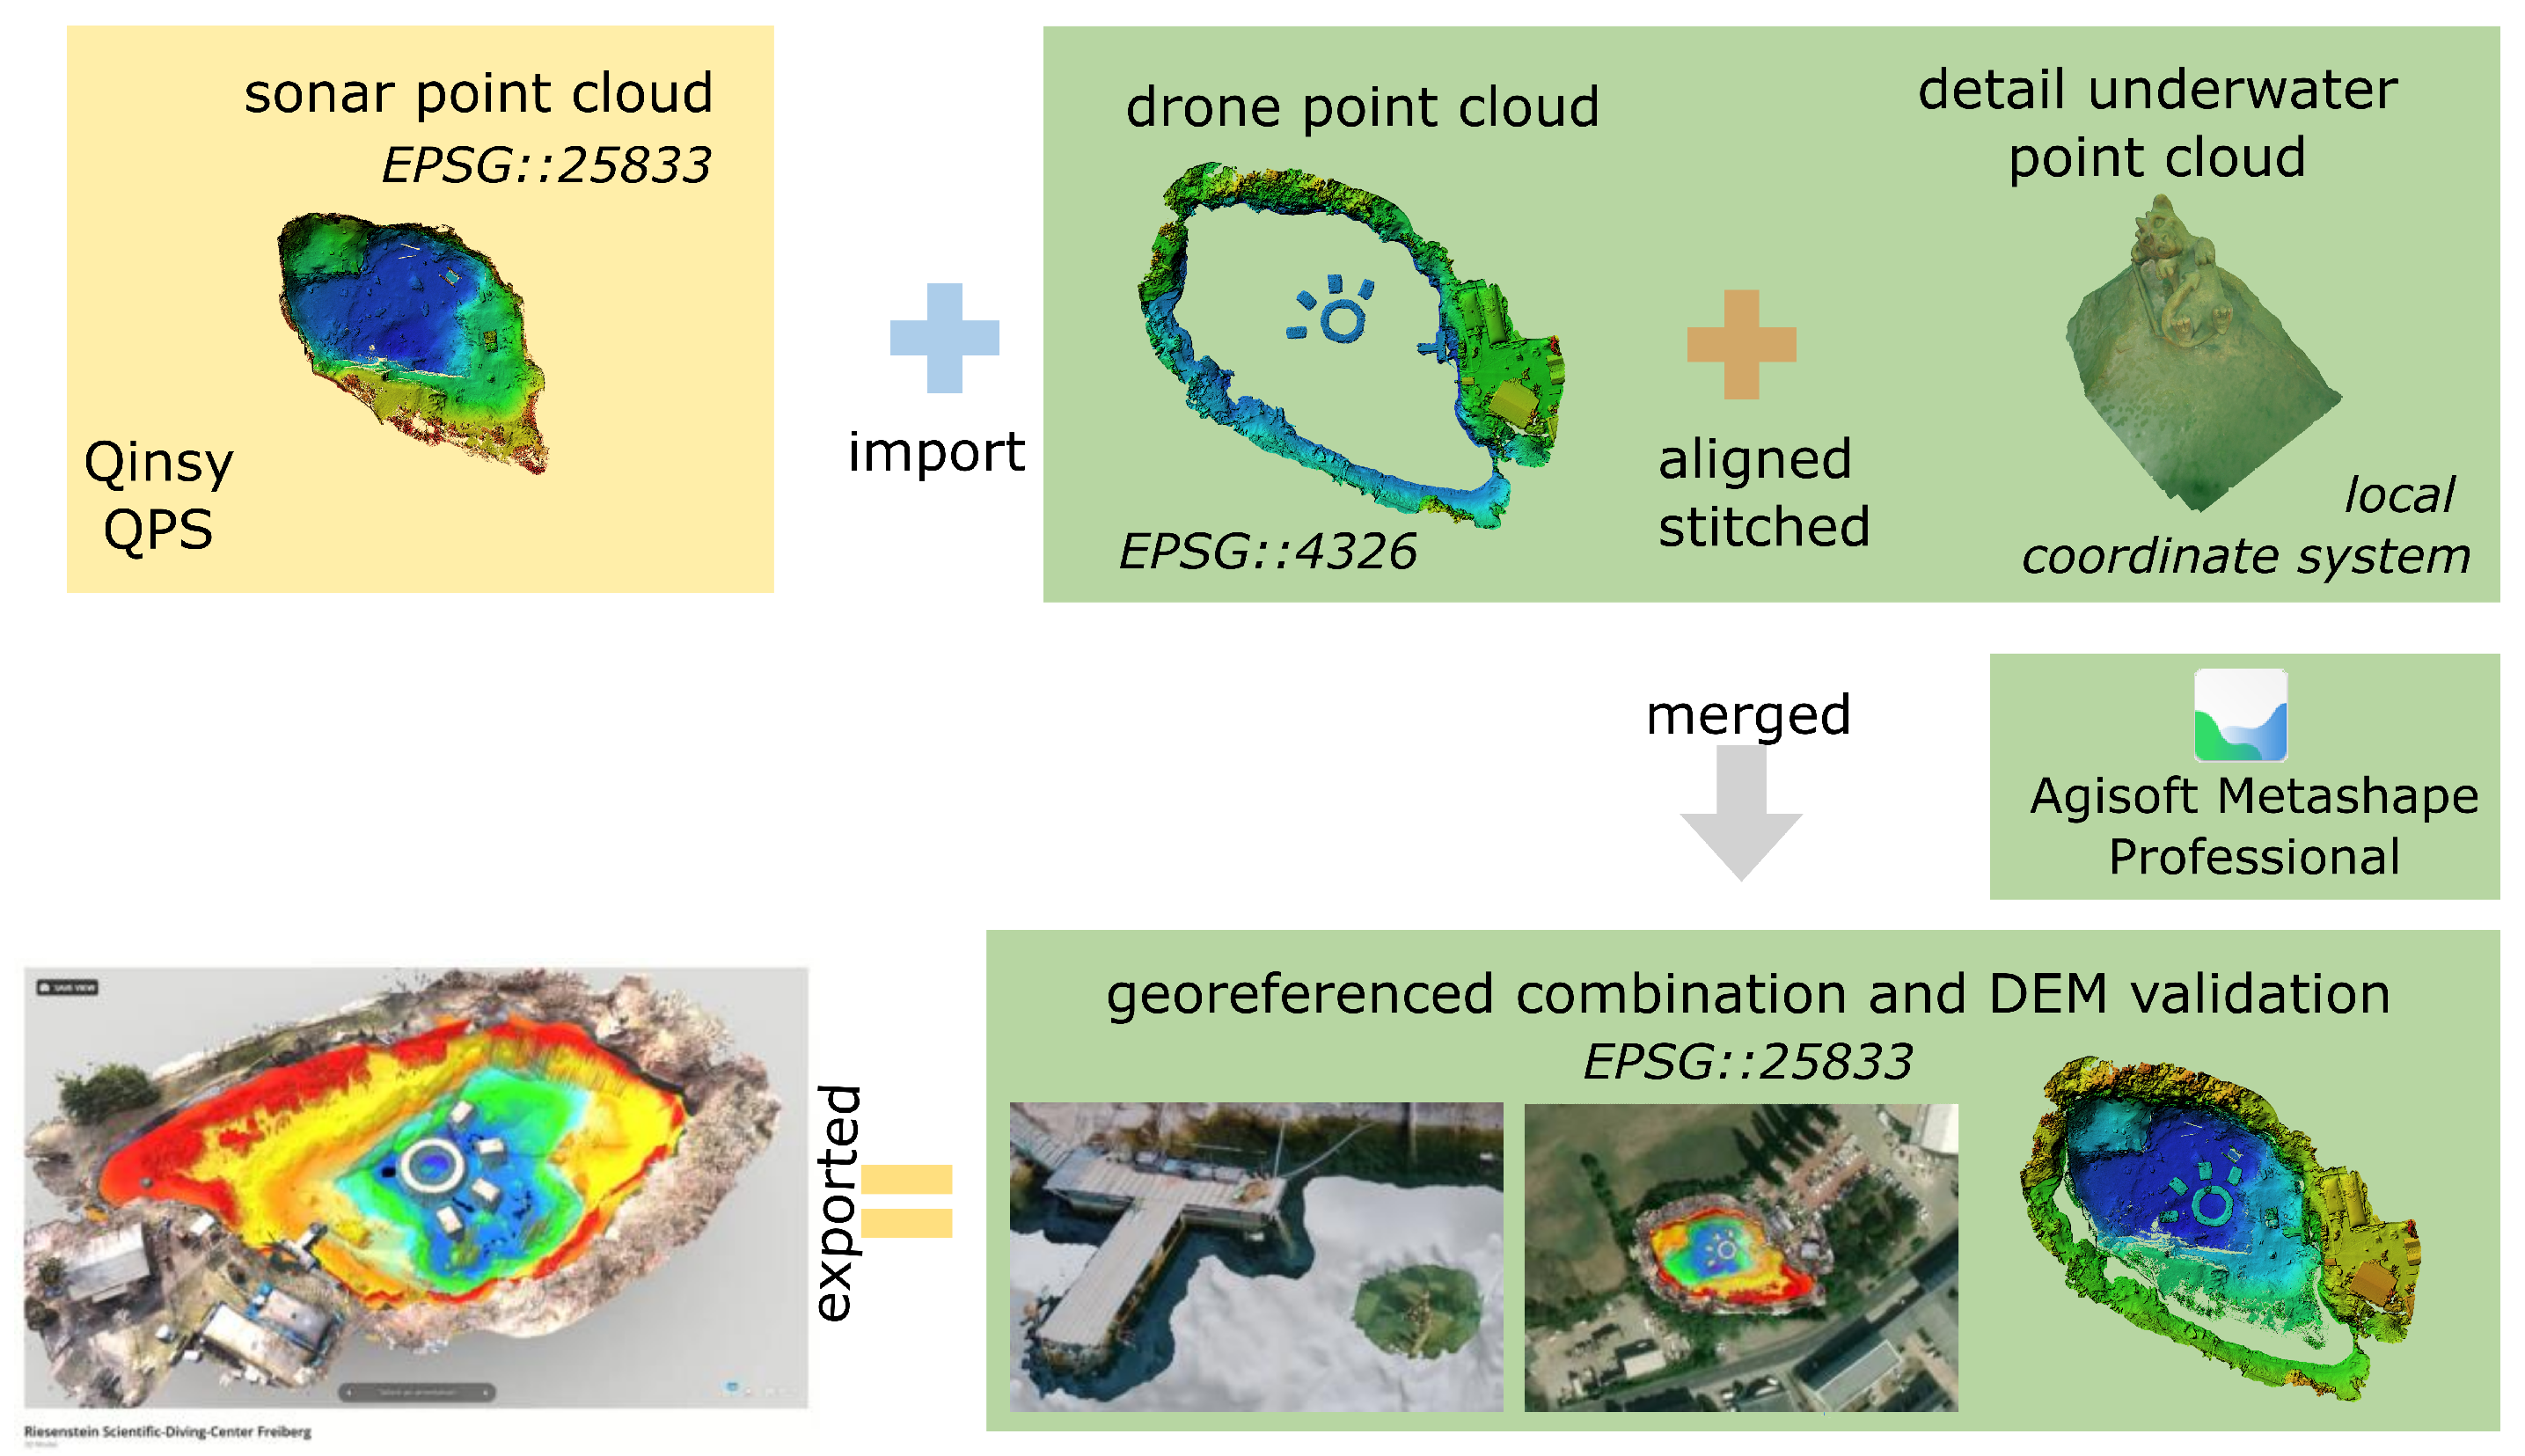
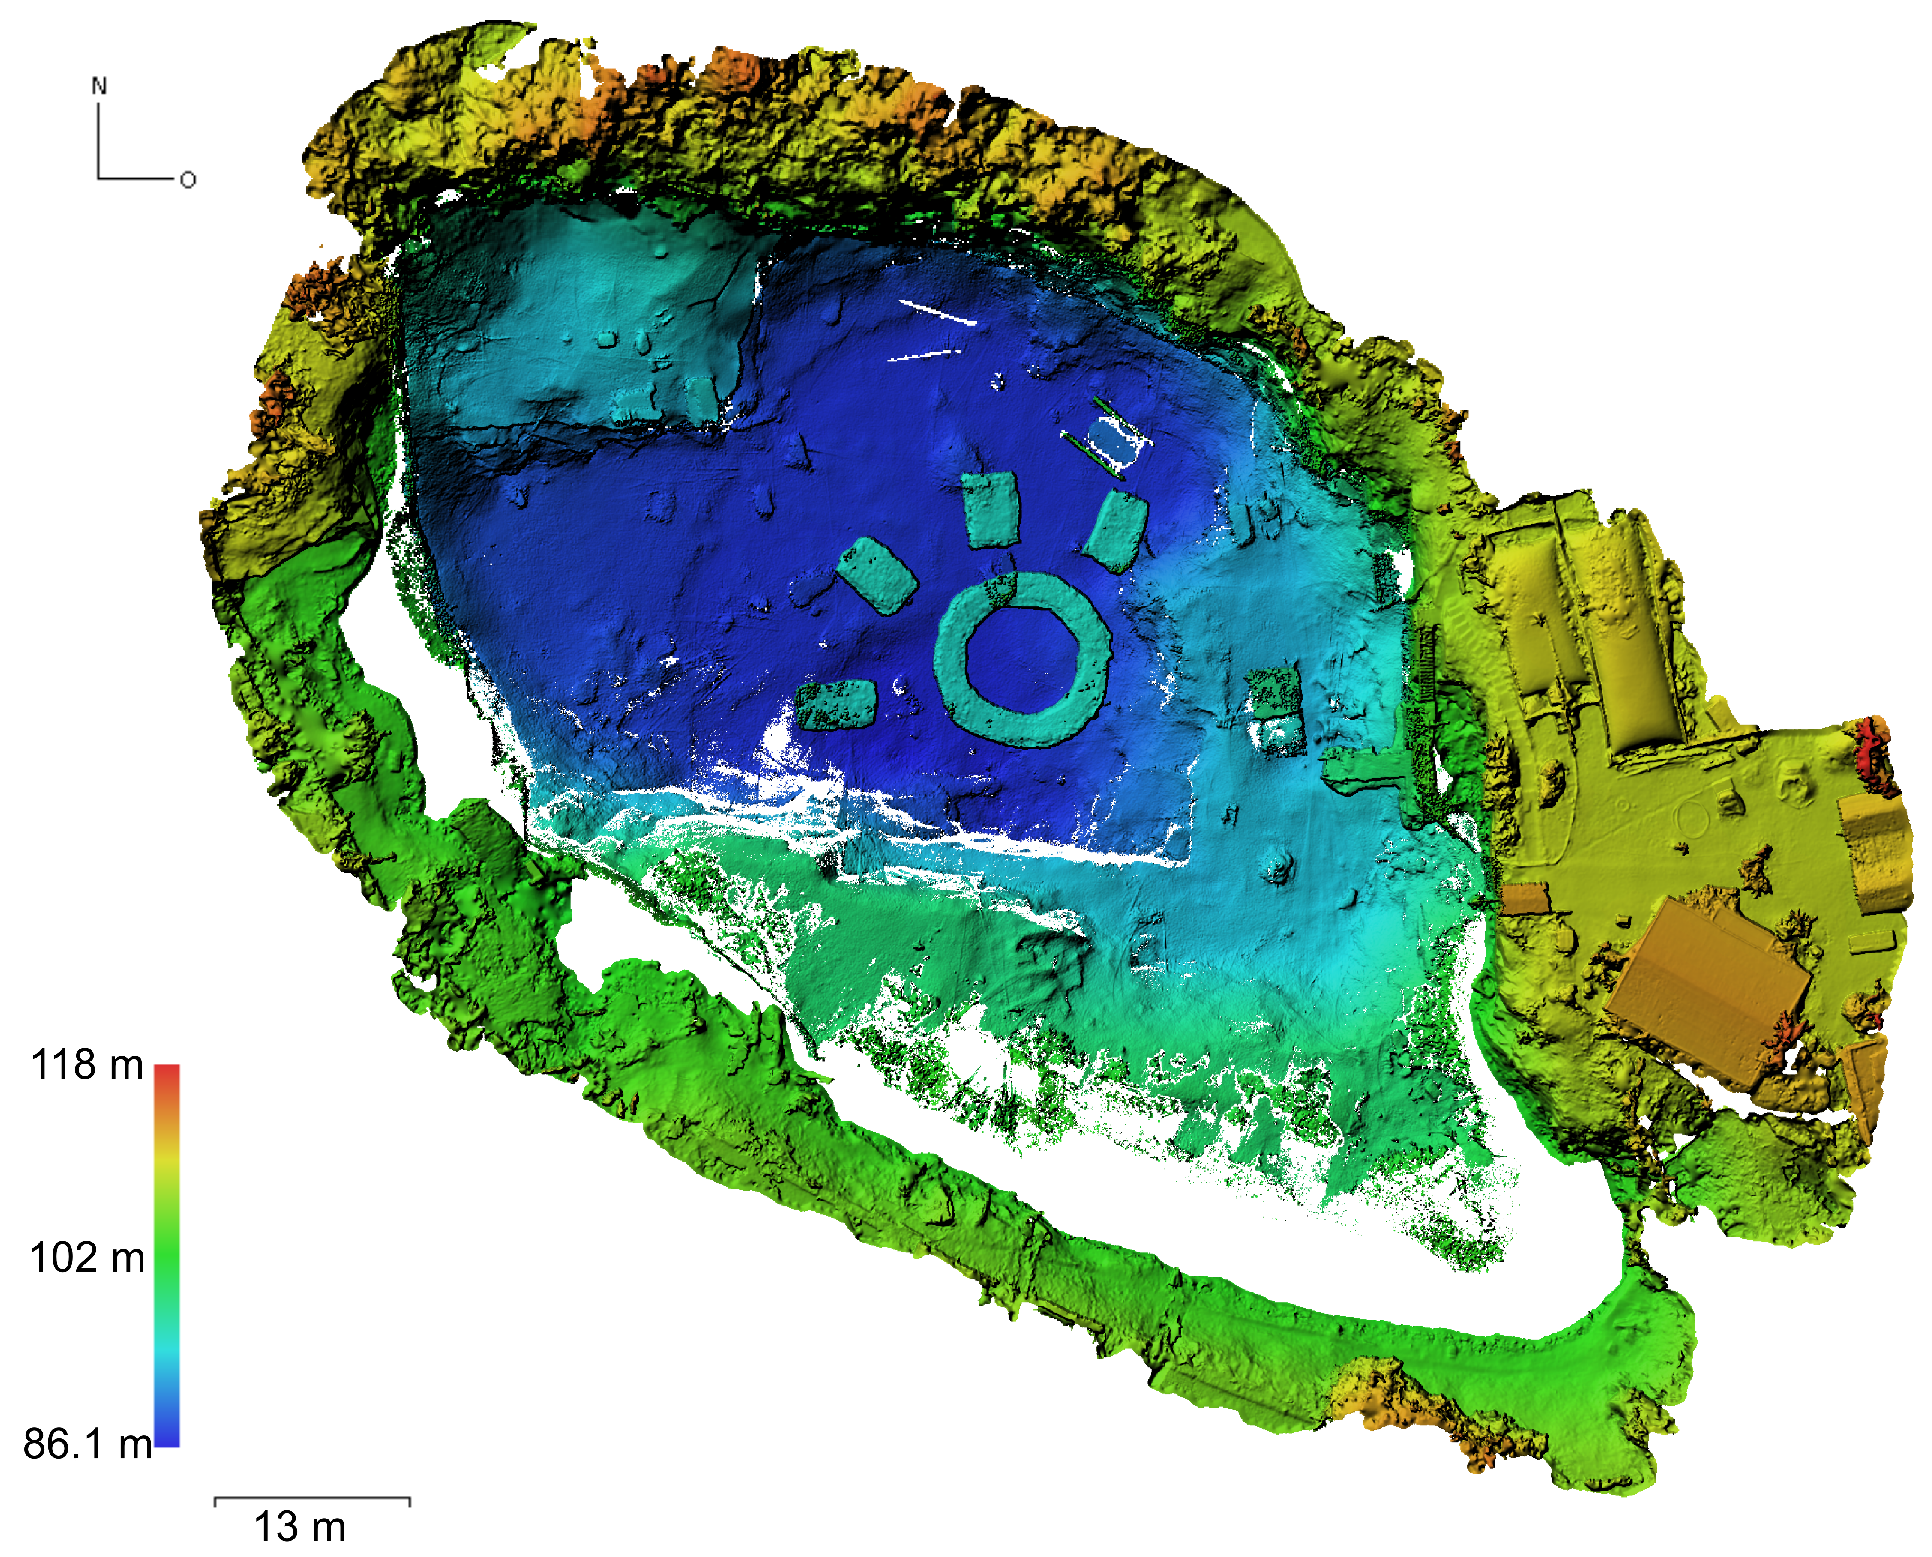
3. Results of the Photogrammetry and Sonar Sampling
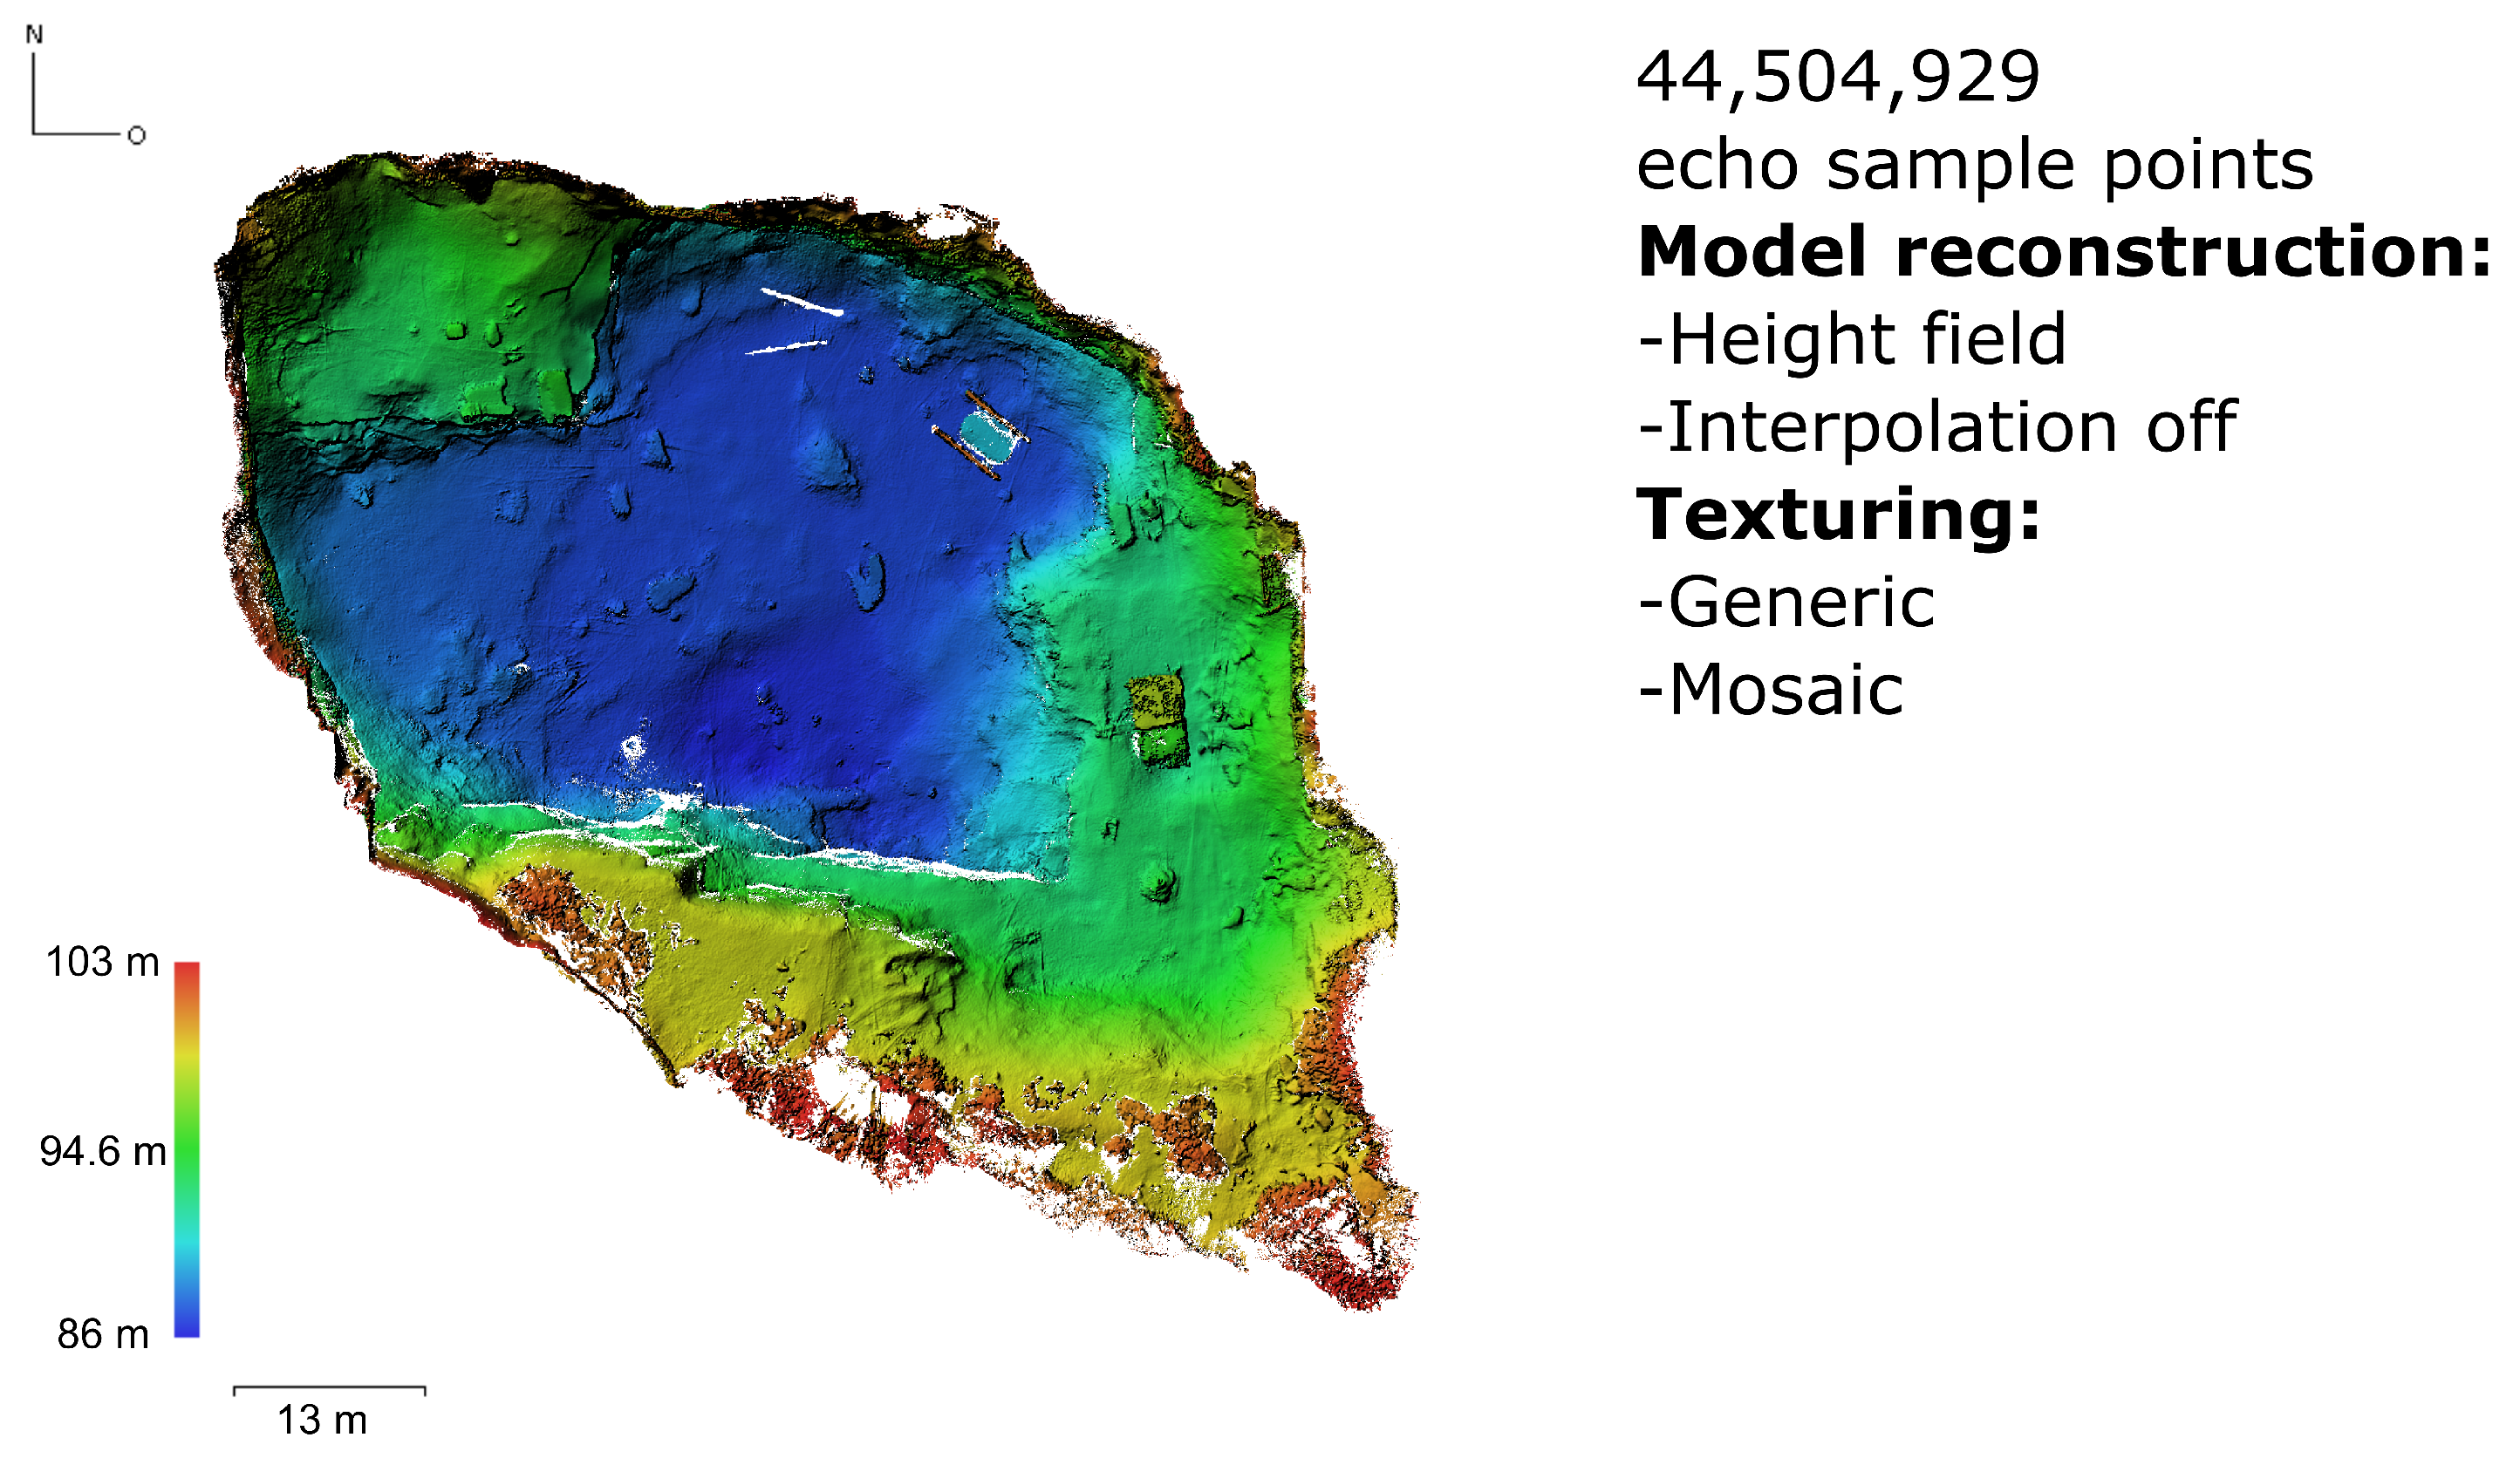
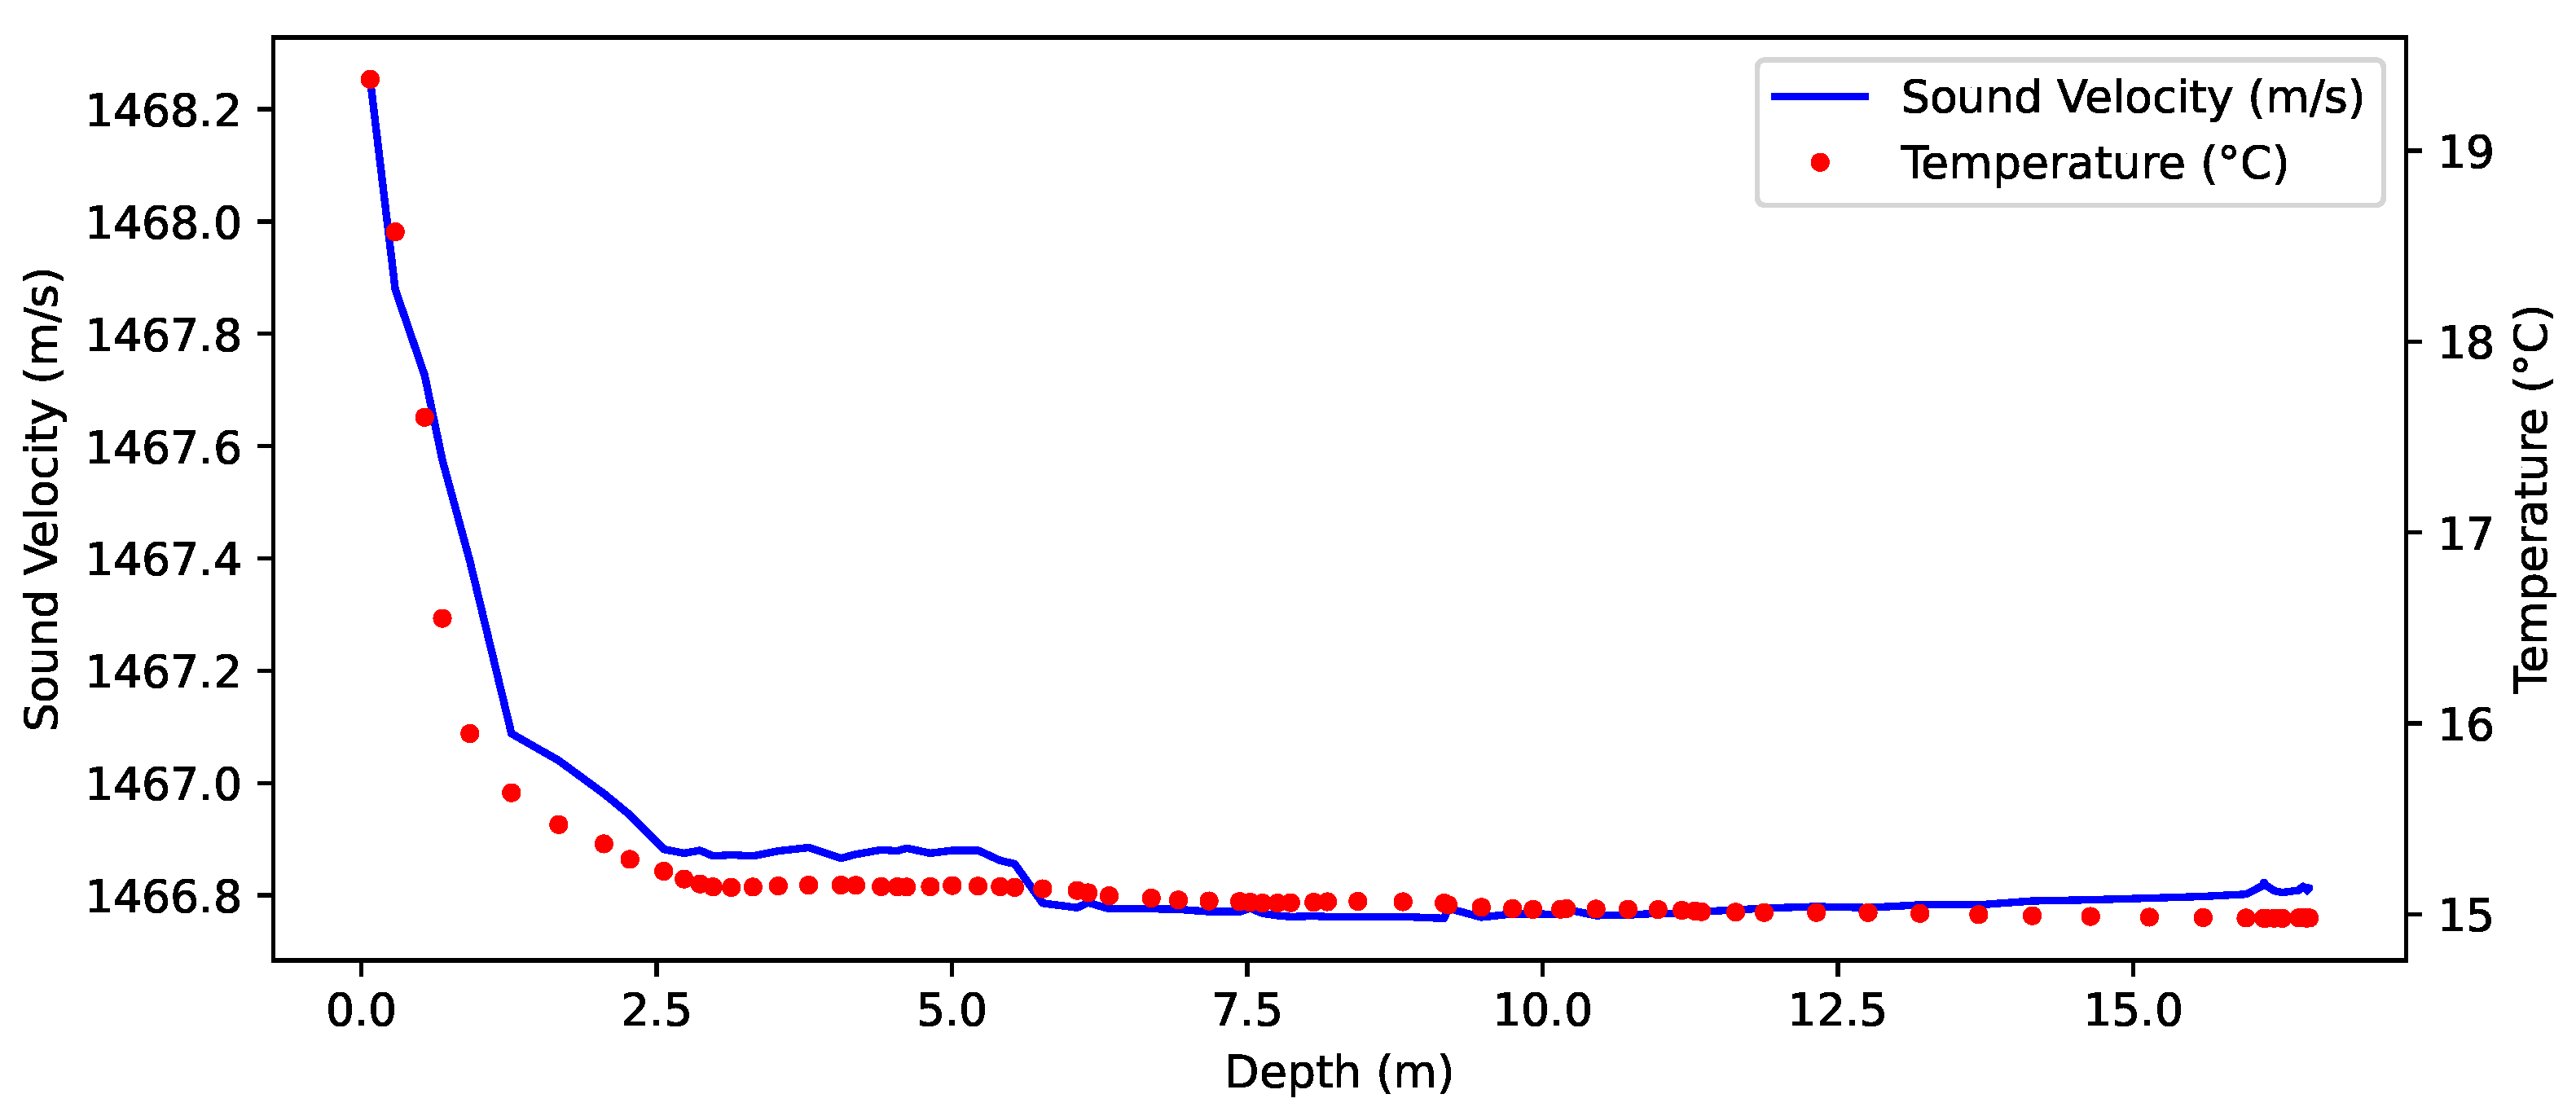
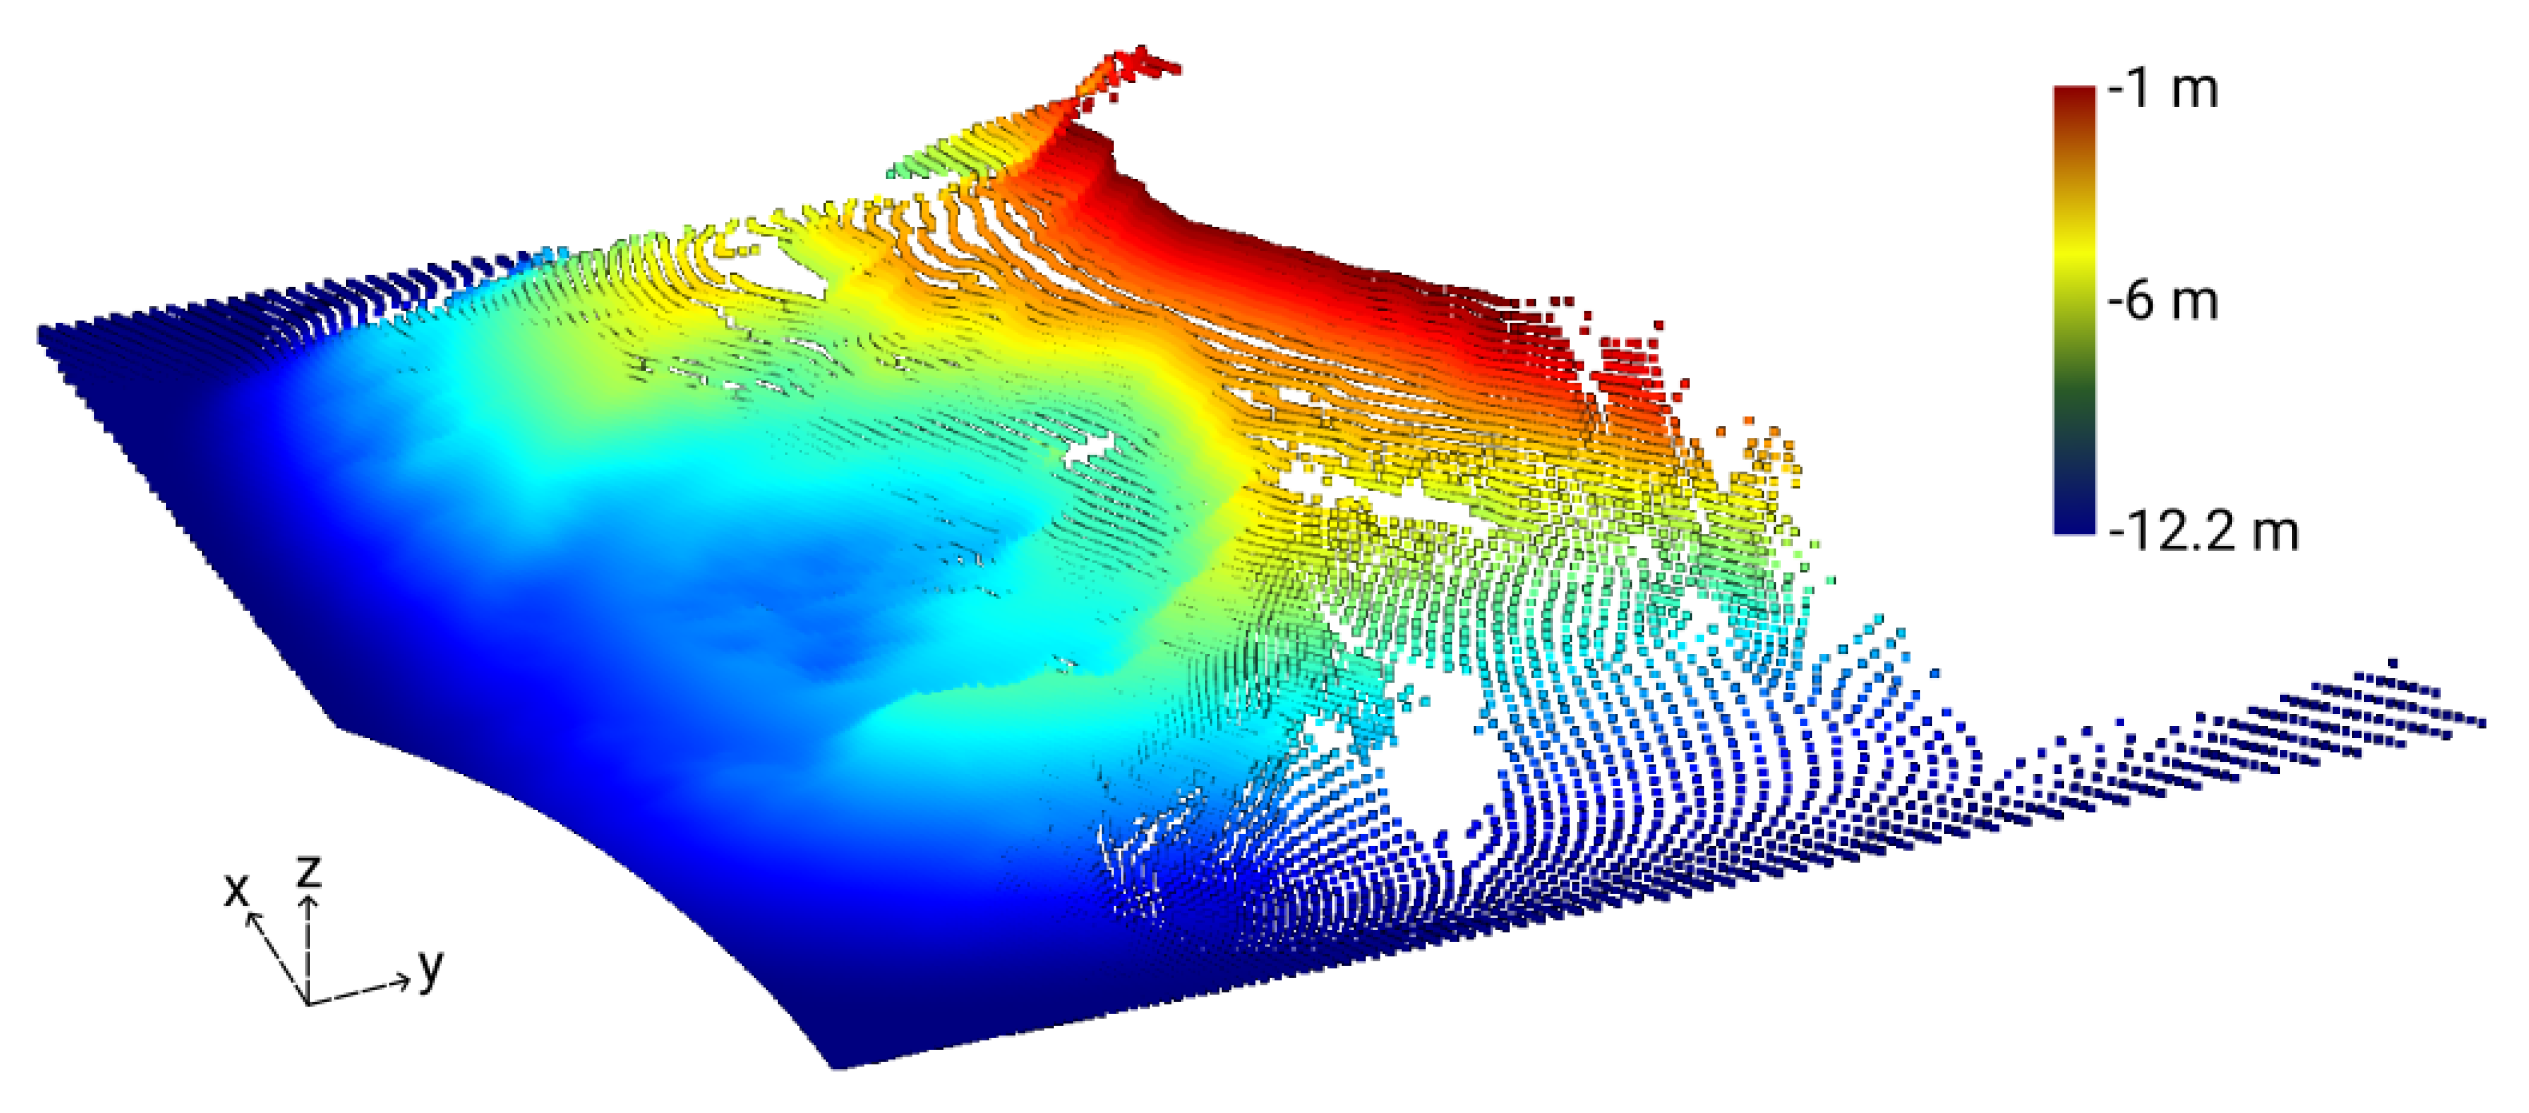
3.1. Sonar Sampling

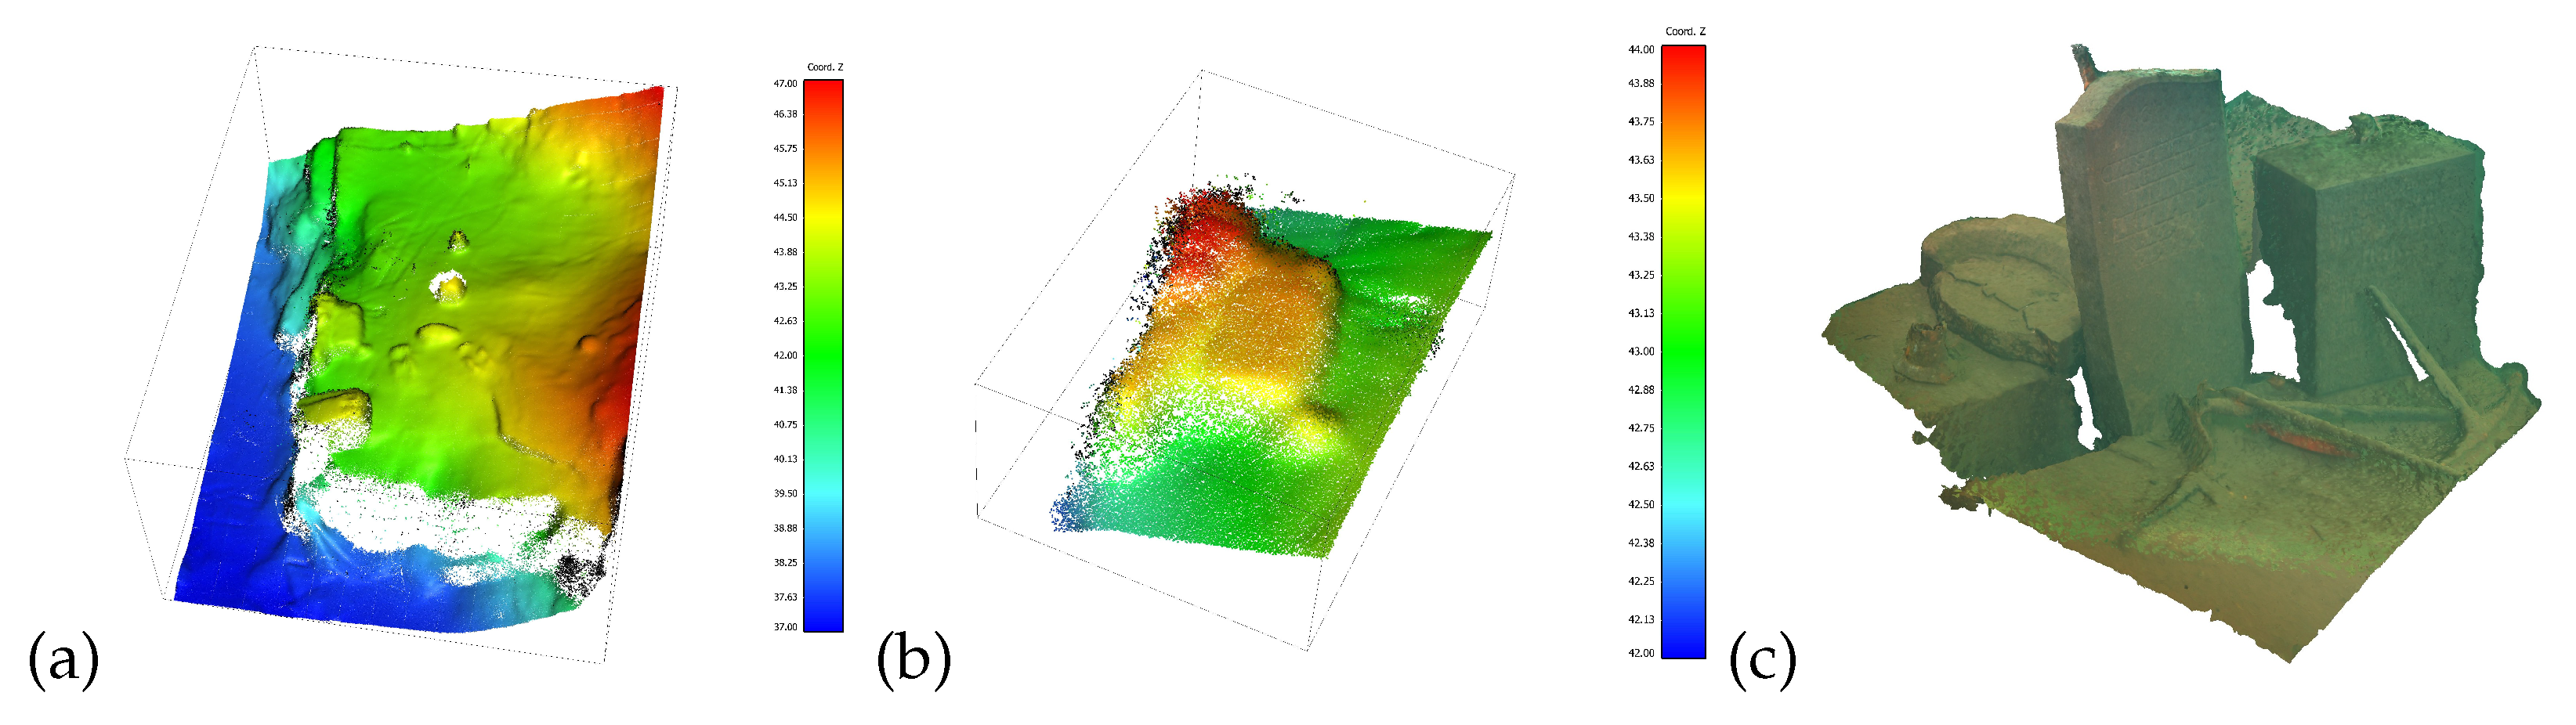
3.2. Photogrammetry Results
3.2.1. Landscape Reconstruction
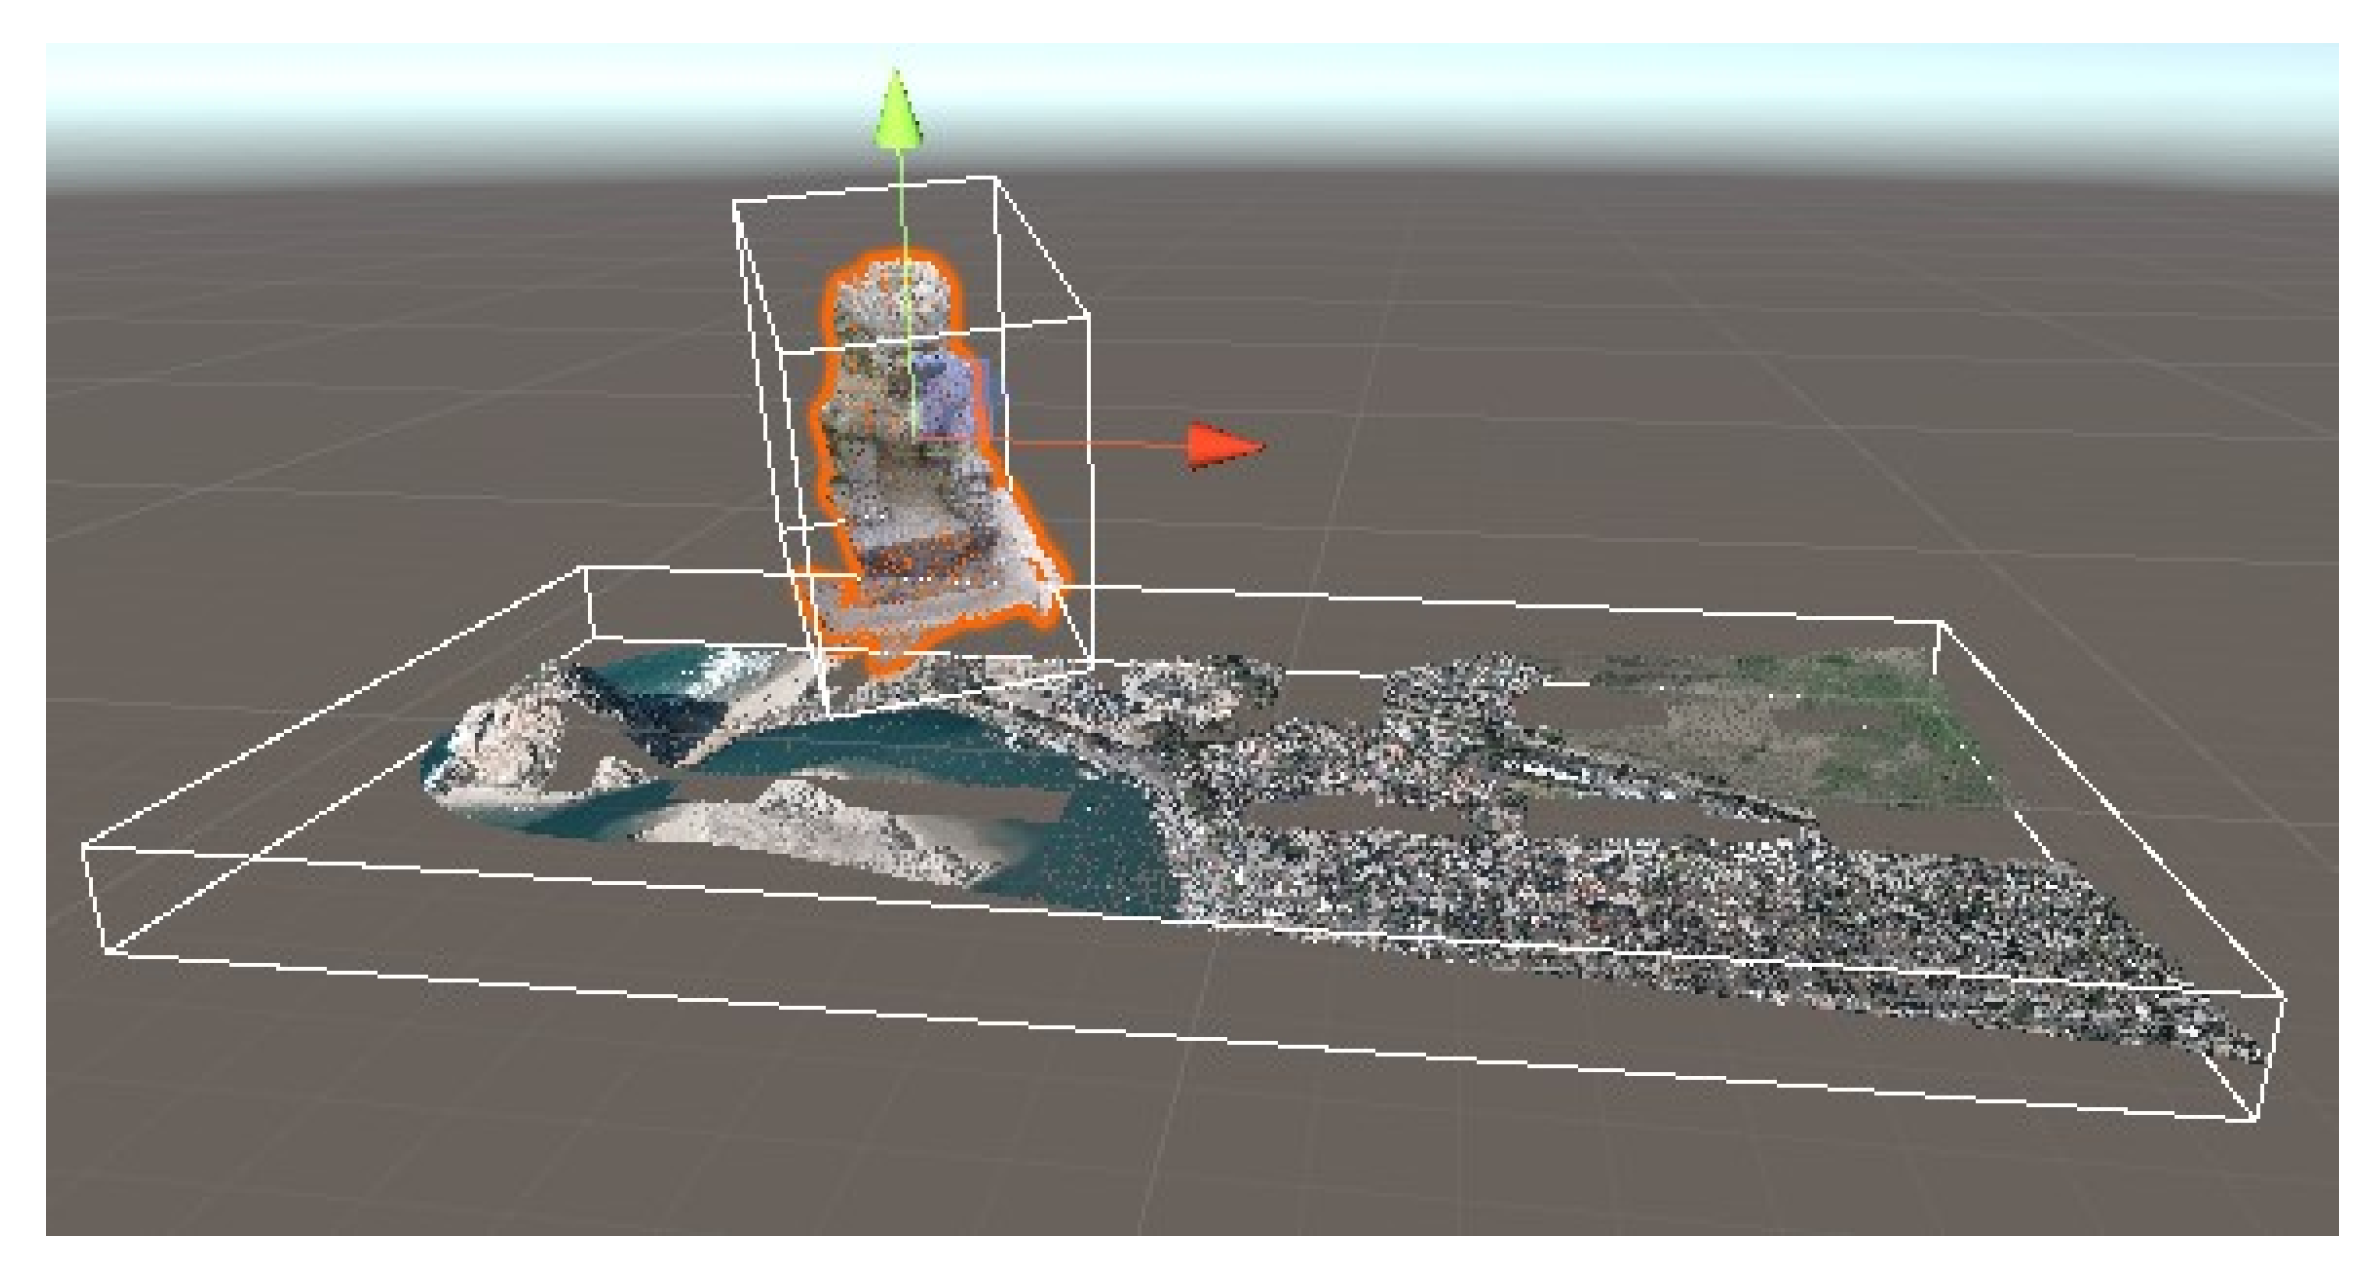
3.2.2. Underwater Reconstruction

| Value | Injection Pump (Figure 10a) | Weapons (Figure 10b) | Switch Box (Figure 10c) | Wheel (Figure 10d) |
|---|---|---|---|---|
| images number | 177 | 76 | 173 | 228 |
| point density | 6.13 × 10⁶ points/m2 | 3.54 × 10⁶ points/m2 | 2.06 × 10⁶ points/m2 | 2.65 × 10⁶ points/m2 |
| accuracy | 0.404 × 10³ m/pix | 0.532 × 10⁻³ m/pix | 0.698 × 10⁻³ m/pix | 0.614 × 10⁻³ m/pix |
| calculation time | 1541 min | 596 min | 283 min | 1237 min |
3.3. Combination of All Models
4. Simulation and Data Visualization
- Create a virtual environment, e.g., with photogrammetry and post-processing in Blender; (see Section 3.2).
- Parameterize depth sensors (mainly sonar from Section 3.1, but LiDAR would be possible as well) and water body layers.
- Implement water body physics (abstract with water surface displacement or more realistic with physics engine for fluids).
- Recreate animation pipelines and path movements.
- Create data with virtual sensors of [13], export these data and train AI.
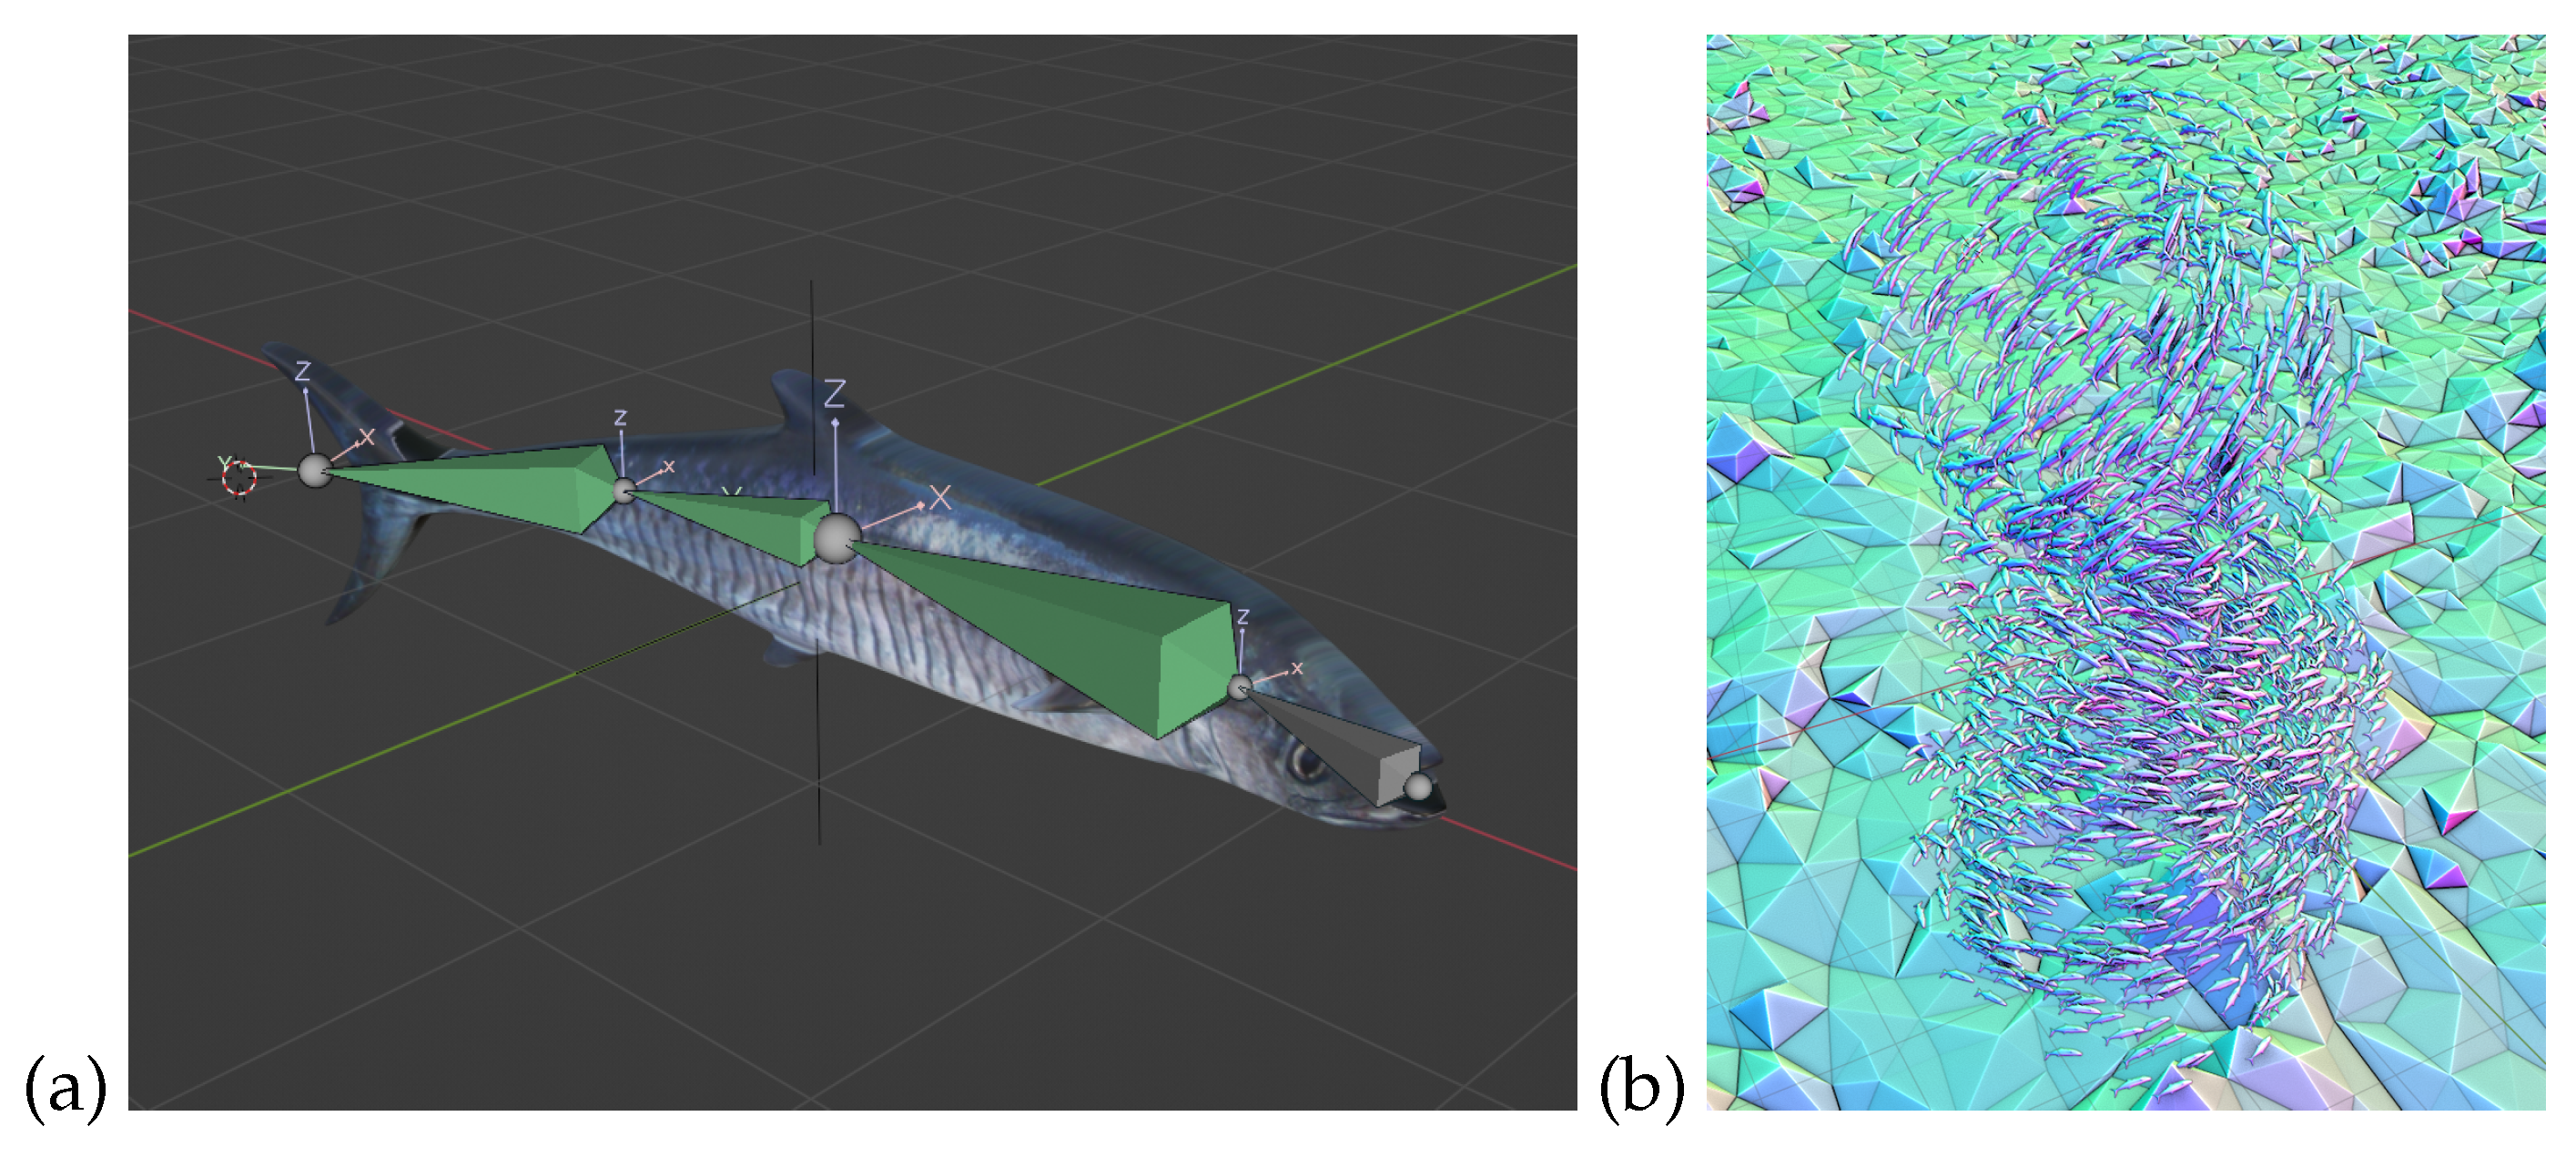
4.1. Simulations in Virtual Reality
- 1.
- Fish modeling (low poly mesh);
- 2.
- Fish rigging and animation (wiggle animation);
- 3.
- Particle system with fish object instancing;
- 4.
- Force field (vortex and turbulence) to simulate fish swarm movements.
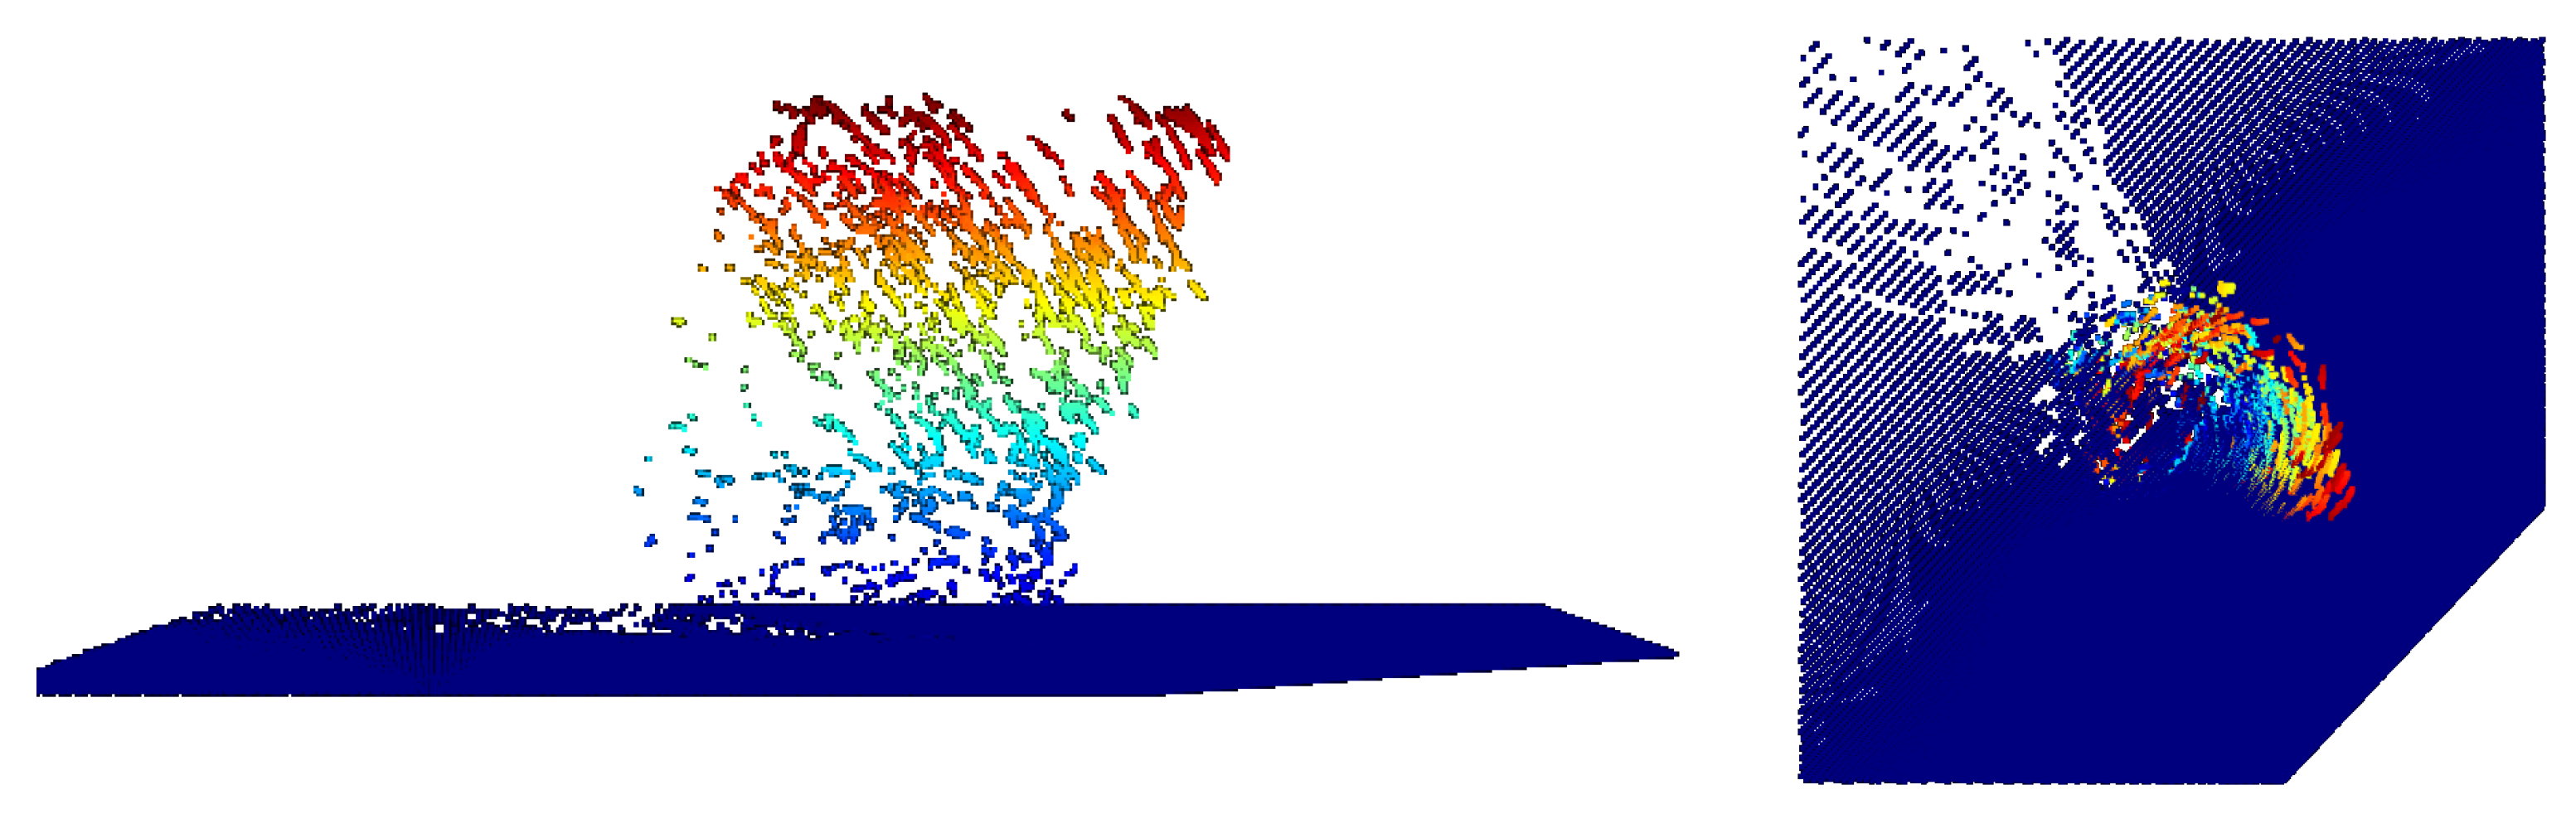
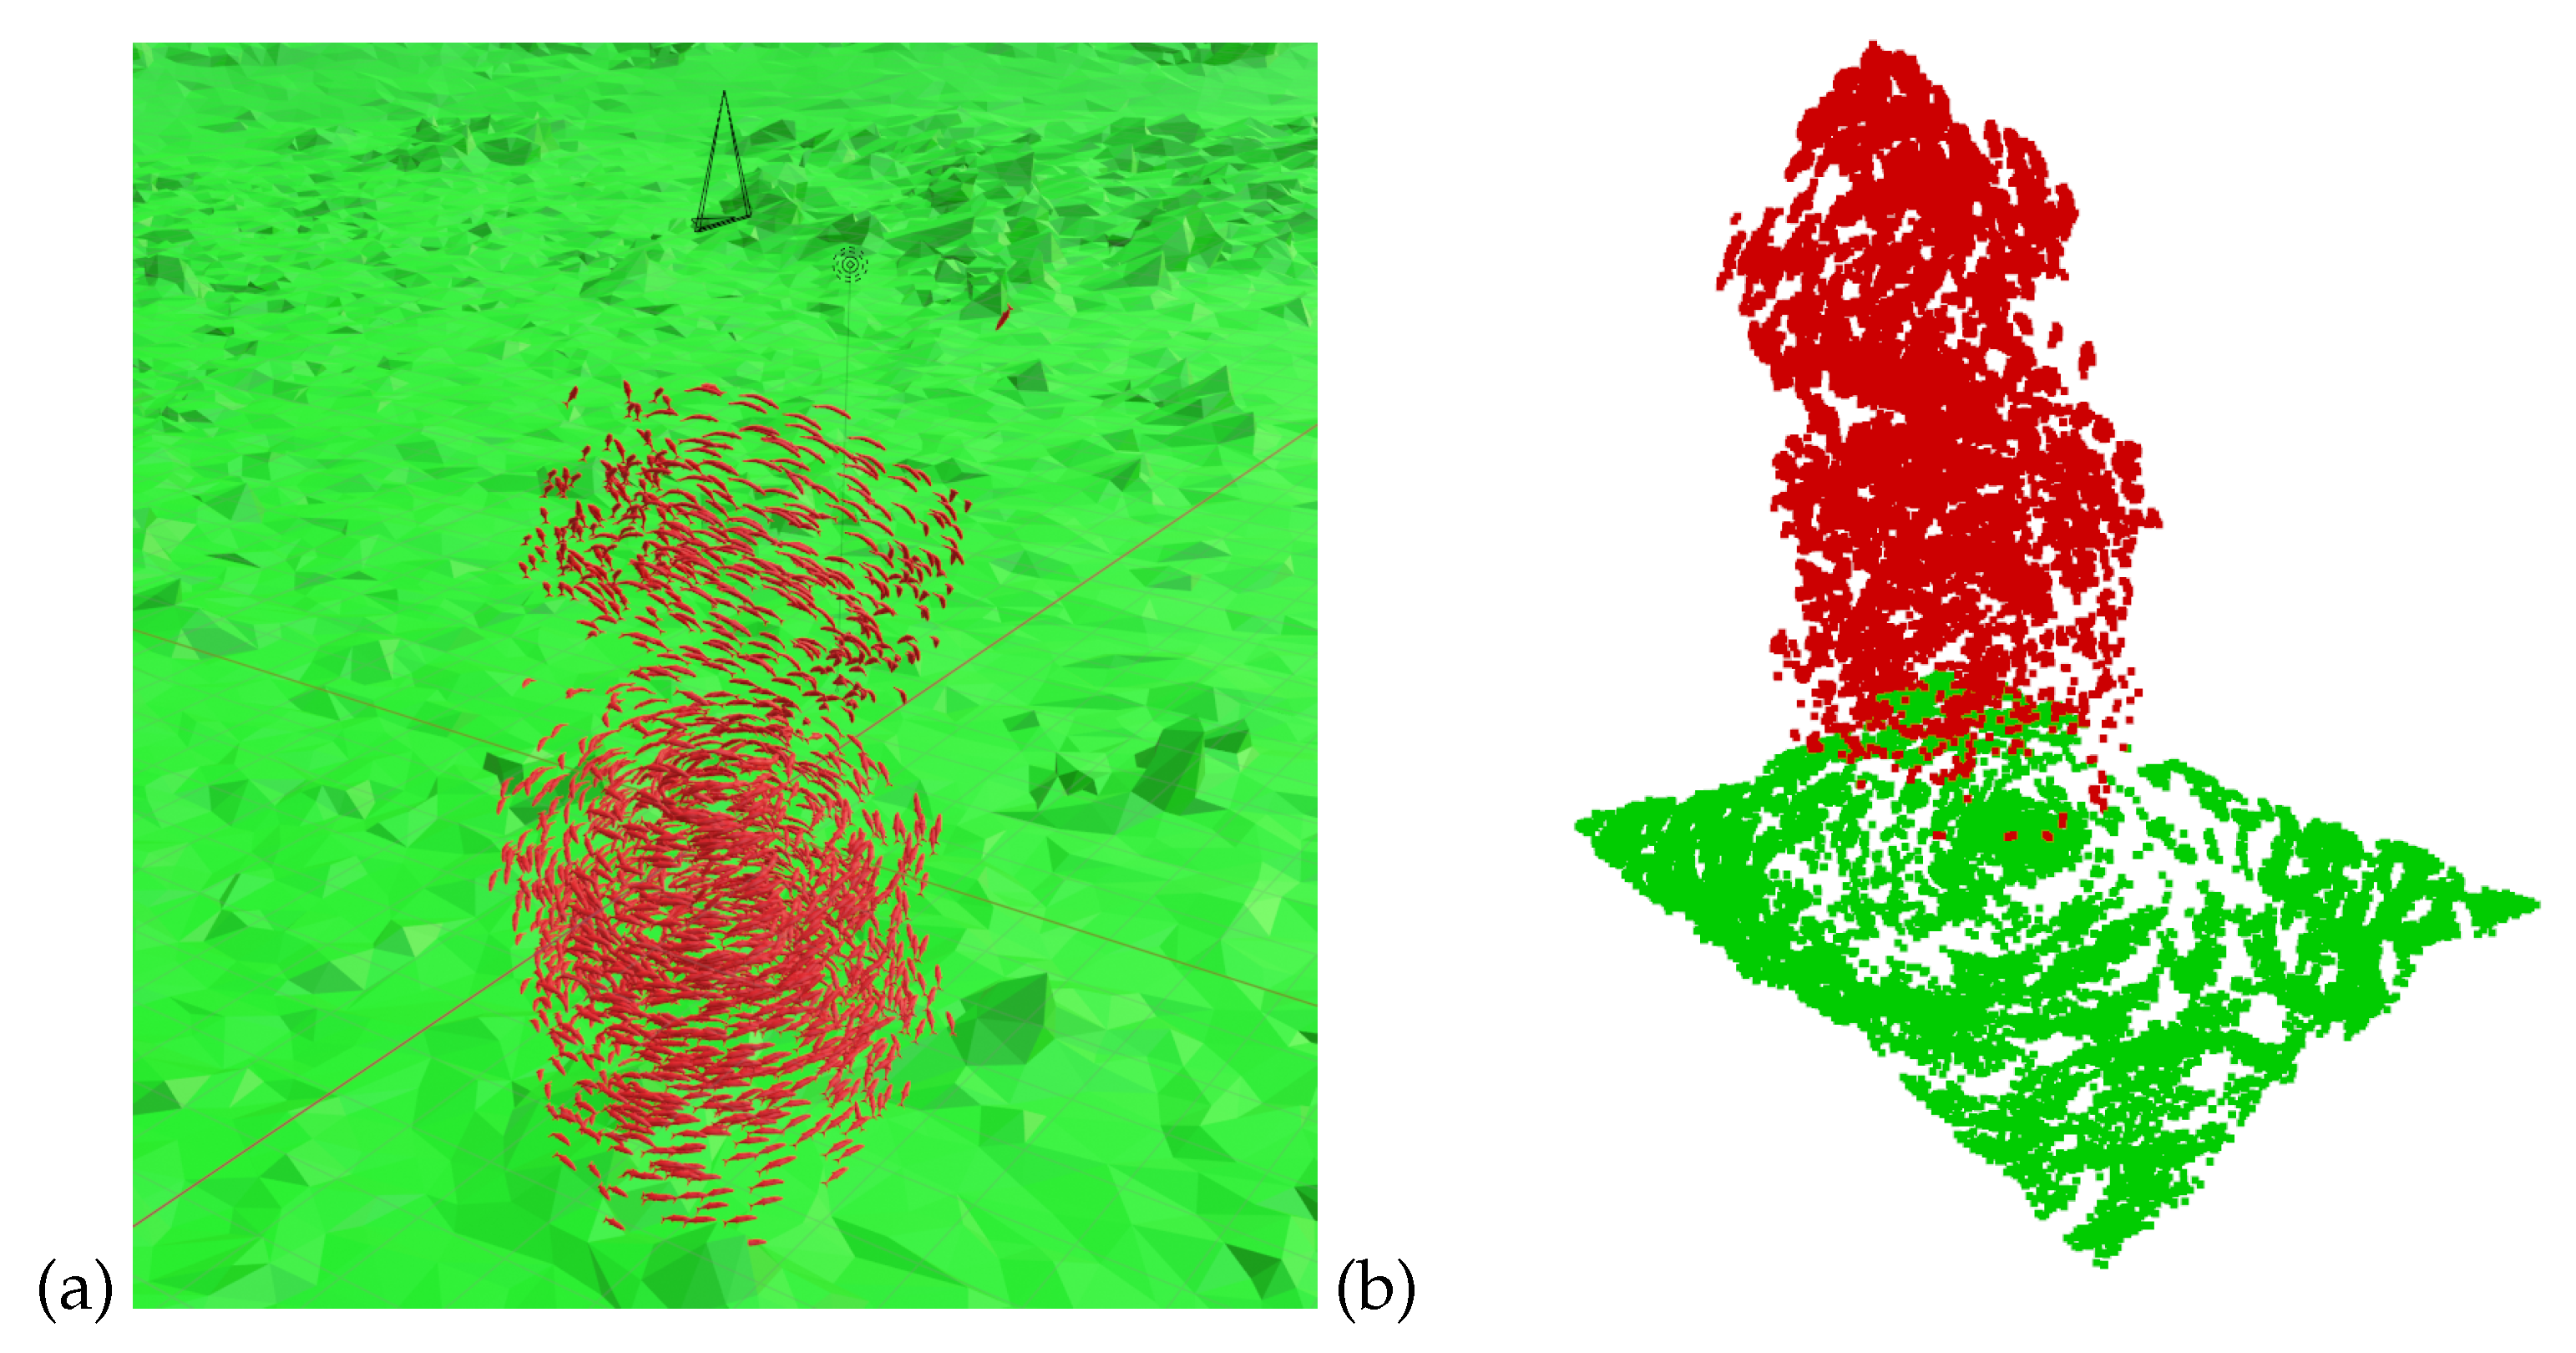
4.2. Synthetic Depth Sensing Data
4.2.1. Static Underwater Body
4.2.2. Dynamic Underwater Scene Augmentation
4.3. Visualization with VR and AR Techniques
- 1.
- visualization of real acquired depth sensing data by sonar sensors on real water bodies.
- 2.
- assistance systems for robotic control by feedback to live measurement data.
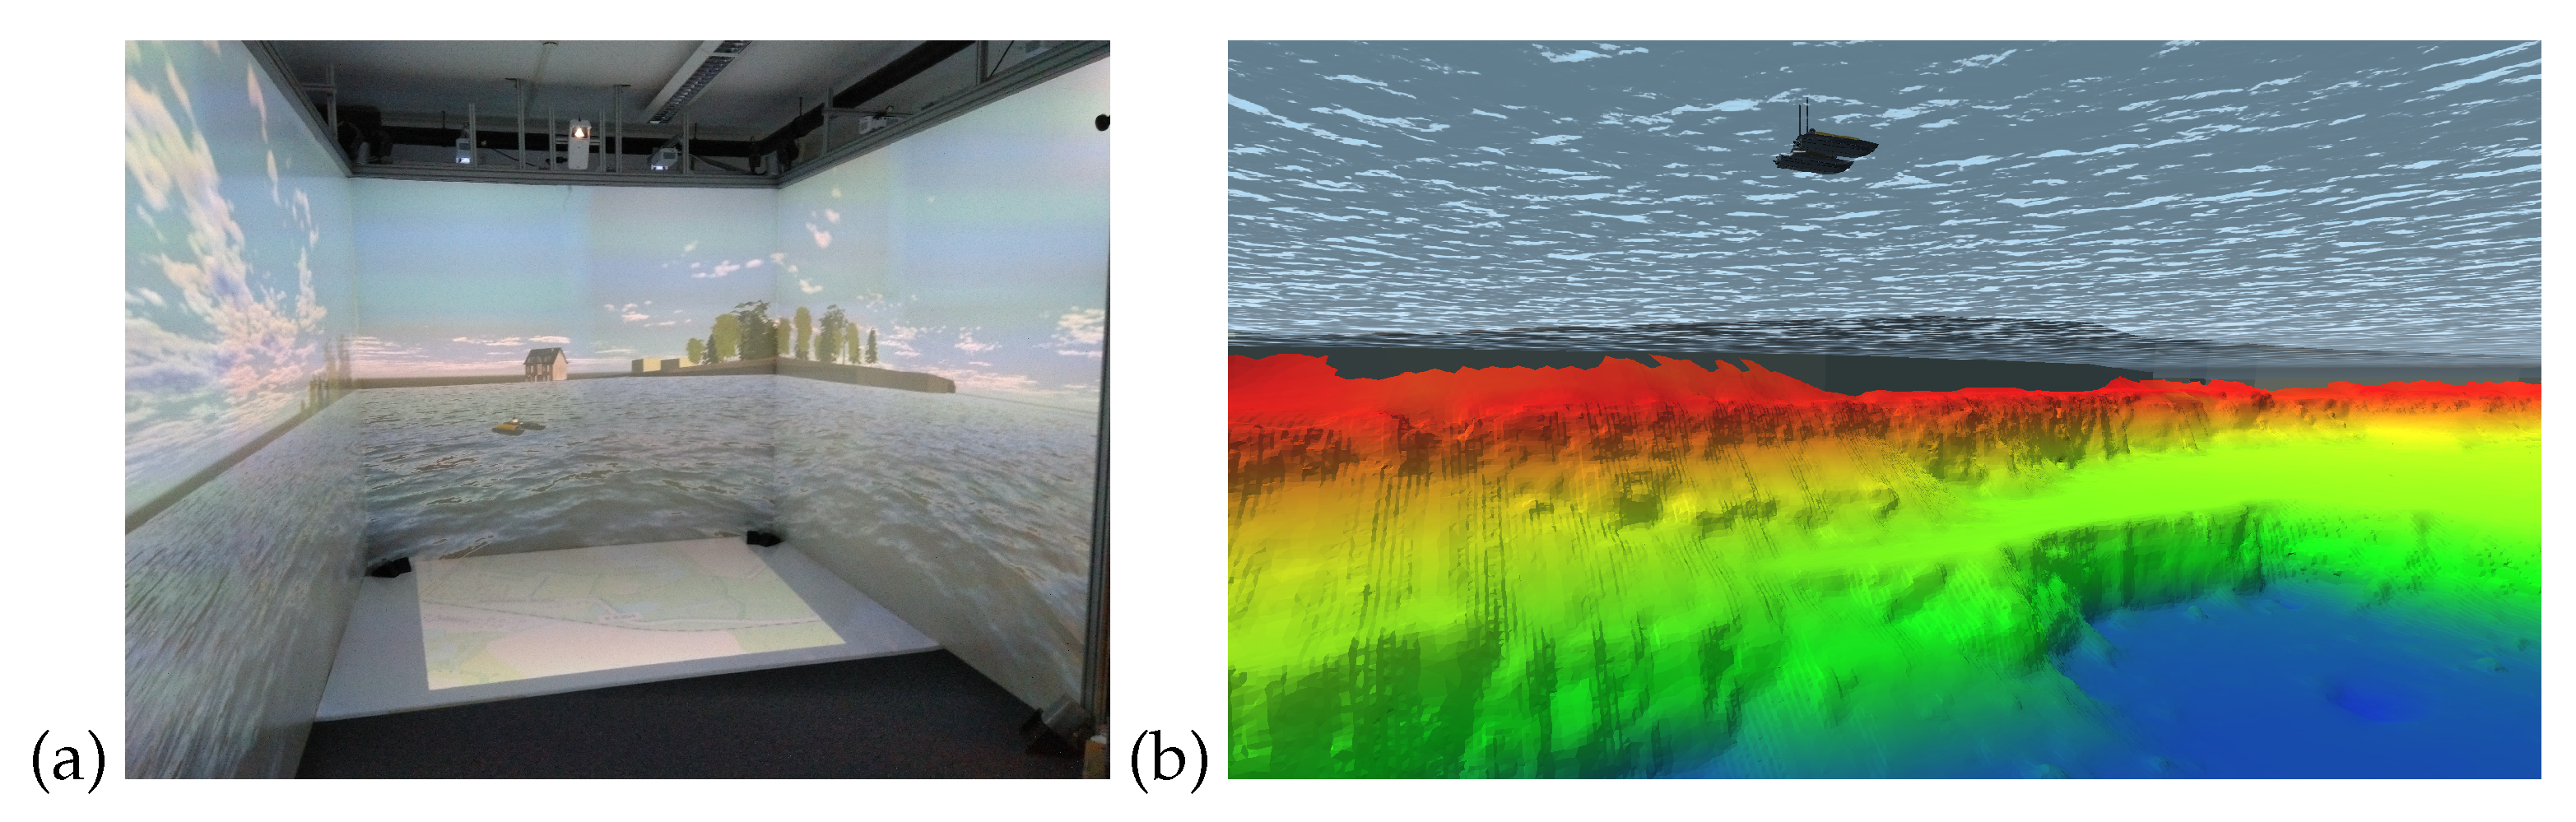
4.3.1. VR Indoor Visualization with a CAVE
4.3.2. AR Outdoor Visualization with Mobile Devices
- Sensed point cloud from real data from the sonar sensor system.
- Convert the point cloud to Potree format (https://github.com/potree/PotreeConverter, accessed on 28 January 2023), level-of-detail (LoD) representation of the point clouds possible.
- Build the scene in the Unity game engine and integrate the Potree point cloud as a dynamic point cloud set into the Unity scene.
- Load the output in the HL2 app.
- Register via the global positioning system (GPS).
5. Conclusions and Outlook
5.1. Conclusion and Discussion
5.2. Outlook
Author Contributions
Funding
Data Availability Statement
Conflicts of Interest
Glossary
| AI | artificial intelligence |
| AR | augmented reality |
| ASV | autonomous operation swimming vehicle |
| AUV | autonomous operation underwater vehicle |
| CAVE | cave automatic virtual environment |
| EPSG | European Petroleum Survey Group Geodesy |
| GNSS | global navigation satellite system |
| GPS | global positioning system |
| HL2 | Microsoft HoloLens 2 |
| LiDAR | light detection and ranging |
| LoD | level-of-detail |
| ML | machine learning |
| RoBiMo | robot-assisted freshwater monitoring |
| RUV | remote operation underwater vehicle |
| RSV | remote operation swimming vehicle |
| Sonar | sound navigation and ranging |
| TUBAF | Freiberg University of Mining and Technology |
| X-SITE | extreme definition of spatial immersion and interaction environment |
| VR | virtual reality |
References
- FAZ. Deutscher Wetterdienst Bestätigt neuen Hitzerekord von 42.6 Grad. 2019. Available online: https://www.faz.net/aktuell/gesellschaft/deutscher-wetterdienst-bestaetigt-neuen-hitzerekord-von-42-6-grad-16303898.html (accessed on 31 January 2022).
- European Commission. Water Framework Directive 2000/60/EC. Off. J. Eur. Communities 2000, L269, 1–15. [Google Scholar]
- DIN 38402-12:1985-06; Deutsche Norm. German Standard Methods for the Examination of Water, Waste Water and Sludge; General Information (Group A); Sampling from Barrages and Lakes (A 12). Deutsches Institut für Normung e.V.: Berlin, Germany, 1985. [CrossRef]
- Ziemińska-Stolarska, A.; Imbierowicz, M.; Jaskulski, M.; Szmidt, A.; Zbiciński, I. Continuous and periodic monitoring system of surface water quality of an impounding reservoir: Sulejow reservoir, Poland. Int. J. Environ. Res. Public Health 2019, 16, 301. [Google Scholar] [CrossRef] [PubMed]
- Schipek, M. Treatment of acid mine lakes–Lab and field studies. FOG Freib. Online Geosci. 2011, 29, 1–358. [Google Scholar]
- Oertel, C.; Matschullat, J.; Zurba, K.; Zimmermann, F.; Erasmi, S. Greenhouse gas emissions from soils—A review. Geochemistry 2016, 76, 327–352. [Google Scholar] [CrossRef]
- Marcé, R.; Obrador, B.; Gómez-Gener, L.; Catalán, N.; Koschorreck, M.; Arce, M.I.; Singer, G.; von Schiller, D. Emissions from dry inland waters are a blind spot in the global carbon cycle. Earth Sci. Rev. 2019, 188, 240–248. [Google Scholar] [CrossRef]
- Xiang, X.; Niu, Z.; Lapierre, L.; Zuo, M. Hybrid underwater robotic vehicles: The state-of-the-art and future trends. HKIE Trans. Hong Kong Inst. Eng. 2015, 22, 103–116. [Google Scholar] [CrossRef]
- DVW-Gesellschaft für Geodasie Geoinformation und Landmanagement. Hydrographie 2018–Trend zu Unbemannten Messsystemen; Wißner-Verlag: Augsburg, Germany, 2018; p. 241. [Google Scholar]
- Nakagawa, M. Point Cloud Clustering Using Panoramic Layered Range Image. In Recent Applications in Data Clustering; IntechOpen: London, UK, 2018. [Google Scholar] [CrossRef]
- Kisner, H.; Thomas, U. Segmentation of 3D Point Clouds using a New Spectral Clustering Algorithm without a-priori Knowledge. In Proceedings of the 13th International Joint Conference on Computer Vision, Imaging and Computer Graphics Theory and Applications, VISAPP, Funchal, Portugal, 27–29 January 2018; Volume 4, pp. 315–322. [Google Scholar] [CrossRef]
- Aggarwal, C.C.; Reddy, C.K. Data Clustering–lgorithms and Applications; CRC Press: Boca Raton, FL, USA, 2013. [Google Scholar]
- Reitmann, S.; Neumann, L.; Jung, B. Blainder—A blender ai add-on for generation of semantically labeled depth-sensing data. Sensors 2021, 21, 2144. [Google Scholar] [CrossRef] [PubMed]
- Qi, C.R.; Su, H.; Mo, K.; Guibas, L.J. PointNet: Deep Learning on Point Sets for 3D Classification and Segmentation. In Proceedings of the IEEE Conference on Computer Vision and Pattern Recognition, Las Vegas, NV, USA, 27–30 June 2016; pp. 652–660. [Google Scholar]
- Qi, C.R.; Yi, L.; Su, H.; Guibas, L.J. PointNet++: Deep Hierarchical Feature Learning on Point Sets in a Metric Space. Adv. Neural Inf. Process. Syst. 2017, 30. [Google Scholar] [CrossRef]
- Yi, L.; Kim, V.G.; Ceylan, D.; Shen, I.C.; Yan, M.; Su, H.; Lu, C.; Huang, Q.; Sheffer, A.; Guibas, L. A Scalable Active Framework for Region Annotation in 3D Shape Collections. ACM Trans. Graph. ToG 2016, 35, 1–12. [Google Scholar] [CrossRef]
- Agrafiotis, P.; Skarlatos, D.; Georgopoulos, A.; Karantzalos, K. Shallow water bathymetry mapping from UAV imagey based on machine learning. In Proceedings of the ISPRS Annals of the Photogrammetry, Remote Sensing and Spatial Information Sciences; Copernicus GmbH: Hannover, Germany, 2019; Volume 42, pp. 9–16. [Google Scholar] [CrossRef]
- Gibs, J.; Wilde, F.D.; Heckathorn, H.A. Use of Multiparameter Instruments for Routine Field Measurements (Ver. 1.1): U.S. Geological Survey Techniques of Water-Resources Investigations; Book 9, Chapter A6, Section 6.8; U.S. Geological Survey: Restan, VA, USA, 2007; Volume 1, pp. 1–48.
- Hofmann, H.; Ostendorp, W. Seeufer: Wellen–Erosion–Schutz–Renaturierung: Handlungsempfehlungen für den Gewässerschutz: Ergebnisse aus dem ReWaM-Verbundprojekt HyMoBioStrategie (2015–2018); KOPS Universität Konstanz: Konstanz, Germany, 2019. [Google Scholar]
- Degel, C. FactSheet HydroCrawler; Technical Report; Fraunhofer Institut für Biomedizinische Technik (IBMT) Joseph-von-Fraunhofer-Weg: Sulzbach, Germany, 2019. [Google Scholar]
- Müller, E.N.; Schaik, L.V.; Blume, T.; Bronstert, A.; Carus, J.; Fleckenstein, J.H.; Fohrer, N.; Gerke, H.H.; Graeff, T.; Hesse, C.; et al. Herausforderungen der ökohydrologischen Forschung in Deutschland. Hydrol. Wasserbewirtsch. 2014, 58, 221–240. [Google Scholar] [CrossRef]
- Krebs, P. FactSheet BOOT-Monitoring; Technical Report; Technische Universität Dresden: Dresden, Germany, 2019. [Google Scholar]
- Wehmeyer, D. FactSheet RiverBoat; Technical Report; Forschungsinstitut für Wasser-und Abfallwirtschaft an der RWTH Aachen (FiW) e. V. Kackertstr: Aachen, Germany, 2019. [Google Scholar]
- Kapetanović, N.; Vasilijević, A.; Nađ, Đ.; Zubčić, K.; Mišković, N. Marine robots mapping the present and the past: Unraveling the secrets of the deep. Remote Sens. 2020, 12, 3902. [Google Scholar] [CrossRef]
- Gangelhoff, J.; Werner, C.S.; Reiterer, A. Compact, large aperture 2D deflection optic for LiDAR underwater applications. SPIE Int. Soc. Opt. Eng. 2022, 12263, 5. [Google Scholar] [CrossRef]
- Dun, M.; Grinham, A. Experimental evaluation of an Autonomous Surface Vehicle for water quality and greenhouse gas emission monitoring. In Proceedings of the 2010 IEEE International Conference on Robotics and Automation, Anchorage, AK, USA, 3–7 May 2010; pp. 5268–5274. [Google Scholar] [CrossRef]
- Robotic Subsea Exploration Technologies | ROBUST Project | Fact Sheet | H2020; CORDIS European Commission: Brüssel, Belgium, 2020. [CrossRef]
- Edson, E.C.; Patterson, M.R. MantaRay: A novel autonomous sampling instrument for in situ measurements of environmental microplastic particle concentrations. In Proceedings of the OCEANS 2015–MTS/IEEE Washington; Institute of Electrical and Electronics Engineers Inc.: New York, NY, USA, 2016. [Google Scholar] [CrossRef]
- Mills, G.; Fones, G. A review of in situ/IT methods and sensors for monitoring the marine environment. Sens. Rev. 2012, 32, 17–28. [Google Scholar] [CrossRef]
- Polonschii, C.; Gheorghiu, E. A Multitiered Approach for Monitoring Water Quality. In Proceedings of the Energy Procedia; Elsevier: Amsterdam, The Netherlands, 2017; Volume 112, pp. 510–518. [Google Scholar] [CrossRef]
- Miles, E.J. Guidelines Shallow Water Quality Monitoring Continuous Monitoring Station: Selection, Assembly & Construction; Technical Report; Virginia Institute of Marine Science: Gloucester Point, VA, USA, 2009. [Google Scholar] [CrossRef]
- Reitmann, S.; Jung, B. Generating Synthetic Labeled Data of Animated Fish Swarms in 3D Worlds with Particle Systems and Virtual Sound Wave Sensors; Springer International Publishing: Berlin/Heidelberg, Germany, 2022. [Google Scholar]
- Dreier, O.; Güth, F.; Joseph, Y. P4.7–Multiparameter-Messkette für tiefenaufgelöste Gewässerüberwachung. In Proceedings of the Poster; AMA Service GmbH: Wunstorf, Germany, 2021; pp. 203–207. [Google Scholar] [CrossRef]
- Schwarzak, S.; Hänsel, S.; Matschullat, J. Projected changes in extreme precipitation characteristics for Central Eastern Germany (21st century, model-based analysis). Int. J. Climatol. 2015, 35, 2724–2734. [Google Scholar] [CrossRef]
- Jarosch, L.; Pose, S.; Reitmann, S.; Dreier, O.; Licht, G.; Röder, E. Roboter für das Wasser der Zukunft. WWT Wasserwirtsch. Wassertech. 2020, 66–69. [Google Scholar]
- Scientific Diving Center TU Bergakademie Freiberg. Training of Scientific Divers | TU Bergakademie Freiberg; Scientific Diving Center TU Bergakademie Freiberg: Freiberg, Germany, 2021. [Google Scholar]
- Pose, S.; Reitmann, S.; Licht, G.; Grab, T.; Fieback, T. RoBiMo—The tasks of scientific divers for robot-assisted fresh-water monitoring. Freib. Online Geosci. Spec. Vol. Proc. 6th Eur. Conf. Sci. Diving 2021, 58, 32–38. [Google Scholar]
- Agisoft. AgiSoft Metashape Professional (Version 1.7.4) (Software). 2021. Available online: https://www.agisoft.com/ (accessed on 28 January 2023).
- QPS. Qinsy 9. 2022. Available online: https://www.qps.nl/qinsy/# (accessed on 28 January 2023).
- Reitmann, S.; Kudryashova, E.V.; Jung, B.; Reitmann, V. Classification of Point Clouds with Neural Networks and Continuum-Type Memories. In Proceedings of the IFIP International Conference on Artificial Intelligence Applications and Innovations; Springer: Berlin/Heidelberg, Germany, 2021; pp. 505–517. [Google Scholar]
- Richter, F.; Reitmann, S.; Jung, B. Integration of Open Geodata into Virtual Worlds. In Proceedings of the 6th International Conference on Virtual and Augmented Reality Simulations, ICVARS ’22; Association for Computing Machinery: New York, NY, USA, 2022; pp. 9–13. [Google Scholar] [CrossRef]
- Kersten, T.P.; Wolf, J.T.; Lindstaedt, M. Genauigkeitsuntersuchungen des UAV-Systems DJI Matrice 300 RTK mit den Sensoren P1 und L1 im Hamburger Testfeld. In Beitrag Oldenburger 3D-Tage; Wichmann: Berlin, Germany, 2022; pp. 298–313. [Google Scholar]
- Akkaynak, D.; Treibitz, T. Sea-THRU: A method for removing water from underwater images. In Proceedings of the IEEE Computer Society Conference on Computer Vision and Pattern Recognition, Long Beach, CA, USA, 16–20 June 2019; Volume 2019, pp. 1682–1691. [Google Scholar] [CrossRef]
- Shortis, M. Camera Calibration Techniques for Accurate Measurement Underwater; Springer Nature Switzerland AG: Cham, Switzerland, 2019; pp. 11–27. [Google Scholar] [CrossRef]


| Project | HyMoBio [19,20] | BOOT-Monitoring [21,22] | River-View [9,23] | RoBiMo |
|---|---|---|---|---|
| Drive/path planning | Autonomous with four rotatable drives along a grid | No own driveNo path planning | Remote-controlled or autonomous using a pre-programmed route | Autonomous catamaran with two impeller engines |
| Measured water parameter |
|
|
|
|
| Water parameter resolution | Area or profile measurement with a multi-parameter probe. | Surface measurement by ion-selective probes, multi-parameter probes, photometry, spectroscopy, light sensor. | Surface measurement using a multi-parameter probe. | Area measurement with continuous depths profiles with 10 steps during the motion. |
| Underground detection |
|
|
|
|
Disclaimer/Publisher’s Note: The statements, opinions and data contained in all publications are solely those of the individual author(s) and contributor(s) and not of MDPI and/or the editor(s). MDPI and/or the editor(s) disclaim responsibility for any injury to people or property resulting from any ideas, methods, instructions or products referred to in the content. |
© 2023 by the authors. Licensee MDPI, Basel, Switzerland. This article is an open access article distributed under the terms and conditions of the Creative Commons Attribution (CC BY) license (https://creativecommons.org/licenses/by/4.0/).
Share and Cite
Pose, S.; Reitmann, S.; Licht, G.J.; Grab, T.; Fieback, T. AI-Prepared Autonomous Freshwater Monitoring and Sea Ground Detection by an Autonomous Surface Vehicle. Remote Sens. 2023, 15, 860. https://doi.org/10.3390/rs15030860
Pose S, Reitmann S, Licht GJ, Grab T, Fieback T. AI-Prepared Autonomous Freshwater Monitoring and Sea Ground Detection by an Autonomous Surface Vehicle. Remote Sensing. 2023; 15(3):860. https://doi.org/10.3390/rs15030860
Chicago/Turabian StylePose, Sebastian, Stefan Reitmann, Gero Jörn Licht, Thomas Grab, and Tobias Fieback. 2023. "AI-Prepared Autonomous Freshwater Monitoring and Sea Ground Detection by an Autonomous Surface Vehicle" Remote Sensing 15, no. 3: 860. https://doi.org/10.3390/rs15030860
APA StylePose, S., Reitmann, S., Licht, G. J., Grab, T., & Fieback, T. (2023). AI-Prepared Autonomous Freshwater Monitoring and Sea Ground Detection by an Autonomous Surface Vehicle. Remote Sensing, 15(3), 860. https://doi.org/10.3390/rs15030860