Abstract
The sustainable development goals “Good health and well-being” and “Sustainable cities and communities” of the United Nations and World Health Organization, alert governments and researchers and raise awareness about road safety problems and the need to mitigate them. In Portugal, after the economic crisis of 2008–2013, a significant amount of road assets demand investment in maintenance and rehabilitation. The areas where these actions take place are called work zones. Considering the particularities of these areas, the proposed work aims to identify the main factors that impact the occurrence of work zones crashes. It uses the statistical technique of multinomial logistic regression, applied to official data on road crashes occurred in mainland Portugal, during the period of 2010–2015. Usually, multinomial logistic regression models are developed for crash and injury severity. In this work, the feasibility of developing predictive models for crash nature (collision, run off road and running over pedestrians) and for type of person involved in the crash (driver, passenger and pedestrian), considering only one covariate (the number of persons involved in the crash), was studied. For the two predictive models obtained, the variables road environment (urban/rural), horizontal geometric design (straight/curve), pavement grip conditions (good/bad), heavy vehicle involvement, and injury severity (fatalities, serious and slightly injuries), were identified as the preponderant factors in a universe of 230 investigated variables. Results point to an increase of work zone crash probability due to driver actions such as running straight and excessive speed for the prevailing conditions.
1. Introduction
1.1. Framework and Objectives
Road crashes are considered worldwide as a public health problem [1,2,3,4,5]. According to the World Health Organization (WHO), in 2019, road injuries represented the seventh cause of death in low-income countries and the tenth cause in lower-middle and upper-middle income countries [6]. This problem is also a concern addressed by the United Nations (UN). In its “2030 Agenda for Sustainable Development” [2] it is possible highlight two sustainable development objectives that are relevant in the context of road safety:
Goal 3—Ensure healthy lives and promote well-being for all at all ages: By 2020, halve global road fatalities and injuries.
Goal 11—Make cities and human settlements inclusive, safe, resilient, and sustainable: By 2030, provide access to safe, affordable, accessible, and sustainable transport systems for all, improving road safety notably by expanding public transport, with special attention to the needs of those in vulnerable situations (women, children, persons with disabilities and elders).
For the case of most developed countries, where planned national road networks are practically completed (built), the next step in the road management process involves the maintenance and rehabilitation of these networks. Therefore, an increase in the need for intervention on road networks is expected, along with an increase in the importance and study of issues related to work zones (WZ) safety. In these areas, when compared to nonwork zone scenarios, it is expected a higher probability of fatal and injury crashes, as well as an increase in crash frequency [7,8,9,10,11,12].
Considering the proven feasibility of using binary and probit logistic regression techniques with the information collected in the Portuguese police crash report [13], and the use of the multinomial logistic regression almost exclusively to establish crash and injury severity models, the main goal of the study is to verify the feasibility of identifying main factors that contribute to Portuguese WZ crashes. The multinomial logistic regression approach will be used in order to establish predictive models for crash nature (collision, run off road and running over pedestrians) and type of person involved (driver, passenger and pedestrian), considering one covariate (the number of persons involved in the crash).
The structure of the paper is organized into four sections. In the Introduction, the framework and scope of the work, as well as a literature review on road WZ crash data analysis using logistic regression or similar techniques, are presented. The modeling approach adopted in the multinomial logistic regression application is described in the Method section. The Models and discussion section is dedicated to the analysis of the Portuguese WZ crash data and discussion of results. Finally, the main findings, limitations and future work directions are summarized in Conclusions.
1.2. Literature Review
Taking into account the particularities of work zone areas, several authors have focused their research on the identification of factors that impact the occurrence of WZ crashes and injury severity level using logistic and probit regression approaches or other similar methodologies [9,10,12,13,14,15,16,17,18,19,20,21,22,23,24,25,26,27,28,29,30,31]. Next, it is presented a description of the research conducted and main finding of 16 of these studies.
Khattal et al. [14,15] considered the ordinal categorical nature of North Carolina (USA) work zone data in the elaboration of ordered probit models for the analysis of injury severity, as well as linear regression models for the analysis of the crash total harm (combine effect of both frequency and severity of injuries). The sample of the study focused on the WZ crashes occurred in the year 2000 (3383 WZ crashes), especially in the ones involving heavy vehicles. The study showed that collisions involving heavy vehicles happened more frequently when WZ activities were carried out while no traffic control device was in place and that multivehicle crashes involving this type of vehicle were more injurious when compared to non-work zone crashes.
The study carried out by Qi et al. [16] focused on 1994–2001 data from rear-end collisions occurred in WZ located in the state of New York, USA. In the study, ordered probit models were developed to analyze crash severity and to recommend measures for the reduction of the frequency of rear-end crashes. The study concluded that, at the time, the NYSDOT’s crash database system was the most comprehensive in use in the USA, especially regarding WZ data collection practices. As an inference, the model provided some actions that can be adopted to reduce the WZ crash frequency, namely: the installation of bands that alert drivers of the WZ proximity through sound vibrations, speed displays and the use of drone radar as a warning measure for law enforcement. It was also concluded that the WZ frequency and crash severity are correlated with the construction or maintenance phase of the work, the population density and the territorial area occupied.
Li & Bai [17,18,25] resorted to statistical techniques such as Pearson’s chi-square, chi-square likelihood ratio probability and logistic regression, to study the characteristics of Kansas’s (USA) highway WZ fatal and injury crashes, between 1992 and 2004 (157 fatal crashes and 4443 injury crashes). The study focused on the role that human factors play in WZ crash occurrence, aiming to reduce the likelihood of their occurrence by promoting education campaigns, research, and the effective use of temporary traffic control devices. The study identified several human behaviors as contributing factors to WZ crashes, such as disrespect for the safety distance, traffic signs, road markings, speed limits, as well as driving under the influence of alcohol. The authors also found that for fatal crashes, head-on was the dominant type of crash, and that the involvement of trucks, unfavorable light conditions and complicated road geometries contributed to a larger percentage of crashes. On the other hand, most injury crashes involved light-duty vehicles only and rear-end was the dominant injury crash type.
The Southeast Michigan (USA) work zone crash data was utilized by Meng et al. [12] to calibrate a probabilistic quantitative risk assessment model. The database contained 89 fatal, 10,142 injury and 35,036 property damage only crashes. The authors modeled the records of the crashes occurred between 1999 and 2008 in long-term WZ (>3 days) using the Monte Carlo technique and statistical techniques such as the chi-square. To obtain the casualty risk, the model combines an estimation of the WZ crash frequency by regression model, an event tree for crash scenario determination and consequence estimation models for scenarios in the event tree. The probability of fatal or injured victims is measured by taking the individual risk for driver and passenger categories. Societal risk is represented by the relationship between the frequency and total number of casualties caused by vehicle crash. The study showed that slowing down speed was found to be more effective in mitigating individual fatality and injury risks than reducing the emergency medical service response time.
In 2011, the analysis performed by Elghamrawy [19] included the available data and reports on work zone crashes occurred in the state of Illinois (USA), during the period of 1996–2005. Crash severity indices for serious injury, multi-vehicle, and multi-injury crashes were developed using the logistic regression method (ordered). The research also aimed to carry out field experiments, in order to evaluate the effectiveness of temporary rumble strips placed prior and at the edge of work zones, investigating and quantifying their effect on the most inattentive drivers. The results obtained showed that the WZ speed limit, type of barrier, length and the works’ start time were significant variables that directly influenced the occurrence of this type of crashes. Still, the combination of free-flow speed, respect for the established speed limit and type of construction or rehabilitation activity, influenced the crash type.
Yang et al. [20] proposed an approach for crash frequency estimation that involves the use of a measurement error (ME) model (applied to work zone length) integrated with the traditional negative binomial (NB) model. The aim was to identify risk factors in work zone safety evaluation. A dataset of 60 work zones in New Jersey (USA), for the period from 2004 to 2010, obtained from the NJDOT crash database, was used to estimate the models. Results suggest that both work zone length and traffic volume are positively associated with crash occurrence in WZ, and that variations in WZ speed can result in an increase of crashes.
Later, in a state-of-the-art review, Yang et al. [10] considered 82 WZ research papers, from January 1962 to July 2013, taking into account the point of view of WZ crash data analysis and safety modelling. The main contributing factors identified in the selected studies were crash classification (total number of crashes occurred during the construction period, divided by the distance traveled (km) by the vehicle in the construction area), crash severity, posted speed limit, annual average daily traffic, driver and vehicle characteristics, type of occurrence, location, contributing circumstances and actions and maneuvers preceding the crash. The authors also found that the multicollinearity between the variables is hardly addressed and that the variables and contributing factors are essentially selected through syntheses based on the information contained in the statistical bulletins, instead of adopting an analytical approach of how such variables and their respective groupings should be selected. The analysis indicated that there are significant gaps in understanding the relationship between injury severity and possible risk factors and that few studies have explored the actual level of injury recorded in hospital patient reports. Failure to report all WZ crashes and to collect WZ detailed information was also identified.
Osman et al. [21] undertook an extensive empirical analysis of the different types of injury severity models developed for WZ crashes involving large heavy vehicles. The authors used the statistical techniques of multinomial logit, nested logit, ordered logit, and generalized ordered logit to develop WZ crash models. The database used consisted of WZ crashes occurred in the state of Minnesota (USA) between 2003 and 2012. The authors concluded that the generalized ordered logit model provided superior data fit when compared to all the other models. The contributing factors that increased the risk of serious injuries in WZ crashes involving large heavy vehicles were crash occurrence during daylight, no access control, closure of one or more traffic lanes, failures in WZ transition areas, presence of workers on the road, higher speed limits, poor pavement grip conditions and crash occurrence on main arteries.
In 2018, the authors published a new study in which different types of WZ configurations adopted in the state of Minnesota were analyzed for crashes occurred in the same period of the research published in 2016 (14,351 crashes involving at least one passenger car) [22]. The analysis employed ordered and disordered probit models, in order to obtain an analytical injury severity model as a function of different WZ configurations (lane closure, lane change, intersections, roadside works and intermittent or moving activity, among others). It was found that 85% of fatal WZ victims were drivers and passengers of light vehicles, and that heavy vehicle involvement influenced the level of severity of the injury. It was also identified that the adoption of temporary traffic control plans is the solution that best adapts to each type of activity. Partial access control, rural road environment, night-time, weekends, and horizontal curves, were identified as factors that increase the probability of serious injuries. For variations across WZ configurations, significant differences in the effects of the following factors were observed: access-control, number of lanes, road class and surface condition, speed limit, WZ area, presence of workers, time-of-day, number of vehicles involved, and truck involvement.
In Portugal, several studies that focused on the application of logistic and probit regression techniques to WZ crash data obtained from the Police crash reports were performed [13,30,31]. The official 2013–2015 WZ crash data (1767 work zone crashes) was used in [13] to assess the feasibility of applying binary and probit logistic regression techniques to identify the main factors contributing to WZ crashes. The authors developed 11 binary and probit logistic regression models (for pedestrian, angle, rear-end and run-off-road crashes; for unexpected obstacle, excessive speed, disregards for vertical signs and disregard for safety distance; and for youth, adult and senior age groups), concluding that it was possible to identify risk factors and that the obtained estimated coefficients and goodness-of-fit test values were very similar for both logit and probit link functions. The modeling results pointed to excessive speed, disregard for vertical signs, luminosity, intersections, and motorcycle and heavy vehicle involvement as the most significant risk factors. As mentioned by [10,22], the study also concluded that it is necessary to collect additional information to allow for more complex analyses, more representative results, and to determine a measurement of crash exposure.
Finally, Ashqar et al. [26] identified and quantified the impact of risk factors that can lead to high-severity injury and/or fatal WZ crashes. For this purpose, the authors analyzed a set of 379 severe crashes that occurred in work zones along highway I-94 (state of Michigan, USA, 2016) using frequency analyses, logistic regression and machine learning Random Forest algorithm. Mechanisms for the improvement of WZ traffic control, lighting conditions and public education programs aimed at high-risk drivers were some of the directions pointed out by the study results to reduce risk in those areas. According to the authors, when compared to logistic regression, the Random Forest has the advantage of producing meaningful results, even for a small sample size.
Table 1 and Table 2 present a summary of the methods, scope and variables adopted in the presented studies.

Table 1.
Summary of work zones crashes studies using logistic regression approaches and other similar methodologies.
Table 2.
Summary of studies and explanatory variables adopted in logistic regression approaches and other similar methodologies applied to road work zones crashes analysis.
Most studies have been developed in the USA and the majority point out that crash data constitutes the raw material necessary to assist decision-making regarding the implementation of road safety measures in WZ. However, there are still challenges related to the collection, storage, integration of various sources of information and provision of complete databases that adequately support research and investment [10,13,26,32].
As can be seen in Table 2, the degree of the information detail varies across studies and can influence the statistical technique adopted in the analysis. Despite the different studies approaches, the data related to road environment conditions, such as luminosity and weather, road geometry, road environment (rural/urban), speed limit, number and type of vehicles involved in the crash, WZ traffic control device/type, heavy vehicle involvement and crash severity, are those normally considered, being also those that are generally collected in police crash reports [13].
Studies are essentially focused on analyzing the crash or injury severity, the involvement of a specific vehicle type, usually heavy vehicles, and a specific crash type, such as rear-end crashes. Regarding the methods adopted, logistic regression is often the preferred one, since it allows a better understanding of the risk factors and of how they can increase the probability of occurrence of the dependent variable under study. This is mainly due to the easy interpretation of odd ratios. However, approaches that use machine learning techniques are being increasingly used, especially to obtain meaningful results for small sample sizes.
To conclude, all works refer that the main benefit of WZ crash studies is that they are fundamental elements for guiding intervention strategies and defining appropriate measures that aim to minimize the occurrence of WZ crashes.
2. Method
The regression technique selection and data processing operations considered the aim of investigating the possibility of modelling the nature and type of person involved in crashes occurred in Portuguese road WZ. Data from police crash reports, made available by the Portuguese National Road Safety Authority, was used as input in the modelling process.
2.1. Multinomial Logistic Regression
Regression techniques can be defined as a set of statistical and probabilistic approaches, usually used for data analysis of different natures, from which the relationship between the behaviour of a given phenomenon and one or more potentially predictive variables is investigated [33,34]. This process may or may not result in a cause-and-effect relationship [35].
In the present study, the phenomena to be modelled are the crash nature, considering the categories collision (code 0), run-off-road (code 1) and running over pedestrians (code 2); and the type of person involved in the crash, with pedestrian (code 0), passenger (code 1) and driver (code 2) categories. These phenomena are translated by polychotomous nominal qualitative variables (they present more than two mutually exclusive categories) and, therefore, the regression technique to be adopted must be a categorical regression, in this case, a multinomial logistic regression [34,35]. Multinomial regression is defined as a generalized linear model used to estimate probabilities for the m categories of a qualitative dependent variable Y, using a set of explanatory variables X [34,35,36]. In multinomial regression, one of the categories of the dependent variable must be chosen as a reference, in order to compare it with the remaining categories considered. This choice may or may not be arbitrary, depending on the orientation of the study. However, it is relevant to note that this does not change the model, it only changes the way of interpreting the data [37,38].
Therefore, if the dependent variable that represents the phenomenon under study presents 3 response categories (m = 3), as considered in this study, coded with ‘0’, ‘1’ and ‘2’, the number of equations of the estimated logit model will be (m − 1). To normalize the system relative to a category of the dependent variable, the logistic regression coefficient vector β of the response category considered as reference is set equal to 0 (for example β0 = 0). Thus, the probability P of the dependent variable Y taking the value of each of the 3 categories is given by expressions (1) to (3) [33], the chances (Odds) of each of the categories of Y relative to the reference category 0 is given by the expressions (4) and (5), and the expressions (6) and (7) establish the logit model.
where:
- Y is the qualitative dependent variable for a model where the response variable assumes m response categories (for this case m = 3, with codes 0, 1 and 2).
- X is the matrix of independent variables (explanatory variables).
- β0, β1 and β2 are the logistic regression coefficient vectors for the response category m.
The model is adjusted using the maximum likelihood method. The significance of the adjusted model is assessed using the likelihood ratio test (LRT). The LRT compares the goodness of fit of two models based on the ratio of their likelihoods. In this case, the likelihood of the reduced model (intercept only) was compared with the likelihood of the full model (with all variables) [35]. The goodness of fit measures adopted were the Pseudo-R2 of Cox & Snell, Nagelkerke and McFadden. It was not possible to find in the literature a strong guidance on how Pseudo-R2 measures should be interpreted [39,40]. These measures are more useful when comparing competing models obtained for the same data (the model with the largest pseudo-R2 statistic is the best). However, in Hensher and Stopher [41], McFadden himself states that a McFadden pseudo-R2 between 0.2 and 0.4 indicates a very good model fit.
The significance of the model coefficients was assessed with the Wald test and the area under the receiver operating characteristic curve (ROC), that ranges from 0 to 1, was used to measure the model’s ability to discriminate whether a specific condition is present or not. According to Hosmer and Lemeshow [33], for an area under the ROC (AUC) of 0.5, it is considered that the model does not have discriminant ability; for 0.5 < AUC < 0.7 the discrimination is weak; for 0.7 ≤ AUC < 0.8 it is acceptable; for 0.8 ≤ AUC < 0.9 it is good; and for AUC ≥ 0.9 the discrimination is exceptional.
Unlike what happens with other statistical data analysis procedures, in multinomial logistic regression, special attention is given to the sample size, especially for cases in which the explanatory variables present characteristics close to collinearity. This care is justified for very small samples with highly correlated variables, such as the number of fatal victims, since they can lead to erroneous or unreliable inferences based on the regression model obtained [26,32]. General guidelines recommend that maximum likelihood estimation, including logistic regression, must consider at least 100 cases. They also state that 500 cases are adequate in most applications, and that there should be at least 10 cases per predictor [42].
For diagnoses of the correlation between explanatory variables, the determination of Tolerance and VIF (Variance Inflation Factor) was adopted. According to Hoffman, Miles and Sze et al. [43,44,45], the closer the tolerance and VIF values are to 1, the lower the multicollinearity will be. Generally, VIF values above 4 or tolerance below 0.25 indicate that multicollinearity may exist. Still, to select variables with predictive power, the Forward Stepwise selection method was used. This method starts with a model that only includes the intercept, and it adds, at each step, the variable (predictor) that causes the largest statistically significant change in −2 Log Likelihood to the model. The final (best) model will be the one that only includes important predictors [33,35,46].
The procedure described and adopted in the analysis was performed using the software IBM SPSS®—Statistical Package for the Social Sciences, version 25.0 [47].
2.2. Data Processing
Efficient safety management needs a significant amount of data regarding the conditions under which crashes occur. The quantity and quality of the recorded data is essential to identify crash contributing factors and to properly diagnose safety conditions, allowing the detection of current and future safety needs, the definition of safety measures and the prediction of strategies’ effects over time.
To allow a valid and meaningful analysis of the road WZ crash phenomenon, the preparation of information started with the processing and organization of the 2010–2015 data provided by the Portuguese National Road Safety Authority (ANSR), originally spread over 3 related databases, in a single database of WZ crashes occurred in mainland Portugal.
In the Portuguese Police Crash Report [48], WZ crashes are record in section “B4—Pavement”. This section consists of four fields that aim to describe the pavement type (B4.1), its state of conservation (B4.2), the presence of obstacles on the pavement or roadworks (B4.3), and the pavement grip condition (B4.4). In this way, the reporting of WZ crashes is carried out along with crashes due to obstacles on the pavement by selecting one of the following B4.3 filling options: ‘Non-existent’, ‘Unsigned’, ‘Insufficiently signed’, and ‘Correctly signed’.
For the present study, ANSR provided three distinct databases for crashes with at least one victim and field B4.3 coded as ‘Unsigned’, ‘Insufficiently signed’, Correctly signed’ and ‘Undefined’: a database with information about vehicles and drivers involved in the crash, also including general information (location, date/time, nature, road environment conditions and characteristics); a database with information about injured passengers; and a database with information on injured pedestrians. The databases were related to each other through the crash identification number.
Decisions taken throughout the data preparation process were based on the recommendations and procedures adopted by [18,20,22,49,50,51]. In these studies, authors concluded that a significant part of WZ crashes is not reported, and that among those that are reported, some exhibit incomplete or incorrect crash report completion. The analysis of the Portuguese data showed that there is a significant percentage of reports with no information in the field B4.3, which does not allow concluding whether the crash occurred in a WZ or not. This fact can distort the real WZ crashes scenario, generating ambivalence in the validation of parameters, variables and models, which may result in erroneous conclusions. However, over the years, there has been a progressive decrease of non-completion cases, which makes it possible to envisage more representative future analyses (38% in 2010, 24% in 2011, 11% in 2012, 10% in 2013, 9% in 2014 and 8% in 2015) [13,31,52].
Considering that a road crash can involve one or more drivers, passengers, or pedestrians, just as it can involve one or more vehicles, a new variable was prepared to connect the three original databases. This new variable was the type of person involved in the crash: driver, passenger, and pedestrian. Based on the crash identification number, a new quantitative variable to represent the number of persons involved in the crash was also created. In accordance with this new quantitative variable, crashes with 6 or more persons involved were excluded from the database (1 crash with 44 persons involved, 1 with 13, 1 with 11, 4 with 9, 2 with 8, 11 with 7, and 23 with 6), since the minimum sample size conditions to fit the assumptions of multinomial logistic regression were not verified.
When processing the information, it was possible to verify that about 31% of a total of 13,109 records of persons involved in WZ crashes (4053 records) presented B4.3 coded as ‘Undefined’. These data were not considered, as the information recorded does not make it possible to state whether the crash occurred in a WZ area or due to the presence of obstacles on the pavement. Regarding records with other inadequate information completion, which resulted in the exclusion of another 2004 persons involved in WZ crashes, the following elimination criteria were considered:
- (a)
- Records coded as ‘Undefined’ in report fields A3: Crash type (with property damage only, fatalities, serious or minor injuries); A4: Crash nature (run of road, collision or run over pedestrians); A6: Gender and/or Date of birth; B2.1: Road horizontal geometry (straight or curved); B2.2: Road vertical geometry (level, slope or hump); B2.4: Road crash location (on the track, side, sidewalk, dedicated track or parking lot); B2.5: Road intersection (outside the intersection, at a level or uneven intersection); B4.1: Pavement type (unpaved, bituminous, concrete or stone); B4.2: Pavement condition (good, regular or bad); B4.4: Pavement grip condition (dry and clean, humid, wet, etc.); and B5.1: Markings on the pavement (no marks or barely visible, with markings separating the direction of traffic or with markings separating the direction and lanes of traffic).
- (b)
- Records without location data (no information in field A2).
- (c)
- Records of drivers under the age allowed by law to drive (field A6).
- (d)
- Records with no information about the year of license to drive (field E1.3).
In summary, taking into account the above, the database was initially organized based on the crash identification number and then it was reorganized by the type of person involved in the crash (new variable), which resulted in a single line of information per person involved in the WZ crash.
The procedure described resulted in a final database with 7052 persons involved (drivers, passengers, and pedestrians), corresponding to a total of 3504 WZ crashes. Table 3 presents the number of records with B4.3 field ‘Undefined’ and the number of WZ crashes and type of person involved. This database was used in the IBM SPSS® program to perform the following statistical analysis: an exploratory analysis to identify the main characteristics related to the variables considered in the study, and the development of multinomial logistic models for crash nature (collision, run-off-road and run over pedestrians) and type of person involved in the crash (driver, passenger, and pedestrian).
Table 3.
Global database numbers.
3. Models and Discussion
Based on the data provided by ANSR, which treatment resulted in a single database organized by type of person involved in WZ crashes, an exploratory analysis, the selection of significant variables, and statistical tests recommended for multinomial logistic regression, were performed.
In total, 230 predictive nominal qualitative variables were studied and converted into dummy variables, based on the results obtained from the exploratory analysis. The quantitative predictive variable considered in the modelling process as a covariate was the number of people involved in the crash, with five categories: 1, 2, 3, 4 and 5. The outcomes of the collinearity analysis and forward stepwise regression performed for the predictive variables resulted in a set of significant explanatory variables to be considered in the models. For the crash nature model, 10 variables were selected, and for the type of the person involved, 7. These variables are in line with those identified in similar studies [10,12,13,14,15,16,17,18,19,20,21,22,25,26,30,31,32].
In the modelling process, the reference category ‘collision’ was considered for the crash nature model (most common type of WZ crash identified in several studies [10,16,17,18,19,25,26] and in the database), and ‘pedestrian’ for the type of person involved model (type of person involved presenting more severe injuries in the database). The explanatory variables selection and multinomial modelling results are presented and discussed in Section 3.1 and Section 3.2.
3.1. Model 1: WZ Crash Nature
3.1.1. Results
Table 4 provides a summary of the cases processed in the analysis. It presents: the number of elements (N) in each of the explanatory variable categories (5 categories for quantitative variable X1 and dummy code for qualitative variables X2 to X11); the corresponding percentage values; the valid, missing, and total values; and two collinearity diagnostic factors, tolerance and VIF.
Table 4.
Case processing summary, tolerance and VIF.
A summary of the model fitting criteria and of the effect selection tests obtained in the forward stepwise regression, considering a significance level of 0.05, is presented in Table 5. Table 6 presents the information regarding the model fit to the data, and Table 7 presents the likelihood ratio tests results and the model fitting criterion for each of the explanatory variables (predictors).
Table 5.
Summary of variables selected by the forward stepwise method.
Table 6.
Model fitting information.
Table 7.
Independent variables likelihood ratio test results.
The estimates of the model parameters, the Wald test and the odds ratios Exp(β) are presented in Table 8. Finally, the equations of the probabilistic models obtained from the information presented in Table 8 are used to calculate the probability that a person involved in a WZ crash has to belong to a certain crash nature category (each person involved is classified in the category where the probability of occurrence is greater). The results obtained in the classification are shown in Table 9.
Table 8.
Model parameter’s estimates.
Table 9.
Classification.
3.1.2. Analysis of Results
In the WZ crash nature model, the probability of a subject belonging to Y0 (collision), Y1 (run-off-road) and Y2 (run over pedestrian) was determined through a set of 10 predictor variables (X2 to X11 in Table 4). The tolerance and VIF test results showed that the selected variables were not influenced or inflated by its correlation with the other considered variables, meaning that multicollinearities were not identified. The results of the stepwise analysis using the forward entry method (see Table 5) also confirm the relevance of the selected variables. The successive reduction of AIC and BIC values, in line with the likelihood ratio tests, indicates that the model improves with the entry of each variable. Also, since the significance of the chi-square p-value is less than 0.05, it is possible to conclude that the model fits the data significantly.
The model fitting information presented in Table 6 makes it possible to conclude that there is at least one independent variable that significantly influences the nature of the WZ crash (p-value ≤ 0.001). The values of AIC, BIC and the likelihood tests indicate that the final complete model (with all variables) has a better fit than the reduced model (intercept only). There is no strong guidance on how pseudo-R2 of Cox and Snell, Nagelkerke and McFadden should be interpreted, however, the obtained value of 0.321 for Mc Fadden indicates a good fit of the model. The likelihood ratio tests results obtained for the independent variables (Table 7), for an α = 0.05, show that all the variables considered significantly affect the WZ crash nature (p ≤ 0.001). The best model, i.e., the one with the lowest AIC and BIC, is the model that incorporates all variables.
From the Wald test results (Table 8), for the run-off-road category, it is concluded that only variable X8 (passenger car) is not significant. Thus, it is possible to state that the remaining independent variables allow distinguishing the probabilities of the run-off-road category versus the collision category, and that all the variables allow distinguishing the probabilities of the run over pedestrian versus the collision category. For the run-off-road category, variables X1, X2, X3, X4, X9, X10 and X11 do not increase the probability of being involved in a run-off-road WZ crash (26.2% of persons involved) relative to a collision (60.2 % of persons involved). On the other hand, when compared to a collision, variables X5, X6 and X7 increase the probability of being involved in a run-off-road WZ crash. Concerting the running over pedestrian category, variables X1, X2, X3, X5, X6, X7, X8 and X10 do not increase the probability of being involved in a run over pedestrian WZ crash (13.6% of persons involved) relative to a collision. However, X4, X9 and X11 considerably increase the probability of being involved in a run over pedestrian WZ crash.
As shown in Table 9, the predicted model correctly classifies 73.2% of the cases, representing a rate of correct classifications that is 1.63 times higher than the one obtained by chance (0.6022 + 0.2622 + 0.1362 = 0.449 = 44.9%), demonstrating the usefulness of the model for classifying new observations. The predictive power of the model can also be evaluated using the ROC curves. Figure 1 presents the ROC curves for the estimated cell probability in the collision, run-off-road and running over pedestrian response categories. Graph (a) shows an area under the ROC curve of 0.811, which indicates a good discriminating ability for this category. Graphs (b) and (c), with areas under the ROC curve of 0.735 and 0.602, indicate an acceptable and poor discriminating ability to predict these categories (run-off-road and run over pedestrian).
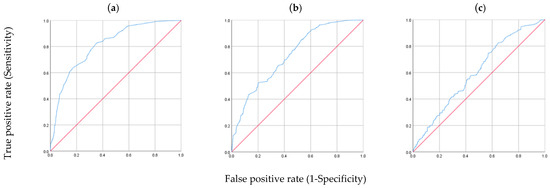
Figure 1.
ROC Curves. Estimated cell probability for: (a) Collision (AUC = 0.811), (b) Run-off-road (AUC = 0.735), (c) Run over pedestrian (AUC = 0.602).
3.2. Model 2: Type of Person Involved in WZ Crashes
3.2.1. Results
Similar to Section 3.1.1, Table 10, Table 11, Table 12, Table 13, Table 14 and Table 15 present the results obtained for Model 2: type of person involved in WZ crashes.
Table 10.
Case processing summary, tolerance and VIF.
Table 11.
Summary of variables selected by the forward stepwise method.
Table 12.
Model fitting information.
Table 13.
Independent variables likelihood ratio test results.
Table 14.
Model parameter’s estimates.
Table 15.
Classification.
3.2.2. Analysis of Results
In the type of person involved in WZ crashes model, the probability of a subject belonging to Y0 (pedestrian), Y1 (passenger) and Y2 (driver) was identified through a set of 7 predictor variables (X2 to X8). Multicollinearity was not identified and the results of the stepwise analysis using the forward entry method confirmed the relevance of the 7 variables considered (see Table 10 and Table 11). The successive reduction of AIC and BIC values, in line with the likelihood ratio tests, make it possible to state that the model improves with the entry of each variable. It is still possible to conclude that the model fits the data significantly, since the significance of the chi-square p-value is less than 0.05.
Regarding the model fitting information (Table 12), it is possible to conclude that there is at least one independent variable that significantly influences the type of person involved in WZ crashes (p-value ≤ 0.001). The values of AIC, BIC and likelihood tests indicate that the final complete model (with all independent variables) represents a better fit than the reduced model (intercept only). As previously mentioned, there is no strong guidance on how pseudo-R2 of Cox and Snell, Nagelkerke and McFadden should be interpreted. Still, for the McFadden pseudo-R2, according to [41], the value of 0.126 does not indicate a good fit of the model. For the independent variables and an α=0.05, the likelihood ratio test results in Table 13 show that all the variables considered significantly affect the type of person involved in WZ crashes (p ≤ 0.001). The best model is the model with all variables (lowest AIC and BIC).
According to the Wald test results (Table 14), all the variables allow to distinguish the probabilities of the passenger category versus the pedestrian reference category. For the driver category, only variable X1 (number of persons involved in the crash) is not significant. The remaining independent variables make it possible to distinguish the probabilities of the driver category versus the pedestrian category. Despite the verification of statistical criteria, results obtained for the model must be interpreted carefully, since the reference category (pedestrian) presented a low percentage of correct classifications, namely 4.8% (see Table 15). Having pedestrian (7.7% of persons involved) as the reference category, all variables for the passenger category increase the probability of being involved in a WZ crash as a passenger (17.4% of persons involved). For the driver category, variables X2 to X8 increase the probability of being involved as a driver (74.9% of persons involved).
The predicted model correctly classifies 74.6% of the cases (Table 15), which represents a rate of correct classifications 1.25 times higher than the one obtained by chance (0.0772 + 0.1742 + 0.7492 = 0.597 = 59.7%). The predictive power of the final model was also evaluated using ROC curves. Figure 2 presents the ROC curves for the estimated cell probability in the pedestrian, passenger, and driver response categories. Graph (a) shows an area under the ROC curve of 0.741, which means that there is acceptable discrimination of subjects for this category, and graphs (b) and (c) show areas under the ROC curve of 0.641 and 0.541, meaning poor subject discrimination to predict these categories.
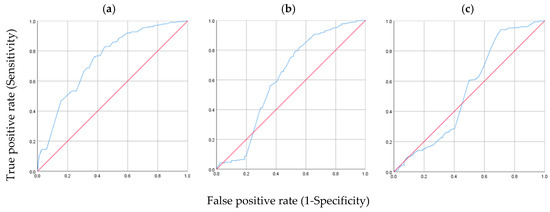
Figure 2.
ROC Curves. Estimated cell probability for: (a) Pedestrian (AUC = 0.741), (b) Passenger (AUC = 0.641), (c) Driver (AUC = 0.541).
3.3. Discussion of Results
In addition to checking the feasibility of establishing the models, the decision to develop WZ crash nature and type of person involved in WZ crashes global models, rather than a model of injury severity, is justified. This can be inferred since the injury variable categories, for the database considered, do not present a similar distribution of subjects, as recommended by Marôco [35], especially regarding fatal and seriously injured victims (1.0% fatal victims, 3.4% seriously injured, 60.3% slightly injured and 35.3% unharmed).
It was also confirmed that the database did not present specific WZ quantitative variables that could be used as covariates in the analysis, such as the number of obstacles, the annual average daily traffic (AADT), the total WZ length, or the number of lanes closed, among others. To overcome this limitation and allow the feasibility of multinomial regression analysis, the quantitative variable X1 (number of persons involved in the crash) was prepared and included in the analysis.
Considering the more favorable distribution of subjects for the WZ crash nature and type of person involved in WZ crashes categories, models were developed for these two variables. The models showed a high level of confidence (5%) and proved to be statistically significant. As mentioned previously, the crash nature model presents 73.2% of correct classifications. This value is considerably higher than the proportional percentage of correct classifications by chance, which is 45.1% (about 1.63 times higher). For the type of person involved, the percentage of correct classifications is 74.6% and the proportional percentage of correct classifications by chance is 59.7% (about 1.25 times higher). For this last model, the increase in correct classifications, when compared to the classification by chance, is not as expressive as for the crash nature model. Even so, according to Marôco [35], the model can be considered to have classificatory properties (increase of at least 25%).
Regarding the WZ crash nature model, the quantitative variable X1 (number of people involved in a WZ crash) that was created did not show a positive influence on the model (Exp(β) < 1). When examining the injuries’ variables (X2 to X4), the analysis indicates that they do not increase the probability of a subject being involved in a crash. The exception is X4 (light injury = 0) for the run over pedestrian category relative to the reference category collision, since being involved as a fatal victim or being seriously injured or unharmed, in contrast to a light injured, increases the chances of being involved in a run over pedestrian by 92.2% (Exp(β) = 1.922). As expected, due to the involvement of vulnerable users (pedestrian workers) [21,22], when compared to run-off-road and collision, running over pedestrian category presents a high proportion of fatalities and serious injuries in WZ crashes, which confirms the obtained result.
For the road environment variable (X5, urban = 0), being involved in a crash in a rural environment, compared to a crash in an urban environment, increases the chances of being involved in a run-off-road crash relative to a collision by 30.2% (Exp(β) = 1.302). This environment was also identified in [13,22] as a risk factor that increases the probability of WZ crashes, especially those involving serious injuries. In contrast, for running over pedestrian, it reduces the chances of a subject being involved by 82% (Exp(β) = 0.180). In run-off-road crashes, this increase is apparently associated with the practice of high speeds.
The road horizontal geometric design (X6, alignment = 0), for run-off-road category relative to collision and when the crash occurs on a curve, increases the chances of a subject being involved by 87.0% (Exp(β) = 1.870), relatively to those involved in crashes that occur in straight alignment, while for running over pedestrian there is a reduction of 30.1% (Exp(β) = 0.699). Bad pavement grip conditions (X7, dry and clean = 0) are directly related to road environment conditions, such as adverse weather, presence of mud, sand, or oil on the pavement. For subjects involved in crashes that occurred with good grip conditions (dry and clean pavement), relative to those involved in places with poor grip conditions, there is an increase of 57.7% (Exp (β) = 1.577) in the chances of being involved in a run-off-road crash. There is also a reduction of 17.9% (Exp(β) = 0.821) for the case of run over pedestrian, when compared to the reference category collision. In view of these results and of the literature [13,18,22], it is considered of fundamental importance to ensure efficient traffic control devices, traffic signs and speed limits, especially in adverse weather conditions and complex road geometries.
Regarding the intervening vehicles, a positive influence was not found for the passenger car variable (X8, passenger car = 0) when modelling the crash nature. This result is in line with the fact that there is a predominance of subjects involved in WZ crashes driving or being passengers in passenger cars (77.7% of people involved). Considering the results obtained and the literature consulted [14,15,17,18,21,22,25], and despite the reduced number of cases in the analyzed database (348 cases), it is suggested that an isolated analysis of crashes involving one or more heavy vehicles is performed, since they present homogeneous characteristics in terms of injury severity, involved persons (drivers) and type of crash (collision).
For variable X9 (running straight = 0), being involved in a crash in which the actions and maneuvers were not running straight before the crash (including driver actions and maneuvers before the crash and actions of pedestrian victims), compared to running straight, reduces the chances of being involved in a run-off-road crash by 64.9% (Exp(β) = 0.351). Under the same conditions and when compared to a collision, it significantly increases the chances of being involved in a run over pedestrian crash by 303.6% (Exp(β) = 4.036). Most road crash studies, including the ones presented in the literature review section, have identified running straight as a risk factor that increases the probability of crashes, since it favors the practice of higher speeds.
The involvement in a crash with other actions and maneuvers of the driver previously to the accident, as well as with actions of the pedestrian victims, relative to the involvement of a road worker (X10, WZ pedestrian worker victim = 0), reduces the chances of being involved in a run-off-road crash by 91.6% (Exp(β) = 0.084). It also reduces the chances of being involved in a run over pedestrian crash by 98.8% (Exp(β) = 0.012), in comparison to a collision crash. As mentioned before, pedestrians working on the road are the most vulnerable subjects on WZ. Additionally, it is considered relevant to develop a model for run over pedestrian crashes, since there were 14 fatal and 50 seriously injured victims, as a consequence of this type of crash, presenting a relatively homogeneous distribution in terms of injuries.
For the circumstances described in other information complementary to actions and maneuvers (such as disrespect for vertical signs, road markings or traffic lights, among others), relative to the practice of excessive speed for prevailing conditions (X11, excessive speed for prevailing conditions = 0), which is an illegal and unadvised behavior in WZ, the chances of being involved in a run-off-road crash are reduced by 43.7% (Exp(β) = 0.563). However it increases the chances for the run over pedestrian category by 167.9% (Exp(β) = 2.679), when compared with collision.
Having collision as a reference category, variables X9 and X11 revealed a positive influence on the crash nature model for the run over pedestrian crash type. These results indicate the need to develop effective methods for signaling, as well as for warning and directing traffic in WZ. Some examples of these methods are the adoption of temporary traffic control and speed reduction devices, and more visible inspections (police presence). These actions aim to reduce the impact of human behavior as a contributing factor to the occurrence of WZ crashes [12,16,18,19,25,26].
When compared to the crash nature model, there is an increased difficulty in interpreting the results of the type of person involved model, since the pedestrian’s category was used as a reference and the characteristics of crashes in which they are involved are quite different from those verified for the drivers and passengers categories. This fact is reinforced by the results obtained in the classification of cases (Table 14), since the percentage of correct classifications for pedestrian and passenger categories are low when compared to the driver category.
The number of persons involved in the selected WZ crashes (X1) revealed a positive influence on the type of person involved model for the passenger category. The chances of being involved as a passenger in a WZ crash in comparison to a pedestrian, for the total number of persons involved, is 2.182 (Exp(β)), corresponding to a chance’s variation of 118.2% per unit increase of persons involved. Regarding crashes with one driver involved (which corresponds to a single vehicle involved), considering the ROC curves (especially for the driver and passenger categories) and the representativeness of this category in variable X1 (16.5%, see Table 3), it is recommended to investigate this scenario separately from crashes involving multiple vehicles. The need to study the effect of the type and number of vehicles involved, was also identified and addressed by Osman et al. and Meng et al. [12,22].
For the passenger and driver categories, variables related to injury severity (X2 and X3, fatality = 0, seriously injured = 0) revealed a positive influence on the model. These groups have the highest number of persons involved with injuries (mostly slight injuries) when compared with the pedestrian category.
For variable X4 (urban = 0), a subject involved in a rural environment WZ crash, relative to an urban environment, increases the chances of being involved as a passenger by 578.2% (Exp(β) = 6.782) and as a driver by 512.4% (Exp(β) = 6.124), when compared to the pedestrian category. Involvement in a crash that occurs on a horizontal curve (X5, alignment=0), in comparison to a crash on a straight alignment, increases the chances of being involved as a passenger by 108.4% (Exp(β) = 2.084) and as a driver in 59.2% (Exp(β) = 1.592). It was also verified that adverse pavement grip conditions, relative to good grip conditions (X6, dry and clean=0), increase the chances of being involved as a passenger by 53.5% (Exp(β) = 1.535) and as a driver by 35.8% (Exp(β) = 1.358), compared to the pedestrian category. The results obtained are in line with what would be expected from the comparison of passenger and driver with the pedestrian reference category.
Being involved as a subject in other types of vehicles considered in the Portuguese police crash report, relative to the class heavy vehicle (X7, heavy vehicle involvement = 0), increases the chances of a passenger being involved in a WZ crash by 498.3% (Exp(β) = 5.983), and the chances of a driver being involved in 73.5% (Exp(β) = 1.735), when compared to pedestrians. It should be noted that the passenger category is naturally associated with passenger cars, the driver category is mostly associated with passenger cars and for the other types of intervening vehicles, these categories are heterogeneously distributed.
Finally, the chances of a subject being involved in a WZ crash during the weekend, in comparison to a subject involved during the working weekdays (X8, working weekday = 0), increases the chances of a passenger being involved by 176.3% (Exp(β) = 2.763) and a driver by 83.3% (Exp(β) = 1.833), relative to a pedestrian. Considering that during the weekend road work zones are generally inactive, the results obtained reflect a greater propensity for driver behaviors associated with imposed speed limit and signage disrespect, as stated by Osman et al. [22].
4. Conclusions
Aligned with the consolidated road networks ‘maintenance needs and with the WHO and UN objectives to improve road safety, the presented study aims to identify the main risk factors increasing the probability of WZ crashes occurrence considering the crash nature, type of person involved and use of multinomial logistic regression. Multinomial logistic regression has been mainly used to analyze WZ crash and injury severity. Therefore, its application to the crash nature and type of person involved, considering the information available in the Portuguese police crash report, which was organized in a single database by type of person involved, constitutes a new application and a contribution to the study and promotion of WZ safety.
In this study, two analytical models were established, confirming the feasibility of using multinomial logistic regression to predict the occurrence probabilities for the categories considered for crash nature (collision, run-off-road and run over pedestrian) and type of person involved in WZ crashes (pedestrian, passenger and driver).
In a universe of 230 available independent variables, 10 nominal qualitative variables with predictive effects were selected for the crash WZ nature model: fatality, seriously injured, slightly injured, road environment, horizontal geometric design, pavement grip condition, passenger car, driver action, pedestrian worker victim action and excessive speed for prevailing conditions. Considering the type of person involved in WZ crashes, the following 7 predictive nominal qualitative variables were considered: fatality, seriously injured, road environment, horizontal geometric design, pavement grip condition, heavy vehicle involvement and working weekday.
From the fitting information, quality of fit, Pseudo-R², likelihood ratio tests, predictive parameters’ estimates, as well as from correct and random classifications, it was concluded that both models are considered discriminating through classification and with predictive power verified by the ROC curves. However, the WZ crash nature model presented better results. It is believed that this outcome is related to a more favorable distribution of subjects by categories in the WZ crash nature model, and to the use of pedestrians as the reference category in the type of person involved model (pedestrian’s characteristics and type of involvement are quite different from those of passengers and drivers).
Taking collision as a reference category, a global analysis of the WZ crash nature predictive model showed that rural environment, horizontal curve design and poor pavement grip conditions, compared to the urban environment, horizontal alignment design and good pavement grip conditions (dry and clean), increase the chances of a run-off-road crash by 30.2%, 87.0%, 57.7% respectively. For the run over pedestrian category, it was found that fatal victims, serious injured and unharmed victims, compared to a subject with minor injuries, increase the chances of being involved in a run over pedestrian crash by 92.2%. Running over pedestrian have the highest number of fatalities and serious injuries in the set of WZ crashes analyzed. The chances of being involved in a run over pedestrian crash as a subject in a vehicle that performs other actions and maneuvers before the crash or other complementary information, including pedestrian victims’ actions, compared to a subject in a vehicle running straight or moving at excessive speed, increase by 303.6% and 167.9% respectively.
As mentioned in the discussion of results, the interpretation of the type of person involved in WZ crashes model results must be carefully performed. According to the predictive model, the passenger category is positively influenced by all the considered predictive variables. For the driver category, only the number of persons involved in the crash does not significantly influence the probability of being involved in a crash as a driver, which can be explained by the fact that most of the persons involved in WZ crashes are drivers. Variables with the most significant positive influence are injured and unharmed victims, the rural environment, and the involvement of vehicles other than heavy vehicles, compared to the urban environment, fatal victims and the involvement of heavy vehicles, increasing the chances of being involved as a passenger by 755.8%, 578.2% and 498.3% respectively. This result could be explained by the fact that passengers essentially travel in passenger car vehicles. The chances of being involved as an unharmed or slightly injured driver, compared to being a fatal or seriously injured victim, increase by more than 600%. For the driver category and considering the road environment variable, the chances of being involved in a WZ crash in a rural environment, compared to an urban environment, increase by 512.4%.
The lack of more detailed WZ information, namely of quantitative variables such as the WZ length and traffic volume, is considered the main limitation of this study. It is believed that WZ detailed information would allow more representative and advanced crash analyses. Considering future works, crash nature models using multinomial logistic regression considering only drivers and a separate analysis for crashes involving a single vehicle from those with multiple intervening vehicles, are suggested. It is also suggested to verify the possibility of applying other statistical techniques such as generalized linear models, Monte Carlo, genetic algorithms, random forest and neural networks to Portuguese data, as well as comparing the results obtained, when possible, with those of multinomial logistic regression.
Author Contributions
Conceptualization, B.S. and A.V.; methodology, B.S. and A.V.; validation, A.V., B.S. and L.P.-S.; formal analysis, A.V.; investigation, A.V., B.S. and L.P.-S.; writing—original draft preparation, B.S.; writing—review and editing, B.S. and L.P.-S.; supervision, B.S. All authors have read and agreed to the published version of the manuscript.
Funding
This research received no external funding, but it is part of the research activity carried out at Civil Engineering Research and Innovation for Sustainability (CERIS) research center, which received financial support from the Fundação para a Ciência e a Tecnologia (FCT) in the framework of project UIDB/04625/2020.
Institutional Review Board Statement
Not applicable.
Informed Consent Statement
Not applicable.
Data Availability Statement
Restrictions apply to the availability of data. Data was obtained from Portuguese National Road Safety Authority (ANSR—Autoridade Nacional de Segurança Rodoviária) and are available from the corresponding author if authorized by ANSR.
Acknowledgments
The authors acknowledge the Portuguese National Road Safety Authority (ANSR—Autoridade Nacional de Segurança Rodoviária) for providing data and assistance, CERIS—Civil Engineering Research and Innovation for Sustainability (ECI/04625), and the University of Beira Interior for support and funding.
Conflicts of Interest
The authors declare no conflict of interest.
References
- OECD-ITF. Road Safety Annual Report 2020. Available online: https://www.itf-oecd.org/sites/default/files/docs/irtad-road-safety-annual-report-2020_0.pdf (accessed on 9 November 2022).
- United Nations. A/RES/70/1 Transforming Our World: The 2030 Agenda for Sustainable Development Trans-Forming Our World: The 2030 Agenda for Sustainable Development Preamble. 2015. Available online: https://sdgs.un.org/sites/default/files/publications/21252030%20Agenda%20for%20Sustainable%20Development%20web.pdf (accessed on 9 November 2022).
- United Nations. A/RES/74/299 Improving Global Road Safety. 2020. Available online: https://digitallibrary.un.org/record/3879711?ln=en (accessed on 9 November 2022).
- WHO. Global Status Report on Road Safety 2018. Available online: https://www.who.int/publications/i/item/9789241565684 (accessed on 9 November 2022).
- WHO. The Top 10 Causes of Death. 2020. Available online: https://www.who.int/news-room/fact-sheets/detail/the-top-10-causes-of-death (accessed on 10 November 2022).
- WHO. Road Traffic Injuries. 2022. Available online: https://www.who.int/news-room/fact-sheets/detail/road-traffic-injuries (accessed on 10 November 2022).
- Ambros, J.; Turek, R.; Elgner, J.; Křivánková, Z.; Valentová, V. Effectiveness evaluation of section speed control in Czech motorway work zones. Safety 2020, 6, 38. [Google Scholar] [CrossRef]
- La Torre, F.; Domenichini, L.; Nocentini, A. Effects of stationary work zones on motorway crashes. Saf. Sci. 2017, 92, 148–159. [Google Scholar] [CrossRef]
- Silverstein, C.; Schorr, J.; Hamdar, S.H. Work zones versus nonwork zones: Risk factors leading to rear-end and sideswipe collisions. J. Transp. Saf. Secur. 2016, 8, 310–326. [Google Scholar] [CrossRef]
- Yang, H.; Ozbay, K.; Ozturk, O.; Xie, K. Work zone safety analysis and modeling: A state-of-the-art review. Traffic Inj. Prev. 2015, 16, 387–396. [Google Scholar] [CrossRef]
- Ullman, G.; Ullman, B.; Finley, M. Analysis of crashes at active night work zones. In Proceedings of the Transportation Research Board 85th Annual Meeting, Washington, WA, USA, 22–26 January 2006. [Google Scholar]
- Meng, Q.; Weng, J.; Qu, X. A probabilistic quantitative risk assessment model for the long-term work zone crashes. Accid. Anal. Prev. 2010, 42, 1866–1877. [Google Scholar] [CrossRef] [PubMed]
- Santos, B.; Trindade, V.; Polónia, C.; Picado-Santos, L. Detecting risk factors of road work zone crashes from the information provided in police crash reports: The case study of Portugal. Safety 2021, 7, 12. [Google Scholar] [CrossRef]
- Khattak, A.; Rodriguez, D.; Targa, F.; Rocha, M. Understanding the Role of Truck-Driver, Occupational and High-Risk Roadway Factors in Truck-Involved Collisions; CURS Report No. 2003-04; CURS: Nashville, TN, USA, 2003. [Google Scholar]
- Khattak, A.; Targa, F. Injury severity and total harm in truck-involved work zone crashes. Transp. Res. Rec. 2004, 1877, 106–116. [Google Scholar] [CrossRef]
- Qi, Y.; Srinivasan, R.; Teng, H.; Baker, R. Frequency of Work Zone Accidents on Construction Projects: Final Report C-01-61. 2005. Available online: https://rosap.ntl.bts.gov/view/dot/16159 (accessed on 21 November 2022).
- Li, Y.; Bai, Y. Fatal and injury crash characteristics in highway work zones. In Proceedings of the Transportation Research Board 87th Annual Meeting, Washington, WA, USA, 13–17 January 2008. [Google Scholar]
- Li, Y.; Bai, Y. Comparison of characteristics between fatal and injury accidents in the highway construction zones. Saf. Sci. 2008, 46, 646–660. [Google Scholar] [CrossRef]
- Elghamrawy, T. Optimizing Work Zone Practices for Highway Construction Projects. Ph.D. Thesis, University of Illinois, Champaign, IL, USA, 2011. [Google Scholar]
- Yang, H.; Ozbay, K.; Ozturk, O.; Yildirimoglu, M. Modeling work zone crash frequency by quantifying measurement errors in work zone length. Accid. Anal. Prev. 2013, 55, 192–201. [Google Scholar] [CrossRef] [PubMed]
- Osman, M.; Paleti, R.; Mishra, S.; Golias, M. Analysis of injury severity of large truck crashes in work zones. Accid. Anal. Prev. 2016, 97, 261–273. [Google Scholar] [CrossRef] [PubMed]
- Osman, M.; Paleti, R.; Mishra, S. Analysis of passenger-car crash injury severity in different work zone configurations. Accid. Anal. Prev. 2018, 111, 161–172. [Google Scholar] [CrossRef] [PubMed]
- Weng, J.; Du, G.; Ma, L. Driver injury severity analysis for two work zone types. Proc. Inst. Civ. Eng.-Transp. 2016, 169, 97–106. [Google Scholar] [CrossRef]
- Sze, N.; Song, Z. Factors contributing to injury severity in work zone related crashes in New Zealand. Int. J. Sustain. Transp. 2019, 13, 148–154. [Google Scholar] [CrossRef]
- Li, Y.; Bai, Y. Highway work zone risk factors and their impact on crash severity. J. Transp. Eng. 2009, 135, 694–701. [Google Scholar] [CrossRef]
- Ashqar, H.; Shaheen, Q.; Ashur, S.; Rakha, H. Impact of risk factors on work zone crashes using logistic models and Random Forest. In Proceedings of the IEEE Intelligent Transportation Systems Conference (ITSC), Indianapolis, IN, USA, 19–21 September 2021. [Google Scholar] [CrossRef]
- Weng, J.; Meng, Q. Analysis of driver casualty risk for different work zone types. Accid. Anal. Prev. 2011, 43, 1811–1817. [Google Scholar] [CrossRef] [PubMed]
- Bédard, M.; Guyatt, G.; Stones, M.; Hirdes, J. The independent contribution of driver, crash, and vehicle characteristics to driver fatalities. Accid. Anal. Prev. 2002, 34, 717–727. [Google Scholar] [CrossRef]
- Harb, R.; Radwan, E.; Yan, X.; Pande, A.; Abdel-Aty, M. Freeway work-zone crash analysis and risk identification using multiple and conditional logistic regression. J. Transp. Eng. 2008, 134, 203–214. [Google Scholar] [CrossRef]
- Santos, B.; Picado-Santos, L. Impact assessment of road work zones in operating conditions, safety and user costs. In Pavement and Asset Management, 1st ed.; Crispino, M., Ed.; CRC Press/Balkema Taylor & Francis: London, UK, 2019; pp. 595–604. ISBN 978-0-367-20989-6. [Google Scholar]
- Santos, B.; Picado-Santos, L.; Trindade, V. Using binary logistic regression to explain the impact of accident factors on work zone crashes. In Proceedings of the RSS 2017—Road Safety & Simulation International Conference, The Hague, The Netherlands, 17–19 October 2017. [Google Scholar]
- Abdulhafedh, A. Road traffic crash data: An overview on sources, problems, and collection methods. J. Transp. Technol. 2017, 7, 206–219. [Google Scholar] [CrossRef]
- Hosmer, D.; Lemeshow, S.; Sturdivant, R. Applied Logistic Regression, 3rd ed.; John Wiley & Sons, Inc.: Hoboken, NJ, USA, 2013. [Google Scholar] [CrossRef]
- Washington, S.; Karlaftis, M.; Mannering, F.; Anastasopoulos, P. Statistical and Econometric Methods for Transportation Data Analysis, 3rd ed.; Chapman & Hall/CRC: New York, NY, USA, 2020. [Google Scholar] [CrossRef]
- Marôco, J. Análise Estatística Com o SPSS Statistics, 6th ed.; ReportNumber—Análise e gestão de informação, Lda; Biblioteca Nacional de Portugal: Pêro Pinheiro, Portugal, 2014. [Google Scholar]
- Chen, J.; Lewis, B.; Marathe, A.; Marathe, M.; Swarup, S.; Vullikanti, A. Individual and collective behavior in public health epidemiology. Handb. Stat. 2017, 36, 329–365. [Google Scholar] [CrossRef]
- Fávero, L.; Belfiore, P.; Silva, F.; Chan, B. Análise de Dados: Modelagem Multivariada Para Tomada de Decições, 3rd ed.; Elsevier: Rio de Janeiro, Brasil, 2009; ISBN 9788535230468. [Google Scholar]
- Bham, G.; Javvadi, B.; Manepalli, U. Multinomial logistic regression model for single-vehicle and multivehicle collisions on urban U.S. highways in Arkansas. J. Transp. Eng. 2012, 138, 786–797. [Google Scholar] [CrossRef]
- Osborne, J. Best Practices in Logistic Regression; SAGE Publications, Ltd.: Thousand Oaks, CA, USA, 2017. [Google Scholar] [CrossRef]
- Pituch, K.; Stevens, J. Applied Multivariate Statistics for the Social Sciences: Analyses with SAS and IBM’s SPSS, 6th ed.; Taylor and Francis: Oxfordshire, UK, 2015. [Google Scholar] [CrossRef]
- Hensher, D.; Stopher, P. Behavioural Travel Modelling; Taylor and Francis Inc.: London, UK, 2021. [Google Scholar] [CrossRef]
- Long, J. Regression Models for Categorical and Limited Dependent Variables, 1st ed.; SAGE Publications: Thousand Oaks, CA, USA, 1997; ISBN 9780803973749. [Google Scholar]
- Hoffmann, R. Análise de Regressão: Uma Introdução à Econometria; Escola Superior de Agricultura Luiz de Queiroz: Piracicaba, Brazil, 2017. [Google Scholar] [CrossRef]
- Miles, J. Tolerance and variance inflation factor. In Wiley StatsRef: Statistics Reference Online; John Wiley & Sons, Ltd.: Hoboken, NJ, USA, 2014. [Google Scholar] [CrossRef]
- Sze, N.; Wong, S.; Lee, C. The likelihood of achieving quantified road safety targets: A binary logistic regression model for possible factors. Accid. Anal. Prev. 2014, 73, 242–251. [Google Scholar] [CrossRef] [PubMed]
- Harrel, F., Jr. Regression Modeling Strategies—With Applications to Linear Models, Logistic and Ordinal Regression, and Survival Analysis, 2nd ed.; Springer Series in Statistics; Springer: Cham, Switzerland, 2015. [Google Scholar] [CrossRef]
- IBM Corp. IBM SPSS Statistics for Windows; IBM Corp.: Armonk, NY, USA, 2017. [Google Scholar]
- Autoridade Nacional de Segurança Rodoviária (ANSR). Boletim Estatístico de Acidentes de Viação, Portugal. 2014. Available online: http://www.ansr.pt/Estatisticas/BEAV/Documents/BEAV.pdf (accessed on 9 November 2022).
- Pahukula, J.; Hernandez, S.; Unnikrishnan, A. A time of day analysis of crashes involving large trucks in urban areas. Accid. Anal. Prev. 2015, 75, 155–163. [Google Scholar] [CrossRef] [PubMed]
- Roque, C.; Moura, F.; Lourenço-Cardoso, J. Detecting unforgiving roadside contributors through the severity analysis of ran-off-road crashes. Accid. Anal. Prev. 2015, 80, 262–273. [Google Scholar] [CrossRef]
- Tay, R.; Choi, J.; Kattan, L.; Khan, A. A multinomial logit model of pedestrian-vehicle crash severity. Int. J. Sustain. Transp. 2011, 5, 233–249. [Google Scholar] [CrossRef]
- Vieira, A. Analysis of Road Work Zone Crash Data Using Multinomial Logistic Regression. Master’s Thesis, University of Beira Interior, Covilhã, Portugal, 2019. [Google Scholar]
Disclaimer/Publisher’s Note: The statements, opinions and data contained in all publications are solely those of the individual author(s) and contributor(s) and not of MDPI and/or the editor(s). MDPI and/or the editor(s) disclaim responsibility for any injury to people or property resulting from any ideas, methods, instructions or products referred to in the content. |
© 2023 by the authors. Licensee MDPI, Basel, Switzerland. This article is an open access article distributed under the terms and conditions of the Creative Commons Attribution (CC BY) license (https://creativecommons.org/licenses/by/4.0/).