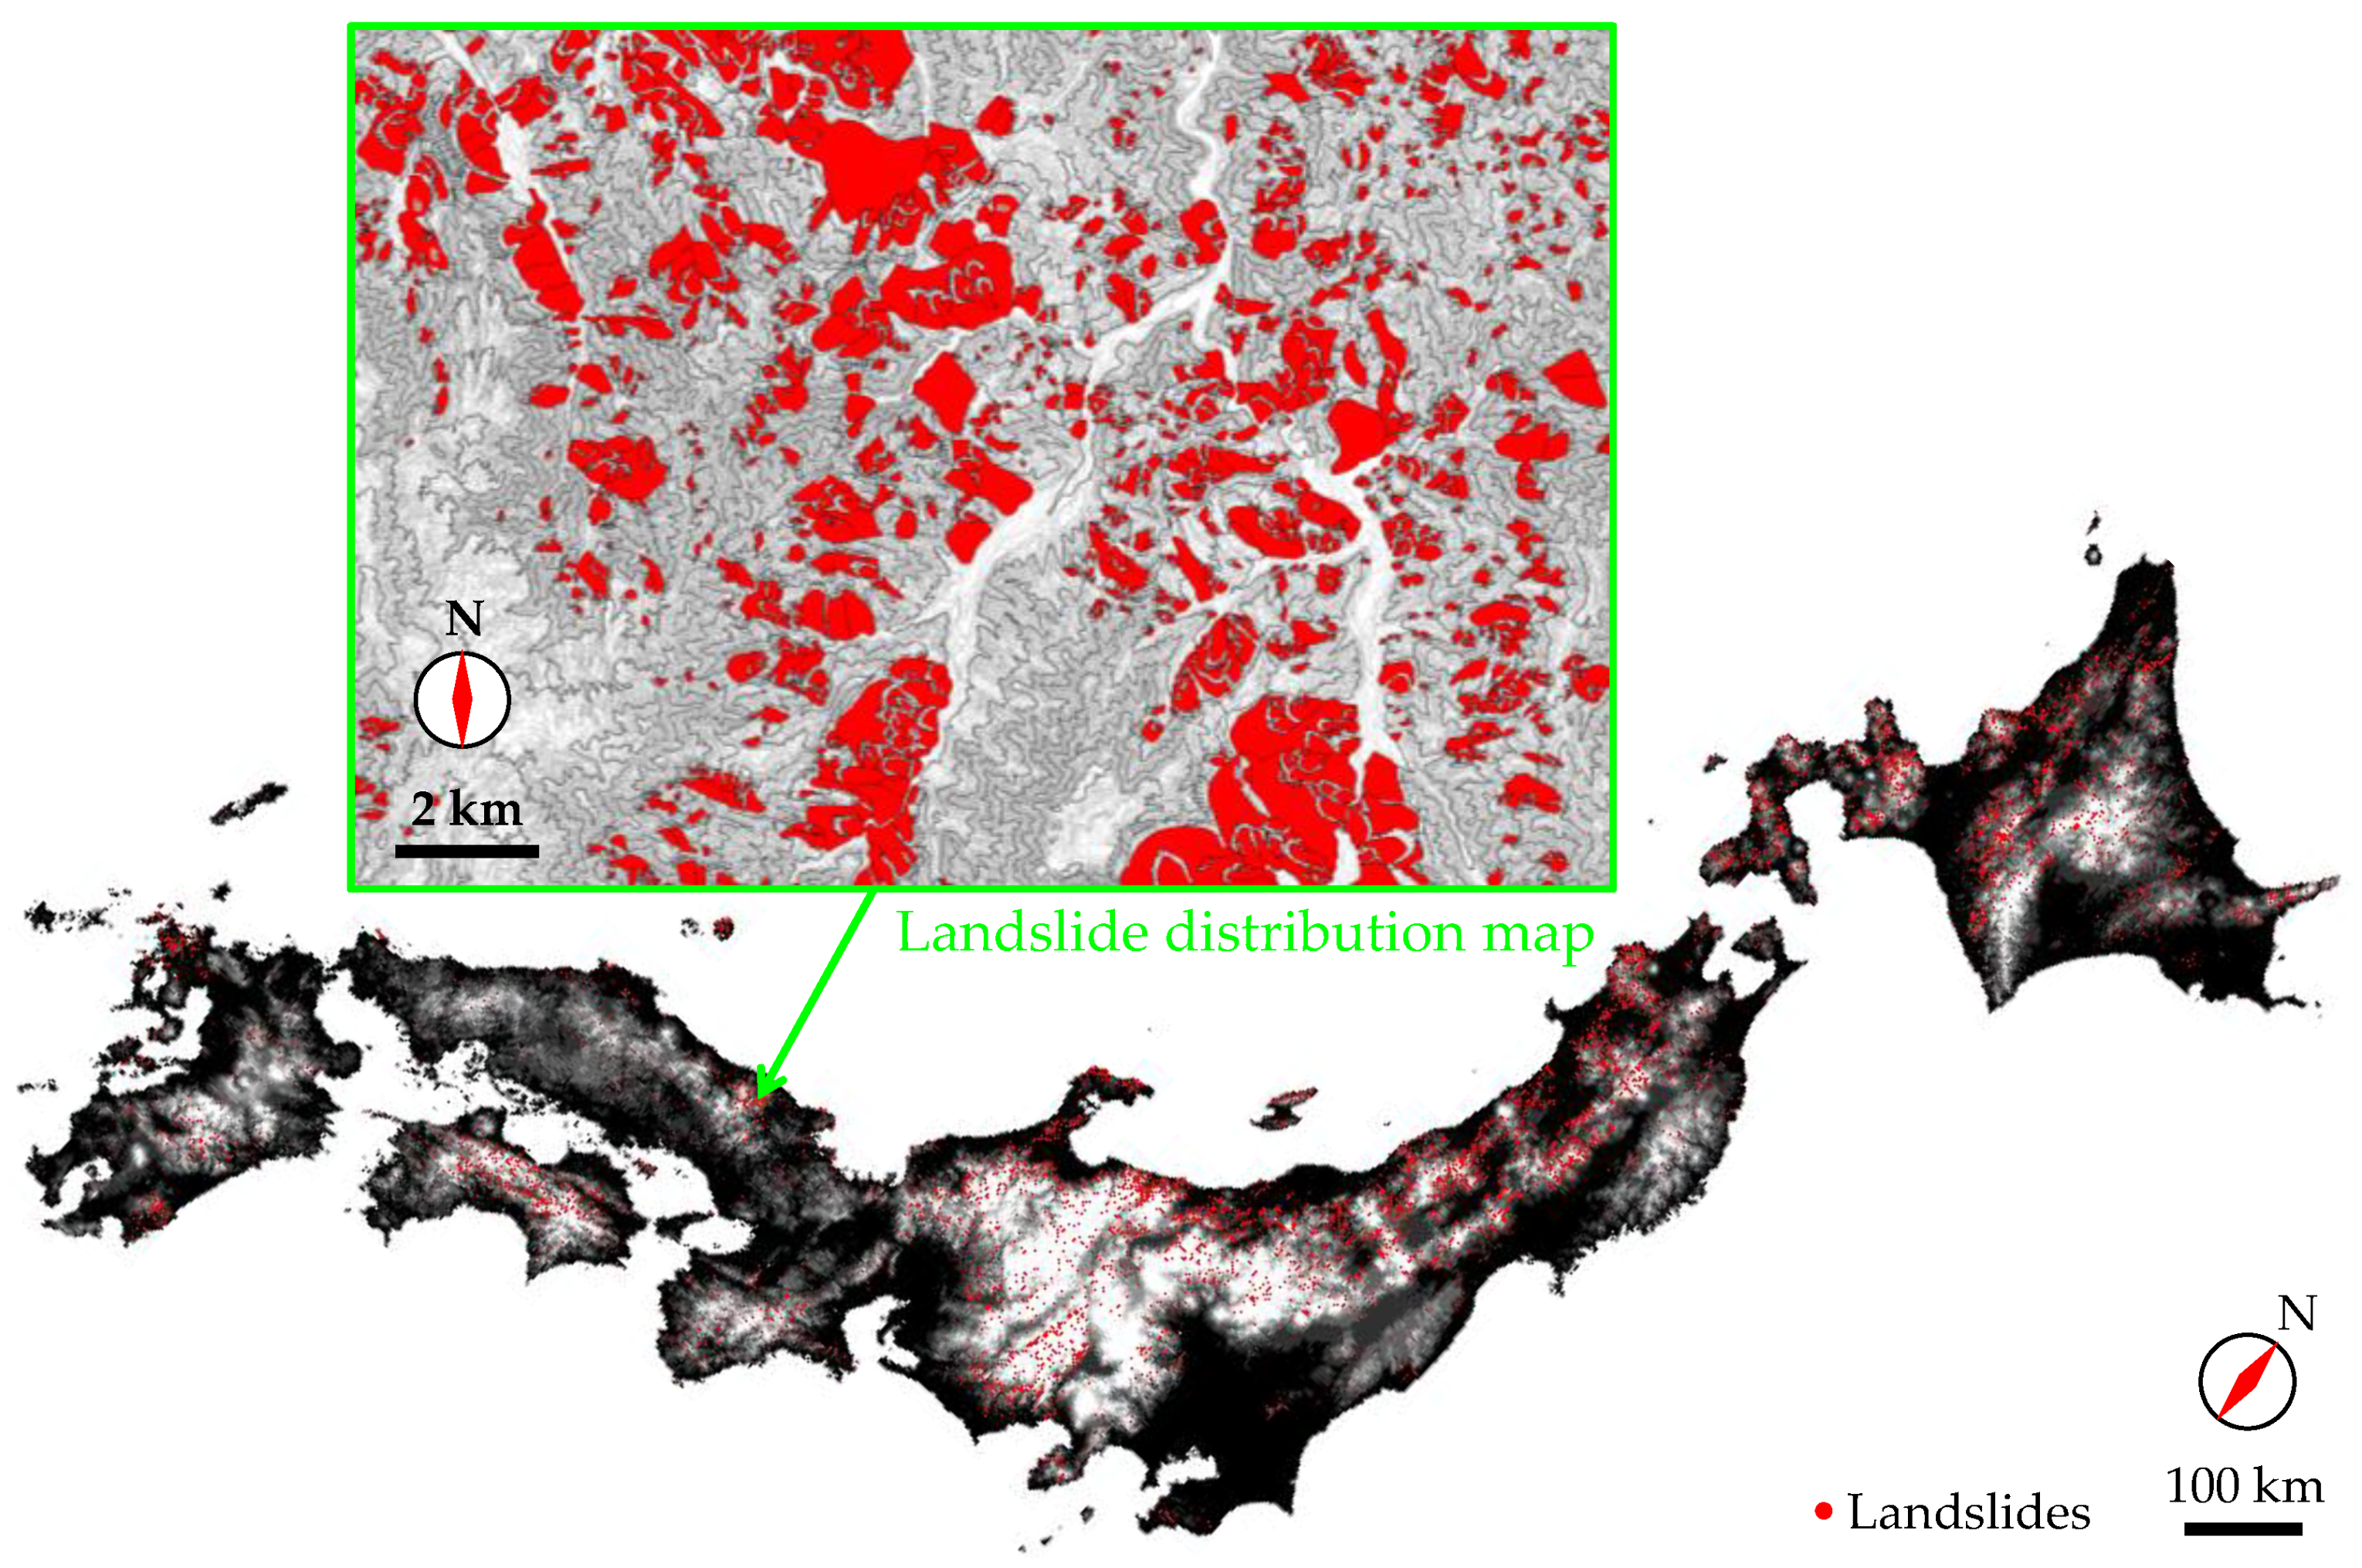
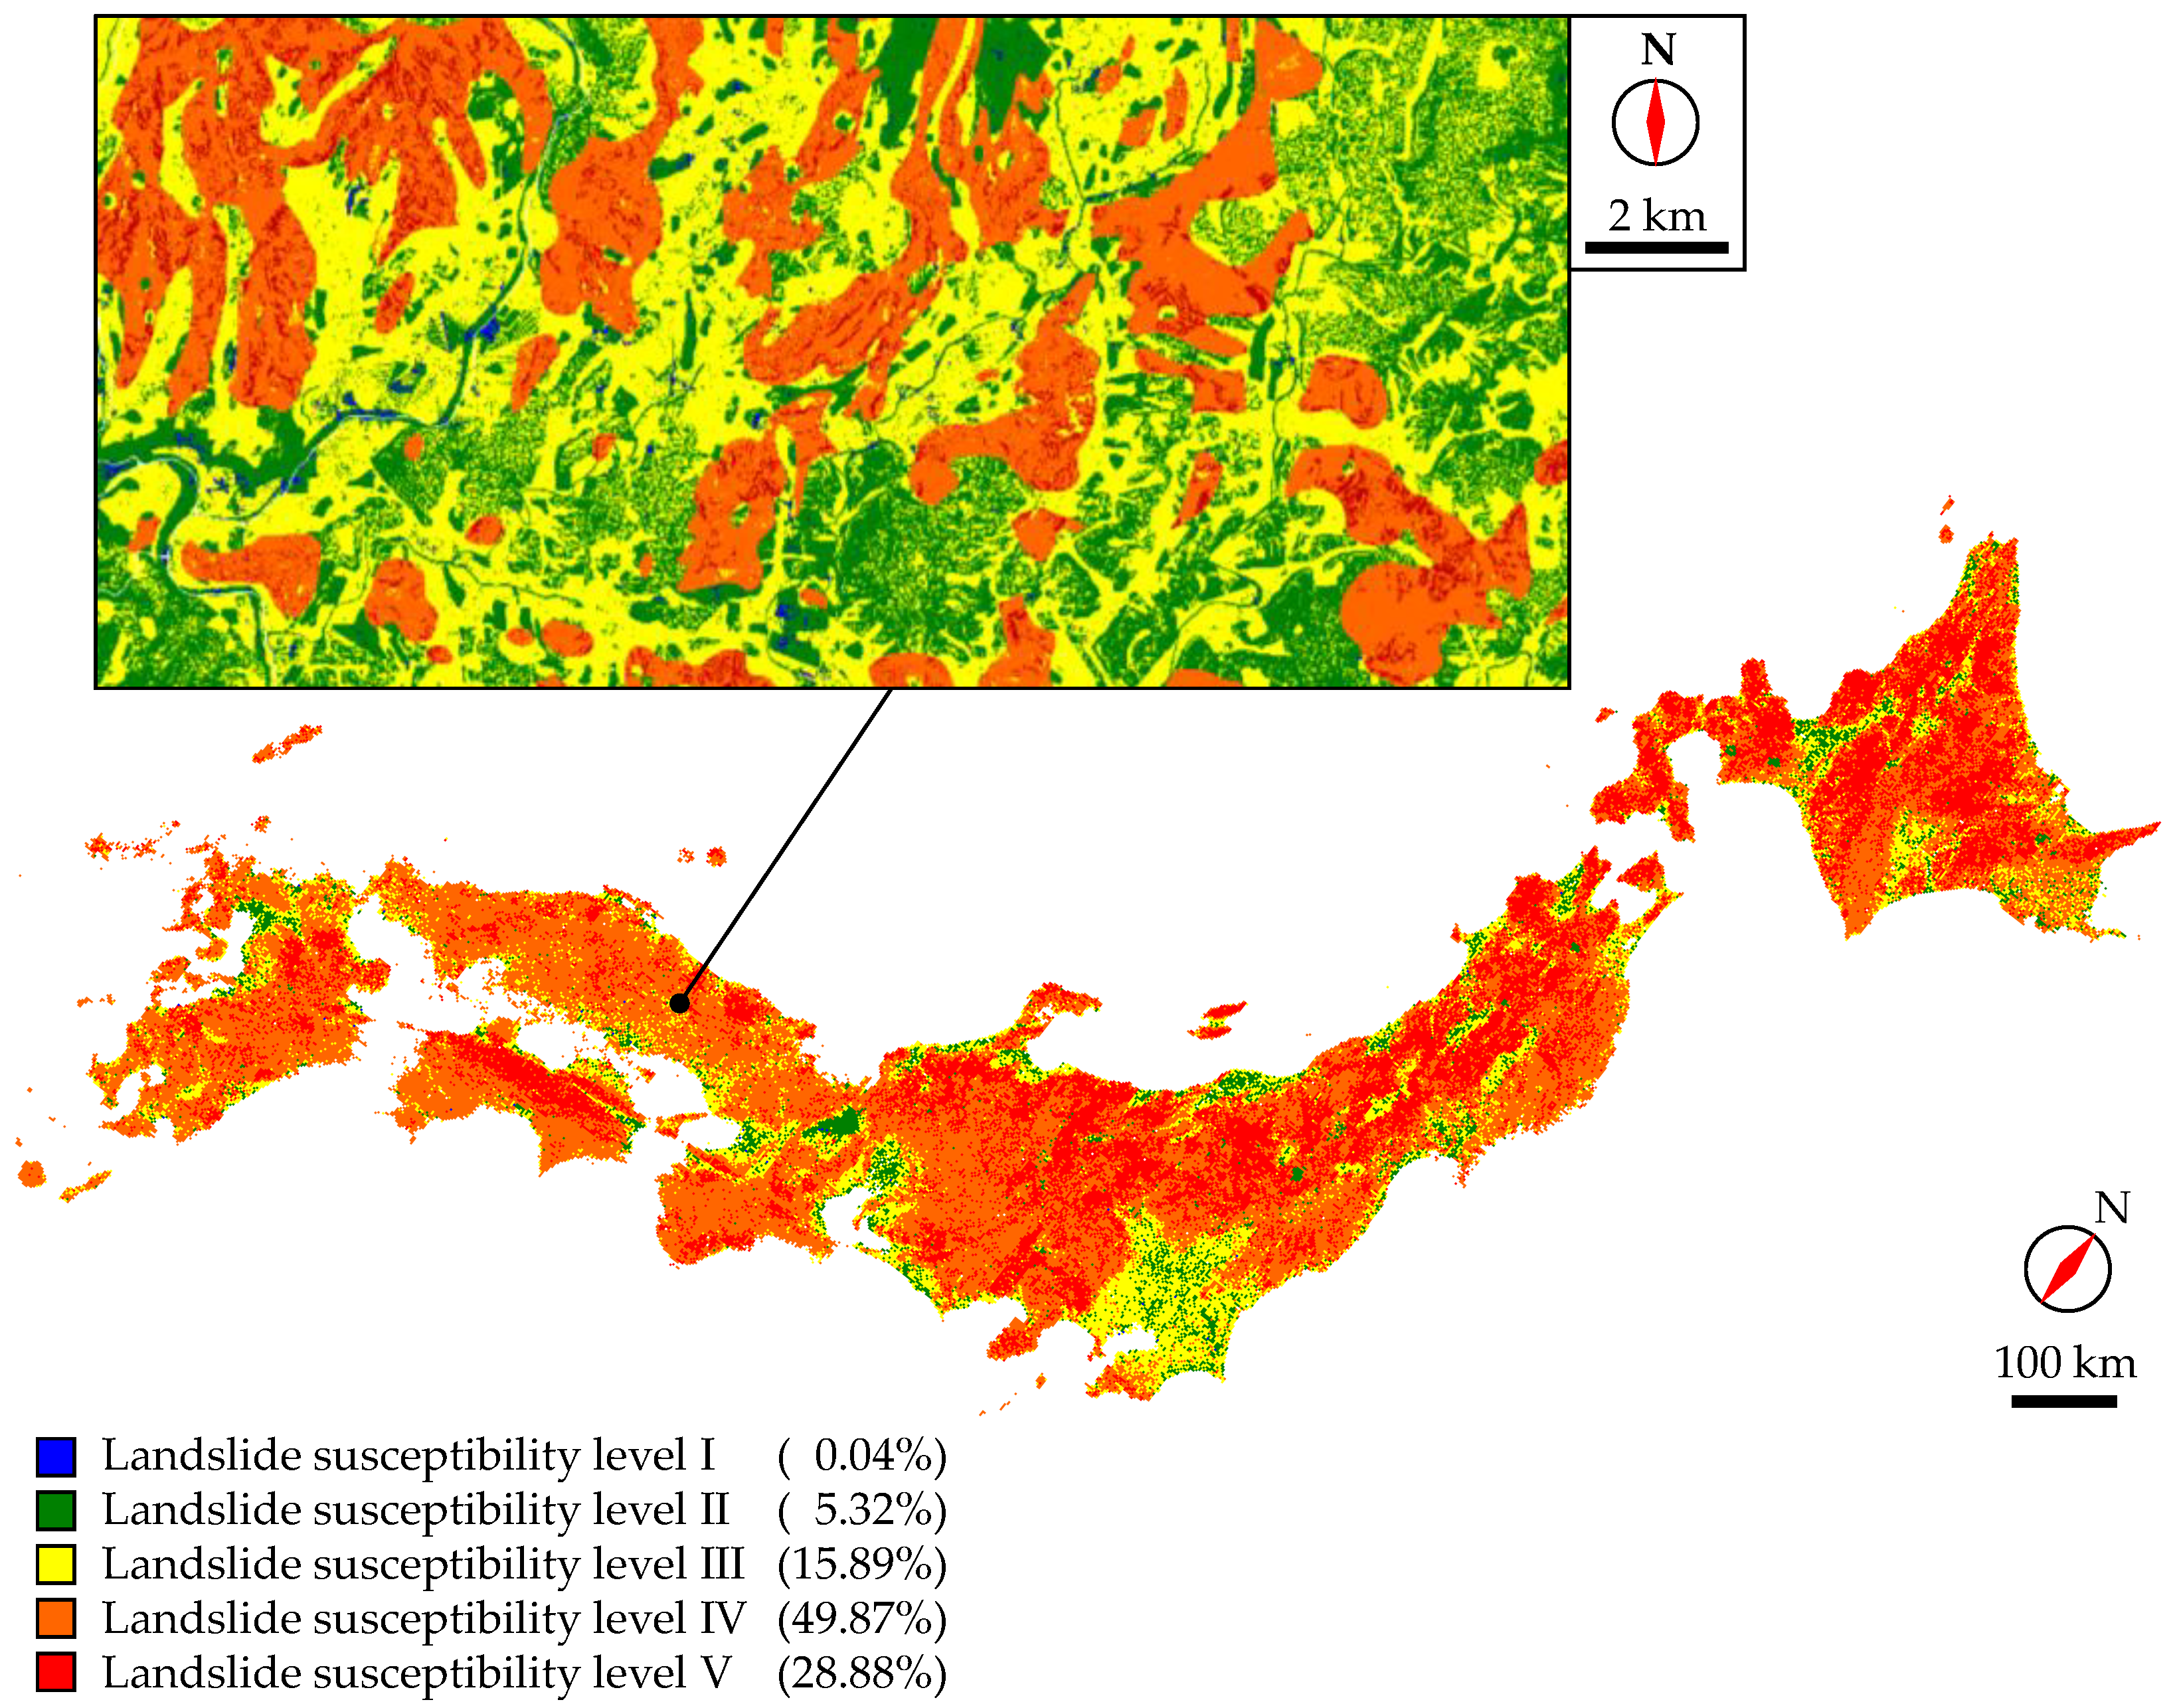
Figure 1.
Landslide distribution map in the Japanese archipelago based on the NIED [
2].
Figure 1.
Landslide distribution map in the Japanese archipelago based on the NIED [
2].
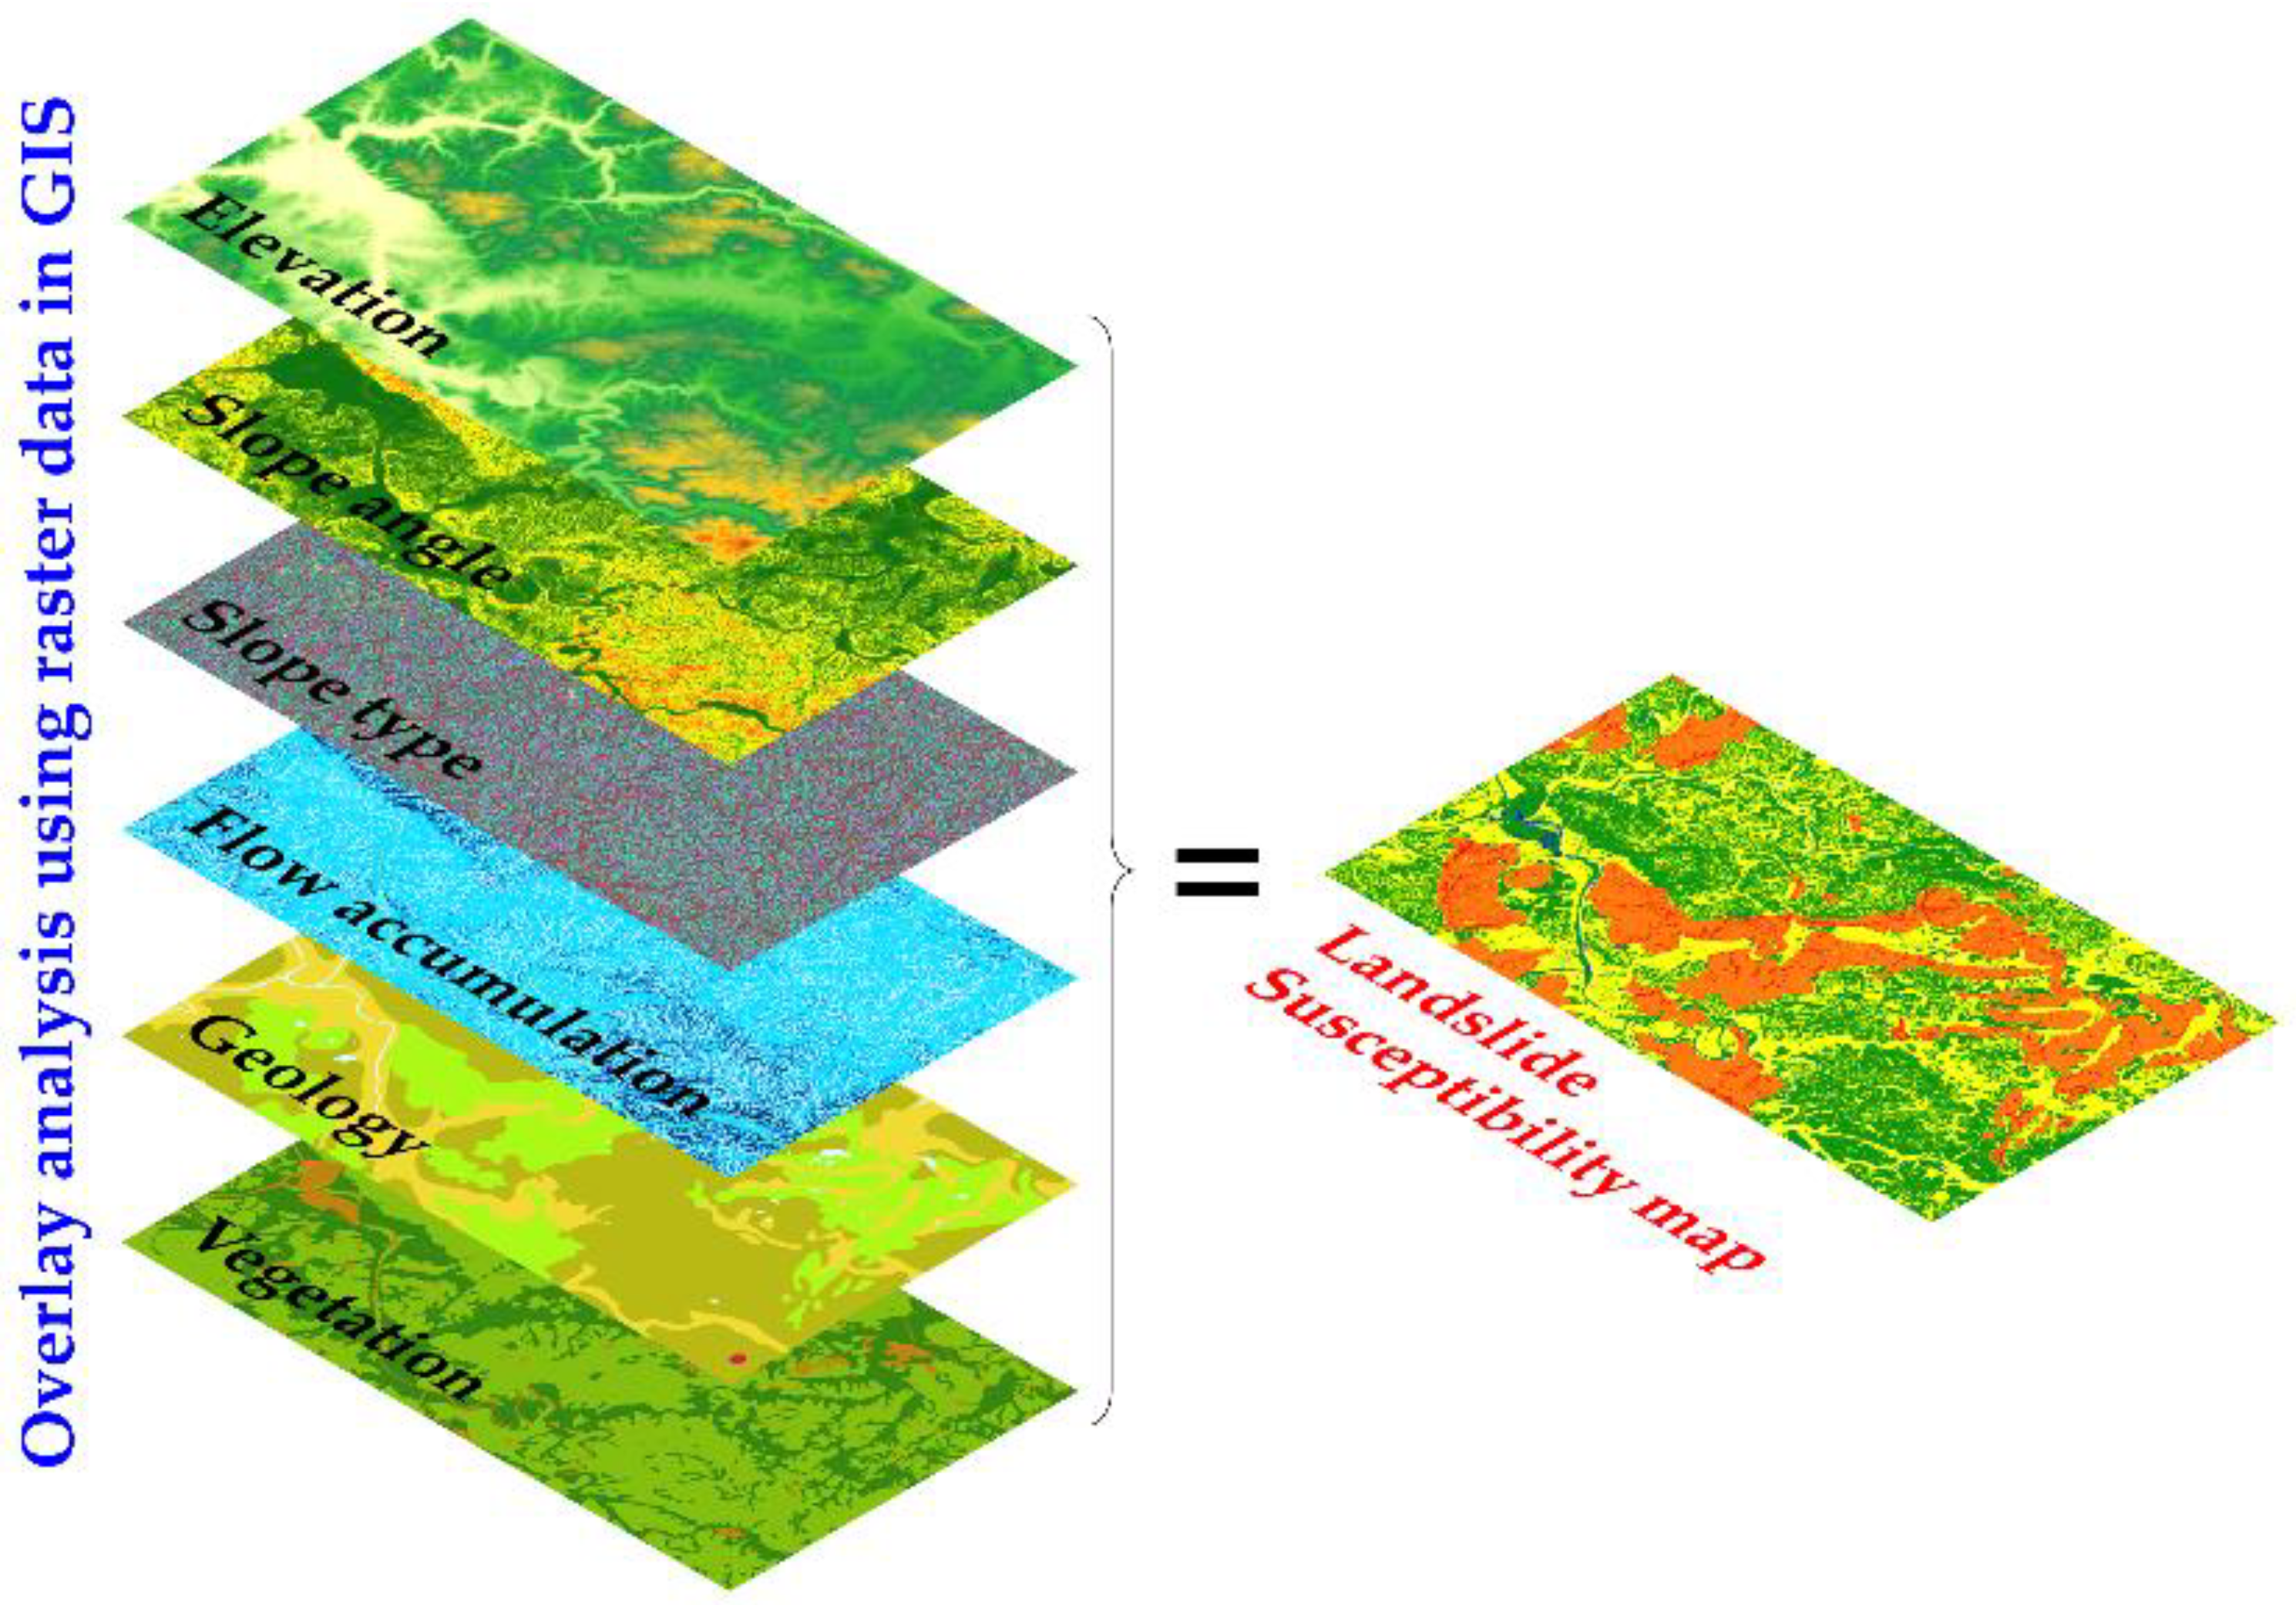
Figure 2.
Overlay of the GIS model raster data.
Figure 2.
Overlay of the GIS model raster data.
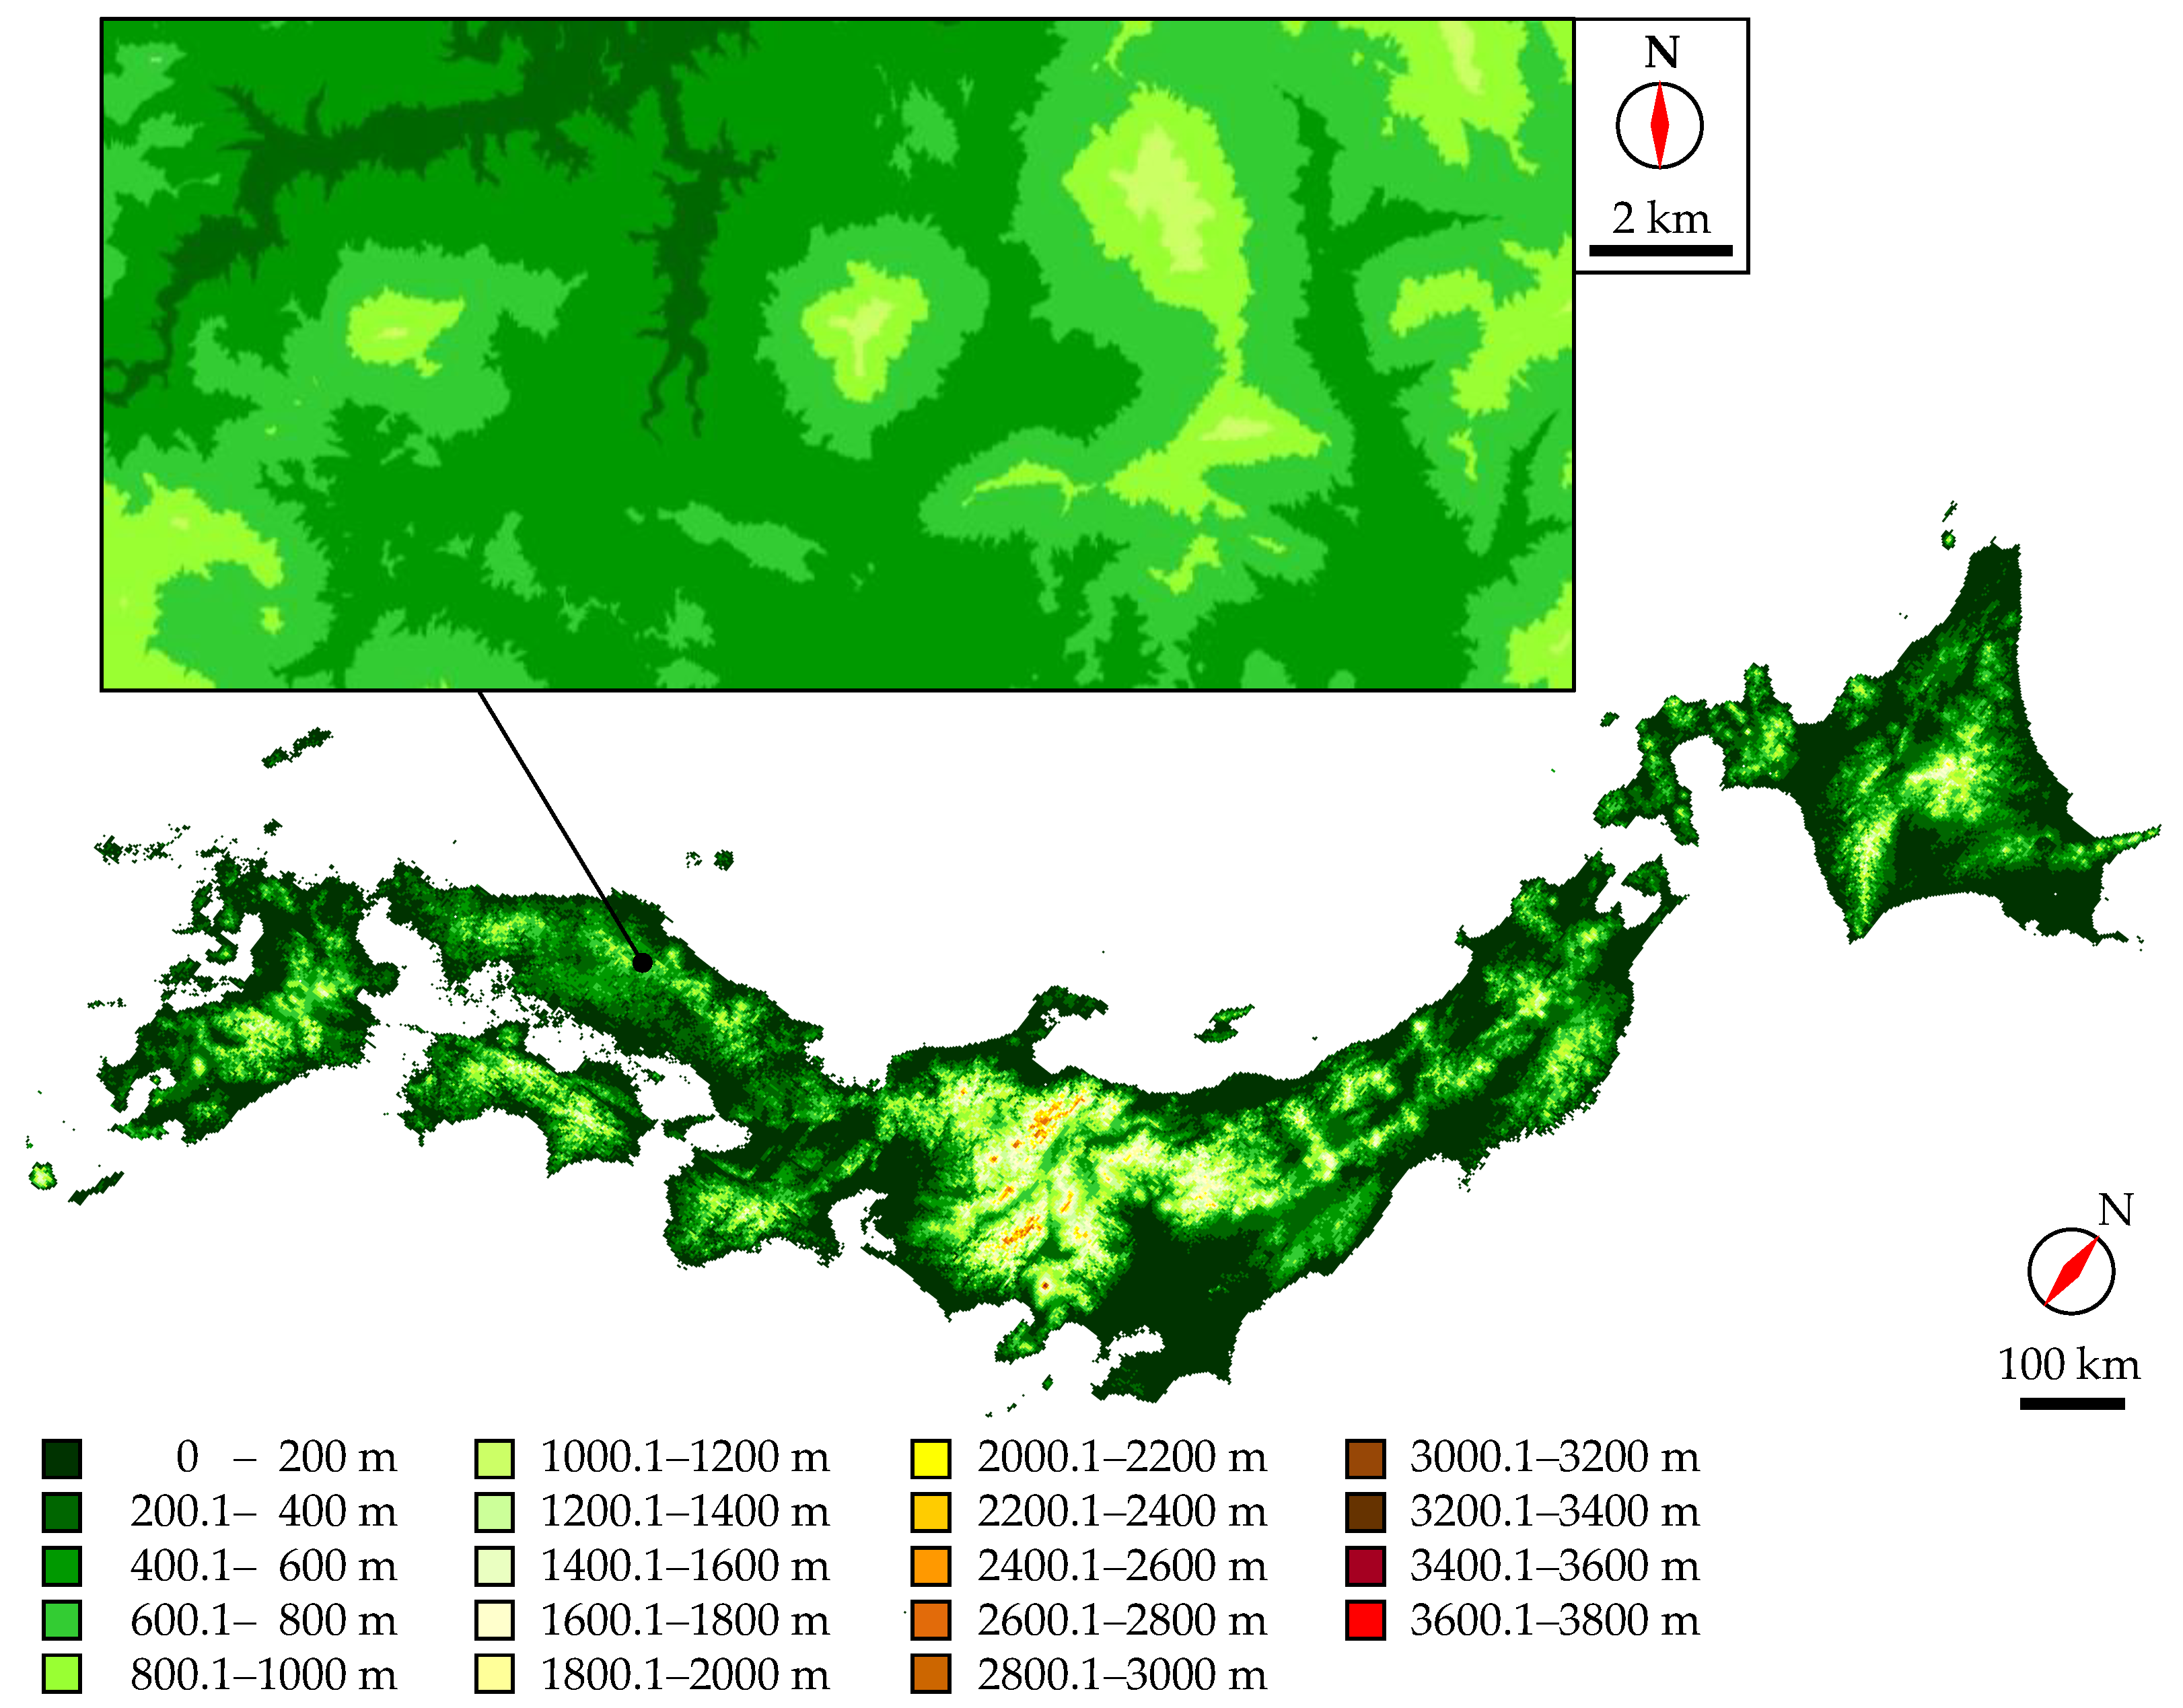
Figure 3.
Elevation map of the Japanese archipelago.
Figure 3.
Elevation map of the Japanese archipelago.
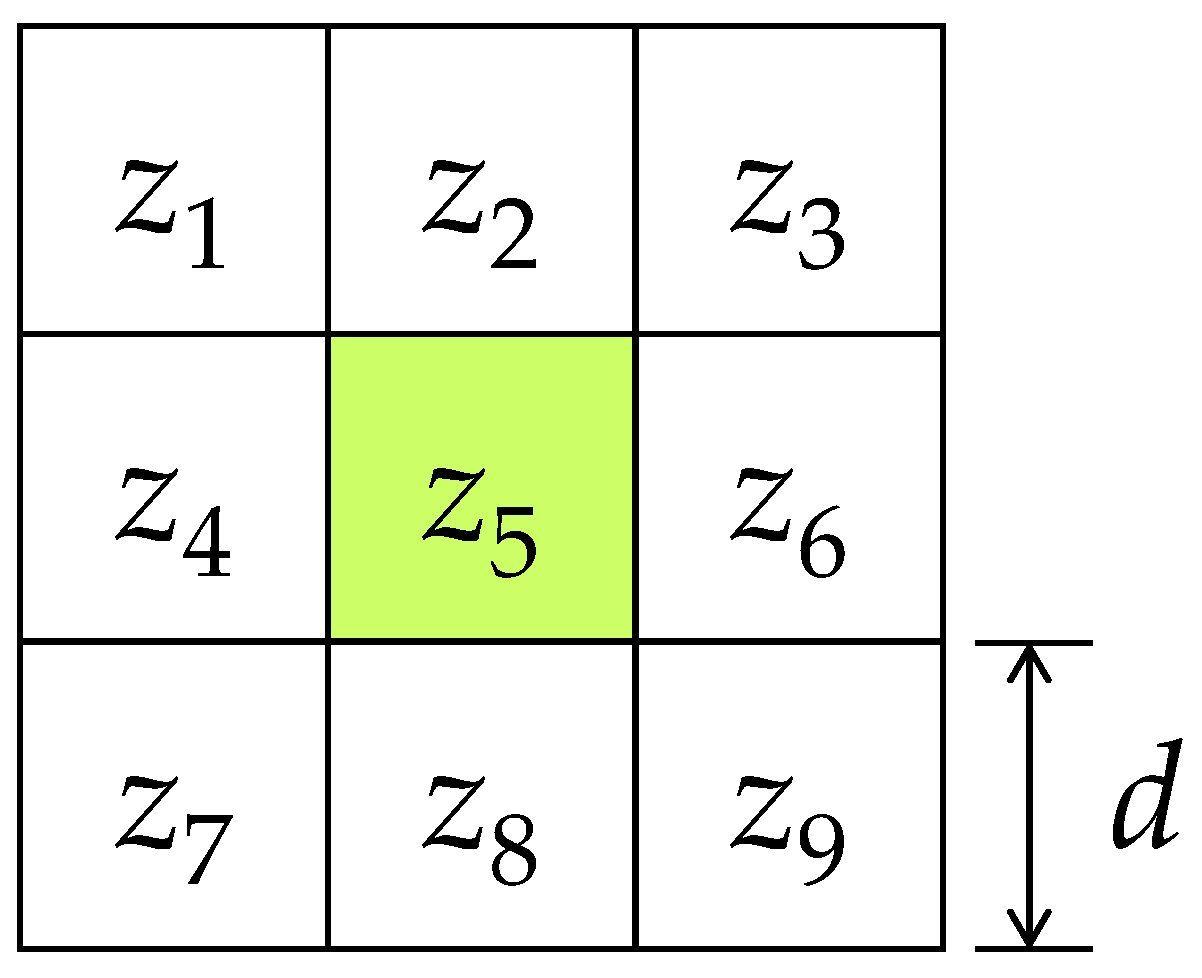
Figure 4.
Cell model for GIS surface analysis.
Figure 4.
Cell model for GIS surface analysis.
Figure 5.
Slope angle map of the Japanese archipelago.
Figure 5.
Slope angle map of the Japanese archipelago.
Figure 6.
Slope type map of the Japanese archipelago.
Figure 6.
Slope type map of the Japanese archipelago.
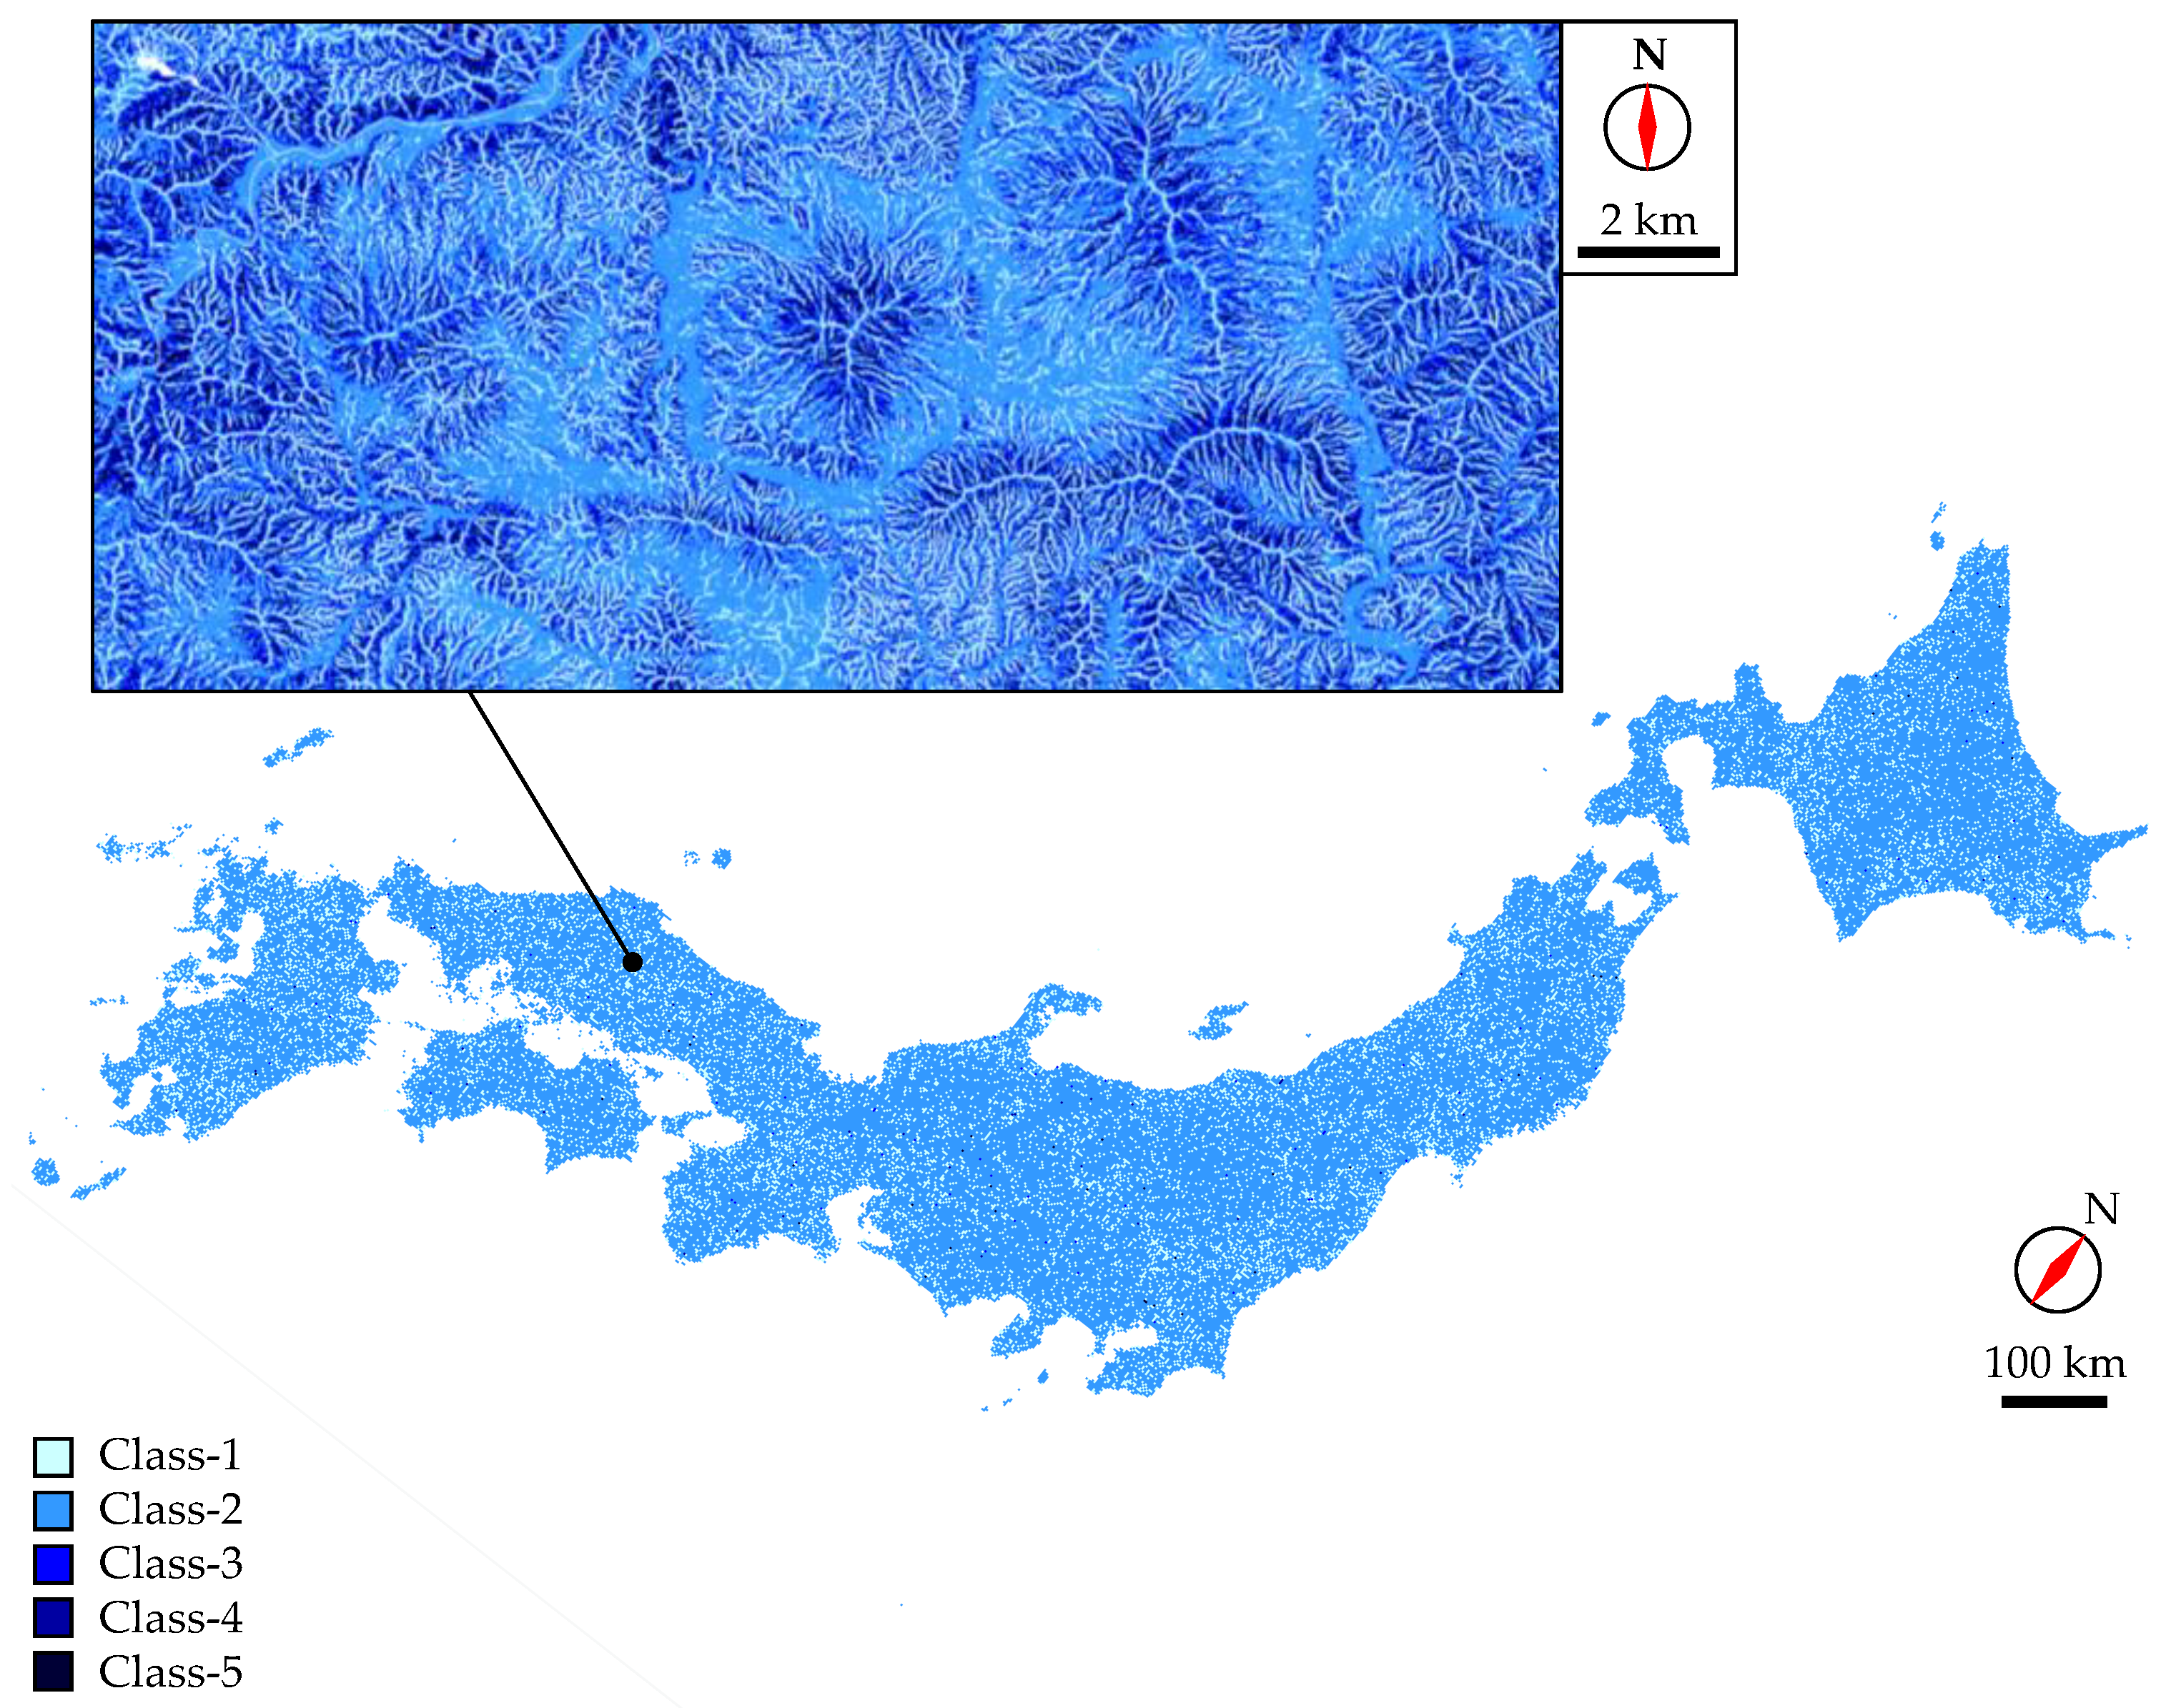
Figure 7.
Flow accumulation map of the Japanese archipelago.
Figure 7.
Flow accumulation map of the Japanese archipelago.
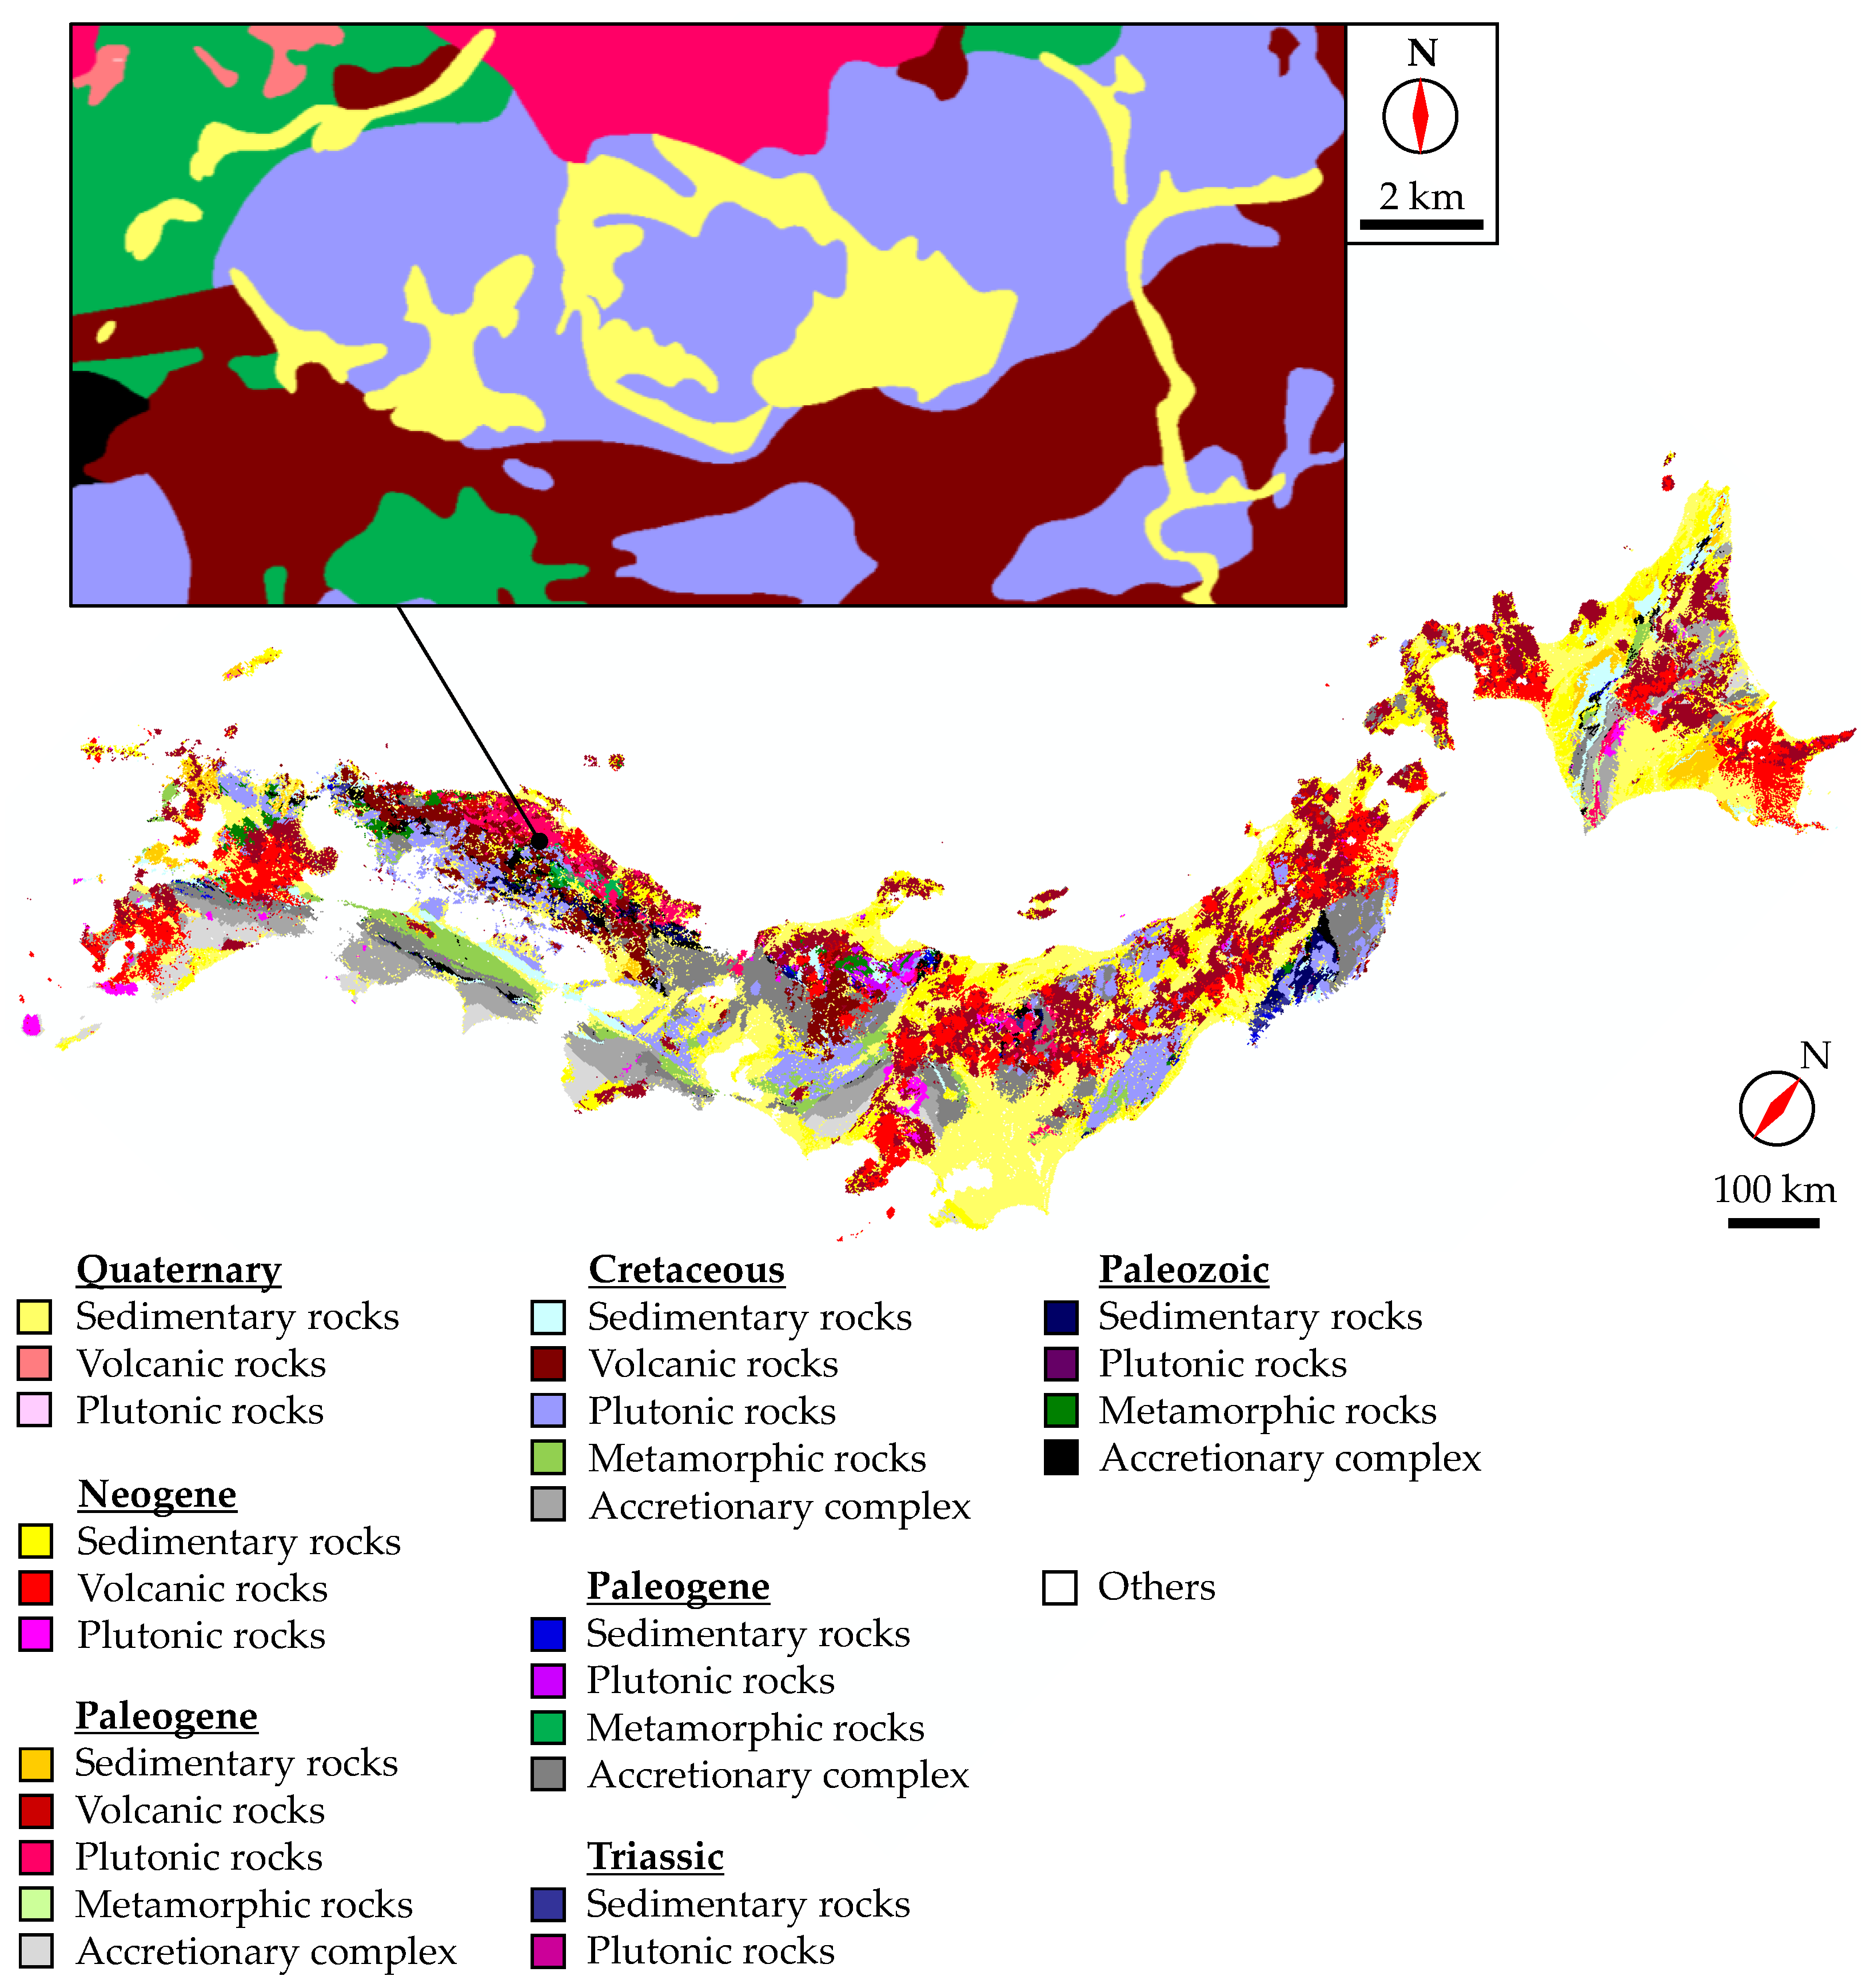
Figure 8.
Geological map of the Japanese archipelago.
Figure 8.
Geological map of the Japanese archipelago.
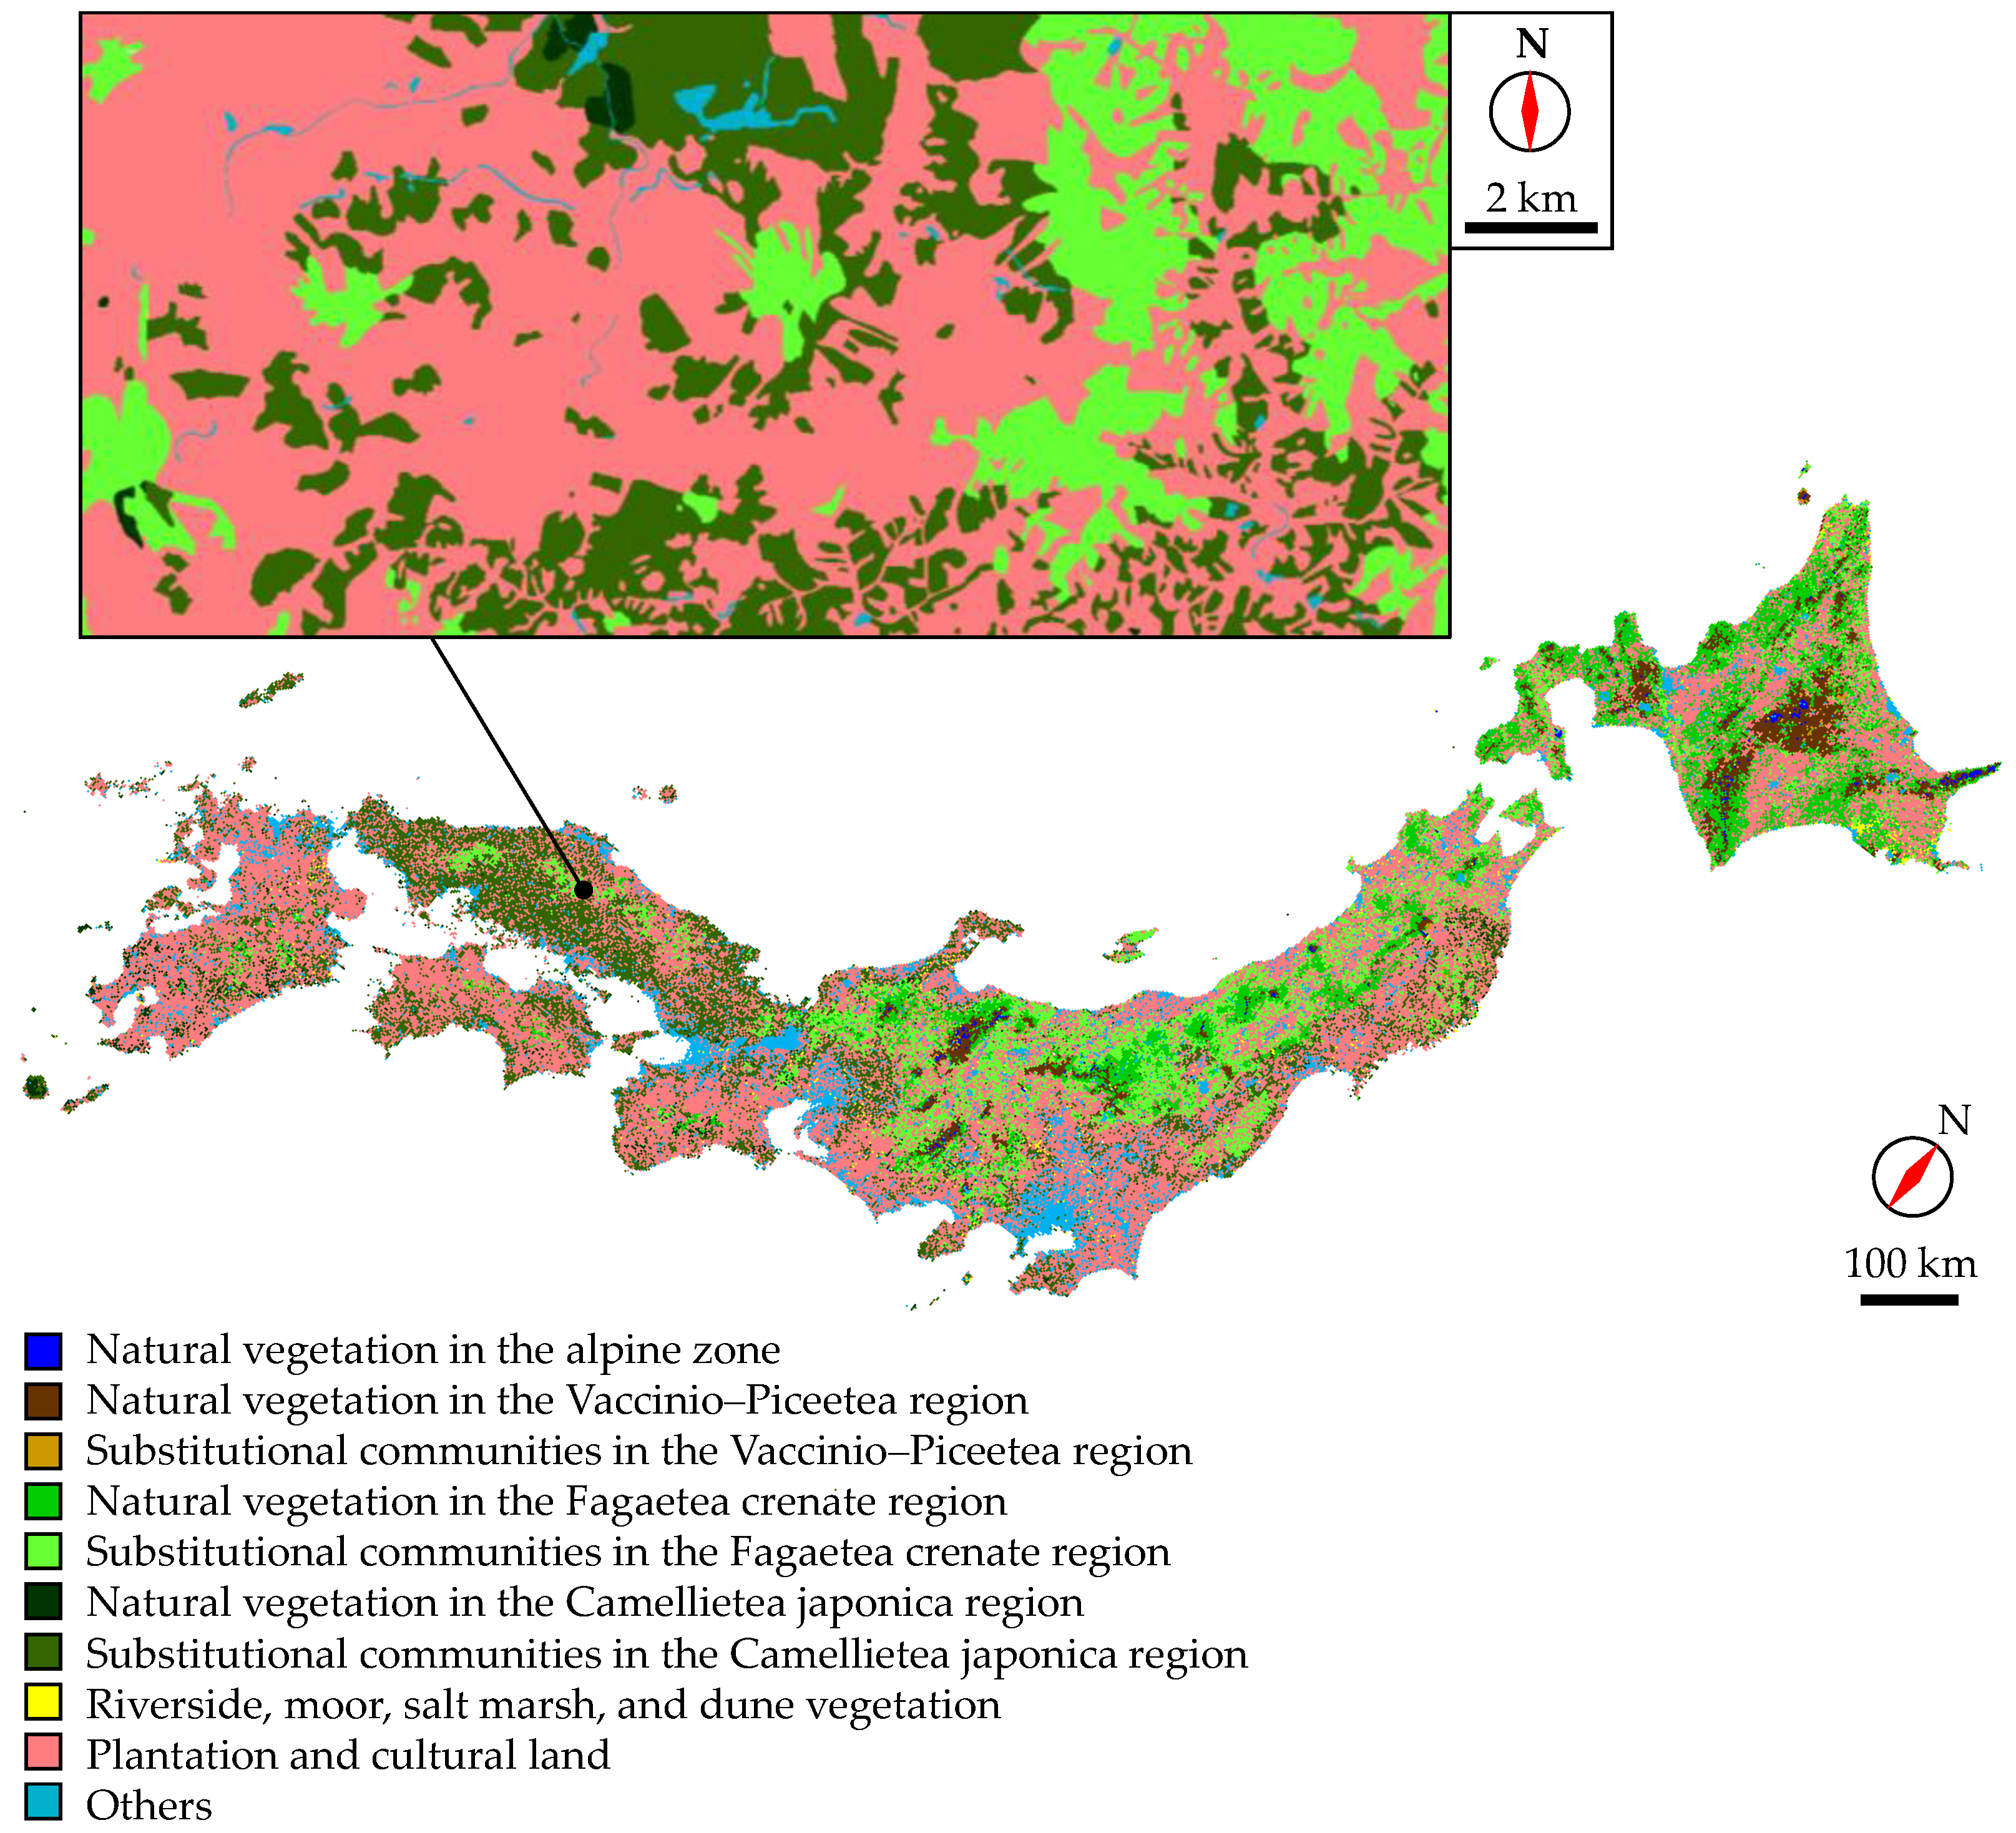
Figure 9.
Vegetation map of the Japanese archipelago.
Figure 9.
Vegetation map of the Japanese archipelago.
Figure 10.
Hierarchy structure of the AHP for landslide susceptibility mapping. Characters in the parentheses are the abbreviations.
LSS is landslide susceptibility score in
Section 5.4.
Figure 10.
Hierarchy structure of the AHP for landslide susceptibility mapping. Characters in the parentheses are the abbreviations.
LSS is landslide susceptibility score in
Section 5.4.
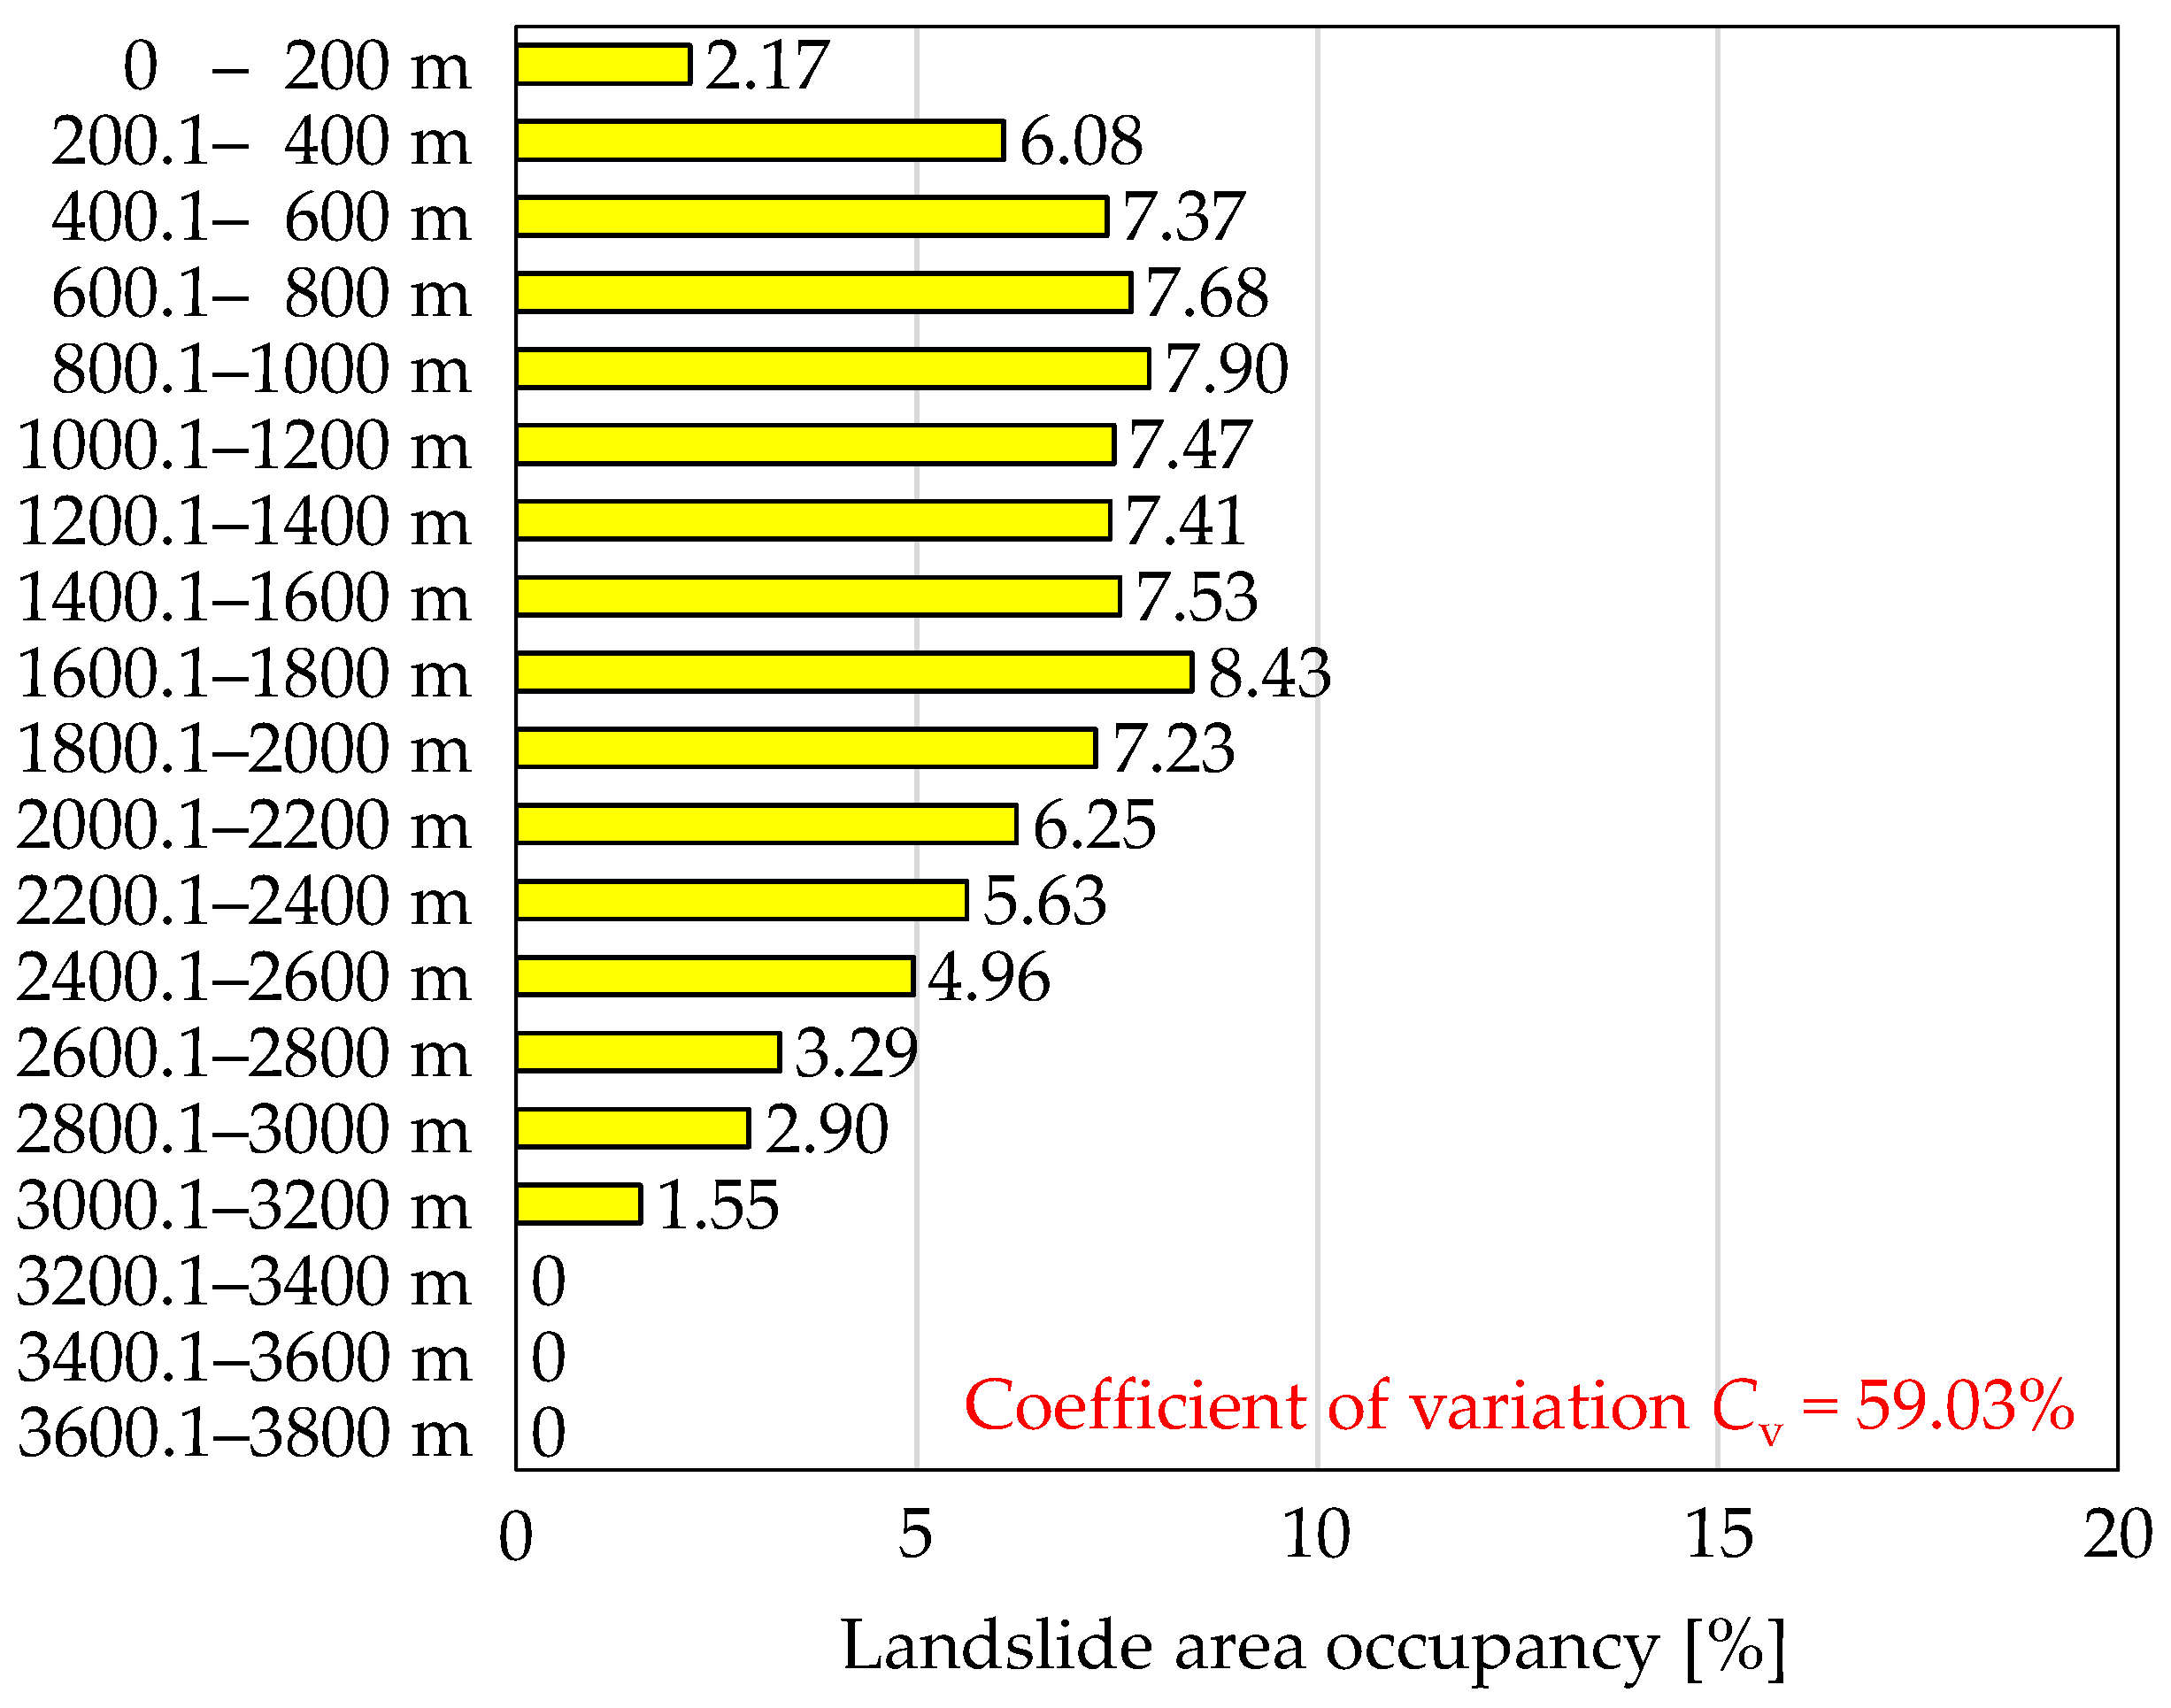
Figure 11.
Relationship between landslide distribution and elevation. Abbreviations in this figure correspond to those used in
Figure 10.
Figure 11.
Relationship between landslide distribution and elevation. Abbreviations in this figure correspond to those used in
Figure 10.
Figure 12.
Relationship between landslide distribution and slope angle.
Figure 12.
Relationship between landslide distribution and slope angle.
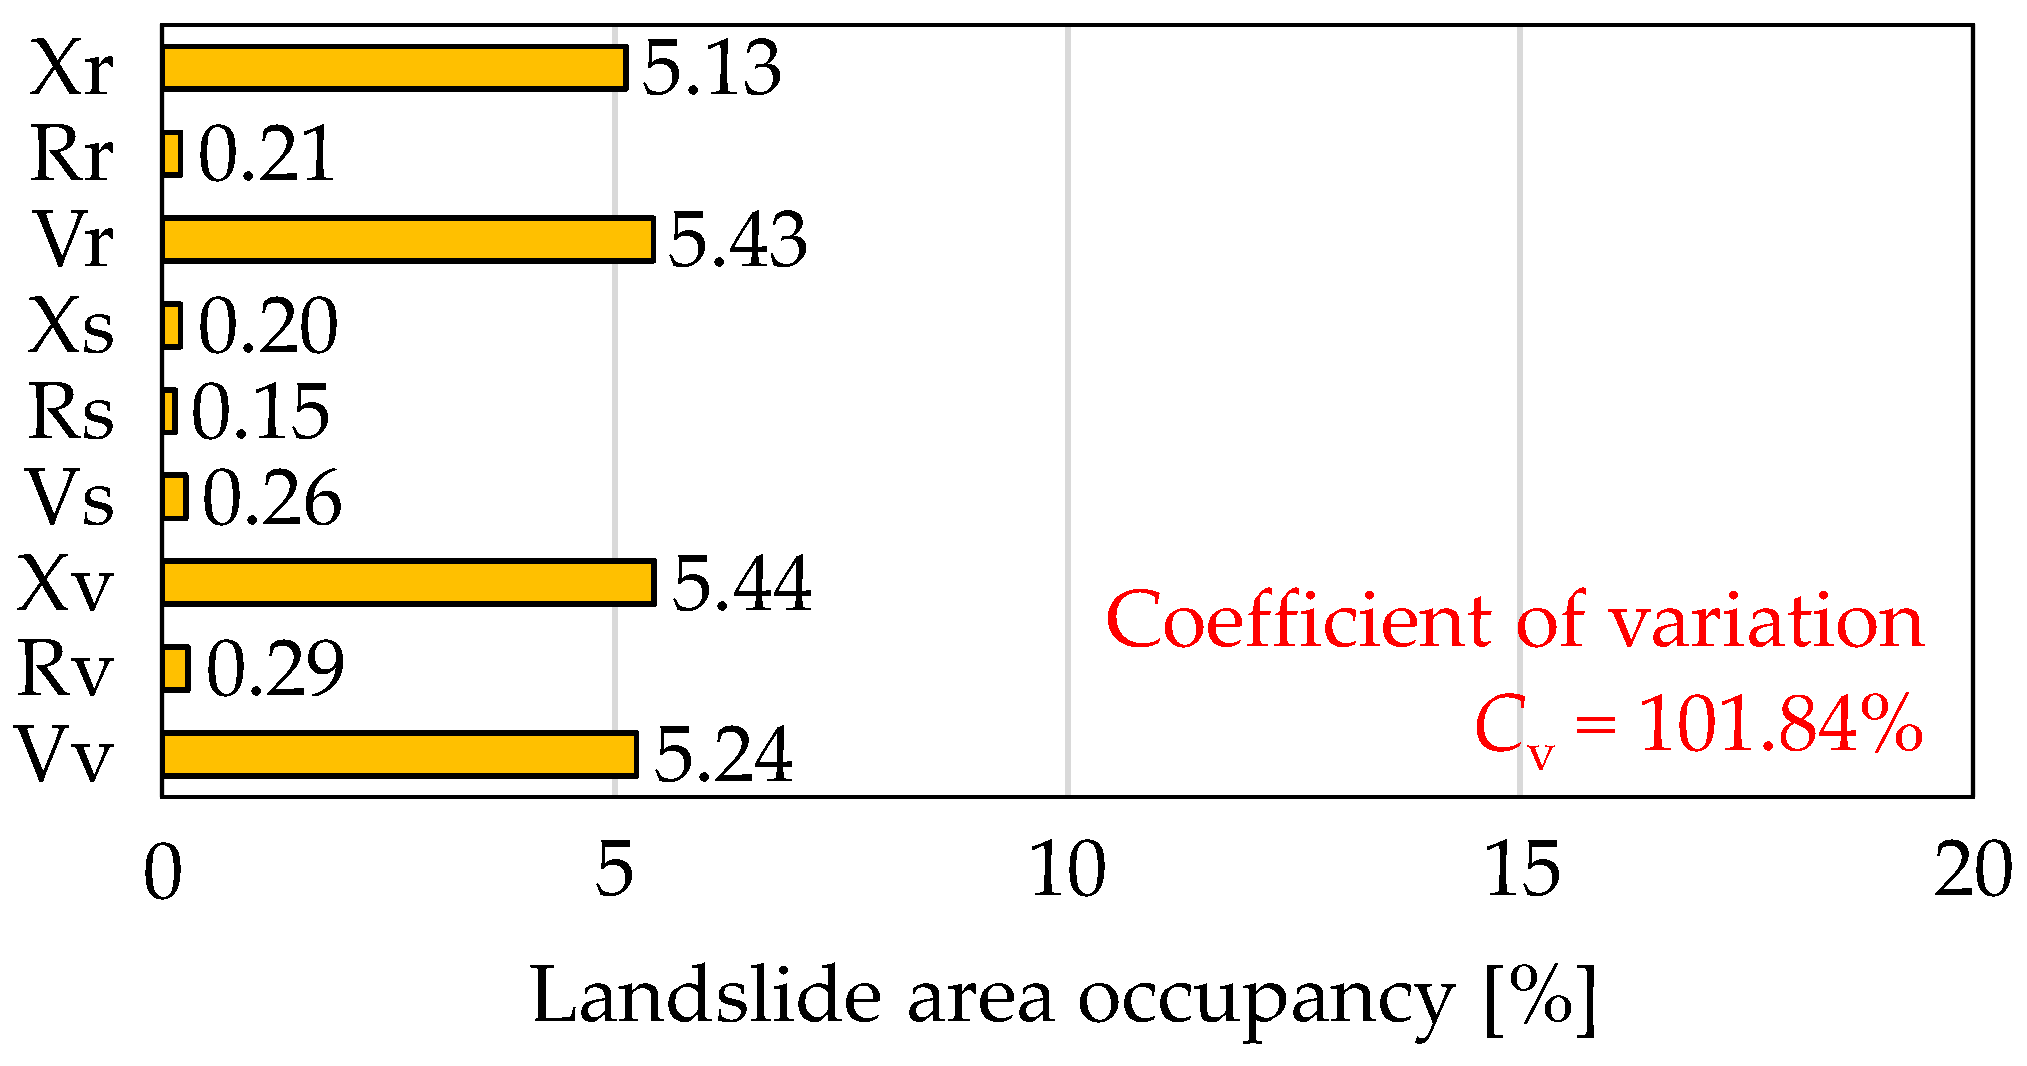
Figure 13.
Relationship between landslide distribution and slope type. Abbreviations in this figure correspond to those used in
Figure 10.
Figure 13.
Relationship between landslide distribution and slope type. Abbreviations in this figure correspond to those used in
Figure 10.
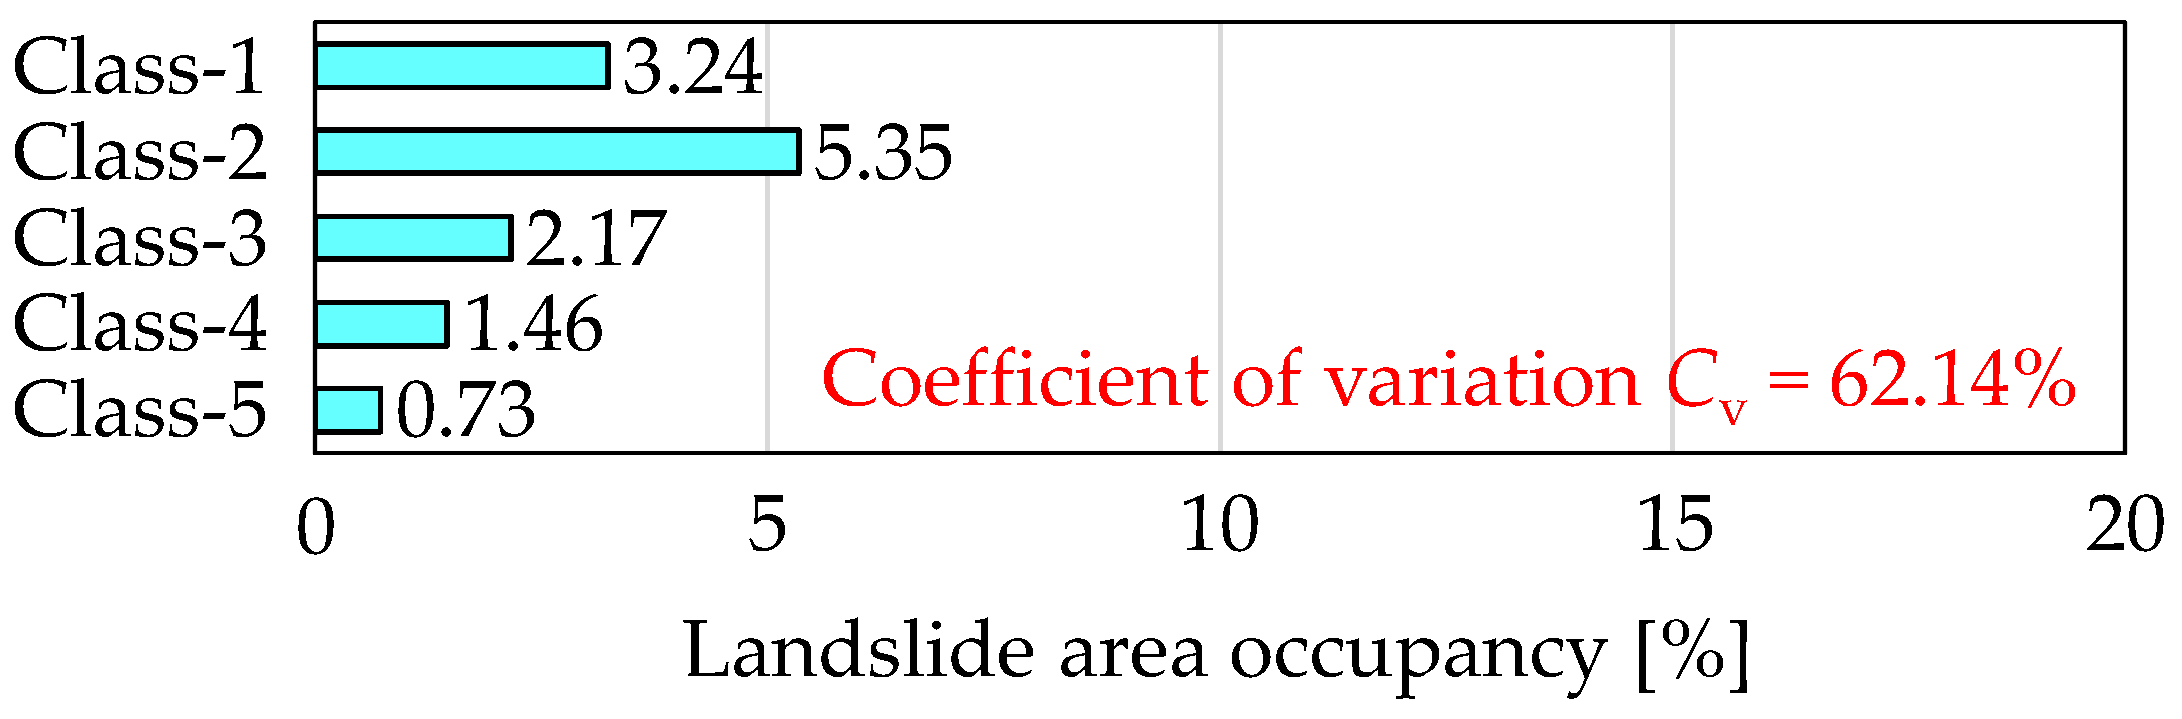
Figure 14.
Relationship between landslide distribution and flow accumulation.
Figure 14.
Relationship between landslide distribution and flow accumulation.
Figure 15.
Relationship between landslide distribution and geology. Abbreviations in this figure correspond to those used in
Figure 10.
Figure 15.
Relationship between landslide distribution and geology. Abbreviations in this figure correspond to those used in
Figure 10.
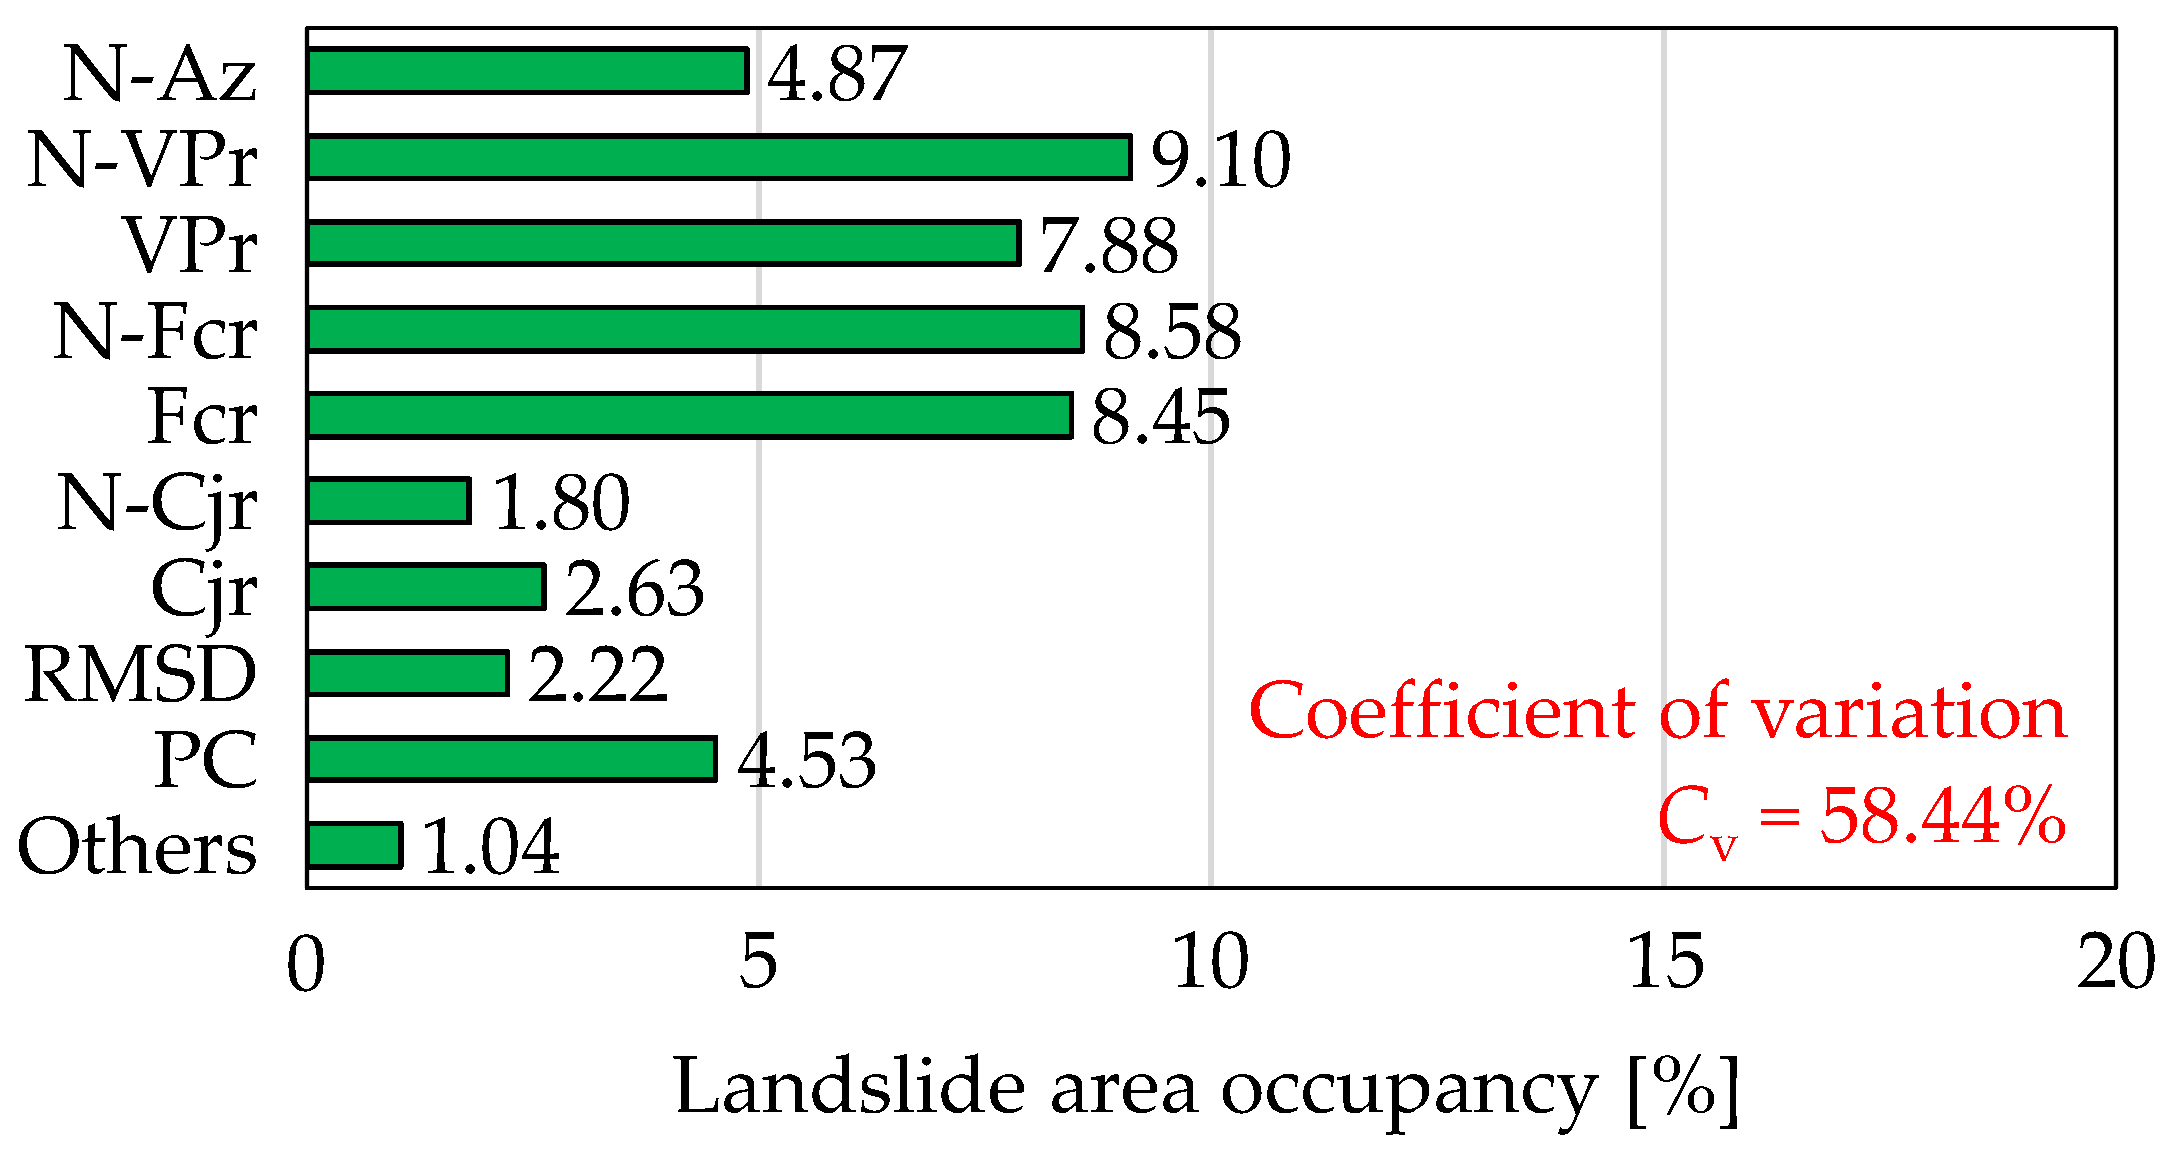
Figure 16.
Relationship between landslide distribution and vegetation. Abbreviations in this figure correspond to those used in
Figure 10.
Figure 16.
Relationship between landslide distribution and vegetation. Abbreviations in this figure correspond to those used in
Figure 10.
Figure 17.
Landslide susceptibility map of the Japanese archipelago.
Figure 17.
Landslide susceptibility map of the Japanese archipelago.
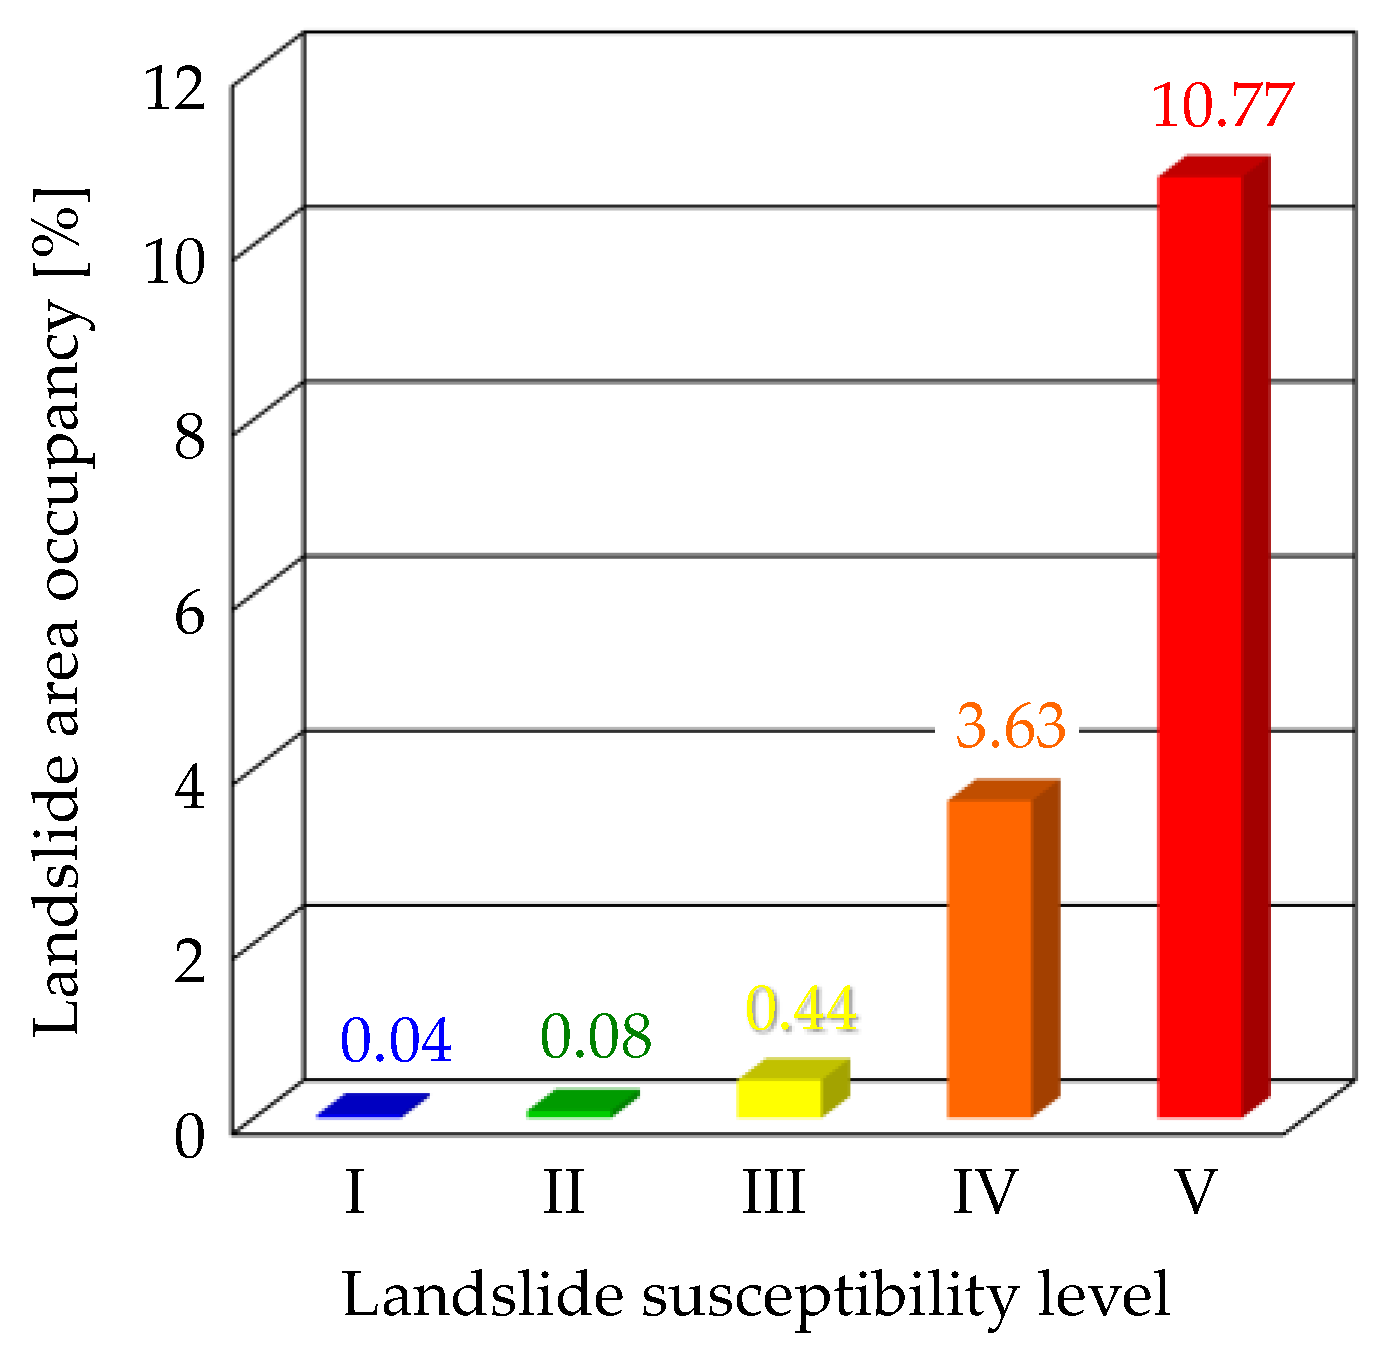
Figure 18.
Relationship between landslide susceptibility level and distribution in the landslide susceptibility map shown in
Figure 17.
Figure 18.
Relationship between landslide susceptibility level and distribution in the landslide susceptibility map shown in
Figure 17.
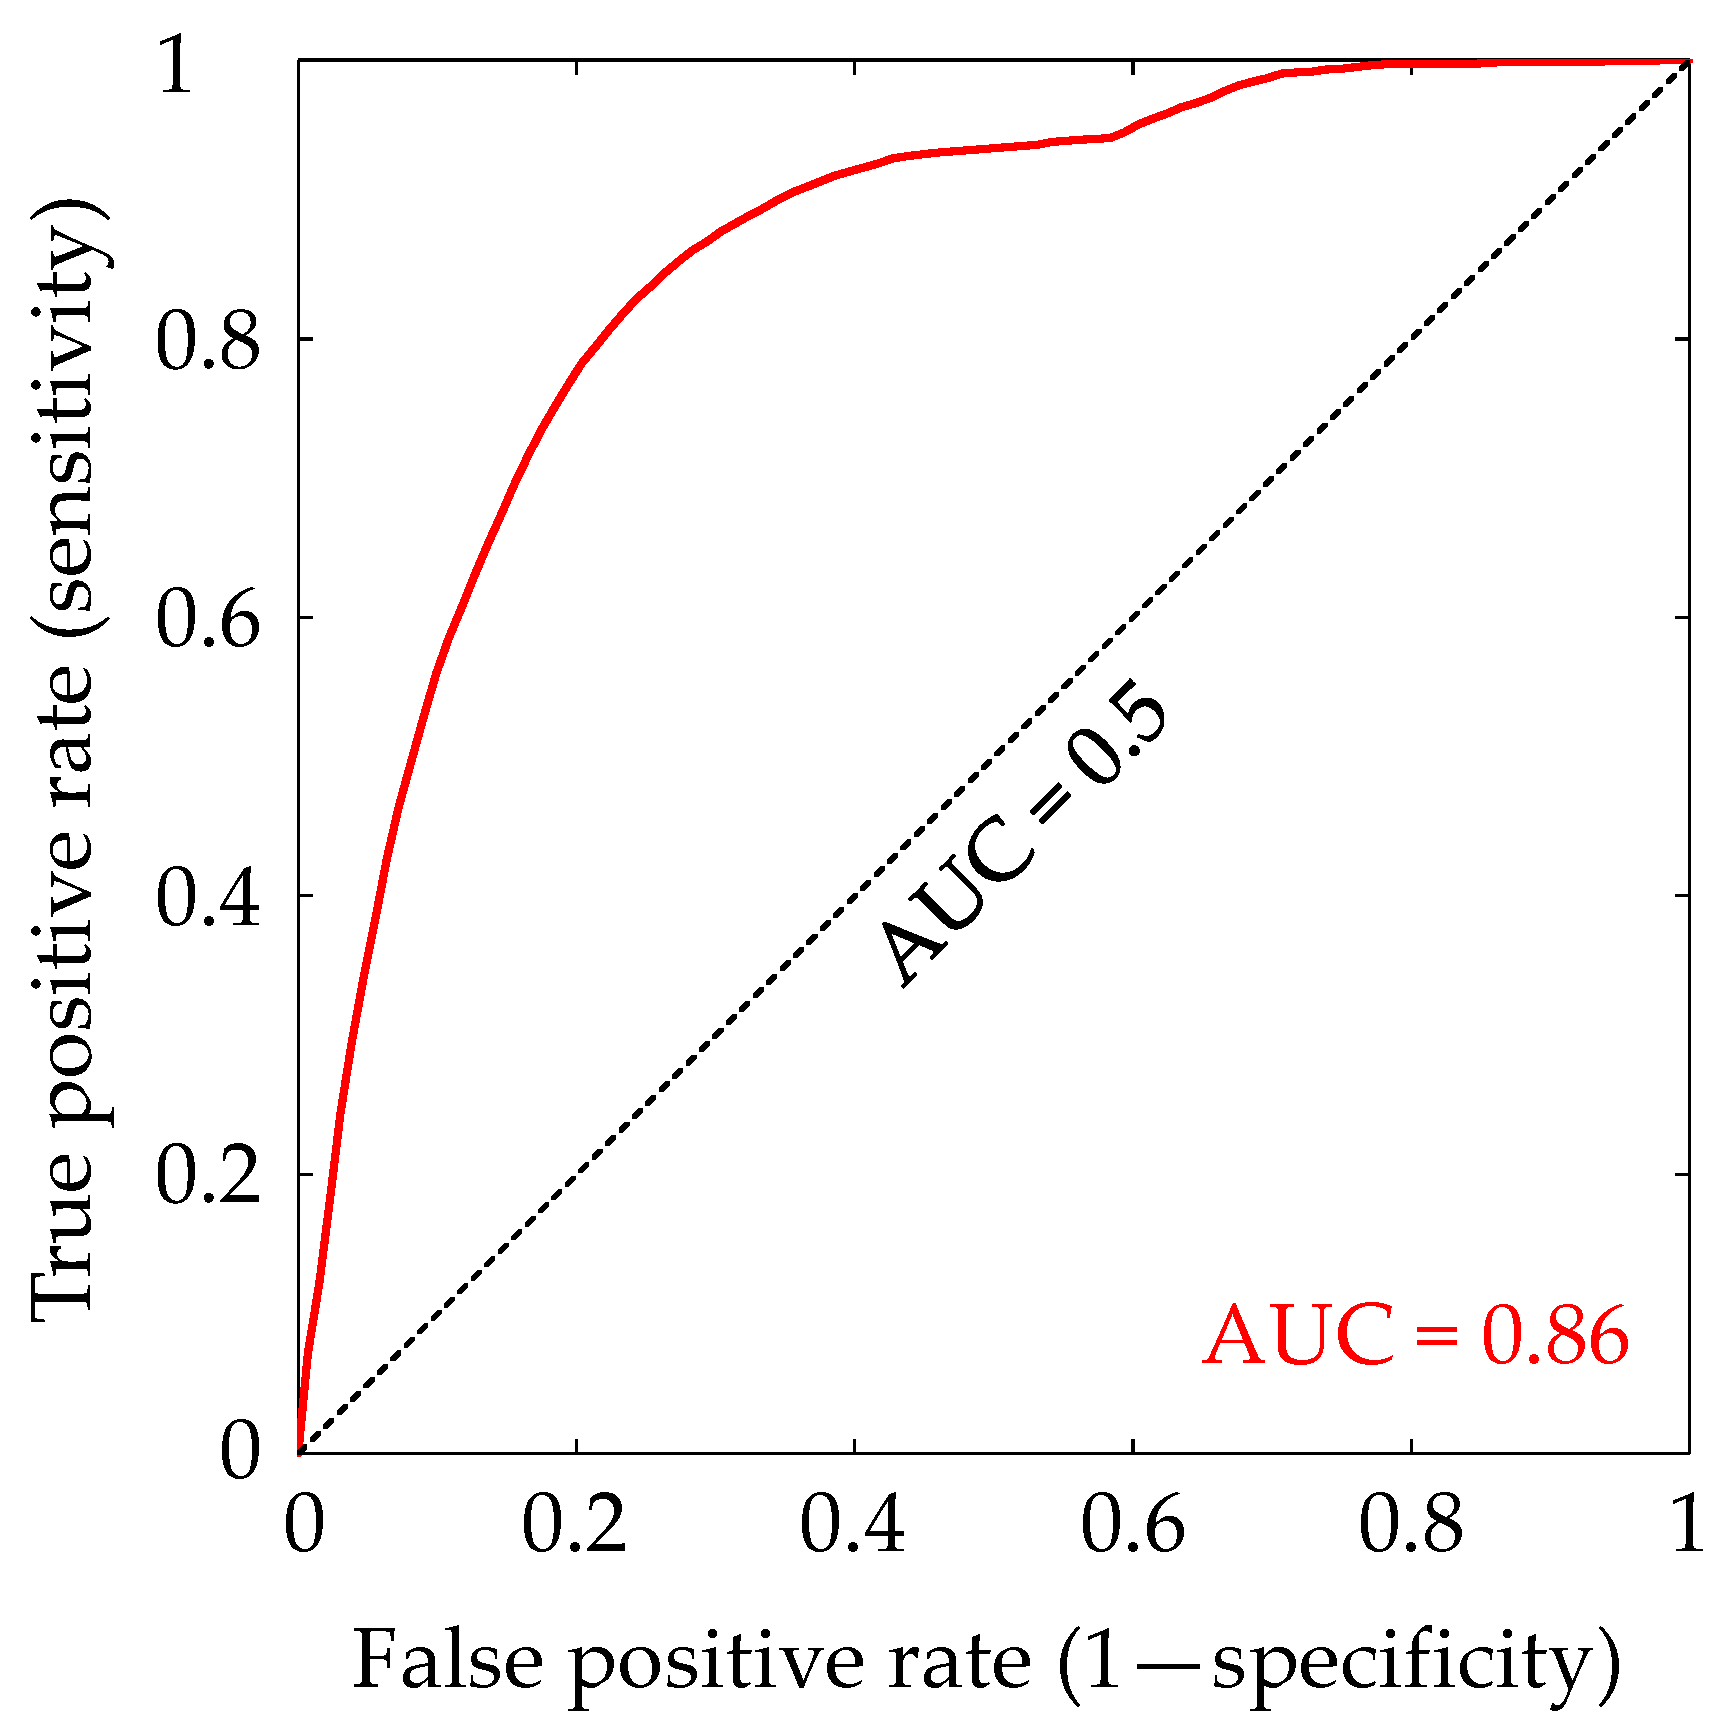
Figure 19.
ROC curves and AUC values for the AHP model in this study.
Figure 19.
ROC curves and AUC values for the AHP model in this study.
Table 1.
Pairwise comparisons of elements for elevation in hierarchy level 2 (e1–e19 vs. e1–e10). e1: 0–200 m, e2: 200.1–400 m, e3: 400.1–600 m, e4: 600.1–800 m, e5: 800.1–1000 m, e6: 1000.1–1200 m, e7: 1200.1–1400 m, e8: 1400.1–1600 m, e9: 1600.1–1800 m, e10: 1800.1–2000 m, e11: 2000.1–2200 m, e12: 2200.1–2400 m, e13: 2400.1–2600 m, e14: 2600.1–2800 m, e16: 2800.1–3000 m, e17: 3000.1–3200 m, e17: 3200.1–3400 m, e18: 3400.1–3600 m, e19: 3600.1–3800 m.
| | e1 | e2 | e3 | e4 | e5 | e6 | e7 | e8 | e9 | e10 |
|---|
| e1 | 1 | 0.36 | 0.29 | 0.28 | 0.27 | 0.29 | 0.29 | 0.29 | 0.26 | 0.30 |
| e2 | 2.81 | 1 | 0.83 | 0.79 | 0.77 | 0.81 | 0.82 | 0.81 | 0.72 | 0.84 |
| e3 | 3.40 | 1.21 | 1 | 0.96 | 0.93 | 0.99 | 0.99 | 0.98 | 0.87 | 1.02 |
| e4 | 3.54 | 1.26 | 1.04 | 1 | 0.97 | 1.03 | 1.04 | 1.02 | 0.91 | 1.06 |
| e5 | 3.64 | 1.30 | 1.07 | 1.03 | 1 | 1.06 | 1.07 | 1.05 | 0.94 | 1.09 |
| e6 | 3.44 | 1.23 | 1.01 | 0.97 | 0.95 | 1 | 1.01 | 0.99 | 0.89 | 1.03 |
| e7 | 3.42 | 1.22 | 1.01 | 0.97 | 0.94 | 0.99 | 1 | 0.98 | 0.88 | 1.02 |
| e8 | 3.47 | 1.24 | 1.02 | 0.98 | 0.95 | 1.01 | 1.02 | 1 | 0.89 | 1.04 |
| e9 | 3.89 | 1.39 | 1.14 | 1.10 | 1.07 | 1.13 | 1.14 | 1.12 | 1 | 1.17 |
| e10 | 3.33 | 1.19 | 0.98 | 0.94 | 0.92 | 0.97 | 0.98 | 0.96 | 0.86 | 1 |
| e11 | 2.88 | 1.03 | 0.85 | 0.81 | 0.79 | 0.84 | 0.84 | 0.83 | 0.74 | 0.86 |
| e12 | 2.59 | 0.92 | 0.76 | 0.73 | 0.71 | 0.75 | 0.76 | 0.75 | 0.67 | 0.78 |
| e13 | 2.29 | 0.81 | 0.67 | 0.65 | 0.63 | 0.66 | 0.67 | 0.66 | 0.59 | 0.69 |
| e14 | 1.52 | 0.54 | 0.45 | 0.43 | 0.42 | 0.44 | 0.44 | 0.44 | 0.39 | 0.45 |
| e15 | 1.34 | 0.48 | 0.39 | 0.38 | 0.37 | 0.39 | 0.39 | 0.39 | 0.34 | 0.40 |
| e16 | 0.72 | 0.26 | 0.21 | 0.20 | 0.20 | 0.21 | 0.21 | 0.21 | 0.18 | 0.21 |
| e17 | 4.6 × 10⁻¹¹ | 1.6 × 10⁻¹¹ | 1.4 × 10⁻¹¹ | 1.3 × 10⁻¹¹ | 1.3 × 10⁻¹¹ | 1.3 × 10⁻¹¹ | 1.3 × 10⁻¹¹ | 1.3 × 10⁻¹¹ | 1.2 × 10⁻¹¹ | 1.4 × 10⁻¹¹ |
| e18 | 4.6 × 10⁻¹¹ | 1.6 × 10⁻¹¹ | 1.4 × 10⁻¹¹ | 1.3 × 10⁻¹¹ | 1.3 × 10⁻¹¹ | 1.3 × 10⁻¹¹ | 1.3 × 10⁻¹¹ | 1.3 × 10⁻¹¹ | 1.2 × 10⁻¹¹ | 1.4 × 10⁻¹¹ |
| e19 | 4.6 × 10⁻¹¹ | 1.6 × 10⁻¹¹ | 1.4 × 10⁻¹¹ | 1.3 × 10⁻¹¹ | 1.3 × 10⁻¹¹ | 1.3 × 10⁻¹¹ | 1.3 × 10⁻¹¹ | 1.3 × 10⁻¹¹ | 1.2 × 10⁻¹¹ | 1.4 × 10⁻¹¹ |
Table 2.
Pairwise comparisons of elements for elevation in hierarchy level 2 (
e1–
e19 vs.
e11–
e19). Abbreviations in this table correspond to those used in
Table 1.
Table 2.
Pairwise comparisons of elements for elevation in hierarchy level 2 (
e1–
e19 vs.
e11–
e19). Abbreviations in this table correspond to those used in
Table 1.
| | e11 | e12 | e13 | e14 | e15 | e16 | e17 | e18 | e19 | Weight |
|---|
| e1 | 0.35 | 0.39 | 0.44 | 0.66 | 0.75 | 1.40 | 2.2 × 10¹⁰ | 2.2 × 10¹⁰ | 2.2 × 10¹⁰ | 2.31 |
| e2 | 0.97 | 1.08 | 1.23 | 1.85 | 2.09 | 3.92 | 6.1 × 10¹⁰ | 6.1 × 10¹⁰ | 6.1 × 10¹⁰ | 6.48 |
| e3 | 1.18 | 1.31 | 1.49 | 2.24 | 2.54 | 4.75 | 7.4 × 10¹⁰ | 7.4 × 10¹⁰ | 7.4 × 10¹⁰ | 7.86 |
| e4 | 1.23 | 1.36 | 1.55 | 2.33 | 2.64 | 4.94 | 7.7 × 10¹⁰ | 7.7 × 10¹⁰ | 7.7 × 10¹⁰ | 8.18 |
| e5 | 1.26 | 1.40 | 1.59 | 2.40 | 2.72 | 5.09 | 7.9 × 10¹⁰ | 7.9 × 10¹⁰ | 7.9 × 10¹⁰ | 8.42 |
| e6 | 1.20 | 1.33 | 1.51 | 2.27 | 2.57 | 4.81 | 7.5 × 10¹⁰ | 7.5 × 10¹⁰ | 7.5 × 10¹⁰ | 7.96 |
| e7 | 1.19 | 1.32 | 1.49 | 2.25 | 2.55 | 4.77 | 7.4 × 10¹⁰ | 7.4 × 10¹⁰ | 7.4 × 10¹⁰ | 7.90 |
| e8 | 1.21 | 1.34 | 1.52 | 2.29 | 2.59 | 4.85 | 7.5 × 10¹⁰ | 7.5 × 10¹⁰ | 7.5 × 10¹⁰ | 8.03 |
| e9 | 1.35 | 1.50 | 1.70 | 2.56 | 2.90 | 5.43 | 8.4 × 10¹⁰ | 8.4 × 10¹⁰ | 8.4 × 10¹⁰ | 8.99 |
| e10 | 1.16 | 1.29 | 1.46 | 2.20 | 2.49 | 4.66 | 7.2 × 10¹⁰ | 7.2 × 10¹⁰ | 7.2 × 10¹⁰ | 7.71 |
| e11 | 1 | 1.11 | 1.26 | 1.90 | 2.15 | 4.02 | 6.2 × 10¹⁰ | 6.2 × 10¹⁰ | 6.2 × 10¹⁰ | 6.65 |
| e12 | 0.90 | 1 | 1.13 | 1.71 | 1.94 | 3.62 | 5.6 × 10¹⁰ | 5.6 × 10¹⁰ | 5.6 × 10¹⁰ | 5.99 |
| e13 | 0.79 | 0.88 | 1 | 1.51 | 1.71 | 3.19 | 5.0 × 10¹⁰ | 5.0 × 10¹⁰ | 5.0 × 10¹⁰ | 5.28 |
| e14 | 0.53 | 0.58 | 0.66 | 1 | 1.13 | 2.12 | 3.3 × 10¹⁰ | 3.3 × 10¹⁰ | 3.3 × 10¹⁰ | 3.50 |
| e15 | 0.47 | 0.52 | 0.59 | 0.88 | 1 | 1.87 | 2.9 × 10¹⁰ | 2.9 × 10¹⁰ | 2.9 × 10¹⁰ | 3.09 |
| e16 | 0.25 | 0.28 | 0.31 | 0.47 | 0.53 | 1 | 1.6 × 10¹⁰ | 1.6 × 10¹⁰ | 1.6 × 10¹⁰ | 1.65 |
| e17 | 1.6 × 10⁻¹¹ | 1.8 × 10⁻¹¹ | 2.0 × 10⁻¹¹ | 3.0 × 10⁻¹¹ | 3.4 × 10⁻¹¹ | 6.4 × 10⁻¹¹ | 1 | 1.00 | 1.00 | 0.00 |
| e18 | 1.6 × 10⁻¹¹ | 1.8 × 10⁻¹¹ | 2.0 × 10⁻¹¹ | 3.0 × 10⁻¹¹ | 3.4 × 10⁻¹¹ | 6.4 × 10⁻¹¹ | 1.00 | 1 | 1.00 | 0.00 |
| e19 | 1.6 × 10⁻¹¹ | 1.8 × 10⁻¹¹ | 2.0 × 10⁻¹¹ | 3.0 × 10⁻¹¹ | 3.4 × 10⁻¹¹ | 6.4 × 10⁻¹¹ | 1.00 | 1.00 | 1 | 0.00 |
Table 3.
Pairwise comparisons of elements for slope angle in hierarchy level 2. sa1: 0–10°, sa2: 10.1–20°, sa3: 20.1–30°, sa4: 30.1–40°, sa5: 40.1–50°, sa6: 50.1–60°, sa7: 60.1–70°, sa8: 70.1–80°, sa9: 80.1–90°.
Table 3.
Pairwise comparisons of elements for slope angle in hierarchy level 2. sa1: 0–10°, sa2: 10.1–20°, sa3: 20.1–30°, sa4: 30.1–40°, sa5: 40.1–50°, sa6: 50.1–60°, sa7: 60.1–70°, sa8: 70.1–80°, sa9: 80.1–90°.
| | sa1 | sa2 | sa3 | sa4 | sa5 | sa6 | sa7 | sa8 | sa9 | Weight |
|---|
| sa1 | 1 | 0.31 | 0.39 | 0.53 | 0.64 | 0.73 | 0.92 | 1.14 | 2.5 × 10¹⁰ | 7.36 |
| sa2 | 3.24 | 1 | 1.25 | 1.71 | 2.07 | 2.37 | 2.99 | 3.69 | 8.1 × 10¹⁰ | 23.80 |
| sa3 | 2.58 | 0.80 | 1 | 1.36 | 1.65 | 1.89 | 2.39 | 2.94 | 6.5 × 10¹⁰ | 18.98 |
| sa4 | 1.89 | 0.59 | 0.73 | 1 | 1.21 | 1.39 | 1.75 | 2.16 | 4.8 × 10¹⁰ | 13.94 |
| sa5 | 1.56 | 0.48 | 0.61 | 0.82 | 1 | 1.14 | 1.44 | 1.78 | 3.9 × 10¹⁰ | 11.49 |
| sa6 | 1.36 | 0.42 | 0.53 | 0.72 | 0.87 | 1 | 1.26 | 1.56 | 3.4 × 10¹⁰ | 10.04 |
| sa7 | 1.08 | 0.33 | 0.42 | 0.57 | 0.69 | 0.79 | 1 | 1.23 | 2.7 × 10¹⁰ | 7.96 |
| sa8 | 0.88 | 0.27 | 0.34 | 0.46 | 0.56 | 0.64 | 0.81 | 1 | 2.2 × 10¹⁰ | 6.45 |
| sa9 | 4.0 × 10⁻¹¹ | 1.2 × 10⁻¹¹ | 1.5 × 10⁻¹¹ | 2.1 × 10⁻¹¹ | 2.5 × 10⁻¹¹ | 2.9 × 10⁻¹¹ | 3.7 × 10⁻¹¹ | 4.5 × 10⁻¹¹ | 1 | 00.00 |
Table 4.
Pairwise comparisons of elements for slope type in hierarchy level 2. st1: Convex ridge type slope, st2: Rectilinear ridge type slope, st3: Concave ridge type slope, st4: Convex straight type slope, st5: Rectilinear straight type slope, st6: Concave straight type slope, st7: Convex valley type slope, st8: Rectilinear valley type slope, st9: Concave valley type slope.
| | st1 | st2 | st3 | st4 | st5 | st6 | st7 | st8 | st9 | Weight |
|---|
| st1 | 1 | 24.84 | 0.94 | 25.18 | 33.30 | 19.46 | 0.94 | 17.89 | 0.98 | 22.95 |
| st2 | 0.04 | 1 | 0.04 | 1.01 | 1.34 | 0.78 | 0.04 | 0.72 | 0.04 | 0.92 |
| st3 | 1.06 | 26.29 | 1 | 26.65 | 35.24 | 20.59 | 1.00 | 18.93 | 1.04 | 24.28 |
| st4 | 0.04 | 0.99 | 0.04 | 1 | 1.32 | 0.77 | 0.04 | 0.71 | 0.04 | 0.91 |
| st5 | 0.03 | 0.75 | 0.03 | 0.76 | 1 | 0.58 | 0.03 | 0.54 | 0.03 | 0.69 |
| st6 | 0.05 | 1.28 | 0.05 | 1.29 | 1.71 | 1 | 0.05 | 0.92 | 0.05 | 1.18 |
| st7 | 1.06 | 26.36 | 1.00 | 26.71 | 35.33 | 20.64 | 1 | 18.98 | 1.04 | 24.35 |
| st8 | 0.06 | 1.39 | 0.05 | 1.41 | 1.86 | 1.09 | 0.05 | 1 | 0.05 | 1.28 |
| st9 | 1.02 | 25.37 | 0.97 | 25.72 | 34.01 | 19.87 | 0.96 | 18.27 | 1 | 23.44 |
Table 5.
Pairwise comparisons of elements for flow accumulation in hierarchy level 2. f1: Class-1, f2: Class-2, f3: Class-3, f4: Class-4, f5: Class-5.
Table 5.
Pairwise comparisons of elements for flow accumulation in hierarchy level 2. f1: Class-1, f2: Class-2, f3: Class-3, f4: Class-4, f5: Class-5.
| | f1 | f2 | f3 | f4 | f5 | Weight |
|---|
| f1 | 1 | 0.61 | 1.49 | 2.22 | 4.43 | 25.00 |
| f2 | 1.65 | 1 | 2.46 | 3.67 | 7.32 | 41.32 |
| f3 | 0.67 | 0.41 | 1 | 1.49 | 2.97 | 16.77 |
| f4 | 0.45 | 0.27 | 0.67 | 1 | 1.99 | 11.26 |
| f5 | 0.23 | 0.14 | 0.34 | 0.50 | 1 | 5.65 |
Table 6.
Pairwise comparisons of elements for geology in hierarchy level 2 (g1–e27 vs. g1–e10). g1: Quaternary sedimentary rocks, g2: Quaternary volcanic rocks, g3: Quaternary plutonic rocks, g4: Neogene sedimentary rocks, g5: Neogene volcanic rocks, g6: Neogene plutonic rocks, g7: Paleogene sedimentary rocks, g8: Paleogene sedimentary rocks, g9: Paleogene plutonic rocks, g10: Paleogene metamorphic rocks, g11: Paleogene accretionary complex, g12: Cretaceous sedimentary rocks, g13: Cretaceous volcanic rocks, g14: Cretaceous plutonic rocks, g15: Cretaceous metamorphic rocks, g16: Cretaceous accretionary complex, g17: Jurassic sedimentary rocks, g18: Jurassic plutonic rocks, g19: Jurassic metamorphic rocks, g20: Jurassic accretionary complex, g21: Triassic sedimentary rocks, g22: Triassic plutonic rocks, g23: Paleozoic sedimentary rocks, g24: Paleozoic plutonic rocks, g25: Paleozoic metamorphic rocks, g26: Paleozoic accretionary complex, g27: Others.
| | g1 | g2 | g3 | g4 | g5 | g6 | g7 | g8 | g9 | g10 |
|---|
| g1 | 1 | 0.31 | 0.14 | 0.12 | 0.14 | 0.37 | 0.16 | 0.23 | 0.12 | 0.69 |
| g2 | 3.18 | 1 | 0.45 | 0.37 | 0.43 | 1.18 | 0.52 | 0.75 | 0.38 | 2.21 |
| g3 | 7.10 | 2.23 | 1 | 0.83 | 0.97 | 2.63 | 1.16 | 1.66 | 0.85 | 4.93 |
| g4 | 8.57 | 2.70 | 1.21 | 1 | 1.17 | 3.17 | 1.39 | 2.01 | 1.02 | 5.95 |
| g5 | 7.31 | 2.30 | 1.03 | 0.85 | 1 | 2.71 | 1.19 | 1.71 | 0.84 | 5.07 |
| g6 | 2.70 | 0.85 | 0.38 | 0.32 | 0.37 | 1 | 0.44 | 0.63 | 0.32 | 1.87 |
| g7 | 6.15 | 1.93 | 0.87 | 0.72 | 0.84 | 2.28 | 1 | 1.44 | 0.74 | 4.27 |
| g8 | 4.27 | 1.34 | 0.60 | 0.50 | 0.58 | 1.58 | 0.69 | 1 | 0.51 | 2.96 |
| g9 | 8.36 | 2.63 | 1.18 | 0.98 | 1.14 | 3.10 | 1.36 | 1.96 | 1 | 5.80 |
| g10 | 1.44 | 0.45 | 0.20 | 0.17 | 0.20 | 0.53 | 0.23 | 0.34 | 0.17 | 1 |
| g11 | 0.59 | 0.19 | 0.08 | 0.07 | 0.08 | 0.22 | 0.10 | 0.14 | 0.07 | 0.41 |
| g12 | 6.99 | 2.20 | 0.98 | 0.82 | 0.96 | 2.59 | 1.14 | 1.64 | 0.84 | 4.85 |
| g13 | 2.46 | 0.77 | 0.35 | 0.29 | 0.34 | 0.91 | 0.40 | 0.58 | 0.29 | 1.71 |
| g14 | 2.00 | 0.63 | 0.28 | 0.23 | 0.27 | 0.74 | 0.33 | 0.47 | 0.24 | 1.39 |
| g15 | 1.58 | 0.50 | 0.22 | 0.18 | 0.22 | 0.59 | 0.26 | 0.37 | 0.19 | 1.10 |
| g16 | 7.14 | 2.25 | 1.01 | 0.83 | 0.98 | 2.65 | 1.16 | 1.67 | 0.85 | 4.96 |
| g17 | 8.73 | 2.75 | 1.23 | 1.02 | 1.19 | 3.23 | 1.42 | 2.05 | 1.04 | 6.06 |
| g18 | 3.76 | 1.18 | 0.53 | 0.44 | 0.51 | 1.39 | 0.61 | 0.88 | 0.45 | 2.61 |
| g19 | 5.93 | 1.87 | 0.84 | 0.69 | 0.81 | 2.20 | 0.97 | 1.39 | 0.71 | 4.12 |
| g20 | 1.95 | 0.61 | 0.27 | 0.23 | 0.27 | 0.72 | 0.32 | 0.46 | 0.23 | 1.35 |
| g21 | 1.28 | 0.40 | 0.18 | 0.15 | 0.17 | 0.47 | 0.21 | 0.30 | 0.15 | 0.89 |
| g22 | 9.03 | 2.84 | 1.27 | 1.05 | 1.24 | 3.35 | 1.47 | 2.12 | 1.08 | 6.27 |
| g23 | 1.15 | 0.36 | 0.16 | 0.13 | 0.16 | 0.42 | 0.19 | 0.27 | 0.14 | 0.80 |
| g24 | 6.16 | 1.94 | 0.87 | 0.72 | 0.84 | 2.28 | 1.00 | 1.44 | 0.74 | 4.28 |
| g25 | 0.90 | 0.28 | 0.13 | 0.10 | 0.12 | 0.33 | 0.15 | 0.21 | 0.11 | 0.62 |
| g26 | 2.44 | 0.77 | 0.34 | 0.28 | 0.33 | 0.90 | 0.40 | 0.57 | 0.29 | 1.69 |
| g27 | 0.41 | 0.13 | 0.06 | 0.05 | 0.06 | 0.15 | 0.07 | 0.10 | 0.05 | 0.29 |
Table 7.
Pairwise comparisons of elements for geology in hierarchy level 2 (
g1–
e27 vs.
g11–
e20). Abbreviations in this table correspond to those used in
Table 6.
Table 7.
Pairwise comparisons of elements for geology in hierarchy level 2 (
g1–
e27 vs.
g11–
e20). Abbreviations in this table correspond to those used in
Table 6.
| | g11 | g12 | g13 | g14 | g15 | g16 | g17 | g18 | g19 | g20 |
|---|
| g1 | 1.69 | 0.14 | 0.41 | 0.50 | 0.63 | 0.14 | 0.11 | 0.27 | 0.17 | 0.51 |
| g2 | 5.38 | 0.45 | 1.29 | 1.59 | 2.01 | 0.44 | 0.36 | 0.84 | 0.54 | 1.63 |
| g3 | 12.02 | 1.02 | 2.89 | 3.55 | 4.48 | 0.99 | 0.81 | 1.89 | 1.20 | 3.64 |
| g4 | 14.51 | 1.23 | 3.49 | 4.29 | 5.41 | 1.20 | 0.98 | 2.28 | 1.44 | 4.39 |
| g5 | 12.37 | 1.04 | 2.97 | 3.66 | 4.61 | 1.02 | 0.84 | 1.94 | 1.23 | 3.74 |
| g6 | 4.57 | 0.39 | 1.10 | 1.35 | 1.70 | 0.38 | 0.31 | 0.72 | 0.46 | 1.38 |
| g7 | 10.41 | 0.88 | 2.50 | 3.08 | 3.88 | 0.86 | 0.70 | 1.63 | 1.04 | 3.15 |
| g8 | 7.22 | 0.61 | 1.74 | 2.13 | 2.69 | 0.60 | 0.49 | 1.13 | 0.72 | 2.19 |
| g9 | 14.16 | 1.20 | 3.40 | 4.18 | 5.28 | 1.17 | 0.96 | 2.22 | 1.41 | 4.29 |
| g10 | 2.44 | 0.21 | 0.59 | 0.72 | 0.91 | 0.20 | 0.17 | 0.38 | 0.24 | 0.74 |
| g11 | 1 | 0.08 | 0.24 | 0.30 | 0.37 | 0.08 | 0.07 | 0.16 | 0.10 | 0.30 |
| g12 | 11.84 | 1 | 2.84 | 3.50 | 4.41 | 0.98 | 0.80 | 1.86 | 1.18 | 3.58 |
| g13 | 4.16 | 0.35 | 1 | 1.23 | 1.55 | 0.34 | 0.28 | 0.65 | 0.41 | 1.26 |
| g14 | 3.38 | 0.29 | 0.81 | 1 | 1.26 | 0.28 | 0.23 | 0.53 | 0.34 | 1.02 |
| g15 | 2.68 | 0.23 | 0.64 | 0.79 | 1 | 0.22 | 0.18 | 0.42 | 0.27 | 0.81 |
| g16 | 12.09 | 1.02 | 2.91 | 3.57 | 4.51 | 1 | 0.82 | 1.90 | 1.20 | 3.66 |
| g17 | 14.78 | 1.25 | 3.55 | 4.37 | 5.51 | 1.22 | 1 | 2.32 | 1.47 | 4.47 |
| g18 | 6.37 | 0.54 | 1.53 | 1.88 | 2.37 | 0.53 | 0.43 | 1 | 0.63 | 1.93 |
| g19 | 10.05 | 0.85 | 2.41 | 2.97 | 3.74 | 0.83 | 0.68 | 1.58 | 1 | 3.04 |
| g20 | 3.30 | 0.28 | 0.79 | 0.98 | 1.23 | 0.27 | 0.22 | 0.52 | 0.33 | 1 |
| g21 | 2.16 | 0.18 | 0.52 | 0.64 | 0.81 | 0.18 | 0.15 | 0.34 | 0.22 | 0.65 |
| g22 | 15.30 | 1.29 | 3.68 | 4.52 | 5.70 | 1.26 | 1.03 | 2.40 | 1.52 | 4.63 |
| g23 | 1.94 | 0.16 | 0.47 | 0.57 | 0.72 | 0.16 | 0.13 | 0.30 | 0.19 | 0.59 |
| g24 | 10.43 | 0.88 | 2.51 | 3.08 | 3.89 | 0.86 | 0.71 | 1.64 | 1.04 | 3.16 |
| g25 | 1.52 | 0.13 | 0.37 | 0.45 | 0.57 | 0.13 | 0.10 | 0.24 | 0.15 | 0.46 |
| g26 | 4.13 | 0.35 | 0.99 | 1.22 | 1.54 | 0.34 | 0.28 | 0.65 | 0.41 | 1.25 |
| g27 | 0.70 | 0.06 | 0.17 | 0.21 | 0.26 | 0.06 | 0.05 | 0.11 | 0.07 | 0.21 |
Table 8.
Pairwise comparisons of elements for geology in hierarchy level 2 (
g1–
e27 vs.
g21–
e27). Abbreviations in this table correspond to those used in
Table 6.
Table 8.
Pairwise comparisons of elements for geology in hierarchy level 2 (
g1–
e27 vs.
g21–
e27). Abbreviations in this table correspond to those used in
Table 6.
| | g21 | g22 | g23 | g24 | g25 | g26 | g27 | Weight |
|---|
| g1 | 0.78 | 0.11 | 0.87 | 0.16 | 1.11 | 0.41 | 2.43 | 0.89 |
| g2 | 2.49 | 0.35 | 2.77 | 0.52 | 3.53 | 1.30 | 7.71 | 2.82 |
| g3 | 5.56 | 0.79 | 6.20 | 1.15 | 7.90 | 2.91 | 17.22 | 6.31 |
| g4 | 6.71 | 0.95 | 7.48 | 1.39 | 9.53 | 3.51 | 20.78 | 7.61 |
| g5 | 5.72 | 0.81 | 6.38 | 1.19 | 8.12 | 3.00 | 17.72 | 6.49 |
| g6 | 2.11 | 0.30 | 2.36 | 0.44 | 3.00 | 1.11 | 6.55 | 2.40 |
| g7 | 4.81 | 0.68 | 5.37 | 1.00 | 6.84 | 2.52 | 14.91 | 5.46 |
| g8 | 3.34 | 0.47 | 3.72 | 0.69 | 4.74 | 1.75 | 10.34 | 3.79 |
| g9 | 6.55 | 0.93 | 7.30 | 1.36 | 9.30 | 3.43 | 20.28 | 7.43 |
| g10 | 1.13 | 0.16 | 1.26 | 0.23 | 1.60 | 0.59 | 3.49 | 1.28 |
| g11 | 0.46 | 0.07 | 0.52 | 0.10 | 0.66 | 0.24 | 1.43 | 0.52 |
| g12 | 5.48 | 0.77 | 6.10 | 1.14 | 7.77 | 2.87 | 16.96 | 6.21 |
| g13 | 1.93 | 0.27 | 2.15 | 0.40 | 2.73 | 1.01 | 5.96 | 2.18 |
| g14 | 1.57 | 0.22 | 1.74 | 0.32 | 2.22 | 0.82 | 4.85 | 1.78 |
| g15 | 1.24 | 0.18 | 1.38 | 0.26 | 1.76 | 0.65 | 3.84 | 1.41 |
| g16 | 5.59 | 0.79 | 6.23 | 1.16 | 7.94 | 2.93 | 17.32 | 6.34 |
| g17 | 6.84 | 0.97 | 7.62 | 1.42 | 9.70 | 3.58 | 21.17 | 7.75 |
| g18 | 2.95 | 0.42 | 3.28 | 0.61 | 4.18 | 1.54 | 9.12 | 3.34 |
| g19 | 4.65 | 0.66 | 5.18 | 0.96 | 6.60 | 2.43 | 14.39 | 5.27 |
| g20 | 1.53 | 0.22 | 1.70 | 0.32 | 2.17 | 0.80 | 4.73 | 1.73 |
| g21 | 1 | 0.14 | 1.11 | 0.21 | 1.42 | 0.52 | 3.10 | 1.13 |
| g22 | 7.07 | 1 | 7.88 | 1.47 | 10.04 | 3.70 | 21.91 | 8.02 |
| g23 | 0.90 | 0.13 | 1 | 0.19 | 1.27 | 0.47 | 2.78 | 1.02 |
| g24 | 4.82 | 0.68 | 5.38 | 1 | 6.85 | 2.53 | 14.94 | 5.47 |
| g25 | 0.70 | 0.10 | 0.78 | 0.15 | 1 | 0.37 | 2.18 | 0.80 |
| g26 | 1.91 | 0.27 | 2.13 | 0.40 | 2.71 | 1 | 5.91 | 2.17 |
| g27 | 0.32 | 0.05 | 0.36 | 0.07 | 0.46 | 0.17 | 1 | 0.37 |
Table 9.
Pairwise comparisons of elements for vegetation in hierarchy level 2. v1: Natural vegetation in the alpine zone, v2: Natural vegetation in the Vaccinio–Piceetea region, v3: Substitutional communities in the Vaccinio–Piceetea region, v4: Natural vegetation in the Fagaetea crenate region, v5: Substitutional communities in the Fagaetea crenate region, v6: Natural vegetation in the Camellietea japonica region, v7: Substitutional communities in the Camellietea japonica region, v8: Riverside, moor, salt marsh, and dune vegetation, v9: Plantation and cultural land, v10: Others.
| | v1 | v2 | v3 | v4 | v5 | v6 | v7 | v8 | v9 | v10 | Weight |
|---|
| v1 | 1 | 0.53 | 0.62 | 0.57 | 0.58 | 2.70 | 1.85 | 2.19 | 1.08 | 4.66 | 9.52 |
| v2 | 1.87 | 1 | 1.16 | 1.06 | 1.08 | 5.05 | 3.46 | 4.09 | 2.01 | 8.71 | 17.81 |
| v3 | 1.62 | 0.87 | 1 | 0.92 | 0.93 | 4.37 | 3.00 | 3.54 | 1.74 | 7.54 | 15.42 |
| v4 | 1.76 | 0.94 | 1.09 | 1 | 1.02 | 4.76 | 3.27 | 3.86 | 1.90 | 8.21 | 16.79 |
| v5 | 1.74 | 0.93 | 1.07 | 0.99 | 1 | 4.69 | 3.22 | 3.80 | 1.87 | 8.09 | 16.54 |
| v6 | 0.37 | 0.20 | 0.23 | 0.21 | 0.21 | 1 | 0.69 | 0.81 | 0.40 | 1.73 | 3.53 |
| v7 | 0.54 | 0.29 | 0.33 | 0.31 | 0.31 | 1.46 | 1 | 1.18 | 0.58 | 2.51 | 5.14 |
| v8 | 0.46 | 0.24 | 0.28 | 0.26 | 0.26 | 1.23 | 0.85 | 1 | 0.49 | 2.13 | 4.35 |
| v9 | 0.93 | 0.50 | 0.57 | 0.53 | 0.54 | 2.51 | 1.72 | 2.03 | 1 | 4.33 | 8.86 |
| v10 | 0.21 | 0.11 | 0.13 | 0.12 | 0.12 | 0.58 | 0.40 | 0.47 | 0.23 | 1 | 2.04 |
Table 10.
Pairwise comparisons of evaluation factors in hierarchy level 1.
Table 10.
Pairwise comparisons of evaluation factors in hierarchy level 1.
| | El | SAng | STyp | Flow | Geol | Veg | Weight |
|---|
| Elevation (El) | 1 | 0.98 | 0.58 | 0.95 | 0.85 | 1.01 | 14.60 |
| Slope angle (SAng) | 1.02 | 1 | 0.59 | 0.97 | 0.87 | 1.03 | 14.54 |
| Slope type (STyp) | 1.73 | 1.69 | 1 | 1.64 | 1.47 | 1.74 | 31.03 |
| Flow accumulation (Flow) | 1.05 | 1.03 | 0.61 | 1 | 0.90 | 1.06 | 14.23 |
| Geology (Geol) | 1.17 | 1.15 | 0.68 | 1.12 | 1 | 1.19 | 18.34 |
| Vegetation (Veg) | 0.99 | 0.97 | 0.57 | 0.94 | 0.84 | 1 | 7.26 |


