
Long-Term Coronary Artery Disease Risk Prediction with Machine Learning Models


Abstract
:1. Introduction
- The asymptomatic period: The process of atherosclerosis does not cause symptoms. Furthermore, patients who do not have severe coronary artery stenosis may have no symptoms, despite the presence of atherosclerotic lesions in the coronary arteries [6].
- Stable angina: The appearance of angina pain either during physical activity or during intense emotional stress. Stable angina is generally a relatively benign clinical condition and usually offers the opportunity to select and apply the appropriate treatment [7].
- Unstable angina: The appearance of angina pain at rest. This is a more dangerous form of coronary artery disease, which is why it has been described as pre-infarction angina. It is clear that such an unstable condition must be treated with hospitalization so that the administration of appropriate treatment can be commenced in order to avoid undesirable progression to myocardial infarction [8].
- Acute myocardial infarction: This is the necrosis of an area of the heart muscle that manifests itself with typical angina, which, however, is prolonged, does not stop with rest and lasts more than half an hour. The immediate transfer of the patient to a hospital is imperative, because only in a specialized area and by specialized personnel can such a serious medical problem be treated with the greatest possible rate of success [9].
- Sudden cardiac death: This is the most dramatic manifestation of the entire clinical spectrum of coronary artery disease [10].
- Data preprocessing is achieved with the SMOTE. In this way, the instances of the dataset are distributed in a balanced way, allowing us to design robust classification models to ensure a highly accurate prediction of CAD occurrence.
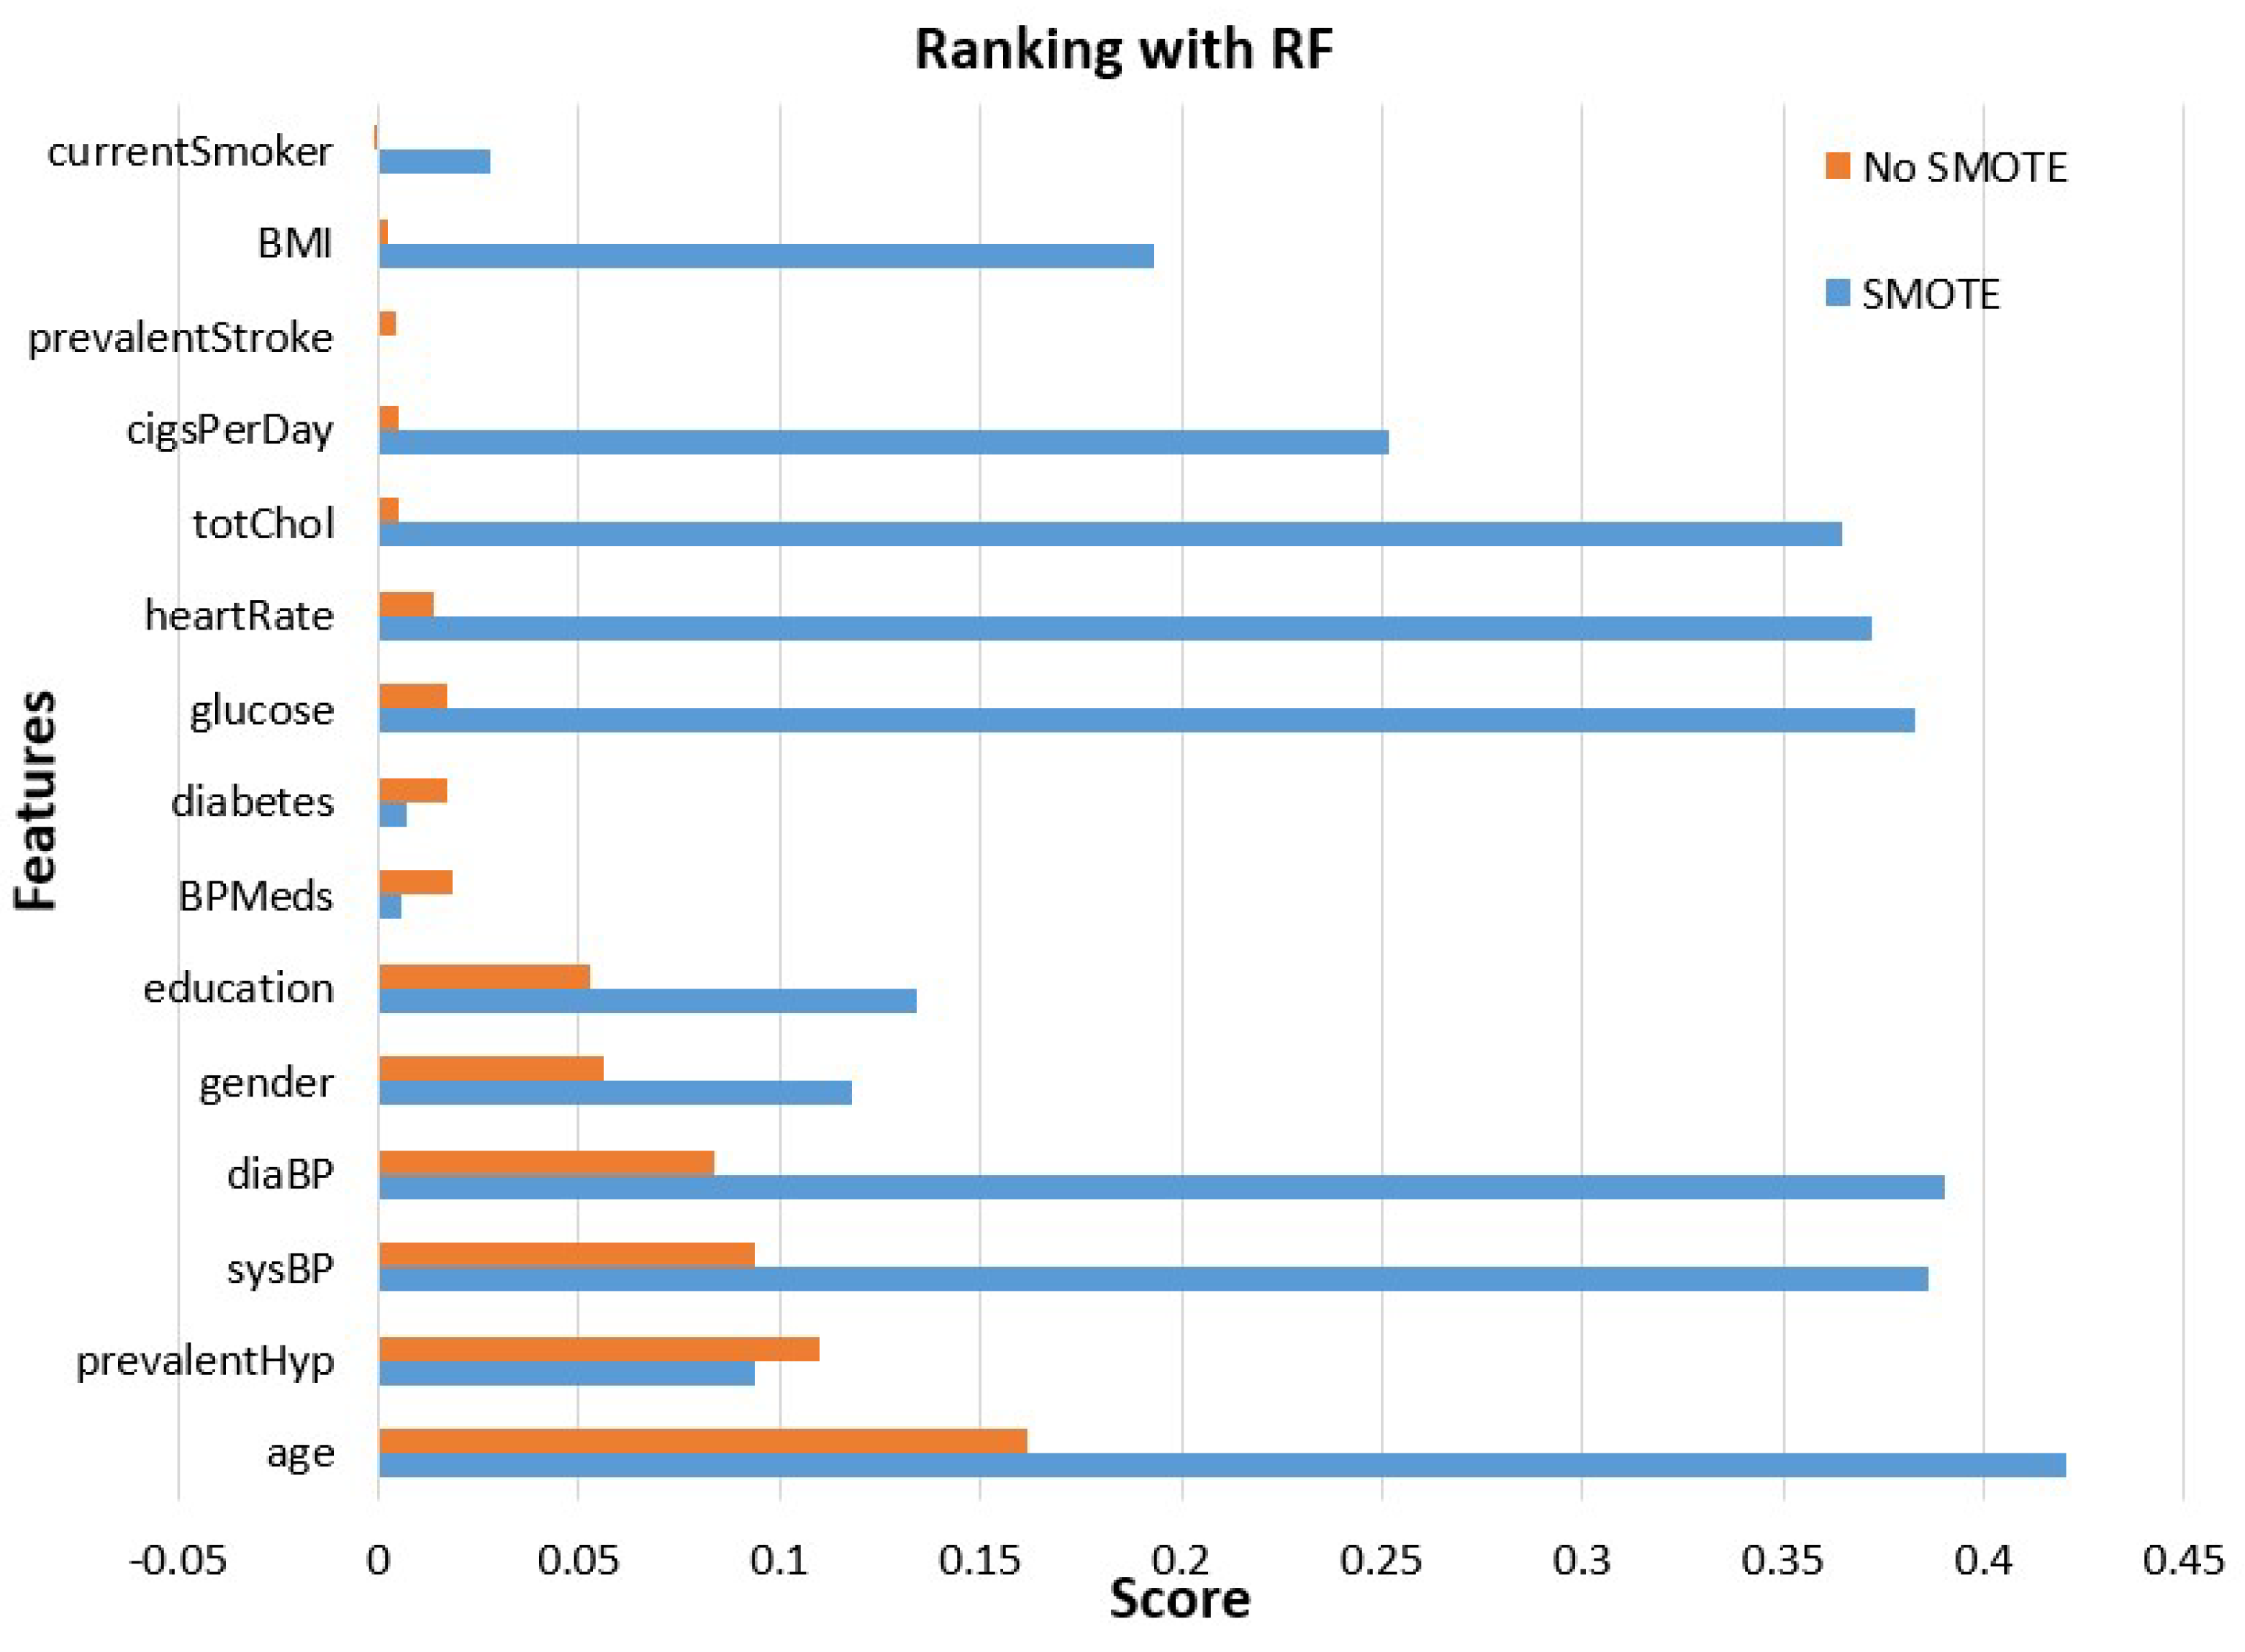
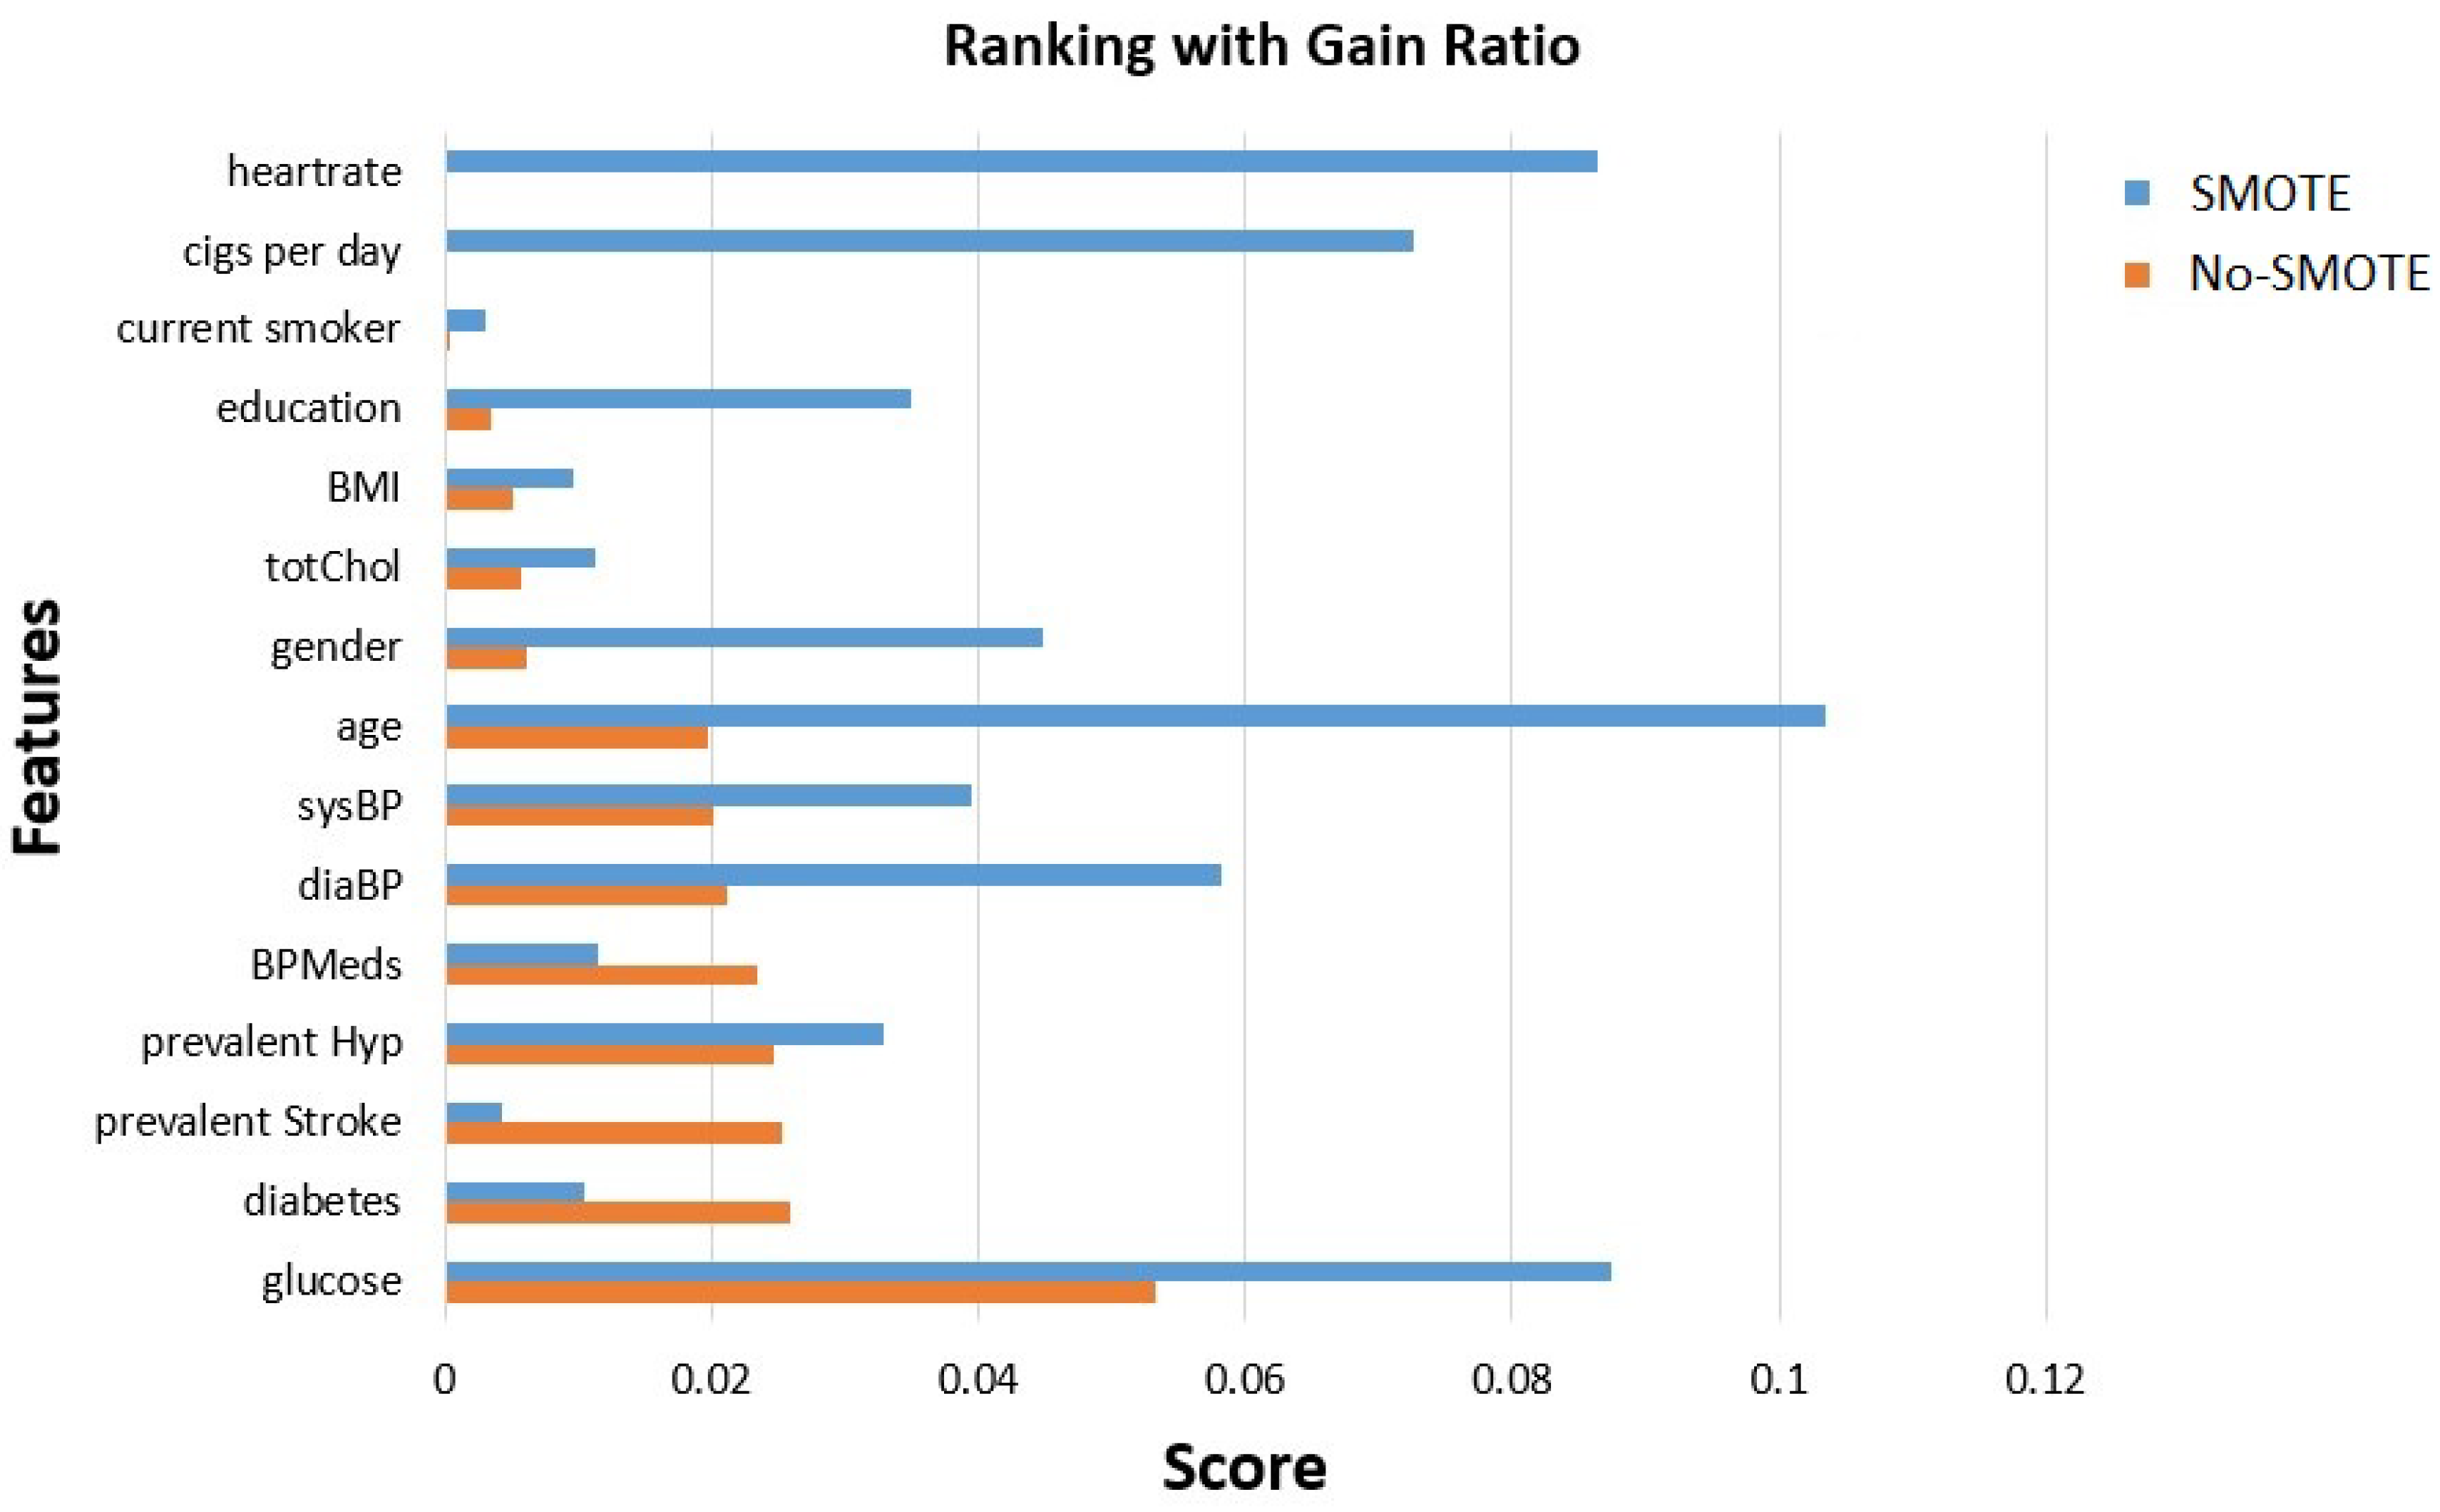
- Features’ importance evaluation is performed considering two commonly used methods, the gain ratio and random forest methods. This analysis is made using the initial unbalanced data and those obtained after class balancing using SMOTE.
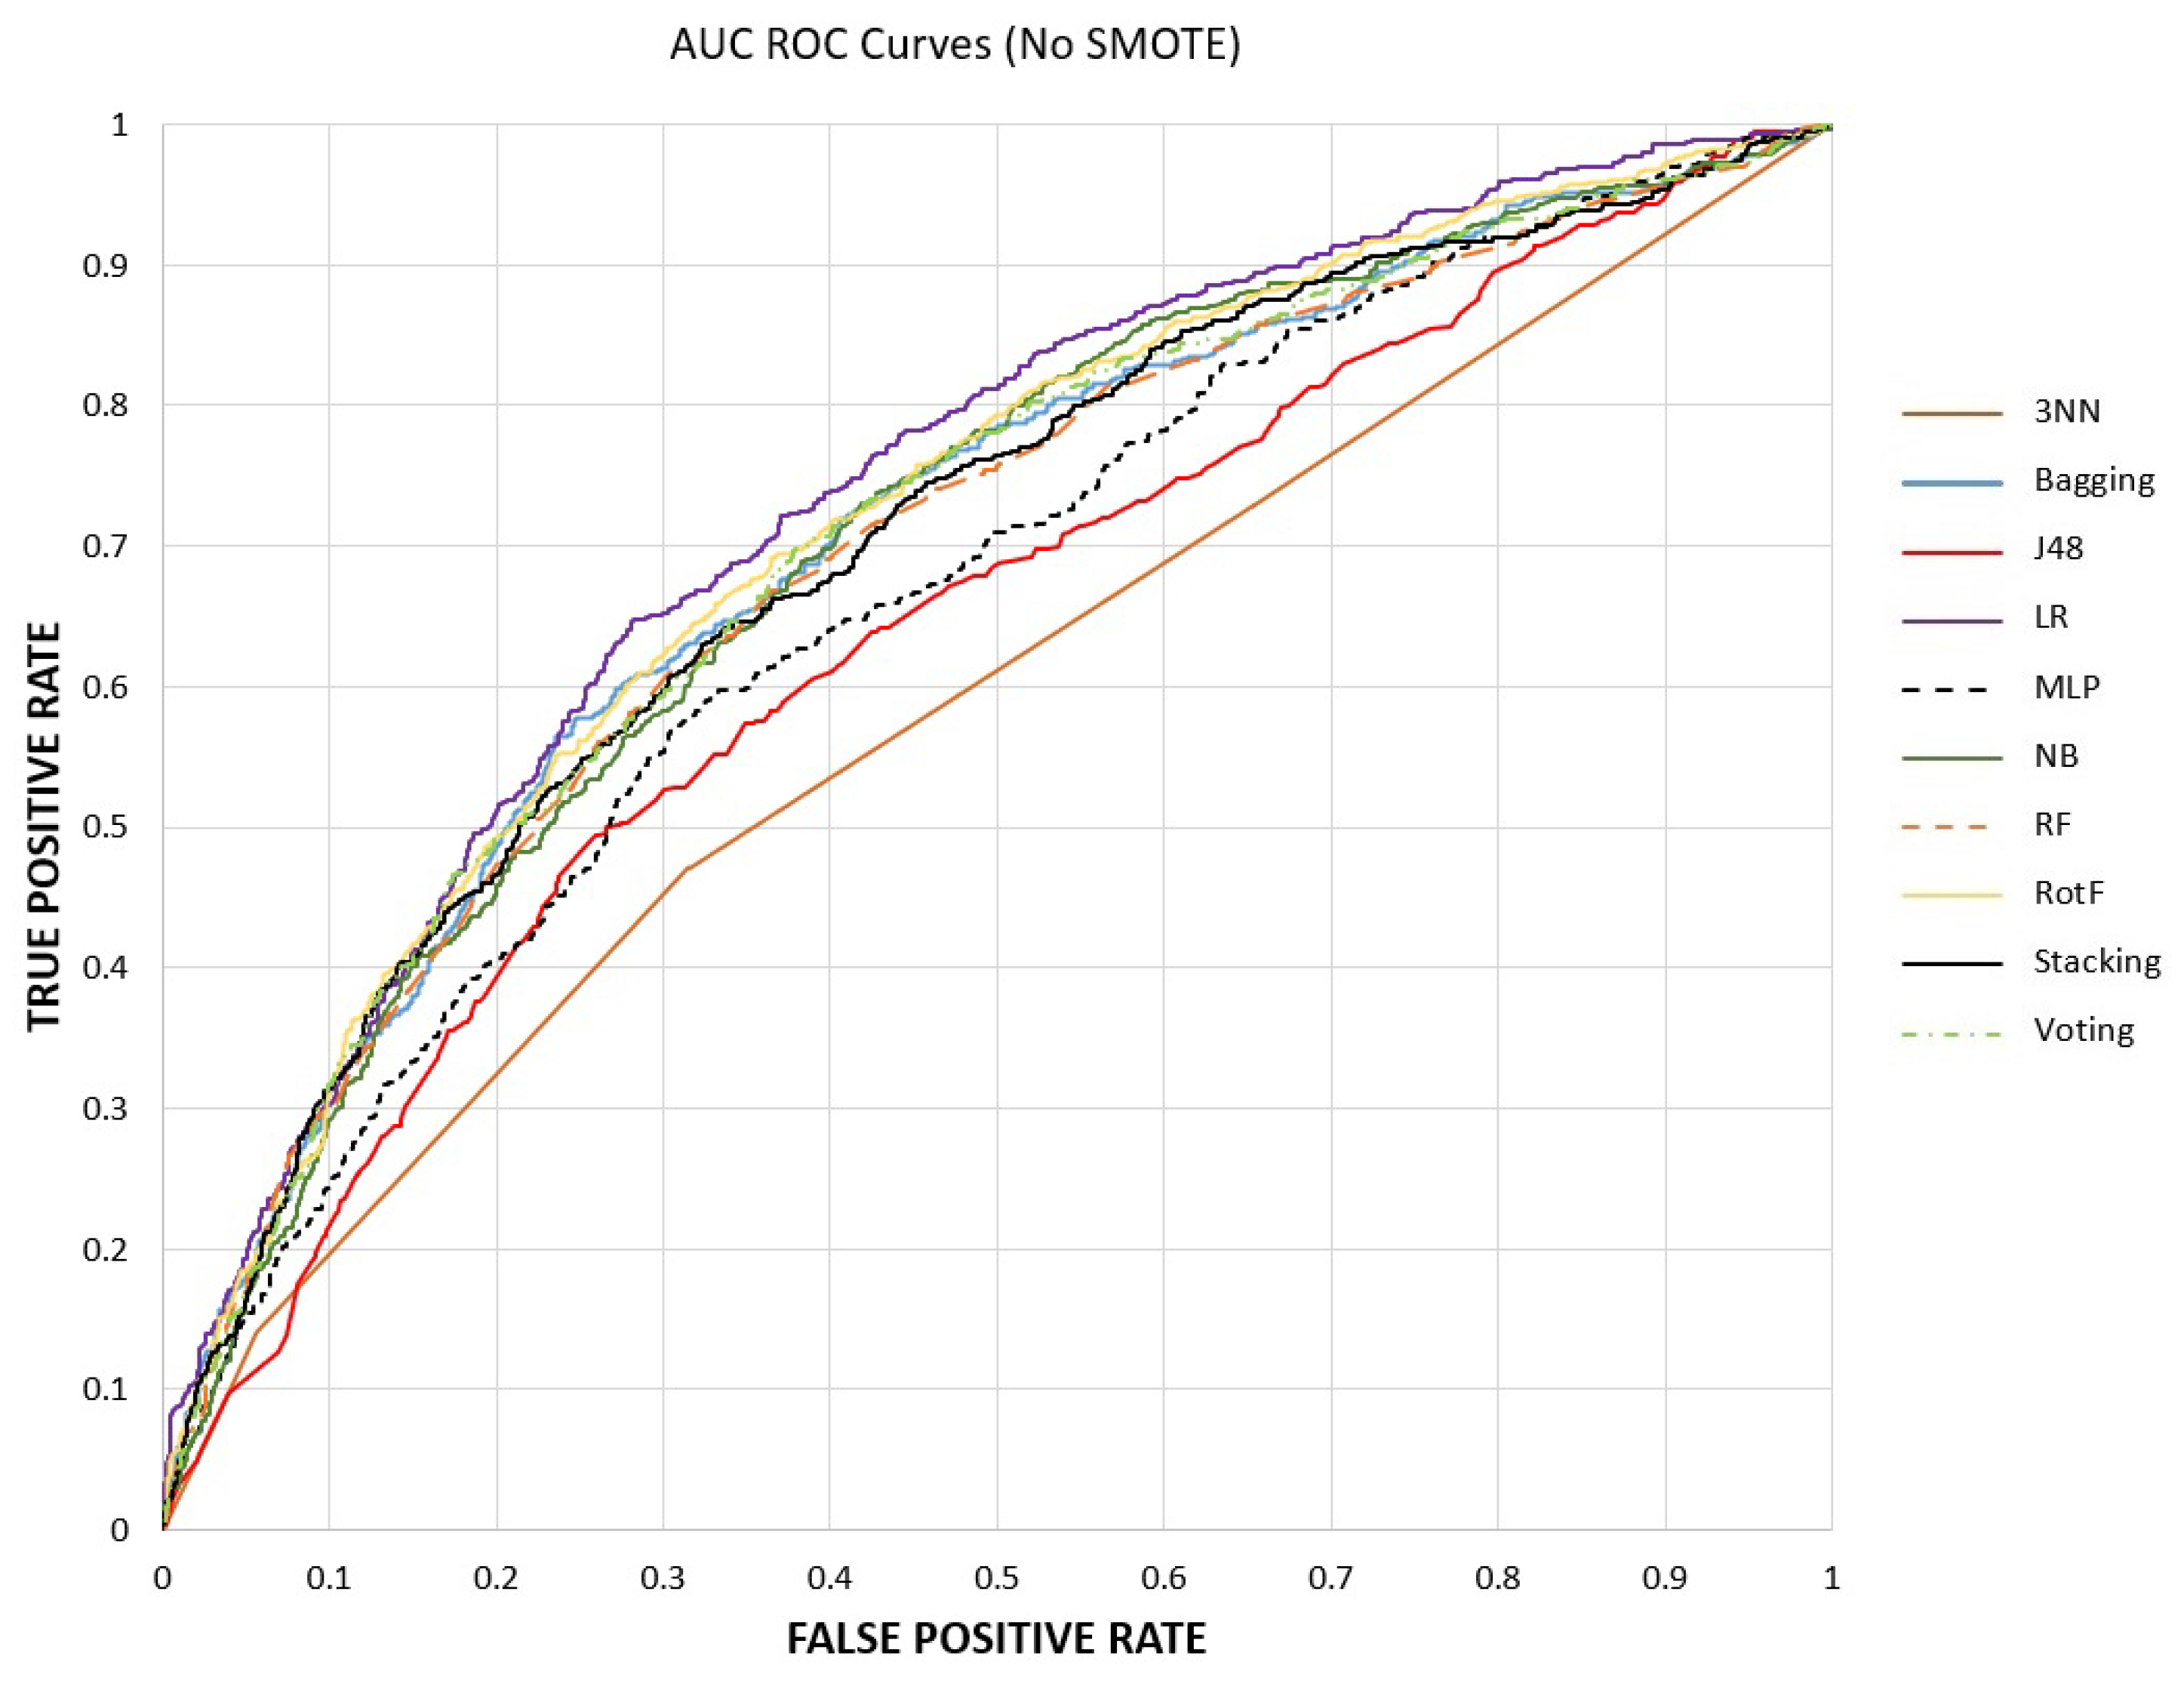
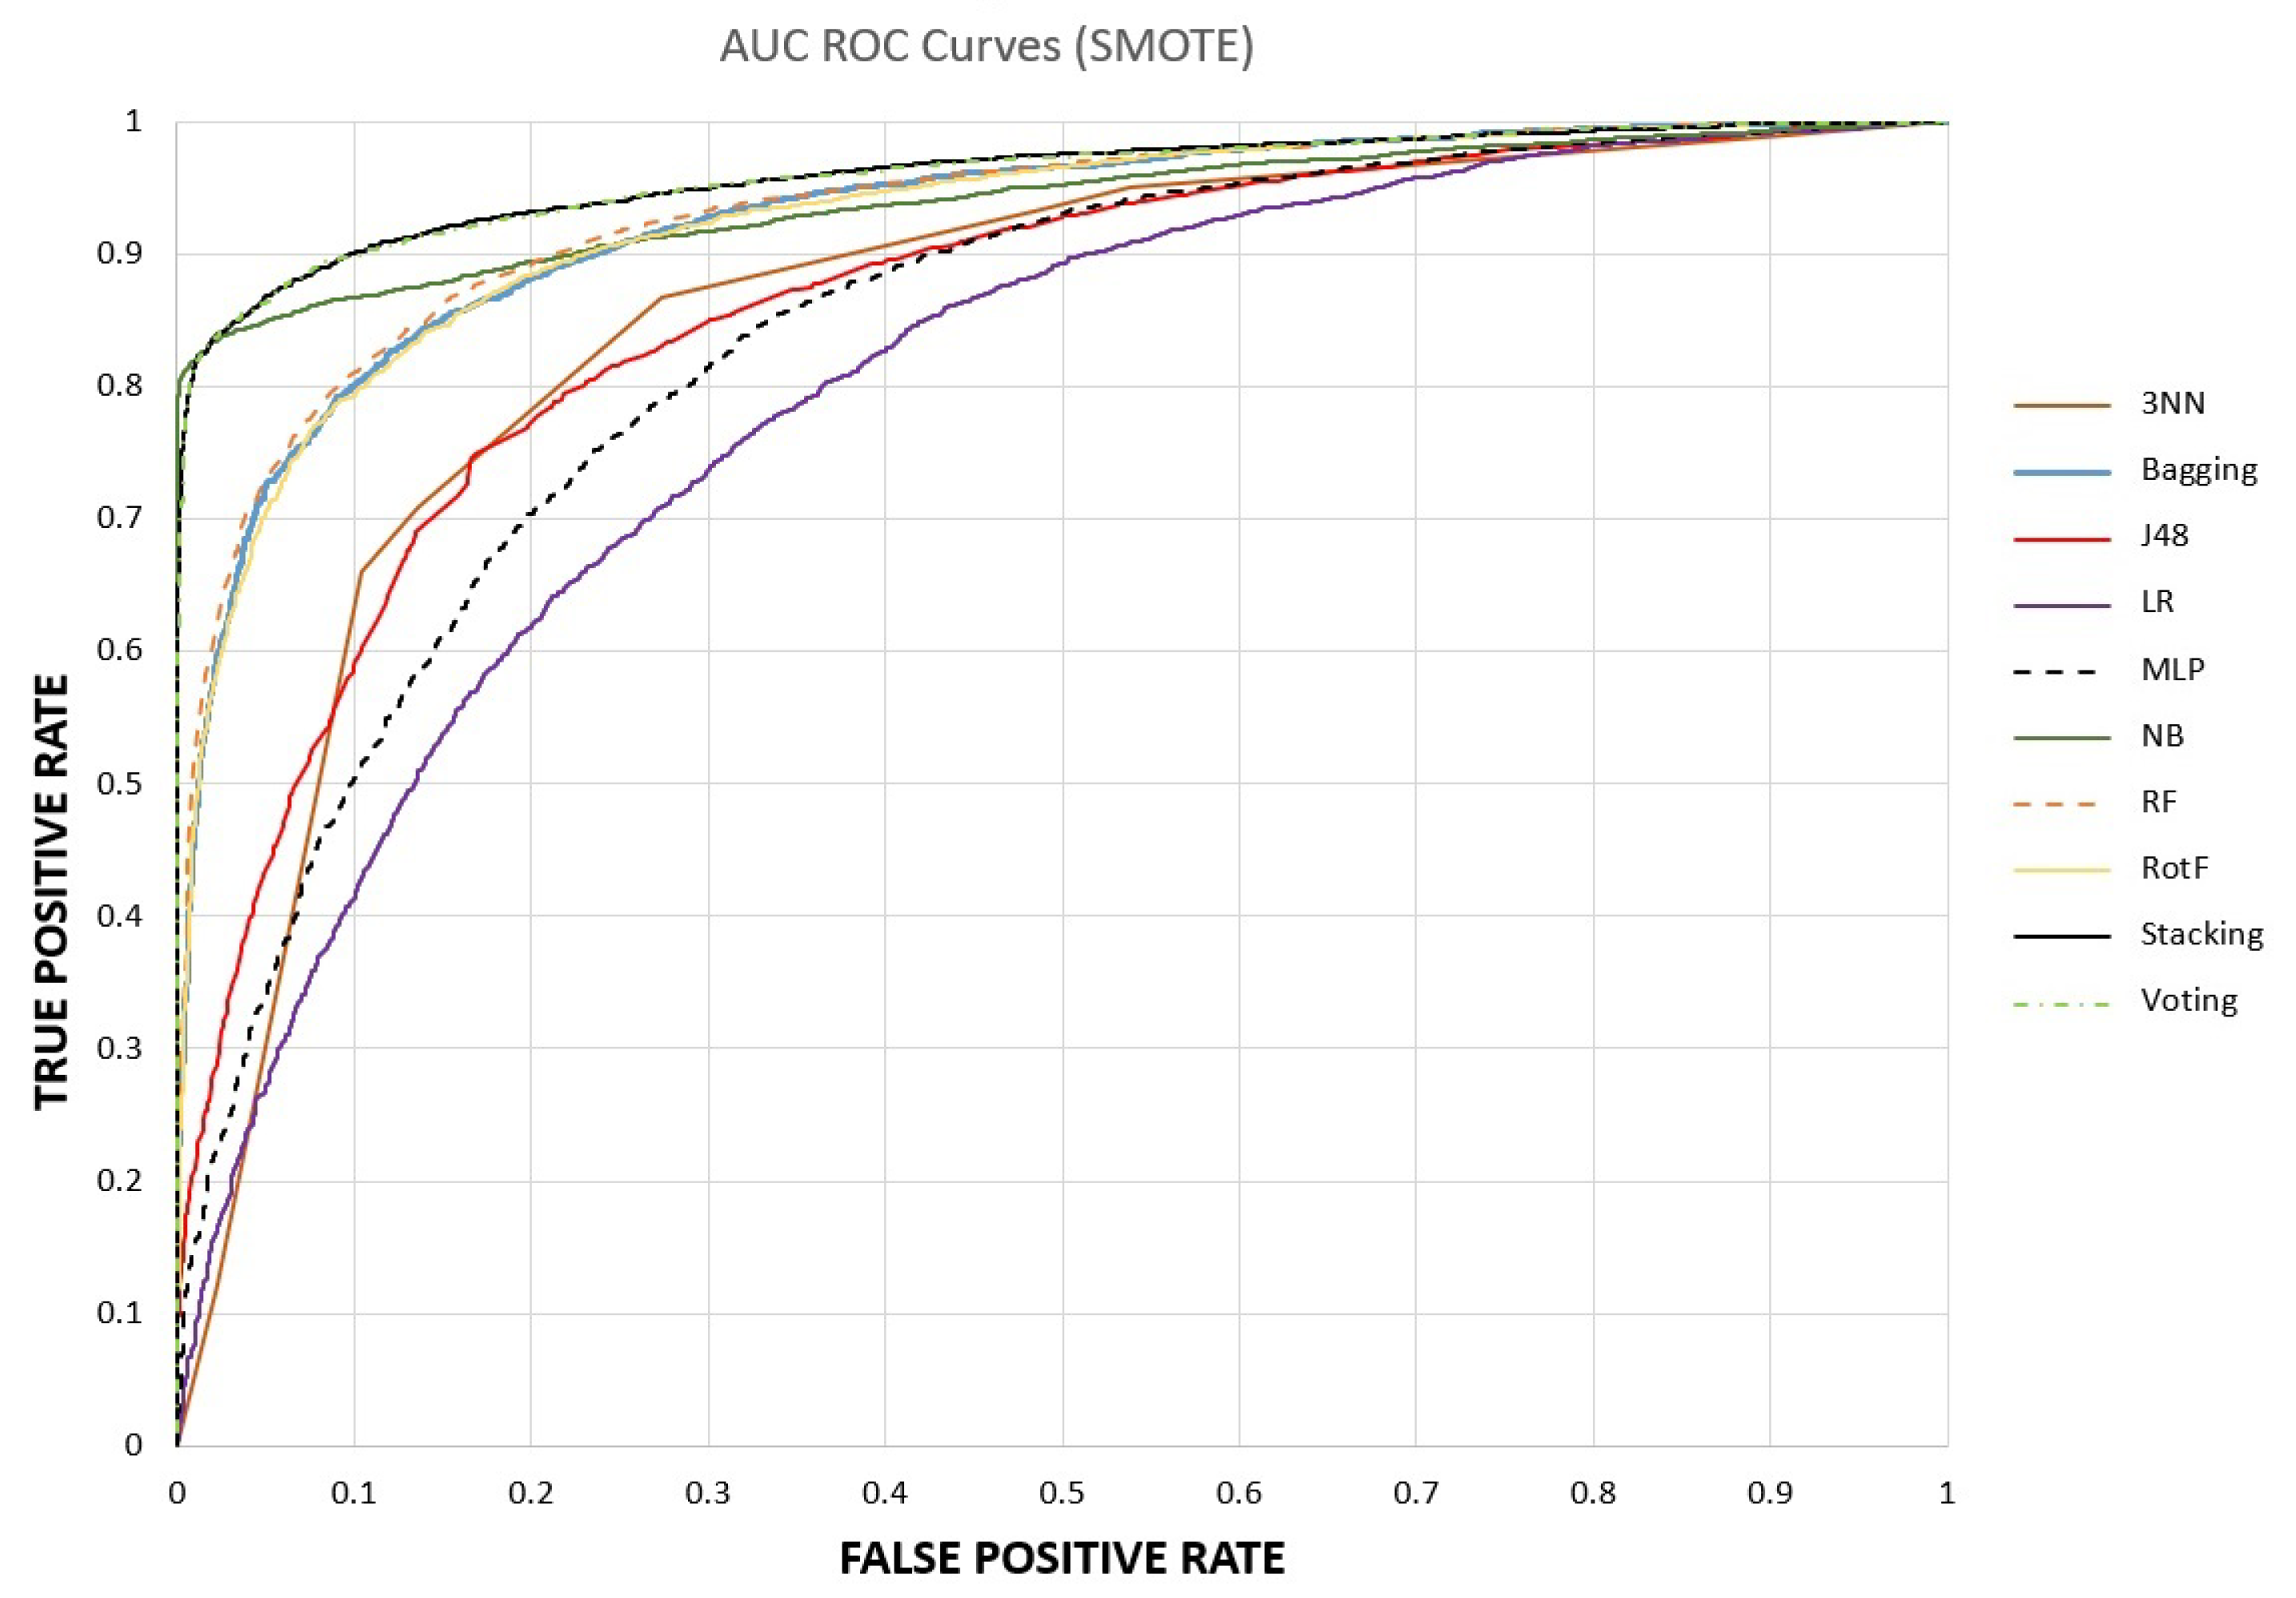
- Experimental evaluation is performed with various ML models, after the use or not of SMOTE, evaluating and comparing them in terms of accuracy, precision, recall and AUC. The experimental results indicated that the stacking ensemble model after SMOTE, with 10-fold cross-validation, prevailed over the other ones, constituting the main proposition of this research paper.
2. Materials and Methods
2.1. Dataset Description
2.2. Methodology
2.2.1. CAD Risk Prediction
2.2.2. Data Preprocessing
| Algorithm 1: SMOTE |
|
Repeat steps number 2–4 until the desired proportion of minority class is met. |
2.2.3. Features Analysis
2.3. Machine Learning Models
2.4. Evaluation Metrics
- Accuracy: Summarizes the performance of the classification task and measures the number of correctly predicted instances out of all the data instances.
- Precision: Shows the ratio of positive subjects in relation to true and false positive subjects.
- Recall: Corresponds to the proportion of participants who were diagnosed with CAD and were correctly considered positive, concerning all positive participants.
- In order to evaluate the distinguishability of a model, the AUC is exploited. It is a metric that varies in [0, 1]. The closer to one, the better the ML model performance is in distinguishing CAD from non-CAD instances.
2.5. Experimental Setup
3. Results
4. Discussion
5. Conclusions
Author Contributions
Funding
Conflicts of Interest
References
- Buijtendijk, M.F.; Barnett, P.; van den Hoff, M.J. Development of the human heart. Am. J. Med. Genet. Part C Semin. Med. Genet. 2020, 184, 7–22. [Google Scholar] [CrossRef] [PubMed] [Green Version]
- Lopez, E.O.; Ballard, B.D.; Jan, A. Cardiovascular disease. In StatPearls [Internet]; StatPearls Publishing: Tampa, FL, USA, 2021. [Google Scholar]
- Pagliaro, B.R.; Cannata, F.; Stefanini, G.G.; Bolognese, L. Myocardial ischemia and coronary disease in heart failure. Heart Fail. Rev. 2020, 25, 53–65. [Google Scholar] [CrossRef] [PubMed]
- Malakar, A.K.; Choudhury, D.; Halder, B.; Paul, P.; Uddin, A.; Chakraborty, S. A review on coronary artery disease, its risk factors, and therapeutics. J. Cell. Physiol. 2019, 234, 16812–16823. [Google Scholar] [CrossRef] [PubMed]
- Fox, K.A.; Metra, M.; Morais, J.; Atar, D. The myth of ‘stable’coronary artery disease. Nat. Rev. Cardiol. 2020, 17, 9–21. [Google Scholar] [CrossRef]
- Lee, S.E.; Sung, J.M.; Rizvi, A.; Lin, F.Y.; Kumar, A.; Hadamitzky, M.; Kim, Y.J.; Conte, E.; Andreini, D.; Pontone, G.; et al. Quantification of coronary atherosclerosis in the assessment of coronary artery disease. Circ. Cardiovasc. Imaging 2018, 11, e007562. [Google Scholar] [CrossRef] [Green Version]
- Reeh, J.; Therming, C.B.; Heitmann, M.; Højberg, S.; Sørum, C.; Bech, J.; Husum, D.; Dominguez, H.; Sehestedt, T.; Hermann, T.; et al. Prediction of obstructive coronary artery disease and prognosis in patients with suspected stable angina. Eur. Heart J. 2019, 40, 1426–1435. [Google Scholar] [CrossRef]
- Goyal, A.; Zeltser, R. Unstable angina. In StatPearls [Internet]; StatPearls Publishing: Tampa, FL, USA, 2022. [Google Scholar]
- Shao, C.; Wang, J.; Tian, J.; Tang, Y.D. Coronary artery disease: From mechanism to clinical practice. Adv. Exp. Med. Biol. 2020, 1177, 1–36. [Google Scholar]
- Wong, C.X.; Brown, A.; Lau, D.H.; Chugh, S.S.; Albert, C.M.; Kalman, J.M.; Sanders, P. Epidemiology of sudden cardiac death: Global and regional perspectives. Heart Lung Circ. 2019, 28, 6–14. [Google Scholar] [CrossRef] [Green Version]
- Nowbar, A.N.; Gitto, M.; Howard, J.P.; Francis, D.P.; Al-Lamee, R. Mortality from ischemic heart disease: Analysis of data from the World Health Organization and coronary artery disease risk factors From NCD Risk Factor Collaboration. Circ. Cardiovasc. Qual. Outcomes 2019, 12, e005375. [Google Scholar] [CrossRef]
- Mensah, G.A.; Roth, G.A.; Fuster, V. The global burden of cardiovascular diseases and risk factors: 2020 and beyond. J. Am. Coll. Cardiol. 2019, 74, 2529–2532. [Google Scholar] [CrossRef]
- Ambrose, J.A.; Najafi, A. Strategies for the prevention of coronary artery disease complications: Can we do better? Am. J. Med. 2018, 131, 1003–1009. [Google Scholar] [CrossRef] [PubMed]
- Houston, M. The role of noninvasive cardiovascular testing, applied clinical nutrition and nutritional supplements in the prevention and treatment of coronary heart disease. Ther. Adv. Cardiovasc. Dis. 2018, 12, 85–108. [Google Scholar] [CrossRef] [Green Version]
- Fazakis, N.; Kocsis, O.; Dritsas, E.; Alexiou, S.; Fakotakis, N.; Moustakas, K. Machine learning tools for long-term type 2 diabetes risk prediction. IEEE Access 2021, 9, 103737–103757. [Google Scholar] [CrossRef]
- Dritsas, E.; Trigka, M. Data-driven machine-learning methods for diabetes risk prediction. Sensors 2022, 22, 5304. [Google Scholar] [CrossRef] [PubMed]
- Alexiou, S.; Dritsas, E.; Kocsis, O.; Moustakas, K.; Fakotakis, N. An approach for Personalized Continuous Glucose Prediction with Regression Trees. In Proceedings of the 2021 6th South-East Europe Design Automation, Computer Engineering, Computer Networks and Social Media Conference (SEEDA-CECNSM), Preveza, Greece, 24–26 September 2021; pp. 1–6. [Google Scholar]
- Dritsas, E.; Alexiou, S.; Konstantoulas, I.; Moustakas, K. Short-term Glucose Prediction based on Oral Glucose Tolerance Test Values. In Proceedings of the 15th International Joint Conference on Biomedical Engineering Systems and Technologies (BIOSTEC 2022)—Volume 5: HEALTHINF, Online Streaming, 9–11 February 2022; pp. 249–255. [Google Scholar]
- Fazakis, N.; Dritsas, E.; Kocsis, O.; Fakotakis, N.; Moustakas, K. Long-Term Cholesterol Risk Prediction with Machine Learning Techniques in ELSA Database. In Proceedings of the 13th International Joint Conference on Computational Intelligence (IJCCI), SCIPTRESS, Online Streaming, 25–27 October 2021; pp. 445–450. [Google Scholar]
- Dritsas, E.; Trigka, M. Machine learning methods for hypercholesterolemia long-term risk prediction. Sensors 2022, 22, 5365. [Google Scholar] [CrossRef] [PubMed]
- Dritsas, E.; Fazakis, N.; Kocsis, O.; Fakotakis, N.; Moustakas, K. Long-Term Hypertension Risk Prediction with ML Techniques in ELSA Database. In Proceedings of the International Conference on Learning and Intelligent Optimization, Athens, Greece, 20–25 June 2021; pp. 113–120. [Google Scholar]
- Dritsas, E.; Alexiou, S.; Moustakas, K. Efficient Data-driven Machine Learning Models for Hypertension Risk Prediction. In Proceedings of the 2022 International Conference on INnovations in Intelligent SysTems and Applications (INISTA), Biarritz, France, 8–12 August 2022; pp. 1–6. [Google Scholar]
- Dritsas, E.; Alexiou, S.; Moustakas, K. COPD severity prediction in elderly with ML techniques. In Proceedings of the 15th International Conference on PErvasive Technologies Related to Assistive Environments, Corfu Greece, 29 June–1 July 2022; pp. 185–189. [Google Scholar]
- Dritsas, E.; Trigka, M. Supervised Machine Learning Models to Identify Early-Stage Symptoms of SARS-CoV-2. Sensors 2022, 23, 40. [Google Scholar] [CrossRef]
- Dritsas, E.; Trigka, M. Stroke risk prediction with machine learning techniques. Sensors 2022, 22, 4670. [Google Scholar] [CrossRef]
- Dritsas, E.; Trigka, M. Machine learning techniques for chronic kidney disease risk prediction. Big Data Cogn. Comput. 2022, 6, 98. [Google Scholar] [CrossRef]
- Dritsas, E.; Trigka, M. Supervised Machine Learning Models for Liver Disease Risk Prediction. Computers 2023, 12, 19. [Google Scholar] [CrossRef]
- Konstantoulas, I.; Kocsis, O.; Dritsas, E.; Fakotakis, N.; Moustakas, K. Sleep Quality Monitoring with Human Assisted Corrections. In Proceedings of the International Joint Conference on Computational Intelligence (IJCCI), SCIPTRESS, Online Streaming, 25–27 October 2021; pp. 435–444. [Google Scholar]
- Konstantoulas, I.; Dritsas, E.; Moustakas, K. Sleep Quality Evaluation in Rich Information Data. In Proceedings of the 2022 13th International Conference on Information, Intelligence, Systems & Applications (IISA), Corfu, Greece, 18–20 July 2022; pp. 1–4. [Google Scholar]
- Konerman, M.A.; Beste, L.A.; Van, T.; Liu, B.; Zhang, X.; Zhu, J.; Saini, S.D.; Su, G.L.; Nallamothu, B.K.; Ioannou, G.N.; et al. Machine learning models to predict disease progression among veterans with hepatitis C virus. PLoS ONE 2019, 14, e0208141. [Google Scholar] [CrossRef]
- Dritsas, E.; Alexiou, S.; Moustakas, K. Cardiovascular Disease Risk Prediction with Supervised Machine Learning Techniques. In Proceedings of the ICT4AWE 8th International Conference on Information and Communication Technologies for Ageing Well and e-Health, Online Streaming, 22–24 April 2022; pp. 315–321. [Google Scholar]
- Dritsas, E.; Trigka, M. Lung Cancer Risk Prediction with Machine Learning Models. Big Data Cogn. Comput. 2022, 6, 139. [Google Scholar] [CrossRef]
- Dritsas, E.; Alexiou, S.; Moustakas, K. Metabolic Syndrome Risk Forecasting on Elderly with ML Techniques. In Proceedings of the 16th International Conference on Learning and Intelligent Optimization, Cyclades, Greece, 5–10 June 2022. [Google Scholar]
- Coronary Prediction Dataset. Available online: https://www.kaggle.com/datasets/jiantay33/coronary-prediction (accessed on 27 December 2022).
- Wada, H.; Miyauchi, K.; Daida, H. Gender differences in the clinical features and outcomes of patients with coronary artery disease. Expert Rev. Cardiovasc. Ther. 2019, 17, 127–133. [Google Scholar] [CrossRef] [PubMed]
- Tillmann, T.; Vaucher, J.; Okbay, A.; Pikhart, H.; Peasey, A.; Kubinova, R.; Pajak, A.; Tamosiunas, A.; Malyutina, S.; Hartwig, F.P.; et al. Education and coronary heart disease: Mendelian randomisation study. BMJ 2017, 358. [Google Scholar] [CrossRef] [PubMed] [Green Version]
- Kondo, T.; Nakano, Y.; Adachi, S.; Murohara, T. Effects of tobacco smoking on cardiovascular disease. Circ. J. 2019, 83, 1980–1985. [Google Scholar] [CrossRef] [Green Version]
- Fuchs, F.D.; Whelton, P.K. High blood pressure and cardiovascular disease. Hypertension 2020, 75, 285–292. [Google Scholar] [CrossRef]
- Katsanos, A.H.; Palaiodimou, L.; Price, C.; Giannopoulos, S.; Lemmens, R.; Kosmidou, M.; Georgakis, M.; Weimar, C.; Kelly, P.; Tsivgoulis, G. Colchicine for stroke prevention in patients with coronary artery disease: A systematic review and meta-analysis. Eur. J. Neurol. 2020, 27, 1035–1038. [Google Scholar] [CrossRef]
- Vidal-Petiot, E.; Greenlaw, N.; Ford, I.; Ferrari, R.; Fox, K.M.; Tardif, J.C.; Tendera, M.; Parkhomenko, A.; Bhatt, D.L.; Steg, P.G.; et al. Relationships between components of blood pressure and cardiovascular events in patients with stable coronary artery disease and hypertension. Hypertension 2018, 71, 168–176. [Google Scholar] [CrossRef] [Green Version]
- Fishman, S.L.; Sonmez, H.; Basman, C.; Singh, V.; Poretsky, L. The role of advanced glycation end-products in the development of coronary artery disease in patients with and without diabetes mellitus: A review. Mol. Med. 2018, 24, 59. [Google Scholar] [CrossRef] [PubMed] [Green Version]
- Hackshaw, A.; Morris, J.K.; Boniface, S.; Tang, J.L.; Milenković, D. Low cigarette consumption and risk of coronary heart disease and stroke: Meta-analysis of 141 cohort studies in 55 study reports. BMJ 2018, 361, k1611. [Google Scholar] [CrossRef] [Green Version]
- Tada, H.; Nohara, A.; Inazu, A.; Sakuma, N.; Mabuchi, H.; Kawashiri, M.A. Sitosterolemia, hypercholesterolemia, and coronary artery disease. J. Atheroscler. Thromb. 2018, 25, 783–789. [Google Scholar] [CrossRef] [Green Version]
- Nazarzadeh, M.; Pinho-Gomes, A.C.; Byrne, K.S.; Canoy, D.; Raimondi, F.; Solares, J.R.A.; Otto, C.M.; Rahimi, K. Systolic blood pressure and risk of valvular heart disease: A Mendelian randomization study. JAMA Cardiol. 2019, 4, 788–795. [Google Scholar] [CrossRef] [PubMed]
- Tackling, G.; Borhade, M.B. Hypertensive heart disease. In StatPearls [Internet]; StatPearls Publishing: Tampa, FL, USA, 2021. [Google Scholar]
- Piché, M.E.; Tchernof, A.; Després, J.P. Obesity phenotypes, diabetes, and cardiovascular diseases. Circ. Res. 2020, 126, 1477–1500. [Google Scholar] [CrossRef] [PubMed]
- Forte, G.; Favieri, F.; Casagrande, M. Heart rate variability and cognitive function: A systematic review. Front. Neurosci. 2019, 13, 710. [Google Scholar] [CrossRef] [Green Version]
- Xia, J.; Yin, C. Glucose variability and coronary artery disease. Heart Lung Circ. 2019, 28, 553–559. [Google Scholar] [CrossRef] [PubMed]
- Rattan, V.; Mittal, R.; Singh, J.; Malik, V. Analyzing the Application of SMOTE on Machine Learning Classifiers. In Proceedings of the 2021 International Conference on Emerging Smart Computing and Informatics (ESCI), Pune, India, 5–7 March 2021; pp. 692–695. [Google Scholar]
- Cunningham, P.; Delany, S.J. k-Nearest neighbour classifiers-A Tutorial. Acm Comput. Surv. (CSUR) 2021, 54, 1–25. [Google Scholar] [CrossRef]
- Dritsas, E.; Fazakis, N.; Kocsis, O.; Moustakas, K.; Fakotakis, N. Optimal Team Pairing of Elder Office Employees with Machine Learning on Synthetic Data. In Proceedings of the 2021 12th International Conference on Information, Intelligence, Systems & Applications (IISA), Chania Crete, Greece, 12–14 July 2021; pp. 1–4. [Google Scholar]
- Gnanambal, S.; Thangaraj, M.; Meenatchi, V.; Gayathri, V. Classification algorithms with attribute selection: An evaluation study using WEKA. Int. J. Adv. Netw. Appl. 2018, 9, 3640–3644. [Google Scholar]
- Dimitriadis, S.I.; Liparas, D.; Tsolaki, M.N.; Alzheimer’s Disease Neuroimaging Initiative. Random forest feature selection, fusion and ensemble strategy: Combining multiple morphological MRI measures to discriminate among healhy elderly, MCI, cMCI and alzheimer’s disease patients: From the alzheimer’s disease neuroimaging initiative (ADNI) database. J. Neurosci. Methods 2018, 302, 14–23. [Google Scholar]
- Berrar, D. Bayes’ theorem and naive Bayes classifier. Encycl. Bioinform. Comput. Biol. ABC Bioinform. 2018, 403. [Google Scholar]
- Nusinovici, S.; Tham, Y.C.; Yan, M.Y.C.; Ting, D.S.W.; Li, J.; Sabanayagam, C.; Wong, T.Y.; Cheng, C.Y. Logistic regression was as good as machine learning for predicting major chronic diseases. J. Clin. Epidemiol. 2020, 122, 56–69. [Google Scholar] [CrossRef]
- Posonia, A.M.; Vigneshwari, S.; Rani, D.J. Machine Learning based Diabetes Prediction using Decision Tree J48. In Proceedings of the 2020 3rd International Conference on Intelligent Sustainable Systems (ICISS), Thoothukudi, India, 3–5 December 2020; pp. 498–502. [Google Scholar]
- González, S.; García, S.; Del Ser, J.; Rokach, L.; Herrera, F. A practical tutorial on bagging and boosting based ensembles for machine learning: Algorithms, software tools, performance study, practical perspectives and opportunities. Inf. Fusion 2020, 64, 205–237. [Google Scholar] [CrossRef]
- Palimkar, P.; Shaw, R.N.; Ghosh, A. Machine learning technique to prognosis diabetes disease: Random forest classifier approach. In Advanced Computing and Intelligent Technologies; Springer: Berlin/Heidelberg, Germany, 2022; pp. 219–244. [Google Scholar]
- Husna, N.A.; Bustamam, A.; Yanuar, A.; Sarwinda, D. The drug design for diabetes mellitus type II using rotation forest ensemble classifier. Procedia Comput. Sci. 2021, 179, 161–168. [Google Scholar] [CrossRef]
- Dogan, A.; Birant, D. A weighted majority voting ensemble approach for classification. In Proceedings of the 2019 4th International Conference on Computer Science and Engineering (UBMK), Samsun, Turkey, 11–15 September 2019; pp. 1–6. [Google Scholar]
- Pavlyshenko, B. Using stacking approaches for machine learning models. In Proceedings of the 2018 IEEE Second International Conference on Data Stream Mining & Processing (DSMP), Lviv, Ukraine, 21–25 August 2018; pp. 255–258. [Google Scholar]
- Masih, N.; Naz, H.; Ahuja, S. Multilayer perceptron based deep neural network for early detection of coronary heart disease. Health Technol. 2021, 11, 127–138. [Google Scholar] [CrossRef]
- Handelman, G.S.; Kok, H.K.; Chandra, R.V.; Razavi, A.H.; Huang, S.; Brooks, M.; Lee, M.J.; Asadi, H. Peering into the black box of artificial intelligence: Evaluation metrics of machine learning methods. Am. J. Roentgenol. 2019, 212, 38–43. [Google Scholar] [CrossRef] [PubMed]
- Weka. Available online: https://www.weka.io/ (accessed on 27 December 2022).
- Abdar, M.; Książek, W.; Acharya, U.R.; Tan, R.S.; Makarenkov, V.; Pławiak, P. A new machine learning technique for an accurate diagnosis of coronary artery disease. Comput. Methods Programs Biomed. 2019, 179, 104992. [Google Scholar] [CrossRef] [PubMed]
- Dahal, K.R.; Gautam, Y. Argumentative Comparative Analysis of Machine Learning on Coronary Artery Disease. Open J. Stat. 2020, 10, 694–705. [Google Scholar] [CrossRef]
- Chen, J.I.Z.; Hengjinda, P. Early prediction of coronary artery disease (cad) by machine learning method-a comparative study. J. Artif. Intell. 2021, 3, 17–33. [Google Scholar]
- Muhammad, L.; Al-Shourbaji, I.; Haruna, A.A.; Mohammed, I.; Ahmad, A.; Jibrin, M.B. Machine Learning Predictive Models for Coronary Artery Disease. Sn Comput. Sci. 2021, 2, 350. [Google Scholar] [CrossRef]
- Joloudari, J.H.; Joloudari, E.H.; Saadatfar, H.; Ghasemigol, M.; Razavi, S.M.; Mosavi, A.; Nabipour, N.; Shamshirband, S.; Nadai, L. Coronary artery disease diagnosis; ranking the significant features using a random trees model. Int. J. Environ. Res. Public Health 2020, 17, 731. [Google Scholar] [CrossRef] [Green Version]
- Dipto, I.C.; Islam, T.; Rahman, H.M.; Rahman, M.A. Comparison of Different Machine Learning Algorithms for the Prediction of Coronary Artery Disease. J. Data Anal. Inf. Process. 2020, 8, 41–68. [Google Scholar] [CrossRef] [Green Version]
- Nassif, A.B.; Mahdi, O.; Nasir, Q.; Talib, M.A.; Azzeh, M. Machine learning classifications of coronary artery disease. In Proceedings of the 2018 International Joint Symposium on Artificial Intelligence and Natural Language Processing (iSAI-NLP), Pattaya, Thailand, 15–17 November 2018; pp. 1–6. [Google Scholar]
- Beunza, J.J.; Puertas, E.; García-Ovejero, E.; Villalba, G.; Condes, E.; Koleva, G.; Hurtado, C.; Landecho, M.F. Comparison of machine learning algorithms for clinical event prediction (risk of coronary heart disease). J. Biomed. Inform. 2019, 97, 103257. [Google Scholar] [CrossRef]
- Minou, J.; Mantas, J.; Malamateniou, F.; Kaitelidou, D. Classification Techniques for Cardio-Vascular Diseases Using Supervised Machine Learning. Med. Arch. 2020, 74, 39. [Google Scholar] [CrossRef] [PubMed]
- Wang, J.; Rao, C.; Goh, M.; Xiao, X. Risk assessment of coronary heart disease based on cloud-random forest. Artif. Intell. Rev. 2023, 56, 203–232. [Google Scholar] [CrossRef]


| Attribute | Description | Attribute | Description | ||
|---|---|---|---|---|---|
| Min | Max | Mean ± stdDev | Gender | male (1622), Female (2033) | |
| Age | 32 | 70 | 49.5 ± 8.56 | Education | PhD (423), BSc (1100), High School (1526), MSc (606) |
| Cigs/day | 0 | 70 | 9 ± 11.92 | ||
| totChol | 113 | 464 | 236.8 ± 43.69 | Current smoker | Yes (1788), No (1867) |
| SysBP | 83.5 | 295 | 132.3 ± 22.1 | ||
| DiaBP | 48 | 142.5 | 82.9 ± 11.97 | BPMeds | Yes (111), No (3544) |
| BMI | 15.54 | 56.8 | 25.8 ± 4.07 | prevStroke | Yes (21), No (3634) |
| Heart rate | 44 | 143 | 75.7 ± 11.99 | prevHyp | Yes (1138), No (2517) |
| Glucose | 40 | 394 | 81.8 ± 23.89 | Diabetes | Yes (98), No (3557) |
| Attribute | Description | Attribute | Description | ||
|---|---|---|---|---|---|
| Min | Max | Mean ± stdDev | Gender | Male (3393), Female (2805) | |
| Age | 32 | 70 | 51.5 ± 8.34 | Education | Phd (665), BSc (1693), High School (3198), MSc (642) |
| Cigs/day | 0 | 70 | 9.4 ± 11.79 | ||
| totChol | 113 | 464 | 240.5 ± 44.18 | Current smoker | Yes (2803), No (3395) |
| sysBP | 83.5 | 295 | 136.8 ± 23.8 | ||
| diaBP | 48 | 142.5 | 84.7 ± 12.59 | BPMeds | Yes (111), No (6087) |
| BMI | 15.54 | 56.8 | 26 ± 3.91 | prevStroke | Yes (21), No (6177) |
| Heart rate | 44 | 143 | 75.8 ± 11.45 | prevHyp | Yes (2335), No (3863) |
| Glucose | 40 | 394 | 84.3 ± 30.95 | Diabetes | Yes (183), No (6015) |
| Models | Parameters | Models | Parameters |
|---|---|---|---|
| NB | useKernelEstimator: False useSupervisedDiscretization: True | RotF | classifier: RF numberOfGroups: True projectionFilter: PrincipalComponents |
| LR | ridge = useConjugateGradientDescent: True | J48 | reducedErrorPruning: False savelnstanceData: True useMDLCorrection: True, subtreeRaising: True binarySplits = True, collapseTree = True |
| MLP | learning rate = 0.1 momentum = 0.2 training time = 200 | Stacking | classifiers: RF and NB metaClassifier: LR |
| KNN | K=3 Search Algorithm: LinearNNSearch with Euclidean cross-validate = True | Voting | classifiers: RF and NB combinationRule: average of probabilities |
| RF | breakTiesRadomly: True numIterations = 500 storeOutOfBagPredictions: True | Bagging | classifiers: RF printClassifiers: True storeOutOfBagPredictions: True |
| Accuracy | Precision (CAD class) | Recall (CAD Class) | AUC | |||||
|---|---|---|---|---|---|---|---|---|
| No SMOTE | SMOTE | No SMOTE | SMOTE | No SMOTE | SMOTE | No SMOTE | SMOTE | |
| NB | 0.700 | 0.906 | 0.336 | 0.973 | 0.318 | 0.835 | 0.700 | 0.941 |
| LR | 0.754 | 0.779 | 0.645 | 0.710 | 0.088 | 0.762 | 0.729 | 0.793 |
| MLP | 0.730 | 0.798 | 0.355 | 0.742 | 0.146 | 0.801 | 0.661 | 0.833 |
| 3-NN | 0.722 | 0.796 | 0.311 | 0.760 | 0.140 | 0.867 | 0.585 | 0.854 |
| RF | 0.748 | 0.855 | 0.493 | 0.844 | 0.063 | 0.871 | 0.693 | 0.931 |
| RotF | 0.751 | 0.845 | 0.625 | 0.827 | 0.054 | 0.872 | 0.713 | 0.925 |
| J48 | 0.714 | 0.787 | 0.268 | 0.777 | 0.205 | 0.804 | 0.636 | 0.857 |
| Stacking | 0.747 | 0.909 | 0.482 | 0.967 | 0.059 | 0.876 | 0.698 | 0.961 |
| Bagging | 0.748 | 0.843 | 0.500 | 0.827 | 0.045 | 0.866 | 0.702 | 0.926 |
| Voting | 0.787 | 0.908 | 0.367 | 0.960 | 0.187 | 0.852 | 0.702 | 0.958 |
Disclaimer/Publisher’s Note: The statements, opinions and data contained in all publications are solely those of the individual author(s) and contributor(s) and not of MDPI and/or the editor(s). MDPI and/or the editor(s) disclaim responsibility for any injury to people or property resulting from any ideas, methods, instructions or products referred to in the content. |
© 2023 by the authors. Licensee MDPI, Basel, Switzerland. This article is an open access article distributed under the terms and conditions of the Creative Commons Attribution (CC BY) license (https://creativecommons.org/licenses/by/4.0/).
Share and Cite
Trigka, M.; Dritsas, E. Long-Term Coronary Artery Disease Risk Prediction with Machine Learning Models. Sensors 2023, 23, 1193. https://doi.org/10.3390/s23031193
Trigka M, Dritsas E. Long-Term Coronary Artery Disease Risk Prediction with Machine Learning Models. Sensors. 2023; 23(3):1193. https://doi.org/10.3390/s23031193
Chicago/Turabian StyleTrigka, Maria, and Elias Dritsas. 2023. "Long-Term Coronary Artery Disease Risk Prediction with Machine Learning Models" Sensors 23, no. 3: 1193. https://doi.org/10.3390/s23031193
APA StyleTrigka, M., & Dritsas, E. (2023). Long-Term Coronary Artery Disease Risk Prediction with Machine Learning Models. Sensors, 23(3), 1193. https://doi.org/10.3390/s23031193