
Genomic Landscape of Breast Cancer: Study Across Diverse Ethnic Groups

 , , , , , , ,
  and
and 
Abstract
1. Background
2. Materials and Methods
2.1. Study Samples
2.2. Genomic Characteristics of BC by Ethnic Group
2.3. Comparison of the Most Frequently Mutated Genes Across Ethnic Groups
2.4. Comparison of Altered and Non-Altered Groups Based on Mutation Status
2.5. Gene Classification
2.6. Enrichment Analysis
2.7. Statistical Analysis
3. Results
3.1. Sociodemographic Characteristics
3.2. Clinicopathological Characteristics
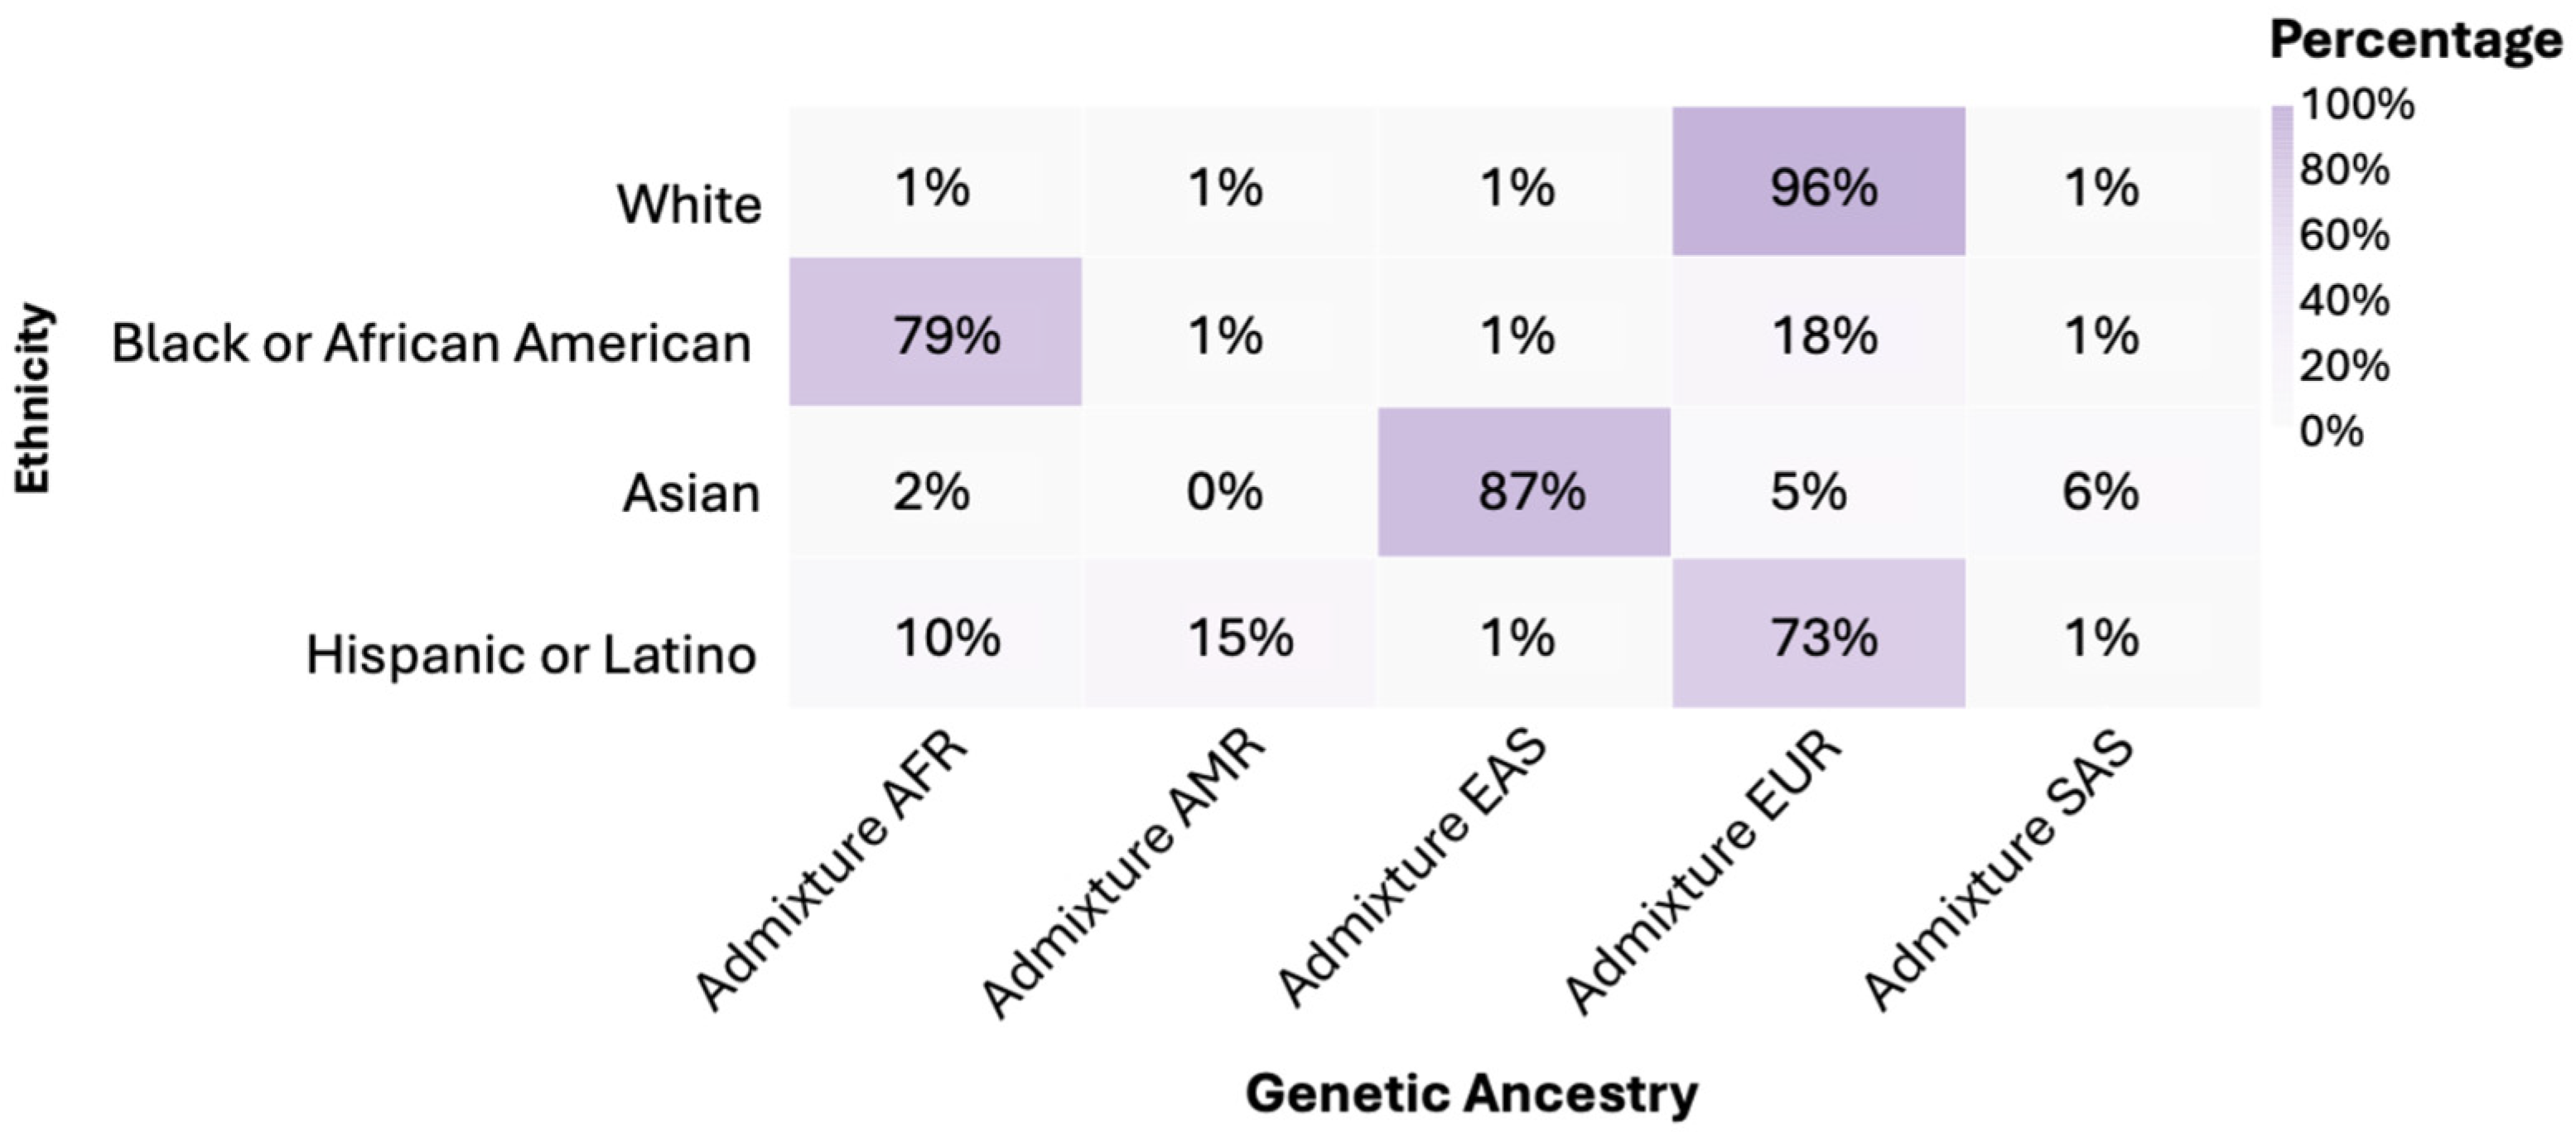
3.3. Genetic Ancestry
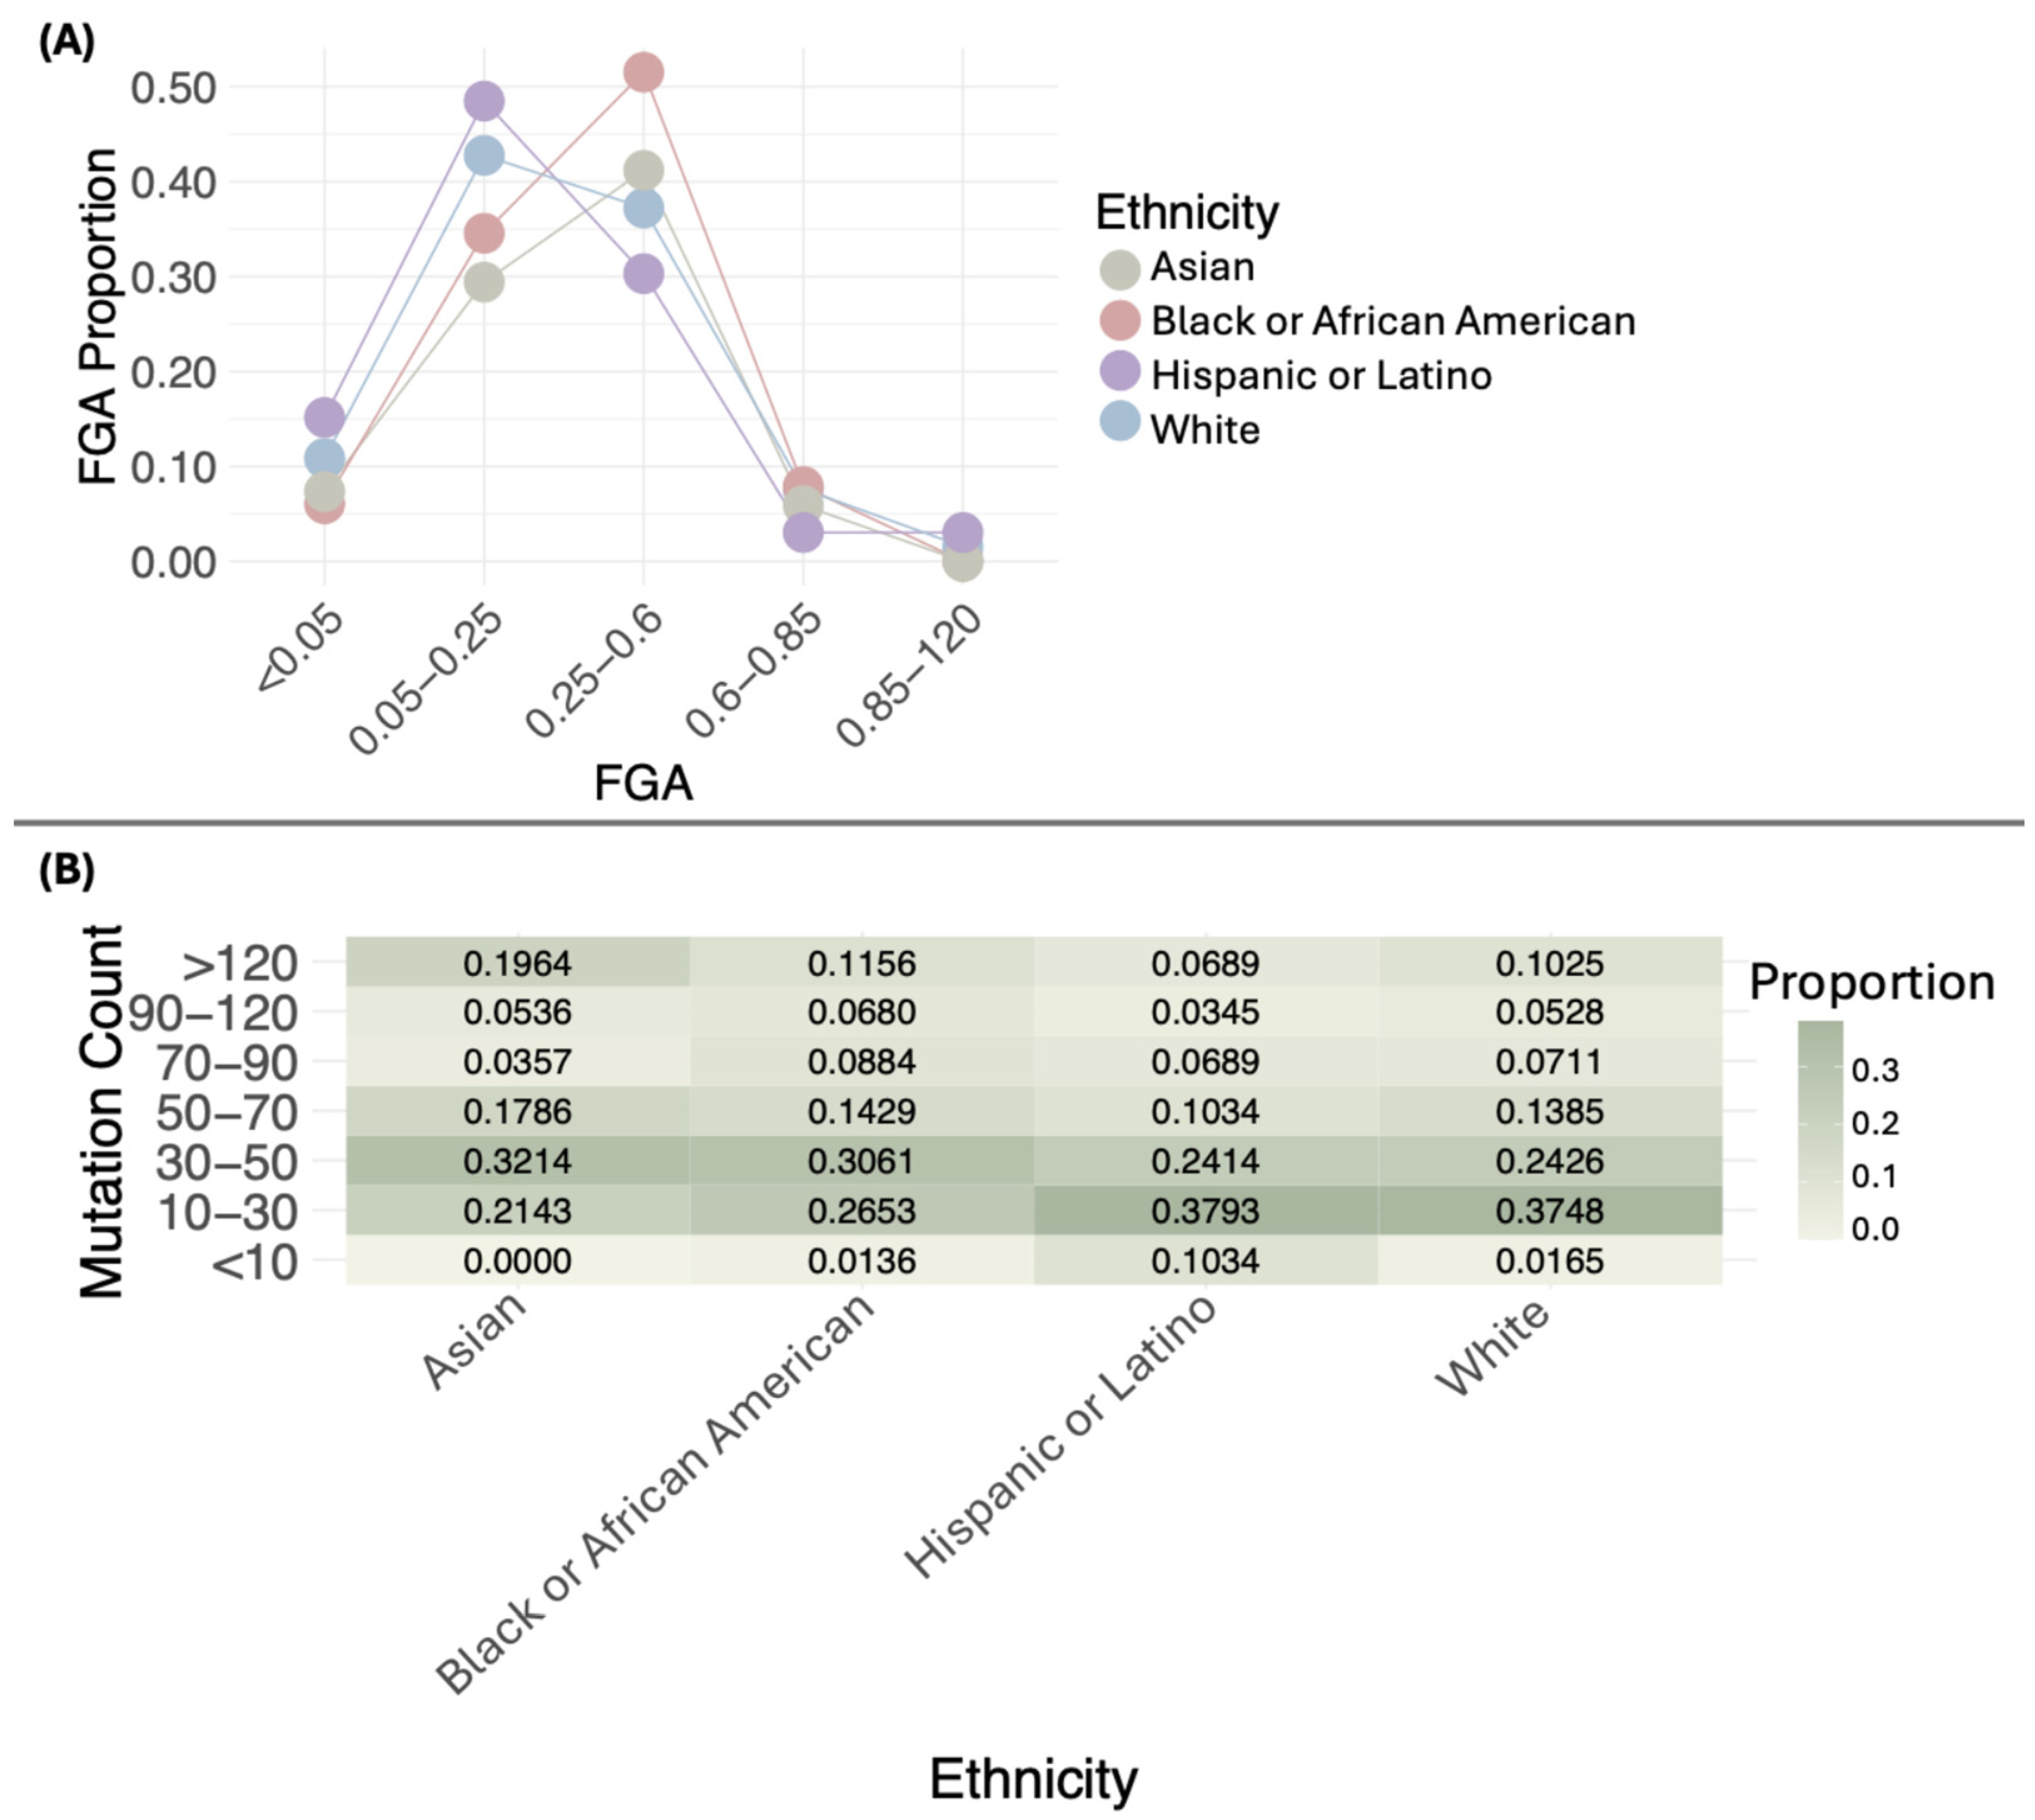
3.4. Genomic Characteristics of BC
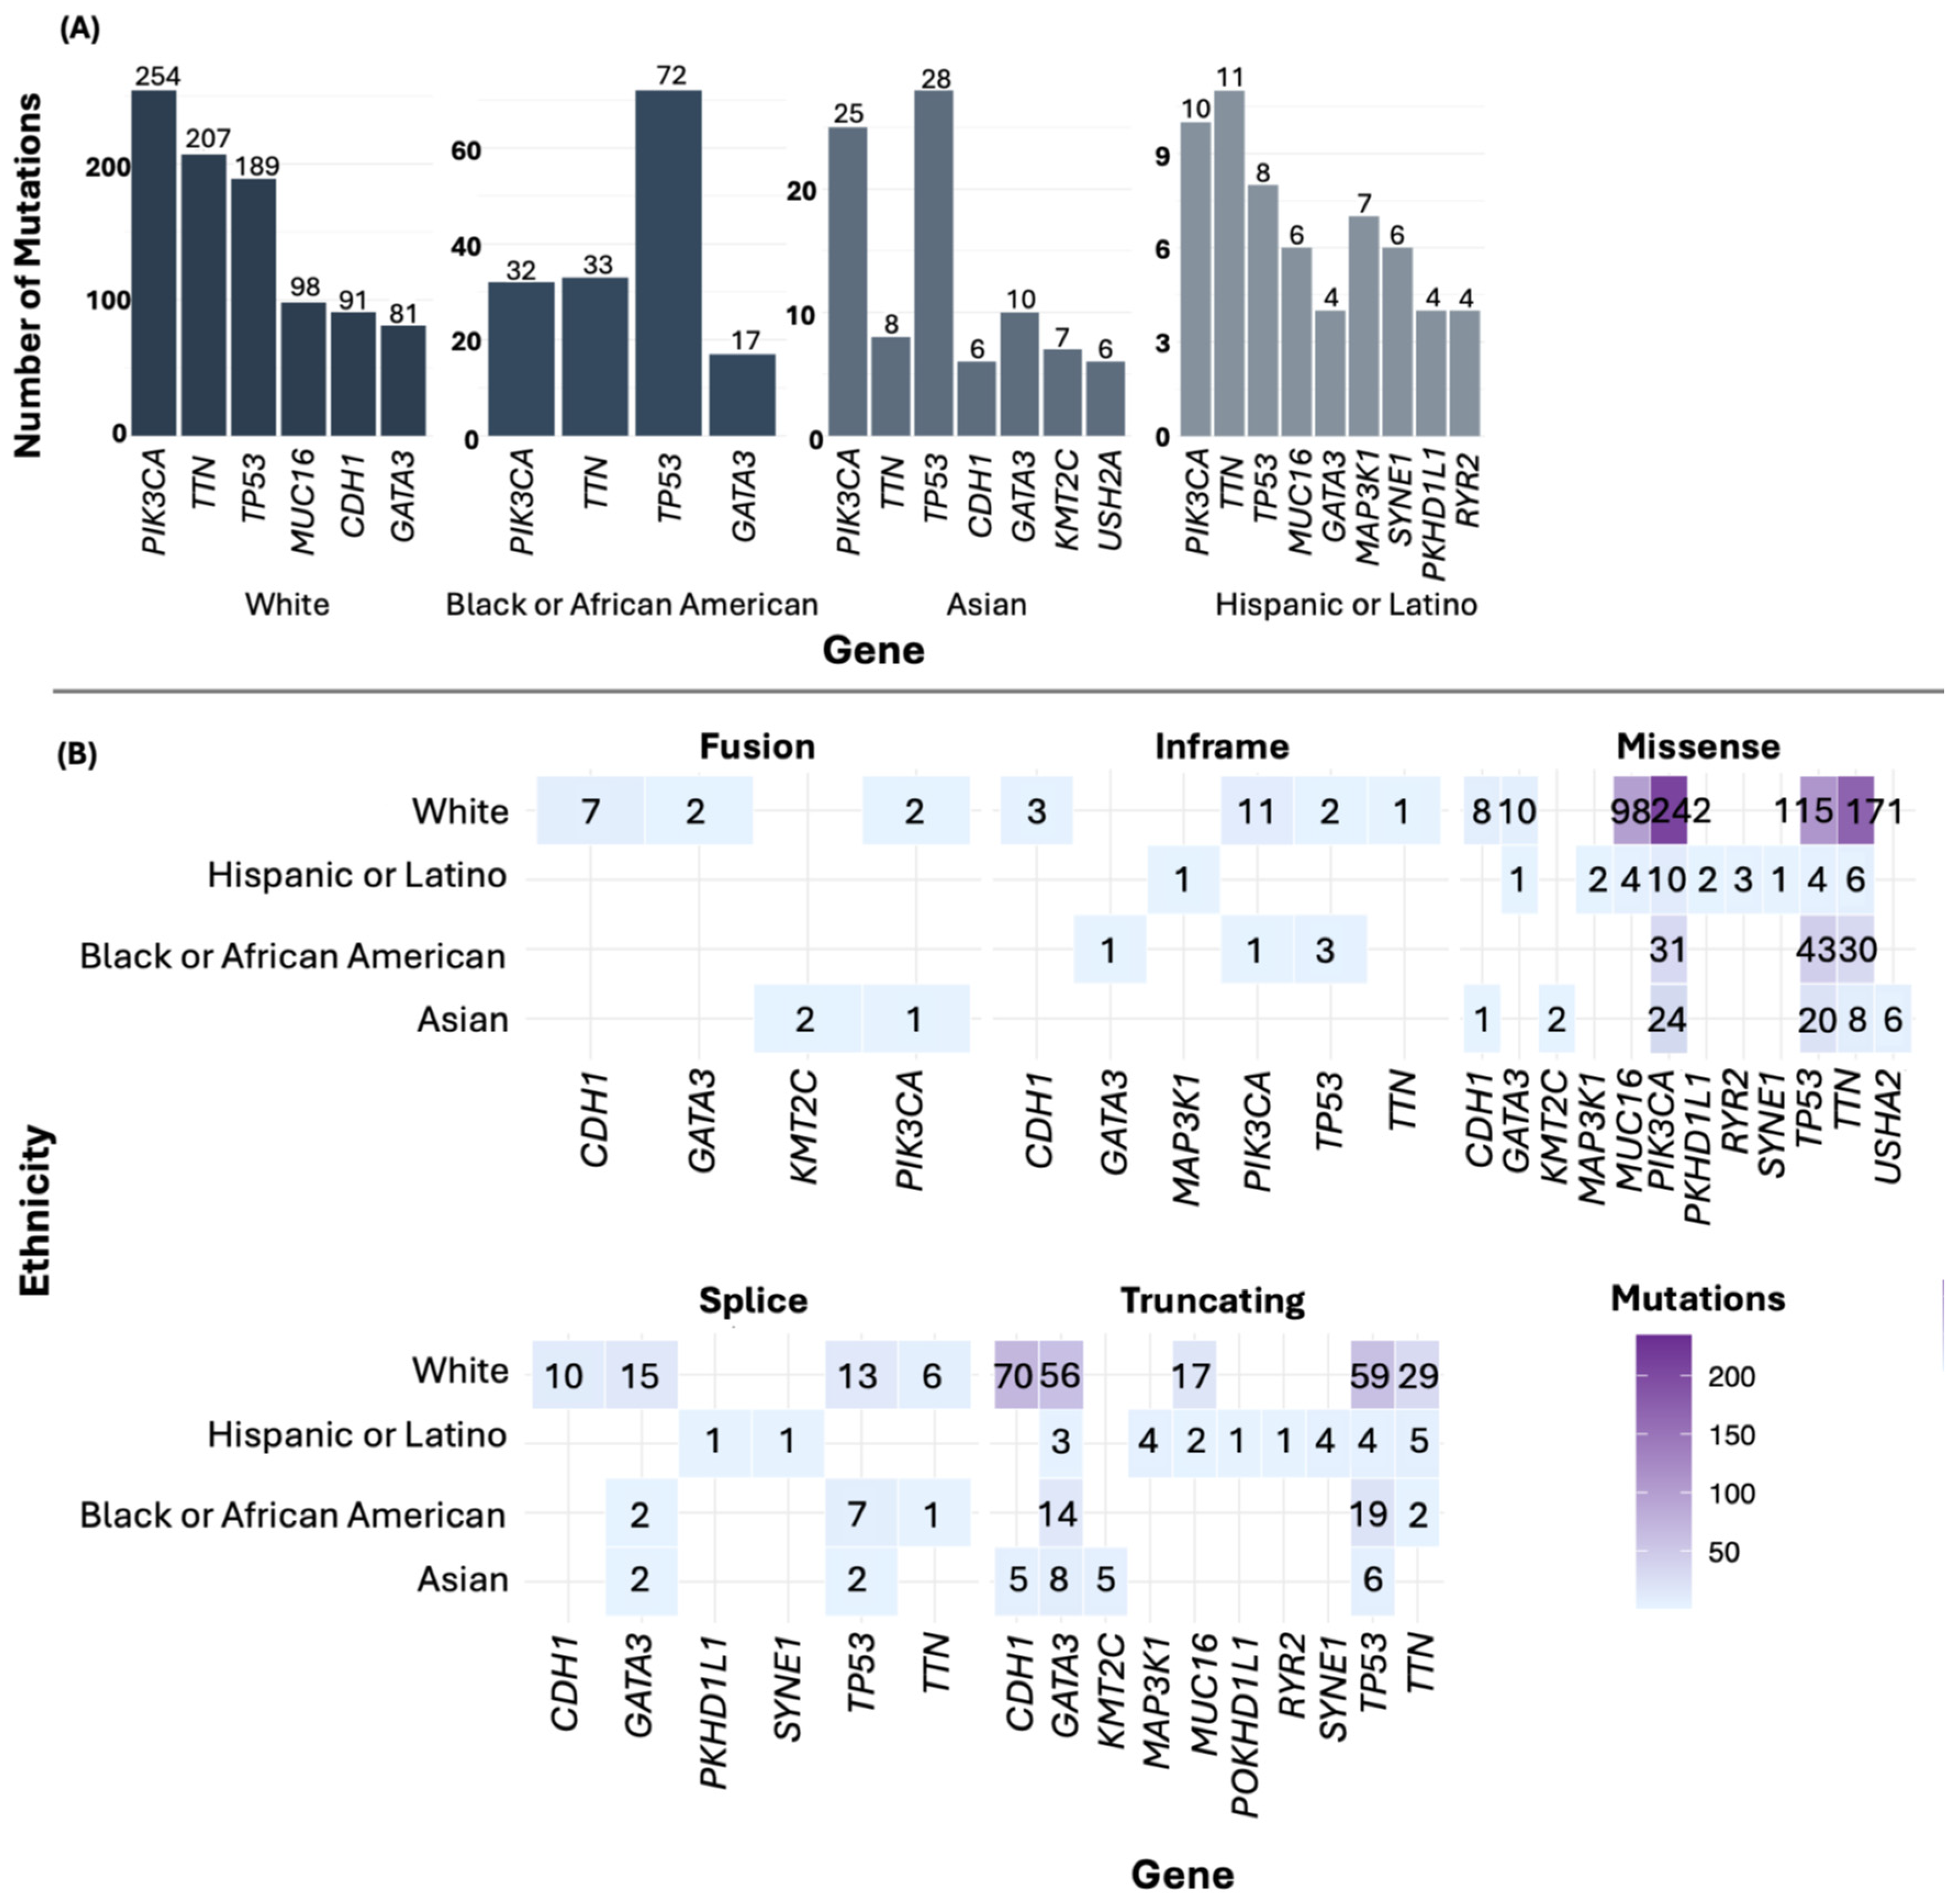
3.5. Most Frequently Mutated Genes in BC
3.6. Frequency of the Most Frequently Mutated Gene Across Ethnic Groups
3.7. Comparison of Altered and Non-Altered Groups
3.8. Classification of Mutated Genes in BC
3.9. Identification of Enriched Cancer Hallmarks
4. Discussion
5. Conclusions
Supplementary Materials
Author Contributions
Funding
Institutional Review Board Statement
Informed Consent Statement
Data Availability Statement
Acknowledgments
Conflicts of Interest
References
- Hoxha, I.; Sadiku, F.; Hoxha, L.; Nasim, M.; Buteau, M.A.C.; Grezda, K.; Chamberlin, M.D. Breast Cancer and Lifestyle Factors: Umbrella Review. Hematol./Oncol. Clin. 2024, 38, 137–170. [Google Scholar] [CrossRef] [PubMed]
- Obeagu, E.I.; Obeagu, G.U. Breast Cancer: A Review of Risk Factors and Diagnosis. Medicine 2024, 103, e36905. [Google Scholar] [CrossRef]
- Xu, Y.; Gong, M.; Wang, Y.; Yang, Y.; Liu, S.; Zeng, Q. Global Trends and Forecasts of Breast Cancer Incidence and Deaths. Sci. Data 2023, 10, 334. [Google Scholar] [CrossRef]
- Nguyen Hoang, V.-A.; Nguyen, S.T.; Nguyen, T.V.; Pham, T.H.; Doan, P.L.; Nguyen Thi, N.T.; Nguyen, M.L.; Dinh, T.C.; Pham, D.H.; Nguyen, N.M.; et al. Genetic Landscape and Personalized Tracking of Tumor Mutations in Vietnamese Women with Breast Cancer. Mol. Oncol. 2023, 17, 598–610. [Google Scholar] [CrossRef] [PubMed]
- Wilcox, N.; Dumont, M.; González-Neira, A.; Carvalho, S.; Joly Beauparlant, C.; Crotti, M.; Luccarini, C.; Soucy, P.; Dubois, S.; Nuñez-Torres, R.; et al. Exome Sequencing Identifies Breast Cancer Susceptibility Genes and Defines the Contribution of Coding Variants to Breast Cancer Risk. Nat. Genet. 2023, 55, 1435–1439. [Google Scholar] [CrossRef] [PubMed]
- Rooney, M.M.; Miller, K.N.; Plichta, J.K. Genetics of Breast Cancer: Risk Models, Who to Test, and Management Options. Surg. Clin. North. Am. 2023, 103, 35–47. [Google Scholar] [CrossRef]
- Ortiz, M.M.O.; Andrechek, E.R. Molecular Characterization and Landscape of Breast Cancer Models from a Multi-Omics Perspective. J. Mammary Gland. Biol. Neoplasia 2023, 28, 12. [Google Scholar] [CrossRef]
- Miyashita, M.; Bell, J.S.K.; Wenric, S.; Karaesmen, E.; Rhead, B.; Kase, M.; Kaneva, K.; De La Vega, F.M.; Zheng, Y.; Yoshimatsu, T.F.; et al. Molecular Profiling of a Real-World Breast Cancer Cohort with Genetically Inferred Ancestries Reveals Actionable Tumor Biology Differences between European Ancestry and African Ancestry Patient Populations. Breast Cancer Res. 2023, 25, 58. [Google Scholar] [CrossRef]
- Nolan, E.; Lindeman, G.J.; Visvader, J.E. Deciphering Breast Cancer: From Biology to the Clinic. Cell 2023, 186, 1708–1728. [Google Scholar] [CrossRef]
- Lakeman, I.M.M.; Rodríguez-Girondo, M.D.M.; Lee, A.; Celosse, N.; Braspenning, M.E.; van Engelen, K.; van de Beek, I.; van der Hout, A.H.; García, E.B.G.; Mensenkamp, A.R.; et al. Clinical Applicability of the Polygenic Risk Score for Breast Cancer Risk Prediction in Familial Cases. J. Med. Genet. 2023, 60, 327–336. [Google Scholar] [CrossRef]
- Makhnoon, S.; Levin, B.; Ensinger, M.; Mattie, K.; Volk, R.J.; Zhao, Z.; Mendoza, T.; Shete, S.; Samiian, L.; Grana, G.; et al. A Multicenter Study of Clinical Impact of Variant of Uncertain Significance Reclassification in Breast, Ovarian and Colorectal Cancer Susceptibility Genes. Cancer Med. 2023, 12, 2875–2884. [Google Scholar] [CrossRef] [PubMed]
- Guo, L.; Kong, D.; Liu, J.; Zhan, L.; Luo, L.; Zheng, W.; Zheng, Q.; Chen, C.; Sun, S. Breast Cancer Heterogeneity and Its Implication in Personalized Precision Therapy. Exp. Hematol. Oncol. 2023, 12, 3. [Google Scholar] [CrossRef] [PubMed]
- Johnson, J.A.; Moore, B.J.; Syrnioti, G.; Eden, C.M.; Wright, D.; Newman, L.A. Landmark Series: The Cancer Genome Atlas and the Study of Breast Cancer Disparities. Ann. Surg. Oncol. 2023, 30, 6427–6440. [Google Scholar] [CrossRef]
- Ding, Y.C.; Song, H.; Adamson, A.W.; Schmolze, D.; Hu, D.; Huntsman, S.; Steele, L.; Patrick, C.S.; Tao, S.; Hernandez, N.; et al. Profiling the Somatic Mutational Landscape of Breast Tumors from Hispanic/Latina Women Reveals Conserved and Unique Characteristics. Cancer Res. 2023, 83, 2600–2613. [Google Scholar] [CrossRef]
- Ullah, A.; Khan, J.; Yasinzai, A.Q.K.; Tracy, K.; Nguyen, T.; Tareen, B.; Garcia, A.A.; Heneidi, S.; Segura, S.E. Metaplastic Breast Carcinoma in U.S. Population: Racial Disparities, Survival Benefit of Adjuvant Chemoradiation and Future Personalized Treatment with Genomic Landscape. Cancers 2023, 15, 2954. [Google Scholar] [CrossRef]
- Gao, J.; Aksoy, B.A.; Dogrusoz, U.; Dresdner, G.; Gross, B.; Sumer, S.O.; Sun, Y.; Jacobsen, A.; Sinha, R.; Larsson, E.; et al. Integrative Analysis of Complex Cancer Genomics and Clinical Profiles Using the cBioPortal. Sci. Signal 2013, 6, pl1. [Google Scholar] [CrossRef]
- The Cancer Genome Atlas Program (TCGA)—NCI. Available online: https://www.cancer.gov/ccg/research/genome-sequencing/tcga (accessed on 5 March 2025).
- Weinstein, J.N.; Collisson, E.A.; Mills, G.B.; Shaw, K.R.M.; Ozenberger, B.A.; Ellrott, K.; Shmulevich, I.; Sander, C.; Stuart, J.M. The Cancer Genome Atlas Pan-Cancer Analysis Project. Nat. Genet. 2013, 45, 1113–1120. [Google Scholar] [CrossRef] [PubMed]
- Hoadley, K.A.; Yau, C.; Hinoue, T.; Wolf, D.M.; Lazar, A.J.; Drill, E.; Shen, R.; Taylor, A.M.; Cherniack, A.D.; Thorsson, V.; et al. Cell-of-Origin Patterns Dominate the Molecular Classification of 10,000 Tumors from 33 Types of Cancer. Cell 2018, 173, 291–304.e6. [Google Scholar] [CrossRef]
- Stelzer, G.; Rosen, N.; Plaschkes, I.; Zimmerman, S.; Twik, M.; Fishilevich, S.; Stein, T.I.; Nudel, R.; Lieder, I.; Mazor, Y.; et al. The GeneCards Suite: From Gene Data Mining to Disease Genome Sequence Analyses. Curr. Protoc. Bioinform. 2016, 54, 1.30.1–1.30.33. [Google Scholar] [CrossRef]
- Menyhart, O.; Kothalawala, W.J.; Győrffy, B. A Gene Set Enrichment Analysis for the Cancer Hallmarks. J. Pharm. Anal. 2024, 101065, in press. [Google Scholar] [CrossRef]
- Liberzon, A.; Birger, C.; Thorvaldsdóttir, H.; Ghandi, M.; Mesirov, J.P.; Tamayo, P. The Molecular Signatures Database (MSigDB) Hallmark Gene Set Collection. Cell Syst. 2015, 1, 417–425. [Google Scholar] [CrossRef] [PubMed]
- Pillich, R.T.; Chen, J.; Churas, C.; Liu, S.; Ono, K.; Otasek, D.; Pratt, D. NDEx: Accessing Network Models and Streamlining Network Biology Workflows. Curr. Protoc. 2021, 1, e258. [Google Scholar] [CrossRef]
- Shannon, P.; Markiel, A.; Ozier, O.; Baliga, N.S.; Wang, J.T.; Ramage, D.; Amin, N.; Schwikowski, B.; Ideker, T. Cytoscape: A Software Environment for Integrated Models of Biomolecular Interaction Networks. Genome Res. 2003, 13, 2498–2504. [Google Scholar] [CrossRef] [PubMed]
- Xu, H.; Xu, B. Breast Cancer: Epidemiology, Risk Factors and Screening. Chin. J. Cancer Res. 2023, 35, 565. [Google Scholar] [CrossRef] [PubMed]
- Hendrick, R.E.; Monticciolo, D.L.; Biggs, K.W.; Malak, S.F. Age Distributions of Breast Cancer Diagnosis and Mortality by Race and Ethnicity in US Women. Cancer 2021, 127, 4384–4392. [Google Scholar] [CrossRef]
- Ellington, T.D.; Henley, S.J.; Wilson, R.J.; Miller, J.W.; Wu, M.; Richardson, L.C. Trends in Breast Cancer Mortality by Race/Ethnicity, Age, and US Census Region, United States─1999-2020. Cancer 2023, 129, 32–38. [Google Scholar] [CrossRef]
- Hurson, A.N.; Ahearn, T.U.; Koka, H.; Jenkins, B.D.; Harris, A.R.; Roberts, S.; Fan, S.; Franklin, J.; Butera, G.; Keeman, R.; et al. Risk Factors for Breast Cancer Subtypes by Race and Ethnicity: A Scoping Review. JNCI J. Natl. Cancer Inst. 2024, 116, 1992–2002. [Google Scholar] [CrossRef]
- Price, A.L.; Butler, J.; Patterson, N.; Capelli, C.; Pascali, V.L.; Scarnicci, F.; Ruiz-Linares, A.; Groop, L.; Saetta, A.A.; Korkolopoulou, P.; et al. Discerning the Ancestry of European Americans in Genetic Association Studies. PLOS Genet. 2008, 4, e236. [Google Scholar] [CrossRef]
- Zakharia, F.; Basu, A.; Absher, D.; Assimes, T.L.; Go, A.S.; Hlatky, M.A.; Iribarren, C.; Knowles, J.W.; Li, J.; Narasimhan, B.; et al. Characterizing the Admixed African Ancestry of African Americans. Genome Biol. 2009, 10, R141. [Google Scholar] [CrossRef]
- Banda, Y.; Kvale, M.N.; Hoffmann, T.J.; Hesselson, S.E.; Ranatunga, D.; Tang, H.; Sabatti, C.; Croen, L.A.; Dispensa, B.P.; Henderson, M.; et al. Characterizing Race/Ethnicity and Genetic Ancestry for 100,000 Subjects in the Genetic Epidemiology Research on Adult Health and Aging (GERA) Cohort. Genetics 2015, 200, 1285–1295. [Google Scholar] [CrossRef]
- Bryc, K.; Durand, E.Y.; Macpherson, J.M.; Reich, D.; Mountain, J.L. The Genetic Ancestry of African Americans, Latinos, and European Americans across the United States. Am. J. Hum. Genet. 2015, 96, 37–53. [Google Scholar] [CrossRef] [PubMed]
- Bakhireva, L.N.; Nebeker, C.; Ossorio, P.; Angal, J.; Thomason, M.E.; Croff, J.M. Inclusion of American Indians and Alaskan Natives in Large National Studies: Ethical Considerations and Implications for Biospecimen Collection in the HEALthy Brain and Child Development Study. Advers. Resil. Sci. 2020, 1, 285–294. [Google Scholar] [CrossRef]
- Chakraborty, G.; Ghosh, A.; Nandakumar, S.; Armenia, J.; Mazzu, Y.Z.; Atiq, M.O.; Lee, G.-S.M.; Mucci, L.A.; Merghoub, T.; Wolchok, J.D.; et al. Fraction Genome Altered (FGA) to Regulate Both Cell Autonomous and Non-Cell Autonomous Functions in Prostate Cancer and Its Effect on Prostate Cancer Aggressiveness. J. Clin. Oncol. 2020, 38, 347. [Google Scholar] [CrossRef]
- Jones, G.D.; Brandt, W.S.; Shen, R.; Sanchez-Vega, F.; Tan, K.S.; Martin, A.; Zhou, J.; Berger, M.; Solit, D.B.; Schultz, N.; et al. A Genomic-Pathologic Annotated Risk Model to Predict Recurrence in Early-Stage Lung Adenocarcinoma. JAMA Surg. 2021, 156, e205601. [Google Scholar] [CrossRef]
- Skakodub, A.; Walch, H.; Tringale, K.R.; Eichholz, J.; Imber, B.S.; Vasudevan, H.N.; Li, B.T.; Moss, N.S.; Hei Yu, K.K.; Mueller, B.A.; et al. Genomic Analysis and Clinical Correlations of Non-Small Cell Lung Cancer Brain Metastasis. Nat. Commun. 2023, 14, 4980. [Google Scholar] [CrossRef] [PubMed]
- Tang, W.; Zhang, F.; Byun, J.S.; Dorsey, T.H.; Yfantis, H.G.; Ajao, A.; Liu, H.; Pichardo, M.S.; Pichardo, C.M.; Harris, A.R.; et al. Population-Specific Mutation Patterns in Breast Tumors from African American, European American, and Kenyan Patients. Cancer Res. Commun. 2023, 3, 2244–2255. [Google Scholar] [CrossRef] [PubMed]
- Galappaththi, S.P.L.; Smith, K.R.; Alsatari, E.S.; Hunter, R.; Dyess, D.L.; Turbat-Herrera, E.A.; Dasgupta, S. The Genomic and Biologic Landscapes of Breast Cancer and Racial Differences. Int. J. Mol. Sci. 2024, 25, 13165. [Google Scholar] [CrossRef]
- Yu, A.Y.L.; Thomas, S.M.; DiLalla, G.D.; Greenup, R.A.; Hwang, E.S.; Hyslop, T.; Menendez, C.S.; Plichta, J.K.; Tolnitch, L.A.; Fayanju, O.M. Disease Characteristics and Mortality among Asian Women with Breast Cancer. Cancer 2022, 128, 1024–1037. [Google Scholar] [CrossRef]
- Chen, H.; Zhang, L.-F.; Zhang, L.; Miao, Y.; Xi, Y.; Liu, M.-F.; Zhang, M.; Li, B. CircANKRD17 Promotes Glycolysis by Inhibiting miR-143 in Breast Cancer Cells. J. Cell Physiol. 2023, 238, 2765–2777. [Google Scholar] [CrossRef]
- Manne, R.K.; Agrawal, Y.; Malonia, S.K.; Banday, S.; Edachery, S.; Patel, A.; Kumar, A.; Shetty, P.; Santra, M.K. FBXL20 Promotes Breast Cancer Malignancy by Inhibiting Apoptosis through Degradation of PUMA and BAX. J. Biol. Chem. 2021, 297, 101253. [Google Scholar] [CrossRef]
- Li, P.; Zhang, Z.; Lv, H.; Sun, P. Inhibiting the Expression of STARD3 Induced Apoptosis via the Inactivation of PI3K/AKT/mTOR Pathway on ER+ Breast Cancer. Tissue Cell 2022, 79, 101971. [Google Scholar] [CrossRef] [PubMed]
- Lin, C.-Y.; Yu, C.-J.; Shen, C.-I.; Liu, C.-Y.; Chao, T.-C.; Huang, C.-C.; Tseng, L.-M.; Lai, J.-I. IKZF3 Amplification Frequently Occurs in HER2-Positive Breast Cancer and Is a Potential Therapeutic Target. Med. Oncol. 2022, 39, 242. [Google Scholar] [CrossRef] [PubMed]
- Ma, A.; Yang, Y.; Cao, L.; Chen, L.; Zhang, J.V. FBXO47 Regulates Centromere Pairing as Key Component of Centromeric SCF E3 Ligase in Mouse Spermatocytes. Commun. Biol. 2024, 7, 1099. [Google Scholar] [CrossRef] [PubMed]
- Uribe, M.L.; Dahlhoff, M.; Batra, R.N.; Nataraj, N.B.; Haga, Y.; Drago-Garcia, D.; Marrocco, I.; Sekar, A.; Ghosh, S.; Vaknin, I.; et al. TSHZ2 Is an EGF-Regulated Tumor Suppressor That Binds to the Cytokinesis Regulator PRC1 and Inhibits Metastasis. Sci. Signal 2021, 14, eabe6156. [Google Scholar] [CrossRef]
- Chen, Y.; Tsai, Y.-H.; Tseng, S.-H. Regulation of ZMYND8 to Treat Cancer. Molecules 2021, 26, 1083. [Google Scholar] [CrossRef]
- Wang, J.; Chen, H.; Deng, Q.; Chen, Y.; Wang, Z.; Yan, Z.; Wang, Y.; Tang, H.; Liang, H.; Jiang, Y. High Expression of RNF169 Is Associated with Poor Prognosis in Pancreatic Adenocarcinoma by Regulating Tumour Immune Infiltration. Front. Genet. 2023, 13, 1022626. [Google Scholar] [CrossRef]
- Hao, N.; Li, M.; Wang, J.; Song, Y.; Zhao, Y.; Zhang, L.; Yang, X.; Chen, L.; Ma, J.; Jia, Q.; et al. High PGAP3 Expression Is Associated with Lymph Node Metastasis and Low CD8+T Cell in Patients with HER2+ Breast Cancer. Pathol. Res. Pract. 2023, 251, 154890. [Google Scholar] [CrossRef] [PubMed]
- Zhao, H.-B.; Zhang, X.-F.; Wang, H.-B.; Zhang, M.-Z. Migration and Invasion Enhancer 1 (MIEN1) Is Overexpressed in Breast Cancer and Is a Potential New Therapeutic Molecular Target. Genet. Mol. Res. 2017, 16, gmr16019380. [Google Scholar] [CrossRef]
- Bivin, W.W.; Yergiyev, O.; Bunker, M.L.; Silverman, J.F.; Krishnamurti, U. GRB7 Expression and Correlation With HER2 Amplification in Invasive Breast Carcinoma. Appl. Immunohistochem. Mol. Morphol. 2017, 25, 553–558. [Google Scholar] [CrossRef]
- van den Ende, N.S.; Smid, M.; Timmermans, A.; van Brakel, J.B.; Hansum, T.; Foekens, R.; Trapman, A.M.A.C.; Heemskerk-Gerritsen, B.A.M.; Jager, A.; Martens, J.W.M.; et al. HER2-Low Breast Cancer Shows a Lower Immune Response Compared to HER2-Negative Cases. Sci. Rep. 2022, 12, 12974. [Google Scholar] [CrossRef]
- Lacle, M.M.; Moelans, C.B.; Kornegoor, R.; van der Pol, C.; Witkamp, A.J.; van der Wall, E.; Rueschoff, J.; Buerger, H.; van Diest, P.J. Chromosome 17 Copy Number Changes in Male Breast Cancer. Cell Oncol. 2015, 38, 237–245. [Google Scholar] [CrossRef] [PubMed]
- Peng, F.; Yang, C.; Kong, Y.; Huang, X.; Chen, Y.; Zhou, Y.; Xie, X.; Liu, P. CDK12 Promotes Breast Cancer Progression and Maintains Stemness by Activating C-Myc/β-Catenin Signaling. Curr. Cancer Drug Targets 2020, 20, 156–165. [Google Scholar] [CrossRef]
- André, F.; Ciruelos, E.; Rubovszky, G.; Campone, M.; Loibl, S.; Rugo, H.S.; Iwata, H.; Conte, P.; Mayer, I.A.; Kaufman, B.; et al. Alpelisib for PIK3CA-Mutated, Hormone Receptor-Positive Advanced Breast Cancer. N. Engl. J. Med. 2019, 380, 1929–1940. [Google Scholar] [CrossRef] [PubMed]
- Cicenas, J.; Zalyte, E.; Bairoch, A.; Gaudet, P. Kinases and Cancer. Cancers 2018, 10, 63. [Google Scholar] [CrossRef]
- Singha, M.; Pu, L.; Srivastava, G.; Ni, X.; Stanfield, B.A.; Uche, I.K.; Rider, P.J.F.; Kousoulas, K.G.; Ramanujam, J.; Brylinski, M. Unlocking the Potential of Kinase Targets in Cancer: Insights from CancerOmicsNet, an AI-Driven Approach to Drug Response Prediction in Cancer. Cancers 2023, 15, 4050. [Google Scholar] [CrossRef]
- Kontomanolis, E.N.; Koutras, A.; Syllaios, A.; Schizas, D.; Mastoraki, A.; Garmpis, N.; Diakosavvas, M.; Angelou, K.; Tsatsaris, G.; Pagkalos, A.; et al. Role of Oncogenes and Tumor-Suppressor Genes in Carcinogenesis: A Review. Anticancer Res. 2020, 40, 6009–6015. [Google Scholar] [CrossRef] [PubMed]
- Tan, Y.-T.; Lin, J.-F.; Li, T.; Li, J.-J.; Xu, R.-H.; Ju, H.-Q. LncRNA-Mediated Posttranslational Modifications and Reprogramming of Energy Metabolism in Cancer. Cancer Commun. 2021, 41, 109–120. [Google Scholar] [CrossRef]
- Jin, H.; Du, W.; Huang, W.; Yan, J.; Tang, Q.; Chen, Y.; Zou, Z. lncRNA and Breast Cancer: Progress from Identifying Mechanisms to Challenges and Opportunities of Clinical Treatment. Mol. Ther. Nucleic Acids 2021, 25, 613–637. [Google Scholar] [CrossRef]
- Dvorská, D.; Braný, D.; Ňachajová, M.; Halašová, E.; Danková, Z. Breast Cancer and the Other Non-Coding RNAs. Int. J. Mol. Sci. 2021, 22, 3280. [Google Scholar] [CrossRef]
- Hanahan, D. Hallmarks of Cancer: New Dimensions. Cancer Discov. 2022, 12, 31–46. [Google Scholar] [CrossRef]
- Feitelson, M.A.; Arzumanyan, A.; Kulathinal, R.J.; Blain, S.W.; Holcombe, R.F.; Mahajna, J.; Marino, M.; Martinez-Chantar, M.L.; Nawroth, R.; Sanchez-Garcia, I.; et al. Sustained Proliferation in Cancer: Mechanisms and Novel Therapeutic Targets. Semin. Cancer Biol. 2015, 35, S25–S54. [Google Scholar] [CrossRef] [PubMed]
- Blondeaux, E.; Arecco, L.; Punie, K.; Graffeo, R.; Toss, A.; De Angelis, C.; Trevisan, L.; Buzzatti, G.; Linn, S.C.; Dubsky, P.; et al. Germline TP53 Pathogenic Variants and Breast Cancer: A Narrative Review. Cancer Treat. Rev. 2023, 114, 102522. [Google Scholar] [CrossRef] [PubMed]
- Papadimitropoulou, A.; Makri, M.; Zoidis, G. MYC the Oncogene from Hell: Novel Opportunities for Cancer Therapy. Eur. J. Med. Chem. 2024, 267, 116194. [Google Scholar] [CrossRef]
- Lui, G.Y.L.; Grandori, C.; Kemp, C.J. CDK12: An Emerging Therapeutic Target for Cancer. J. Clin. Pathol. 2018, 71, 957–962. [Google Scholar] [CrossRef] [PubMed]
- Li, F.; Meng, G.; Tan, B.; Chen, Z.; Ji, Q.; Wang, X.; Liu, C.; Niu, S.; Li, Y.; Liu, Y. Relationship between HER2 Expression and Tumor Interstitial Angiogenesis in Primary Gastric Cancer and Its Effect on Prognosis. Pathol. Res. Pract. 2021, 217, 153280. [Google Scholar] [CrossRef]
- Ciesielski, M.; Szajewski, M.; Pęksa, R.; Lewandowska, M.A.; Zieliński, J.; Walczak, J.; Szefel, J.; Kruszewski, W.J. The Relationship between HER2 Overexpression and Angiogenesis in Gastric Cancer. Medicine 2018, 97, e12854. [Google Scholar] [CrossRef]
- Hussen, B.M.; Hidayat, H.J.; Ghafouri-Fard, S. Identification of Expression of CCND1-Related lncRNAs in Breast Cancer. Pathol. Res. Pract. 2022, 236, 154009. [Google Scholar] [CrossRef]
- Pi, J.; Liu, J.; Zhuang, T.; Zhang, L.; Sun, H.; Chen, X.; Zhao, Q.; Kuang, Y.; Peng, S.; Zhou, X.; et al. Elevated Expression of miR302-367 in Endothelial Cells Inhibits Developmental Angiogenesis via CDC42/CCND1 Mediated Signaling Pathways. Theranostics 2018, 8, 1511–1526. [Google Scholar] [CrossRef]
- Liu, Z.-L.; Chen, H.-H.; Zheng, L.-L.; Sun, L.-P.; Shi, L. Angiogenic Signaling Pathways and Anti-Angiogenic Therapy for Cancer. Signal Transduct. Target. Ther. 2023, 8, 198. [Google Scholar] [CrossRef]
- Mou, J.; Li, C.; Zheng, Q.; Meng, X.; Tang, H. Research Progress in Tumor Angiogenesis and Drug Resistance in Breast Cancer. Cancer Biol. Med. 2024, 21, 571–585. [Google Scholar] [CrossRef]
- D’Amico, M.; De Amicis, F. Challenges of Regulated Cell Death: Implications for Therapy Resistance in Cancer. Cells 2024, 13, 1083. [Google Scholar] [CrossRef]
- Luque-Bolivar, A.; Pérez-Mora, E.; Villegas, V.E.; Rondón-Lagos, M. Resistance and Overcoming Resistance in Breast Cancer. Breast Cancer Targets Ther. 2020, 12, 211–229. [Google Scholar] [CrossRef] [PubMed]
- Jiang, W.G.; Sanders, A.J.; Katoh, M.; Ungefroren, H.; Gieseler, F.; Prince, M.; Thompson, S.K.; Zollo, M.; Spano, D.; Dhawan, P.; et al. Tissue Invasion and Metastasis: Molecular, Biological and Clinical Perspectives. Semin. Cancer Biol. 2015, 35, S244–S275. [Google Scholar] [CrossRef]
- Fares, J.; Fares, M.Y.; Khachfe, H.H.; Salhab, H.A.; Fares, Y. Molecular Principles of Metastasis: A Hallmark of Cancer Revisited. Signal Transduct. Target. Ther. 2020, 5, 28. [Google Scholar] [CrossRef] [PubMed]
- Liu, M.; Yang, J.; Xu, B.; Zhang, X. Tumor Metastasis: Mechanistic Insights and Therapeutic Interventions. MedComm 2021, 2, 587–617. [Google Scholar] [CrossRef]
- Nong, S.; Han, X.; Xiang, Y.; Qian, Y.; Wei, Y.; Zhang, T.; Tian, K.; Shen, K.; Yang, J.; Ma, X. Metabolic Reprogramming in Cancer: Mechanisms and Therapeutics. MedComm 2023, 4, e218. [Google Scholar] [CrossRef] [PubMed]
- Sonugür, F.G.; Akbulut, H. The Role of Tumor Microenvironment in Genomic Instability of Malignant Tumors. Front. Genet. 2019, 10, 1063. [Google Scholar] [CrossRef]
- Andor, N.; Maley, C.C.; Ji, H.P. Genomic Instability in Cancer: Teetering on the Limit of Tolerance. Cancer Res. 2017, 77, 2179–2185. [Google Scholar] [CrossRef]
- Han, X.; Chen, J.; Wang, J.; Xu, J.; Liu, Y. TTN Mutations Predict a Poor Prognosis in Patients with Thyroid Cancer. Biosci. Rep. 2022, 42, BSR20221168. [Google Scholar] [CrossRef]
- Pease, J.C.; Tirnauer, J.S. Mitotic Spindle Misorientation in Cancer—Out of Alignment and into the Fire. J. Cell Sci. 2011, 124, 1007–1016. [Google Scholar] [CrossRef]


| Ethnicity | Tumor Type | n | % | Tumor Subtype | n | % |
|---|---|---|---|---|---|---|
| White | Infiltrating Ductal Carcinoma | 425 | 65.3 | Luminal A | 333 | 51.2 |
| Infiltrating Lobular Carcinoma | 150 | 23.0 | Luminal B | 114 | 17.5 | |
| Others | 34 | 5.2 | Basal | 93 | 14.3 | |
| Mixed Histology | 21 | 3.2 | N/A * | 58 | 8.9 | |
| Mucinous Carcinoma | 13 | 2.0 | Her2 | 32 | 4.9 | |
| Metaplastic Carcinoma | 5 | 0.8 | Normal like | 21 | 3.2 | |
| Medullary Carcinoma | 2 | 0.3 | ||||
| Breast Invasive Carcinoma | 1 | 0.2 | ||||
| Black or African American | Infiltrating Ductal Carcinoma | 136 | 81.9 | Luminal A | 51 | 30.7 |
| Infiltrating Lobular Carcinoma | 13 | 7.8 | Basal | 48 | 28.9 | |
| Other | 7 | 4.2 | Luminal B | 24 | 14.5 | |
| Mixed Histology | 4 | 2.4 | N/A * | 22 | 13.3 | |
| Medullary Carcinoma | 3 | 1.8 | Her2 | 13 | 7.8 | |
| Metaplastic Carcinoma | 1 | 0.6 | Normal like | 8 | 4.8 | |
| Infiltrating Carcinoma | 1 | 0.6 | ||||
| Mucinous Carcinoma | 1 | 0.6 | ||||
| Asian | Infiltrating Ductal Carcinoma | 44 | 77.2 | Luminal A | 18 | 31.6 |
| Infiltrating Lobular Carcinoma | 8 | 14.0 | Luminal B | 15 | 26.3 | |
| Other | 2 | 3.5 | Her2 | 15 | 26.3 | |
| Mucinous Carcinoma | 2 | 3.5 | Basal | 7 | 12.3 | |
| Metaplastic Carcinoma | 1 | 1.8 | Normal | 1 | 1.8 | |
| N/A * | 1 | 1.8 | ||||
| Hispanic or Latino | Infiltrating Ductal Carcinoma | 19 | 57.6 | Luminal A | 15 | 45.5 |
| Infiltrating Lobular Carcinoma | 9 | 27.3 | N/A * | 6 | 18.2 | |
| Other | 2 | 6.1 | Normal | 4 | 12.1 | |
| Metaplastic Carcinoma | 1 | 3.0 | Luminal B | 4 | 12.1 | |
| Mucinous Carcinoma | 1 | 3.0 | Basal | 3 | 9.1 | |
| Medullary Carcinoma | 1 | 3.0 | Her2 | 1 | 3.0 |
| Mutation Type | Gene * | White | Black or African American | Asian | Hispanic or Latino | p |
|---|---|---|---|---|---|---|
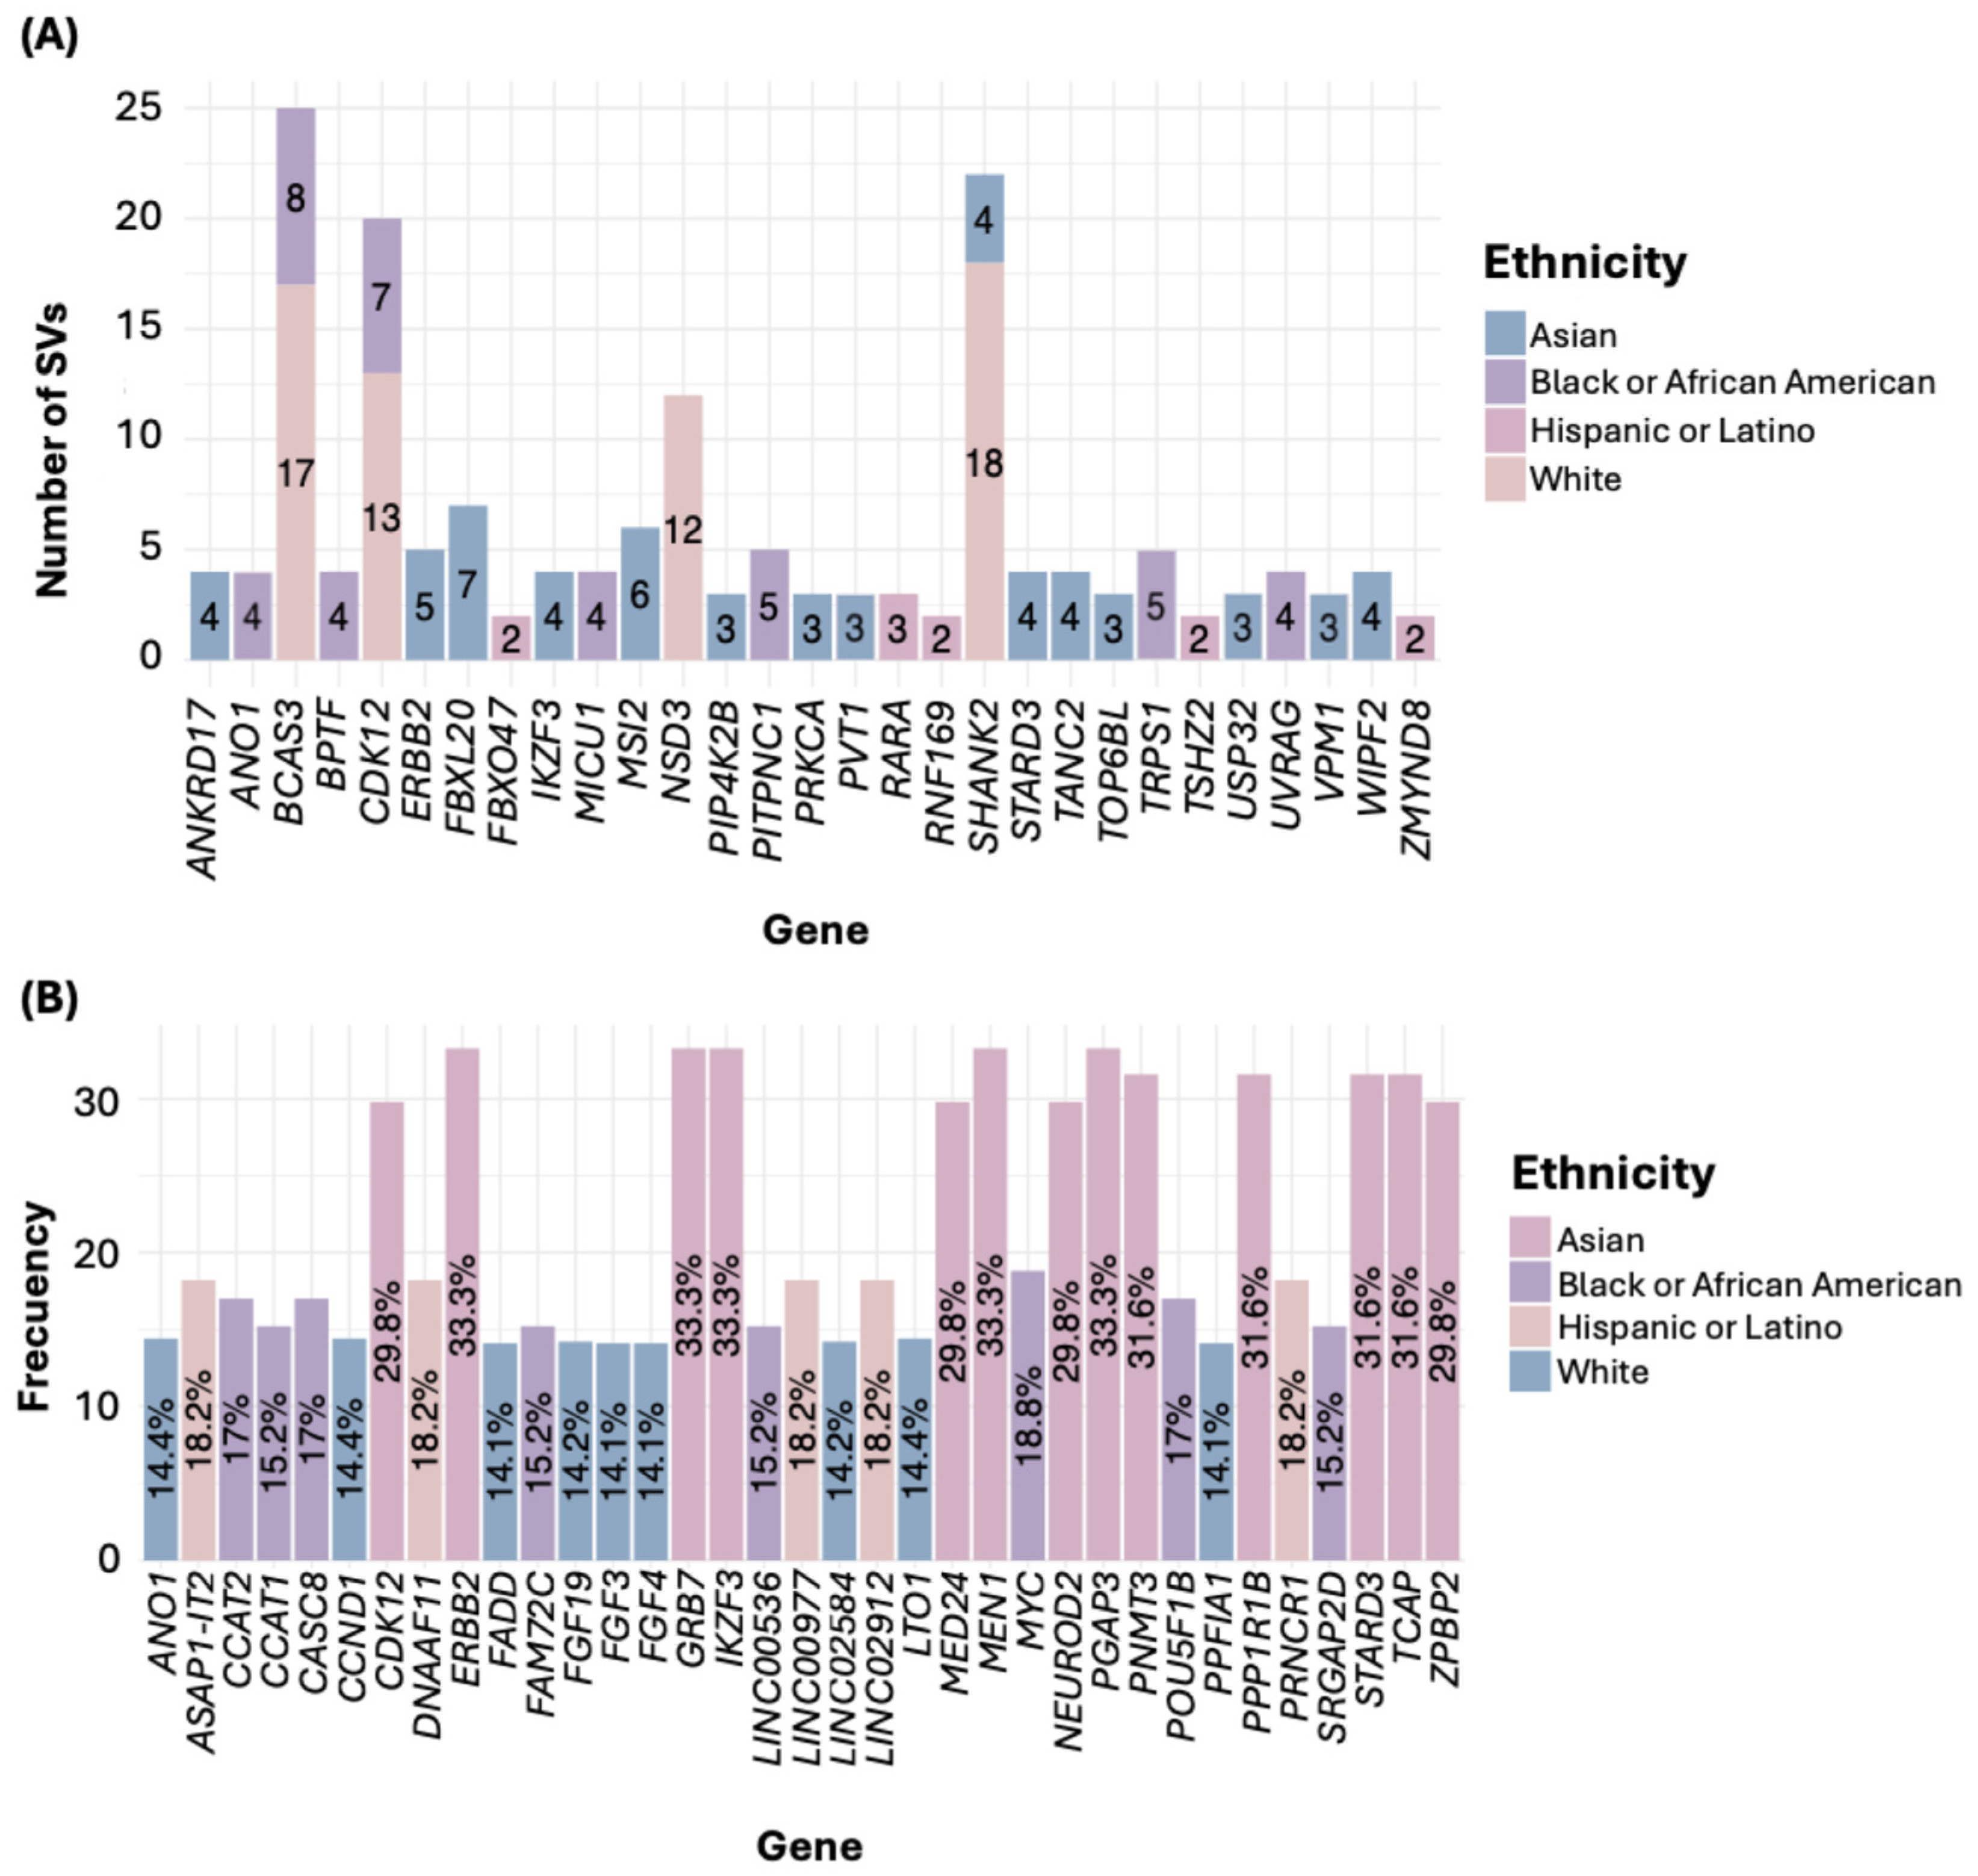
| SV | ERBB2 | 0.94 | 0.62 | 8.77 | 0 | <0.0001 |
| FBXL20 | 1.72 | 1.23 | 8.77 | 1.23 | 0.0039 | |
| STARD3 | 0.63 | 1.85 | 7.02 | 0 | 0.000343 | |
| IKZF3 | 0.94 | 1.85 | 7.02 | 0 | 0.002723 | |
| WIPF2 | 0.78 | 0 | 5.26 | 0 | 0.002789 | |
| ANKRD17 | 0 | 0 | 5.26 | 0 | <0.0001 | |
| TSHZ2 | 0.63 | 0 | 0 | 6.06 | 0.00122 | |
| FBXO47 | 0 | 0 | 1.75 | 6.06 | <0.0001 | |
| ZMYND8 | 0.16 | 0.62 | 0 | 6.06 | <0.0001 | |
| RNF169 | 0.31 | 0.62 | 1.75 | 6.06 | 0.000859 | |
| CNA | PGAP3 | 9.75 | 11.52 | 33.33 | 6.06 | <0.0001 |
| MIEN1 | 9.60 | 11.52 | 33.33 | 6.06 | <0.0001 | |
| ERBB2 | 9.75 | 11,52 | 33.33 | 6.06 | <0.0001 | |
| IKZF3 | 9.29 | 11,52 | 33.33 | 6.06 | <0.0001 | |
| GRB7 | 9.75 | 11.52 | 33.33 | 6.06 | <0.0001 | |
| TCAP | 9.60 | 11.52 | 31.58 | 6.06 | <0.0001 | |
| PNMT | 9.60 | 11.52 | 31.58 | 6.06 | <0.0001 | |
| STARD3 | 9.60 | 11.52 | 31.58 | 6.06 | <0. 0001 | |
| PPP1R1B | 9.60 | 11.52 | 31.58 | 6.06 | <0. 0001 | |
| MED24 | 7.74 | 9.70 | 29.82 | 6.06 | <0.0001 | |
| NEUROD2 | 9.29 | 11.52 | 29.82 | 6.06 | <0.0001 | |
| ZPBP2 | 8.98 | 10.30 | 29.82 | 6.06 | <0.0001 | |
| CDK12 | 8.98 | 11.52 | 29.82 | 6.06 | <0.0001 | |
| Point mutations | TP53 | 29.22 | 43.21 | 49.12 | 21.21 | 0.000127 |
| PIK3CA | 35 | 19.14 | 38.60 | 27.27 | 0.000926 |
| Category | Number of Genes | Genes |
|---|---|---|
| Oncogenes | 12 | PIK3CA, PVT1, MYC, FGF19, FGF3, FGF4, CCAT2, CASC8, CCAT1, ERBB2, FGFR3, CCND1 |
| Tumor Suppressors | 6 | TP53, CDH1, ZMYND8, FBXL20, FBXO47, PRKCA |
| Transcription Factors and Regulators | 10 | GATA3, KMT2C, BPTF, TRPS1, MSI2, IKZF3, RARA, POU5F1B, NEUROD2, MED24 |
| Structural Proteins | 11 | TTN, MUC16, USH2A, SYNE1, SHANK2, TANC2, WIPF2, ANKRD17, FAM72C, DNAAF11, ZPBP2 |
| Kinases and Enzymes | 14 | PIK3CA, MAP3K1, CDK12, PRKCA, PIP4K2B, KMT2C, MICU1, TOP6BL, UVRAG, RNF169, PGAP3, LTO1, PPP1R1B, FBXL20 |
| Receptors and Ion Channels | 5 | CDH1, MUC16, USH2A, PKHD1L1, ANO1 |
| Metabolic Regulators and Transporters | 5 | MICU1, PIP4K2B, PITPNC1, STARD3, VMP1 |
| Signaling Molecules | 3 | MAP3K1, RYR2, FADD |
| Others | 10 | Long non-coding RNAs: LINC02584, LINC00536, LINC00977, ASAP1-IT2, PRNCR1, LINC02912 |
| Pseudogenes: SRGAP2D | ||
| Ubiquitin ligase components: FBXL20, FBXO47 | ||
| Apoptosis regulator: MIEN1 |
| Hallmark | Genes |
|---|---|
| Sustained Angiogenesis | GATA3, PIK3CA, MYC, TP53, CCND1, PRKCA, ERBB2 |
| Tumor-Promoting Inflammation | GATA3, PIK3CA, TP53, FADD, PRKCA, CDH1 |
| Genome Instability | GATA3, KMT2C, UVRAG, MYC, TP53, MAP3K1, CCND1, FADD, RNF169, CDK12 |
| Sustaining Proliferative Signaling | TP53, PRKCA, PITPNC1, ERBB2, IKZF3, SHANK2, FGF3, ANKRD17, MYC, FGF4, GRB7, PPP1R1B, RARA, CCND1, GATA3, PIK3CA, CDH1, FGF19, MAP3K1, FADD, MED24, PPFIA1 |
| Evading Immune Destruction | TP53, PRKCA, MYC, GATA3, PIK3CA, IKZF3, FADD |
| Replicative Immortality | TP53, PRKCA, CDK12, ERBB2, MYC, CCND1, PIK3CA, POU5F1B, KMT2C |
| Resisting Cell Death | TP53, PRKCA, ERBB2, MYC, FGF4, CCND1, GATA3, MIEN1, PIK3CA, CDH1, FGF19, MAP3K1, IKZF3, FADD, FGF3 |
| Evading Growth Suppressors | TP53, PRKCA, PITPNC1, CDK12, ERBB2, KMT2C, FGF3, MYC, FGF4, GRB7, PPP1R1B, RARA, CCND1, GATA3, PIK3CA, CDH1, FGF19, MAP3K1, FADD, PPFIA1 |
| Reprogramming Energy Metabolism | TP53, CDK12, ERBB2, MYC, CCND1, GATA3, PIK3CA, CDH1 |
| Tissue Invasion and Metastasis | TP53, PRKCA, ERBB2, MUC16, KMT2C, FGF3, MYC, FGF4, GRB7, VMP1, USH2A, CCND1, GATA3, PIK3CA, CDH1, FGF19, MAP3K1, FADD |
| Genes Not Linked to Any Hallmark | LINC00977, LINC02912, ASAP1-IT2, PGAP3, TCAP, ZPBP2, PNMT, BCAS3, ZMYND8, CCAT1, STARD3, PIP4K2B, FAM72C, TSHZ2, SRGAP2D, LINC00536, USP32, NEUROD2, LINC02584, CASC8, TTN, ANO1, RYR2, TRPS1, PRNCR1, LTO1, MSI2, TOP6BL, CCAT2, MICU1, SYNE1, NSD3, BPTF, FBXL20, WIPF2, FBXO47, PVT1, TANC2, PKHD1L1, DNAAF11 |
| Gene | MSigDB Classification | Proposed Hallmark |
|---|---|---|
| SYNE1 | Hallmark UV Response DN | Genome Instability and Mutation |
| RYR2 | Hallmark KRAS Signaling DN | Sustaining Proliferative Signaling |
| ANO1 | Hallmark KRAS Signaling UP | Sustaining Proliferative Signaling |
| TTN | Hallmark Mitotic Spindle | Enabling Replicative Immortality |
| STARD3 | Hallmark UV Response UP | Genome Instability and Mutation |
| PVT1 | Hallmark P53 Pathway | Evading Growth Suppressors |
| Gene | Molecular Pathway | Proposed Hallmark |
|---|---|---|
| PIP4K2B | Phosphoinositides Metabolism | Metabolic Reprogramming |
| BPTF | 16p11.2 Proximal Deletion Syndrome | Altered Cellular Metabolism |
| ZMYND8 | Integrated Breast Cancer Pathway | Sustaining Proliferative Signaling |
| BCAS3 | Ectoderm Differentiation | Tumor Promoting Inflammation |
| MSI2 | Hepatitis C-Human | Metabolic Reprogramming |
| PIP4K2B | Regulation Of Actin Cytoskeleton | Metabolic Reprogramming |
Disclaimer/Publisher’s Note: The statements, opinions and data contained in all publications are solely those of the individual author(s) and contributor(s) and not of MDPI and/or the editor(s). MDPI and/or the editor(s) disclaim responsibility for any injury to people or property resulting from any ideas, methods, instructions or products referred to in the content. |
© 2025 by the authors. Licensee MDPI, Basel, Switzerland. This article is an open access article distributed under the terms and conditions of the Creative Commons Attribution (CC BY) license (https://creativecommons.org/licenses/by/4.0/).
Share and Cite
Garibaldi-Ríos, A.F.; Figuera, L.E.; Zúñiga-González, G.M.; Gómez-Meda, B.C.; Puebla-Pérez, A.M.; Rivera-Cameras, A.; Magaña-Torres, M.T.; García-Ortíz, J.E.; Dávalos-Rodríguez, I.P.; Rosales-Reynoso, M.A.; et al. Genomic Landscape of Breast Cancer: Study Across Diverse Ethnic Groups. Diseases 2025, 13, 86. https://doi.org/10.3390/diseases13030086
Garibaldi-Ríos AF, Figuera LE, Zúñiga-González GM, Gómez-Meda BC, Puebla-Pérez AM, Rivera-Cameras A, Magaña-Torres MT, García-Ortíz JE, Dávalos-Rodríguez IP, Rosales-Reynoso MA, et al. Genomic Landscape of Breast Cancer: Study Across Diverse Ethnic Groups. Diseases. 2025; 13(3):86. https://doi.org/10.3390/diseases13030086
Chicago/Turabian StyleGaribaldi-Ríos, Asbiel Felipe, Luis E. Figuera, Guillermo Moisés Zúñiga-González, Belinda Claudia Gómez-Meda, Ana María Puebla-Pérez, Alicia Rivera-Cameras, María Teresa Magaña-Torres, José Elías García-Ortíz, Ingrid Patricia Dávalos-Rodríguez, Mónica Alejandra Rosales-Reynoso, and et al. 2025. "Genomic Landscape of Breast Cancer: Study Across Diverse Ethnic Groups" Diseases 13, no. 3: 86. https://doi.org/10.3390/diseases13030086
APA StyleGaribaldi-Ríos, A. F., Figuera, L. E., Zúñiga-González, G. M., Gómez-Meda, B. C., Puebla-Pérez, A. M., Rivera-Cameras, A., Magaña-Torres, M. T., García-Ortíz, J. E., Dávalos-Rodríguez, I. P., Rosales-Reynoso, M. A., García-Verdín, P. M., Carrillo-Dávila, I. A., Torres-Mendoza, B. M., Ávalos-Navarro, G., & Gallegos-Arreola, M. P. (2025). Genomic Landscape of Breast Cancer: Study Across Diverse Ethnic Groups. Diseases, 13(3), 86. https://doi.org/10.3390/diseases13030086