Article

Optimal Design of a Hybrid PV Solar/Micro-Hydro/Diesel/Battery Energy System for a Remote Rural Village under Tropical Climate Conditions

by
Jamiu Omotayo Oladigbolu
*,
Makbul A. M. Ramli
and
Yusuf A. Al-Turki
Renewable Energy Research Group, Department of Electrical and Computer Engineering, King Abdul-Aziz University, Jeddah 21589, Saudi Arabia
*
Author to whom correspondence should be addressed.
Electronics 2020, 9(9), 1491; https://doi.org/10.3390/electronics9091491
Submission received: 21 July 2020 / Revised: 30 August 2020 / Accepted: 2 September 2020 / Published: 11 September 2020
(This article belongs to the Section Power Electronics)

Abstract

:
Recently, off-grid renewable power generation systems have become good alternatives for providing reliable electricity at a low cost in remote areas. According to the International Renewable Energy Agency, more than half the population of Nigerian rural communities are outside the electricity coverage area. This research examines the potential application of hybrid solar photovoltaic (PV)/hydro/diesel/battery systems to provide off-grid electrification to a typical Nigerian rural village. The performance of four different hybrid systems was evaluated via techno-economic and environmental analysis, and the optimized solution was selected using the HOMER analysis tool. The simulation results revealed that a hybrid PV solar/hydro/diesel with battery storage was the optimized solution and most suitable with the least net present cost (NPC) of $963,431 and a cost of energy (COE) of $0.112/kWh. The results also revealed that the optimal system prevented about 77.1% of CO2 gas emission from being released to the surrounding air as compared with the PV/diesel system (worst case). In addition, the results also showed better performance in technical aspects, making the system appropriate and ideal for rural electrification and clean energy development. Furthermore, the effects of varying some variables such as interest rate, solar radiation, water discharge, capacity shortage, and battery minimum state of charge on the system cost and operational performance were discussed via the sensitivity analysis because these parameters influence the economy and technical aspect of the power system.

1. Introduction

Various reforms have been established in the Nigerian power sector since the beginning of the democratic ruling by the Nigerian Power Supply Industry and Nigerian Electricity Regulatory Commission. These reforms led the country to privatize its electricity production and distribution companies in 2013 [1]. To some extent, these reforms have contributed to improving the existing power infrastructure to support the ever-growing electricity needs of the masses. Rural communities are generally dispersed; geographically isolated; faced with high illiteracy levels; and lack access to good health care delivery, clean water supply, and power connection. As a result, these areas have poor standards of living as compared with urban areas where the use of electricity is common [2], and many rural communities rely on diesel generator systems to supplement the unstable grid supply or on the local kerosene-powered lighting system. According to the International Renewable Energy Agency, more than half the population of Nigerian rural communities are out of the electricity coverage [3]. This situation is worsening because of limited progress recorded towards rural electrification coupled with the high cost of grid expansion. However, off-grid small-scale electricity generation represents one of the most appropriate solutions to this issue, serving also as a building block for future distributed generation development. Providing reliable electricity to rural areas is essential in the sense that it improves the standard of living of rural dwellers, in addition to its positive impact on healthcare delivery and creates an ideal environment for infrastructure development and industrialization. However, unreliability and lack of access to the national grid and the high cost of grid expansion to the villages coupled with other constraints have led to an inadequate supply of power to rural communities [4].
In addition, approximately 8500 MW of power is generated by various thermal power plants in Nigeria, representing 81% of the total installed capacity, showing an overdependence on thermal sources for electricity generation. Because of high operation and maintenance costs, coupled with the release of carbon dioxide (CO2) and other harmful gases that are responsible for global warming, this necessitates the inclusion of renewable power resources, such as hydro, wind energy, and solar, into the energy mix of Nigeria’s power sector [1]. According to [5], the value of solar energy per year is around 27 times the gross fossil energy sources of the country in units of energy and is over 115,000 times the power generated, whereas the country’s hydroelectric potential is estimated to be 14,750 MW, showing the apparent abundance of these resources in electricity production which could meet the growing and increasingly affluent Nigeria population. As stated in the UN Framework Convention on Climate Change (UNFCCC), industrialized nations have agreed to mitigate their combined greenhouse gas (GHG) and pollutant emissions by 5.2% in the first phase to achieve a minimum of 18% below the initial levels by the end of 2020 [6]. This shows that more must be done to mitigate the amount of GHGs released into the atmosphere in order to limit the global warming effect. Moreover, according to the World Bank Sustainable Energy for All (SE4ALL), the global renewable energy (RE) consumption rate stands at a low value of 18.054% of the gross final energy consumption as compared with that of fossil fuel which stands at 80.04% [7]. Hence, the global warming effect [8], the increased energy demand because of the high level of industrialization and economic activities expected in Nigeria as measured by the gross GDP [9], and the high operational cost associated with the use of systems based on fossil fuels for power generation [10] are expected to increase the use of renewable energy (RE) resources to achieve the electrification goals of the nation, while creating a safe and clean environment.
Furthermore, various RE technologies are becoming more attractive for electricity generation in rural and semi-urban areas because of their decreased damage to the environment in addition to the fact that they are an abundant and natural free energy source. Many research projects have been performed globally to estimate and determine the feasibility of applying one or more renewable resources in conjunction with a fossil fuel-based system for generating electricity to be used in different applications and in different human settlements. The results have shown their excellent contributions for reducing GHGs emissions and increasing sustainability and cost-effectiveness while in operation and serving the fast-growing energy demand, although their initial capital cost seems to be relatively high [11,12,13,14,15,16]. However, the recent reduction in the cost of renewable energy technologies (RET) has shown their cost competitiveness in meeting power demand and more than half of the RETs capacity is expected to generate cheaper energy than any of the conventional energy sources (oil, coal, etc.) [17,18]. A feasibility study, conducted on renewable energy sources (RESs) and their application in hybridized form for power supply to a typical residential load in Somaliland, showed a 30% reduction in electricity cost as compared with serving the local energy demand with diesel-only power systems at an energy cost of $0.408/kWh [19]. Similarly, [20] presented a detailed economic viability analysis in addition to developing a model to examine the costs and benefits of a decentralized photovoltaic (PV) system. Their findings indicated that the economic viability of the system was absolutely site dependent based on variations of some determinant factors. The optimized PV/battery system showed better economic prospects as the gross net present value stood at $589,852 at an energy selling price of $0.4/kWh, which was lower than the unit price of $0.62/kWh for the diesel system. In [21], an evaluation of a biogas-driven cogeneration system, which could supply power and cold storage for “yam bank” within a rural village was carried out, where they considered about 200 households in a Nigerian community. Their findings, however, revealed that the system configuration could store 3.6 tons of yam tubers each year, as well as generate sufficient power for domestic and commercial use. The application of hybrid energy systems (HESs) for power generation at an off-grid remote location was demonstrated in [22]. The authors used two different RES integration approaches, and confirmed that a HES was the best electricity supply option for the selected areas with regards to cost and environmental sustainability. The possibility of a HES for electricity production in Yanbu, Saudi Arabia, was investigated by [23]. They stated that the study location had enormous potential for RESs. Moreover, the energy contribution from a wind energy conversion system was less than that of the PV system of the same size but the energy cost of the wind, i.e., $0.149/kWh, was more expensive than that of the solar energy which stood at $0.0637/kWh. A model and assessment of a PV/wind/diesel hybrid energy system for rural electrification in Kaduna State (Nigeria) were presented in [24]. The authors found that the PV/wind/diesel/battery hybrid system was the most economically feasible and environmentally friendly because it reported a substantial savings in the cost of electricity and mitigated pollutant emissions remarkably. In another study [11], the potential implementation of a HES to meet the energy demand of Godagari of the Rajshahi division in Bangladesh was investigated. The HES was found to reduce CO2 gas emission by about 62% and a further 67% as compared with the kerosene-based and on-grid systems. In [25], the authors used an optimization tool (HOMER) and assessed the economic feasibility and environmental benefit of establishing a HES in Giri village (Nigeria). They concluded that the implementation of HESs in Giri village had great economic prospects with less environmental effect because they supplied power at a minimum net present cost (NPC) of $1.01 m and emitted a tolerable amount of GHGs, i.e., 2889.36 kg/year. The techno-economic feasibility of a HES comprised of solar PV, wind turbine, diesel generator, and a battery storage device were studied in [26] for power generation at a rural village in Sri Lanka. Their outcomes showed that the optimal system could supply electricity at a cost of $ 0.34/kWh.
In addition, in Nigeria, many research articles have examined the potential, utilization, and evaluation of technical and economic aspects of using RESs for power production in remote, rural, and semi-urban areas [27,28,29,30]. However, most of these studies have focused on solar and wind energy in combination with conventional energy sources. From previous studies, it has been established that no research has been conducted to investigate the feasibility of PV/hydro/diesel with a storage system for providing off-grid electrification in Nigeria. The hydropower system has received less application in this regard due to the lack of hydro resource data. According to [5], there are about 277 potential sites for small hydropower (SHP) applications in the country, but only five sites among these have been developed. Many viable SHP applications are run-of-river schemes that require less civil works, and existing dams can be transformed into SHP sites to make its implementation more attractive and cost-effective. In addition, with the networks of rivers where at least one river flows through most of the states in Nigeria coupled with the potential of small-scale hydropower estimated to be 734 MW [31], a small hydropower project would be a viable solution for the power crisis that occurs in most of rural Nigeria [3]. The reliability and environmental impact of a HES are related to hours of operation of diesel generators, fuel availability and costs, O&M issues, stability issues, etc. On the one hand, if a HES involves more than one RE resource, the reliability can be maximized and GHG emission can be reduced since there is compensation between resources for power production. On the other hand, a system with one RE technology, for example, PV, requires more storage capacity to guarantee the reliability, which increases investment costs. However, using multiple RE technologies can make the power generation more reliable, in addition to fuel consumption savings and CO2 reduction. This was demonstrated in [12], where the system with one RES was unable to meet an annual load of about 57 kWh as compared with that of the configuration with two RE technologies. In addition, the environmental benefit of the latter technologies showed a reduction in CO2 emission of approximately 7167 kg/year.
This research aims to support the development and implementation of the hydroelectric system by providing techno-economic feasibility and environmental analysis to develop and establish a standalone hybrid PV/hydro/diesel power system with continuous power generation for an isolated rural area with a tropical climate. The simulation is performed based on the hydro resources available with the level of global solar radiation, and the diesel plant and battery storage are included because of the intermittent nature of RESs to ensure a continuous supply of power. Different system configurations were simulated and analyzed, in addition to conducting a sensitivity evaluation to check the economic as well as the operational performance of the HES over variation in some parameters such as the real interest rate, RE component (solar irradiation and hydro stream flow rate), capacity shortage, and battery minimum state of charge (SOC). The RE potentiality, in addition to the proper way of implementation in this part of the country, is also discussed to serve as a guide for implementing the Renewable Energy Master Plan (REMP) that has set a target of meeting at least 10% of the country’s total energy consumption by RESs by the end of 2025 [32].

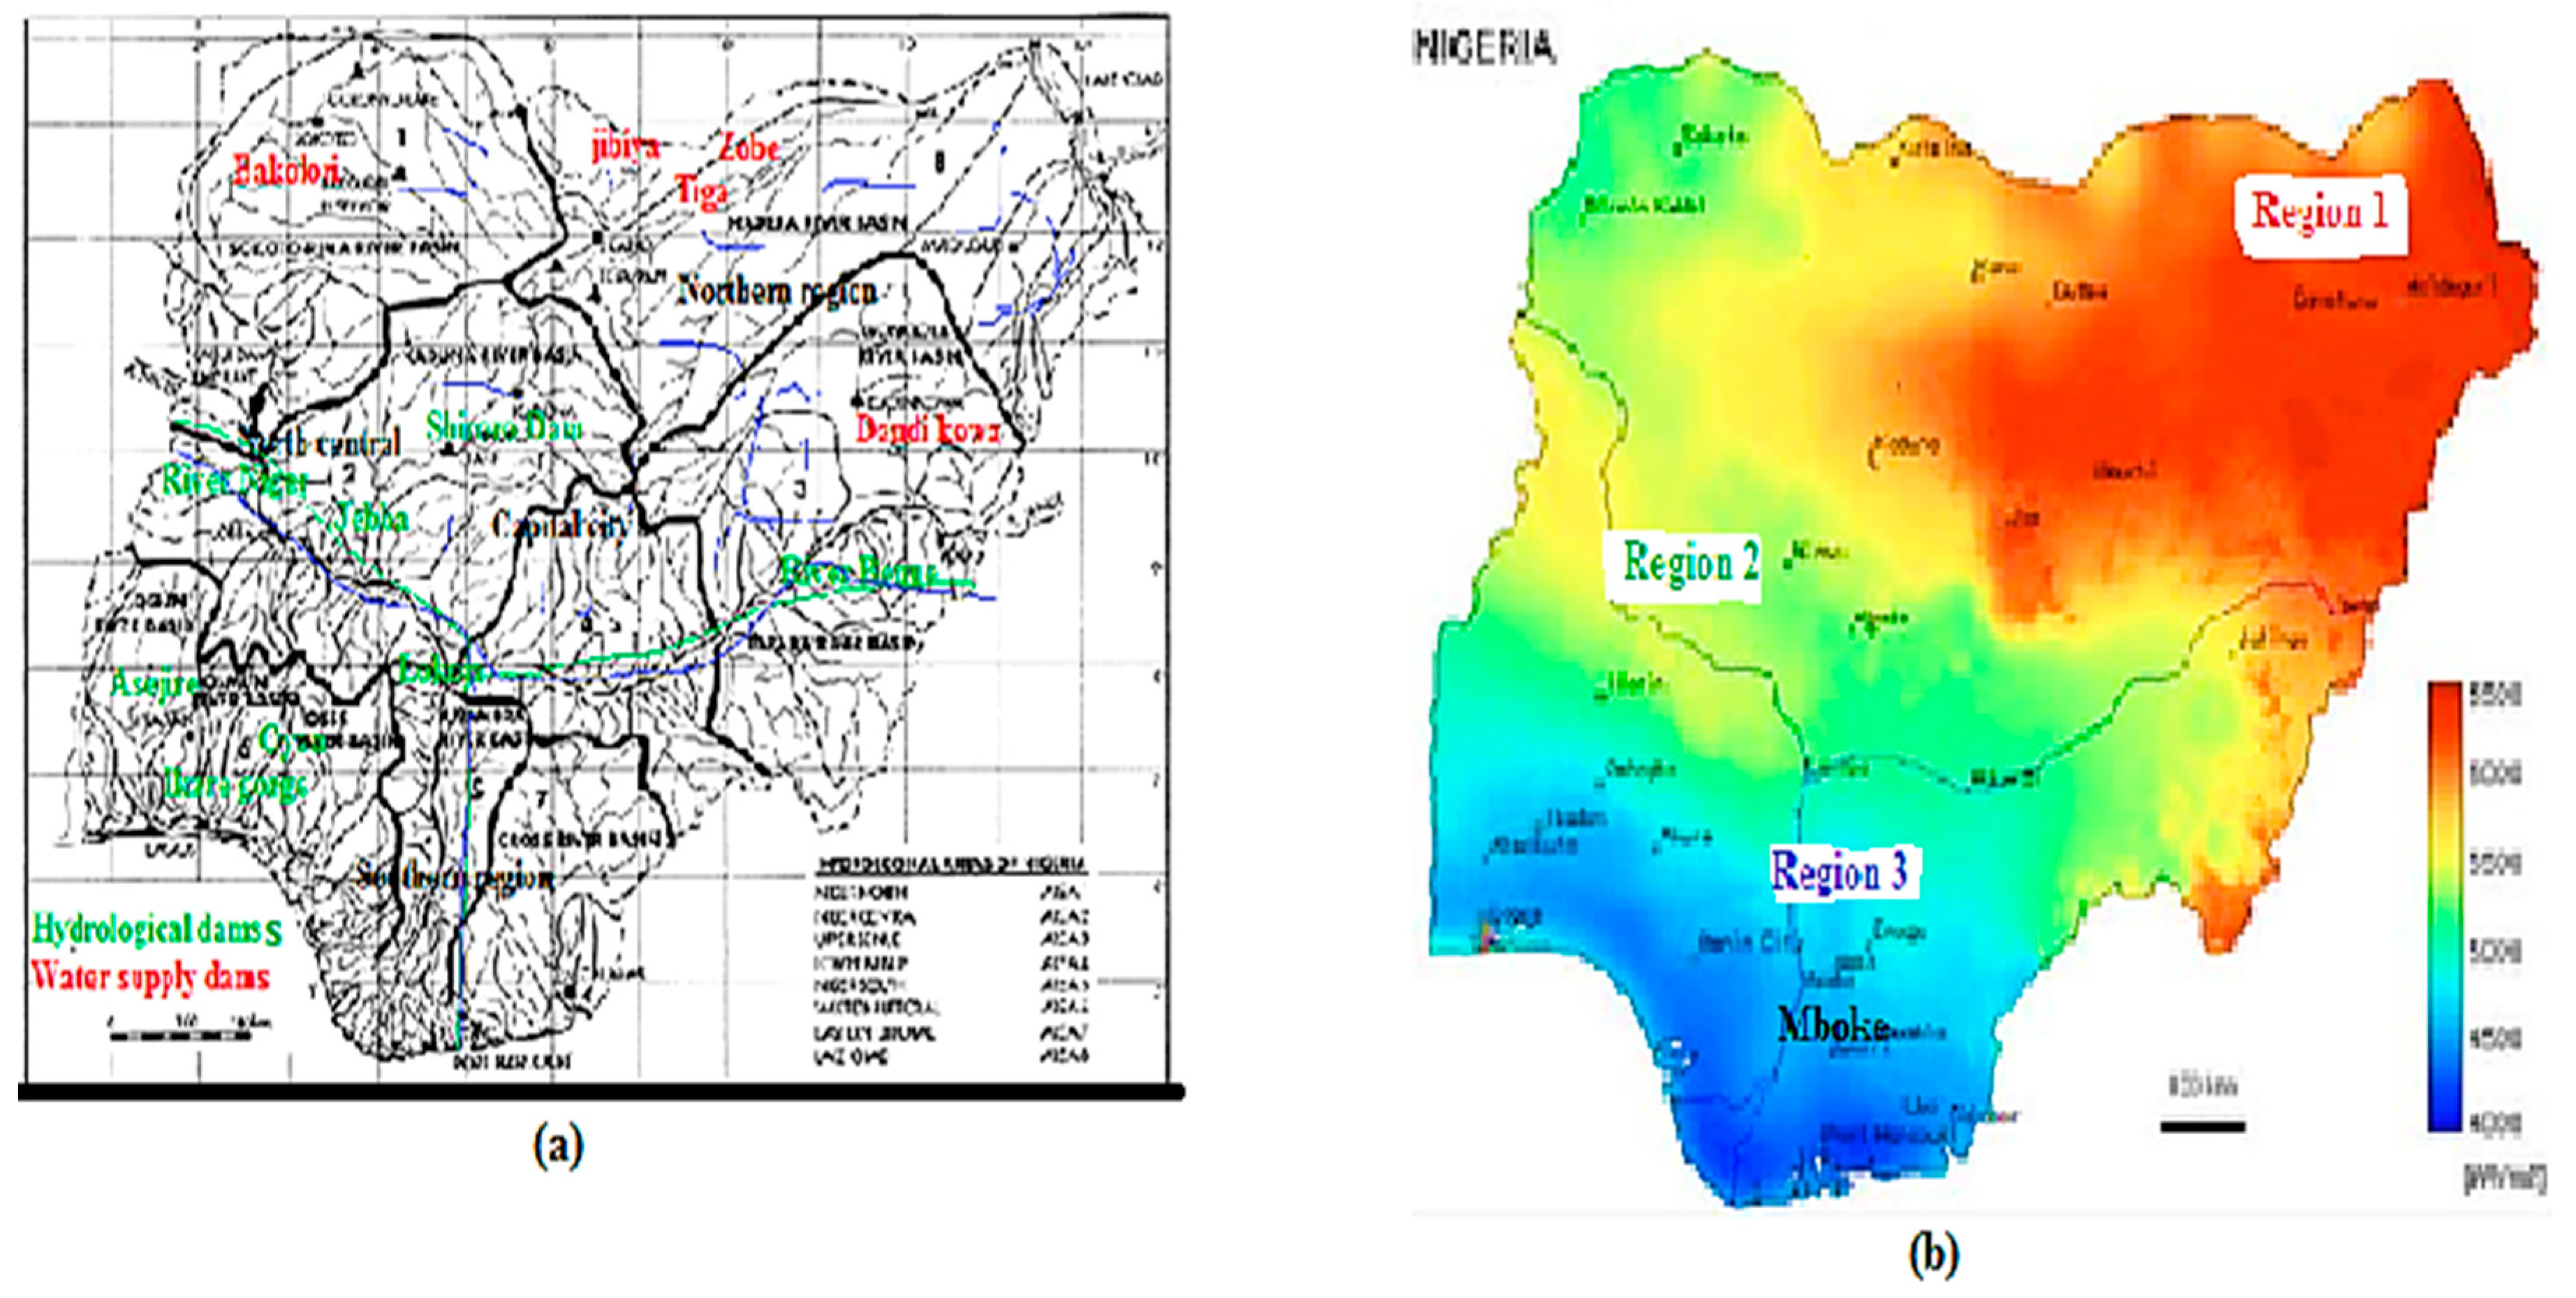
2. Potential Renewable Energy Resources in Nigeria

The endowment of waterfalls and large rivers in Nigeria can make hydropower resources the main sources of power production and continuous supply. However, out of about 277 potential locations for small hydroelectric applications with a gross output of around 734 MW, only 32 MW were exploited, representing only 4.3% of the available hydro capacity [5]. Consequently, hydro resources have not been fully utilized in Nigeria as SHP for power generation. Moreover, hydropower application is a viable option for electricity generation in the southern region because of the perennial rainfall with the required hydraulic heads that have been favored by the topology [31]. However, considering the dams that have already been built, the implementation of hydro systems should be more cost-effective with less civil work. In this area, the hydroelectric profile of the three major rivers (Otamiri, Bumaji, and Njaba rivers) as reported in [33,34] shows a peak season discharge rate and a total head in the range of 2.65 to 9.25 m3/s and 3 to 40 m, respectively. In addition, Nigeria’s global solar irradiation is well distributed with a yearly daily average ranging from around 3.5 kWh/m2 (12.6 MJ/m2/day) in the coastal area to 7.0 kWh/m2 (25.2 MJ/m2/day) in the remote part of the northern region [35]. Nigeria has a large potential for solar energy application because of its observable abundance, i.e., about 3.8 × 10²³ kW of energy is emitted from the sun, corresponding to about 1.082 million tons of oil daily at a mean solar gain of 5.535 kWh/m2/day [5]. Solar photovoltaic (PV) is becoming a suitable energy option for countries with average solar irradiation in the range of 3 to 6 kWh/m2/day [36]. The solar radiation and hydropower potential in different states of Nigeria are presented in Figure 1.
From the aforementioned data, it is evident that a considerable amount of electricity can be produced if a small hydropower/PV system can be established in this area that can adequately serve remote rural areas across the country.

3. Methods and Material

Selecting suitable analysis criteria is crucial to properly evaluate the operational performance of various schemes in renewable energy-based systems. The following evaluation outlines were used in this study: specifications of the selected site, the proposed HES and load profile, design specification of the HES, hybrid system components and costs, and the mathematical model.

3.1. Specifications of the Selected Location

Mboke is a village located in the township of Ihiagwa that is situated 12 km south of Owerri in Nigeria’s southern region, which was considered in this research. The area is about 235 miles south of the country’s capital. The village is located at 5°24.3′ N and 7°0.7′ E and is characterized by a tropical wet monsoon climate. There is a power supply from the national grid, as electricity in this region is supplied by the Affam Genco power company [39]. The electricity supply is unstable and unreliable, with many residents who have been exposed to frequent blackouts [40]. Moreover, the educational centers, as well as a marketplace such as the Nkwo Ukwu’ market, are among the minimal infrastructure and economic developments in this area, and their daily operation and services could be improved through off-grid electrification [41]. According to the Nigerian Economic Summit Group and Heinrich Böll Stiftung Nigeria, the average cost of a diesel generator is around $0.3/kWh [42], which has always been the alternative option for power supply in this area. The diesel system has high operational maintenance costs and poses a serious environmental threat through the combustion of fossil fuel [43]. This community is expected to be provided with electrification using renewable sources and a conventional energy system in an off-grid mode. The Otamiri River supports the residents with a potable water supply. According to [44], about 2.28 × 10⁸ m3 volume of water is available and around 1.89 MW of power can be produced from this river. Consequently, using a hydropower system is a feasible option for producing electricity at these locations.

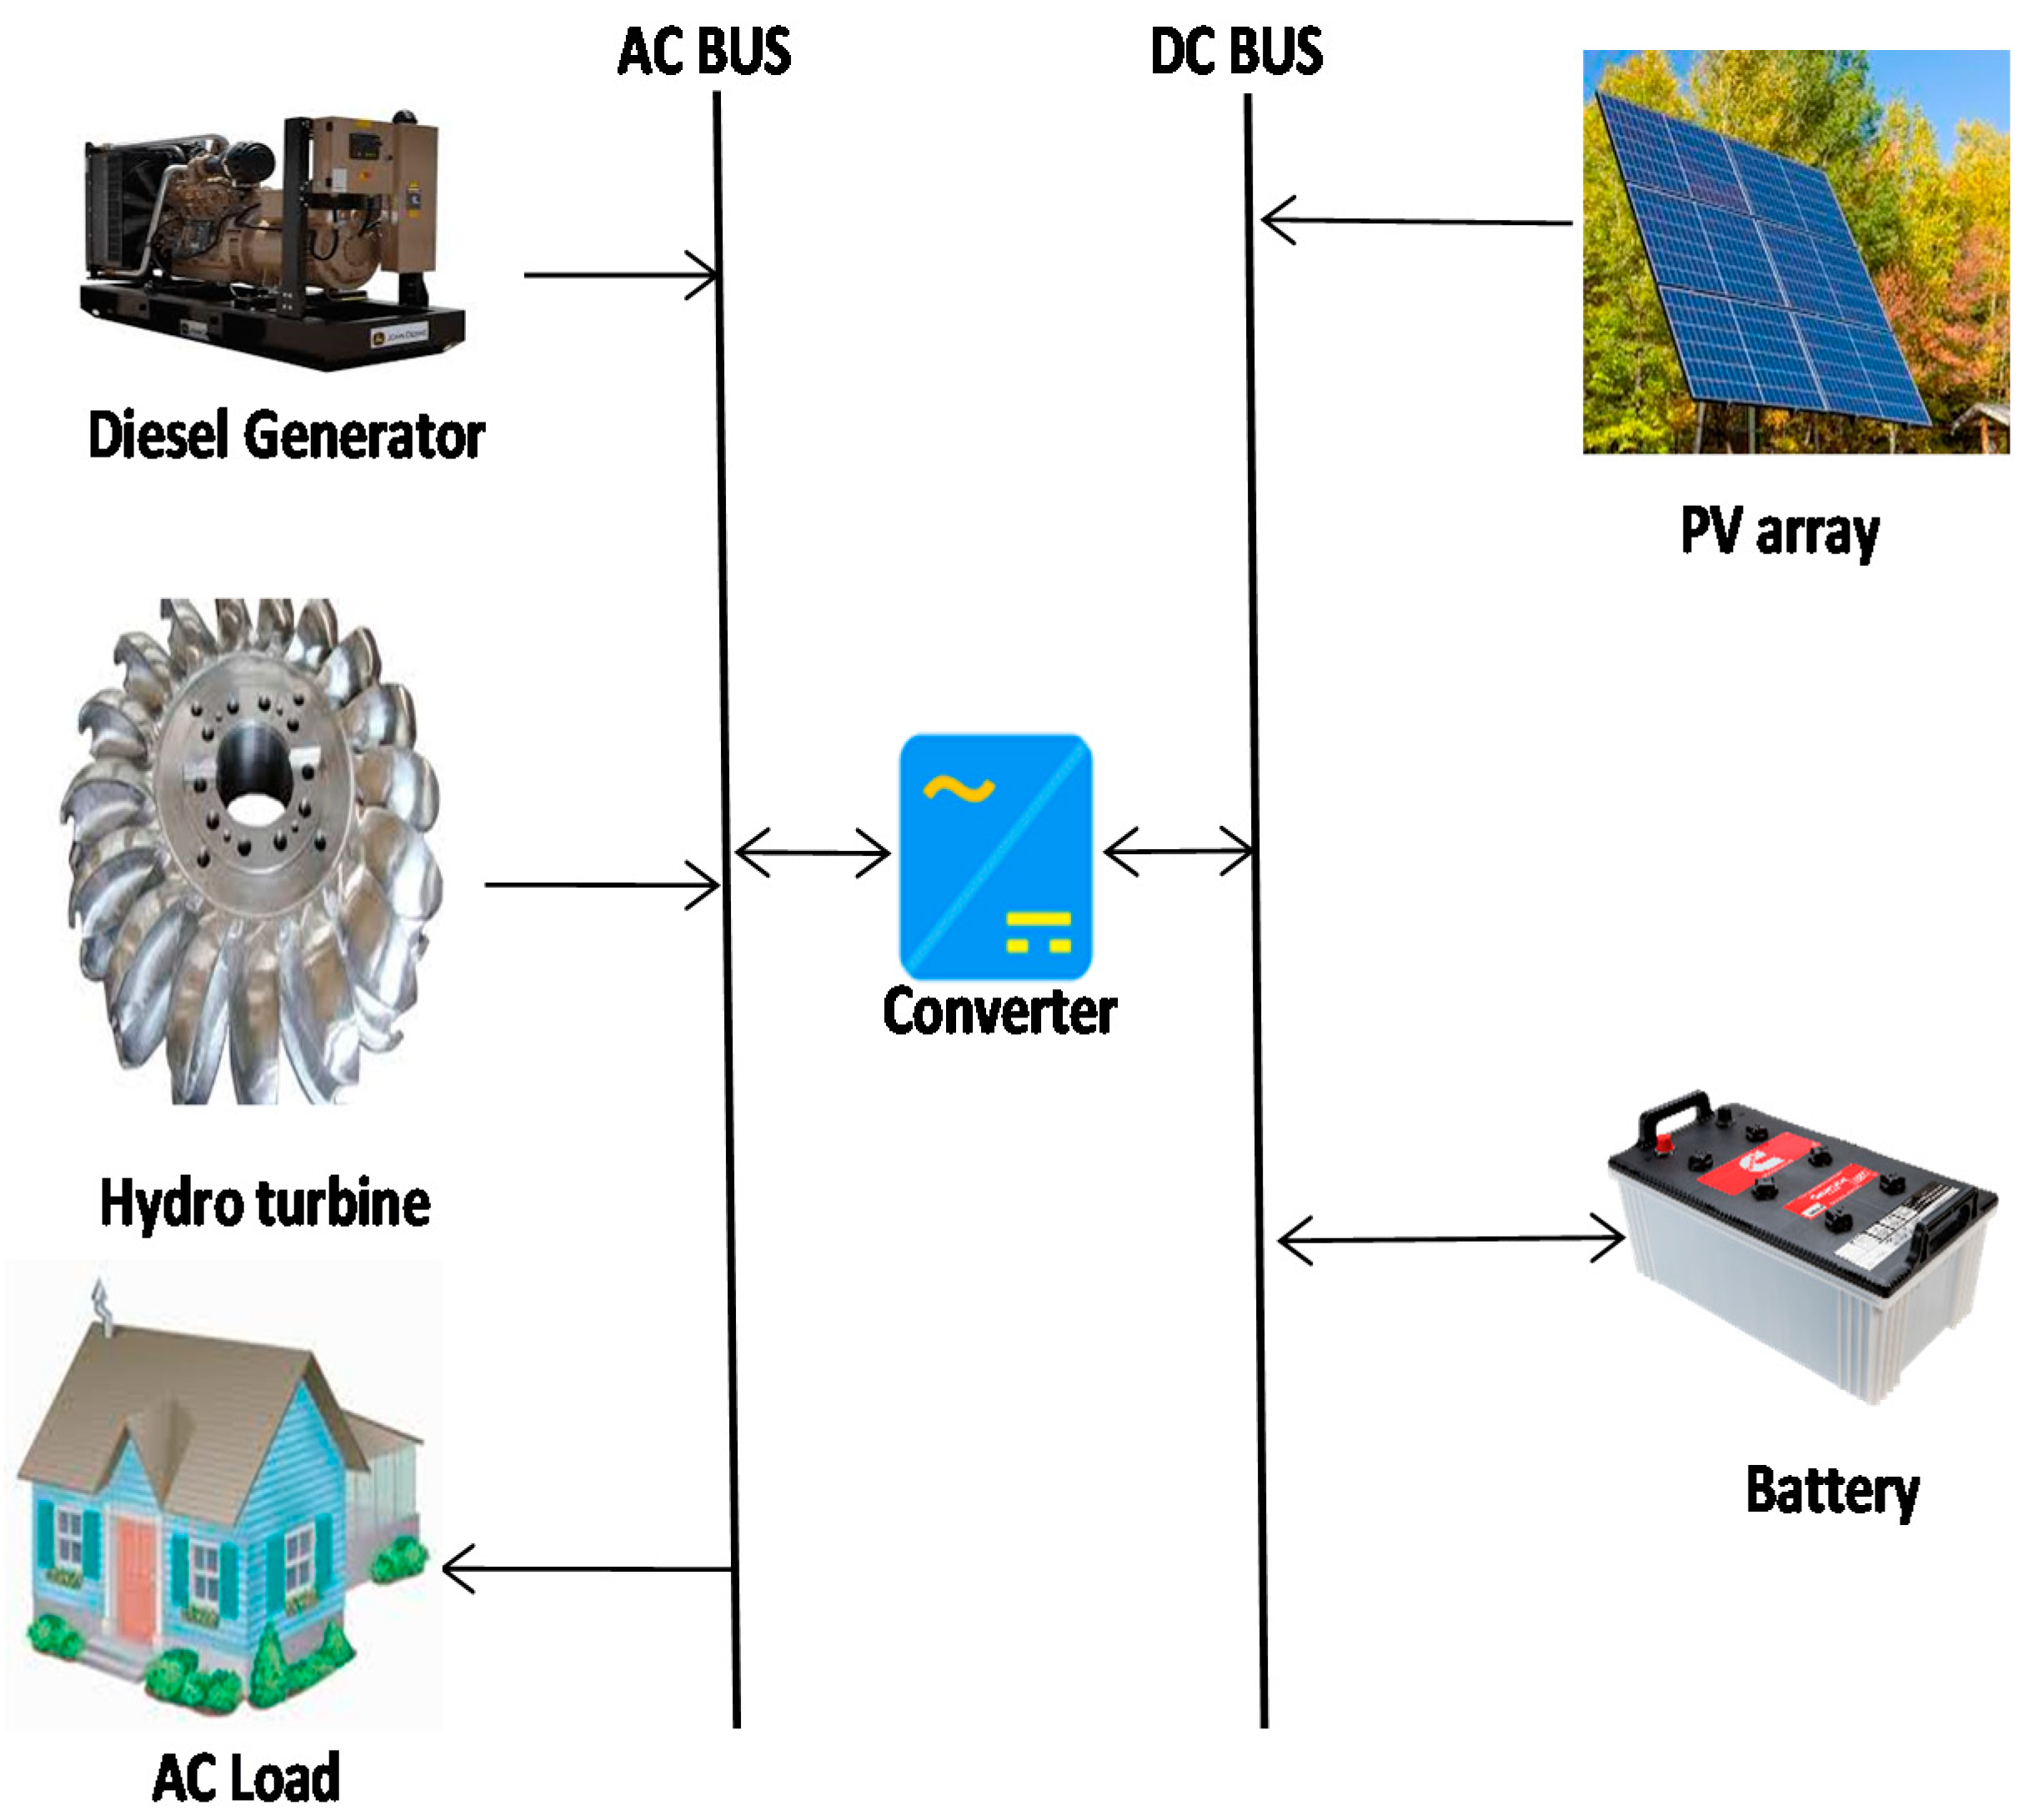
3.2. Proposed Hybrid Generation System and Load Profile Analysis

The proposed hybrid system is comprised of four major components that consist of a PV system, hydroelectric system, batteries, and a diesel generator (DG), as illustrated in Figure 2. The application of a hybrid system for power generation is more cost-effective with high reliability than a single source system (hydro-alone/photovoltaic-alone systems). For instance, it was shown in [12] that the hybrid system could reduce the energy cost by about $0.369/kWh as compared with a PV-alone system. Moreover, the effect of global warming could be reduced when renewable and nonrenewable energy resources were used together to serve a particular load, as demonstrated in [13]. The proposed system configuration considered the 24 h load of a total of 250 households in the village. The village load profile was estimated based on the data presented by Akinyele [30]. The Nigeria southern region energy consumption pattern was considered in that study; thus, a similar power consumption pattern was used in this paper. The loads usually consisted of refrigerators, compact fluorescent lamps, fans, televisions, and a few other appliances. The total electricity demand of the site, therefore, was computed in HOMER as the hourly load data to obtain the daily and monthly load profiles for the whole year. The village hourly and yearly load profiles are presented in Figure 3a,b for an annual average daily load demand of 3375 kWh per day with a peak demand of 357 kW.
In general, most of the loads operated for a few hours daily, while a high percentage of the electricity demand in the remote area was attributed to the lighting and cooling devices. The lighting load was mostly operated during the night hours, with the peak time between 19:00 and 22:00, while the cooling load varied according to the community’s seasonal conditions. Additionally, there was low-energy demand in the morning from 7:00 to noontime because of the presence of the sunlight and low temperature, reducing the working hours of the lighting and fan loads. However, a 10% day-to-day and time step random variability was used in HOMER for better system reliability. An optimal design assessment of PV/diesel, PV/hydro/battery, PV/hydro/diesel/battery, and PV/diesel/battery was conducted to obtain optimal system configuration along with a sensitivity analysis to examine the system’s operational behavior, while varying some parameters that could affect hybrid system performance.

3.3. Hybrid System Design Specifications

The monthly average solar irradiation and clearness index obtained from NASA [45], and shown in Figure 4, were inputted in HOMER as solar global horizontal irradiance data with annual average irradiation and a clearness index of 4.71 kWh/m2 daily and 0.474, respectively. The results showed that the months from July to September recorded low daily radiation, as well as a low clearness index because of the high rainfall experienced during these periods, revealing that the PV power production level was smaller than in other months. In addition, the ambient temperature influenced the operational performance and the electricity generation level of the solar PV system; consequently, there was a need to consider temperature variation of the selected location. The average monthly temperature is depicted in Figure 5. The maximum ambient temperature occurred in April, the minimum temperature occurred in August, and the annual average temperature was 24.91 °C.
The hydrological data of the Otamiri River considered in this research paper were taken from [46]. The hydrological graph, shown in Figure 6, showed that the chosen site experienced a high-water flow rate for considerable power generation from the hydropower turbine. The peak water discharge was observed in October, while a low stream flow of 6.14 m3/s was recorded in April. An annual average discharge of 7.67 m3/s was found. The nominal power of 94.08 kW was determined for the water turbine through the available head and design stream flow rate.

3.4. Hybrid System Components and Costs

The input parameters and pricing of the various components used in this paper are given in Table 1. Different sizes of the system components were evaluated to find the best and appropriate size suitable for the location. Two dispatch strategies (DS), i.e., load following (LF), and cycle charging (CC), were strategically implemented for the energy management systems to properly investigate the hybrid system techno-economic performance. On the one hand, in the cycle charging strategy, the diesel generator runs at its maximum rated power to serve the load in addition to feeding the surplus power for charging the storage device. On the other hand, the diesel system operates just to sufficiently satisfy the load demand without charging the battery storage in the case of a load-following strategy. The operating reserve as a percentage of load and renewable output was set at 10% of the load in the current time step, and 25% of solar power output, while 3% was selected for the maximum annual capacity shortage which was within the range recommended by [47]. The project lifetime is 25 years at a diesel fuel price of $0.63/l. and a discount rate of 13.5%.

3.5. Mathematical Model

3.5.1. Modeling of a Hydropower System

The principle of power production by a hydro turbine is based on the transformation of the kinetic energy of falling water into mechanical power, which is, then, converted into electrical power by a generator. In HOMER, the below equation is used to determine the electrical power generated by the hydro turbine [12]:
P h y d = η h y d × h n e t × ρ w a t e r × Q t u r b i n e × g 1000   ( W k W )
where ηhyd is the efficiency of the hydro turbine system (%), ρwater the water density (1000 kg/m3), Qturbine refers to hydro turbine stream flow rate in m3/s, g is the gravitational acceleration, and hnet is the effective head in meters, and is computed in [48] as:
h n e t = h × ( 1 f h )
where h denotes available head in meters and fh, the pipe head loss.
To determine the frictional losses, the Darcy–Weisbach equation given in [12] can be utilized for a circular pipe.
h L = f D ( L D ) ( V 2 2 g )
where hL denotes the absolute head loss as a result of friction (in units of length), fD, the Darcy friction factor, L denotes the pipe length in meters, D the pipe diameter (m), and V is the flow speed (m/s). There are various methods in which the Darcy friction factor fD can be determined, including the Moody diagram, which is a well-known diagram, as depicted in Figure 7.

3.5.2. Modeling of a PV System and Temperature

PV modules consisting of solar cells are used to produce electricity for different purposes (e.g., household load, street lighting, and water pumping). Furthermore, the solar insolation level and temperature, as well as the cell material of the photovoltaic, are the main factors that influence the energy production level of a PV panel [15]. The output power of the PV panel is estimated in HOMER as follows [14]:
P P V = Y P V f P V ( G T G T , S T C ) [ 1 + α P ( T C T C , S T C ) ]
where YPV denotes the PV power output under standard test conditions (STC) in kilo watts, fPV refers to the PV derating factor in %, GT represents global solar irradiation incident on the PV module in the current time step in kilo watts per square meter, GT,STC is the incident radiation under STC (1 kilo watt per square meter), αp refers to temperature coefficient of power in %/°C, TC denotes the cell temperature of the PV system (°C), and TC,STC refers to TC at STC (25 °C).
PV efficiency, however, decreases as the temperature rises. The derating factor of temperature is evaluated as [23]:
f t e m p = 1 + p [ T a + I T ( T C , N O C T T a , N O C T I T , N O C T ) T C , S T C ] 1 + P I T ( ( T C , N O C T T a , N O C T I T , N O C T ) η m p , S T C 0.9
where Tc,NOCT is the nominal operating cell temperature (°C), Ta,NOCT refers to the ambient temperature at NOCT (20 °C), IT,NOCT represents the solar irradiation at NOCT (0.8 kW/m2), ηmp,STC denotes the efficiency of the PV panel under maximum power at STC (%), and αp represents the power temperature coefficient (%/°C).

3.5.3. Modeling of Economic Parameters

The net present cost (NPC) comprising the cost of replacement, initial cost, fuel cost, salvage cost, and the operational maintenance cost is computed using the following equation [43]:
C N P C = T A C C R F ( i , n )
where TAC is the total annualized cost in $ per year; n and i refer to the project lifetime in years and the annual interest rate in percent, respectively; and the capital recovery factor (CRF) is given in [25] as a function of n and i:
C R F ( i , N ) = i ( 1 + i ) N ( 1 + i ) N 1
The levelized cost of energy (COE) is the average cost per kilowatt hour of effective power generated by the system and is given in [49] as:
C O E = T A C E a n l o a d s e r v e d
where Eanloadserved refers to the gross annual load (kWh) served.

4. Results and Discussion

In this analysis, the HOMER simulation tool was used to determine the best system configuration through a techno-economic and environmental evaluation corresponding to the selected remote location in Nigeria. A sensitivity evaluation was performed to determine system performance, while varying variables that directly affect the operational behavior of hybrid systems. The procedure for the economic evaluation to obtain the optimal configuration is illustrated in Figure 8. The maximum capacity shortage of 3% was set for 25 years of project lifespan and a diesel fuel price of $0.63/L [50].

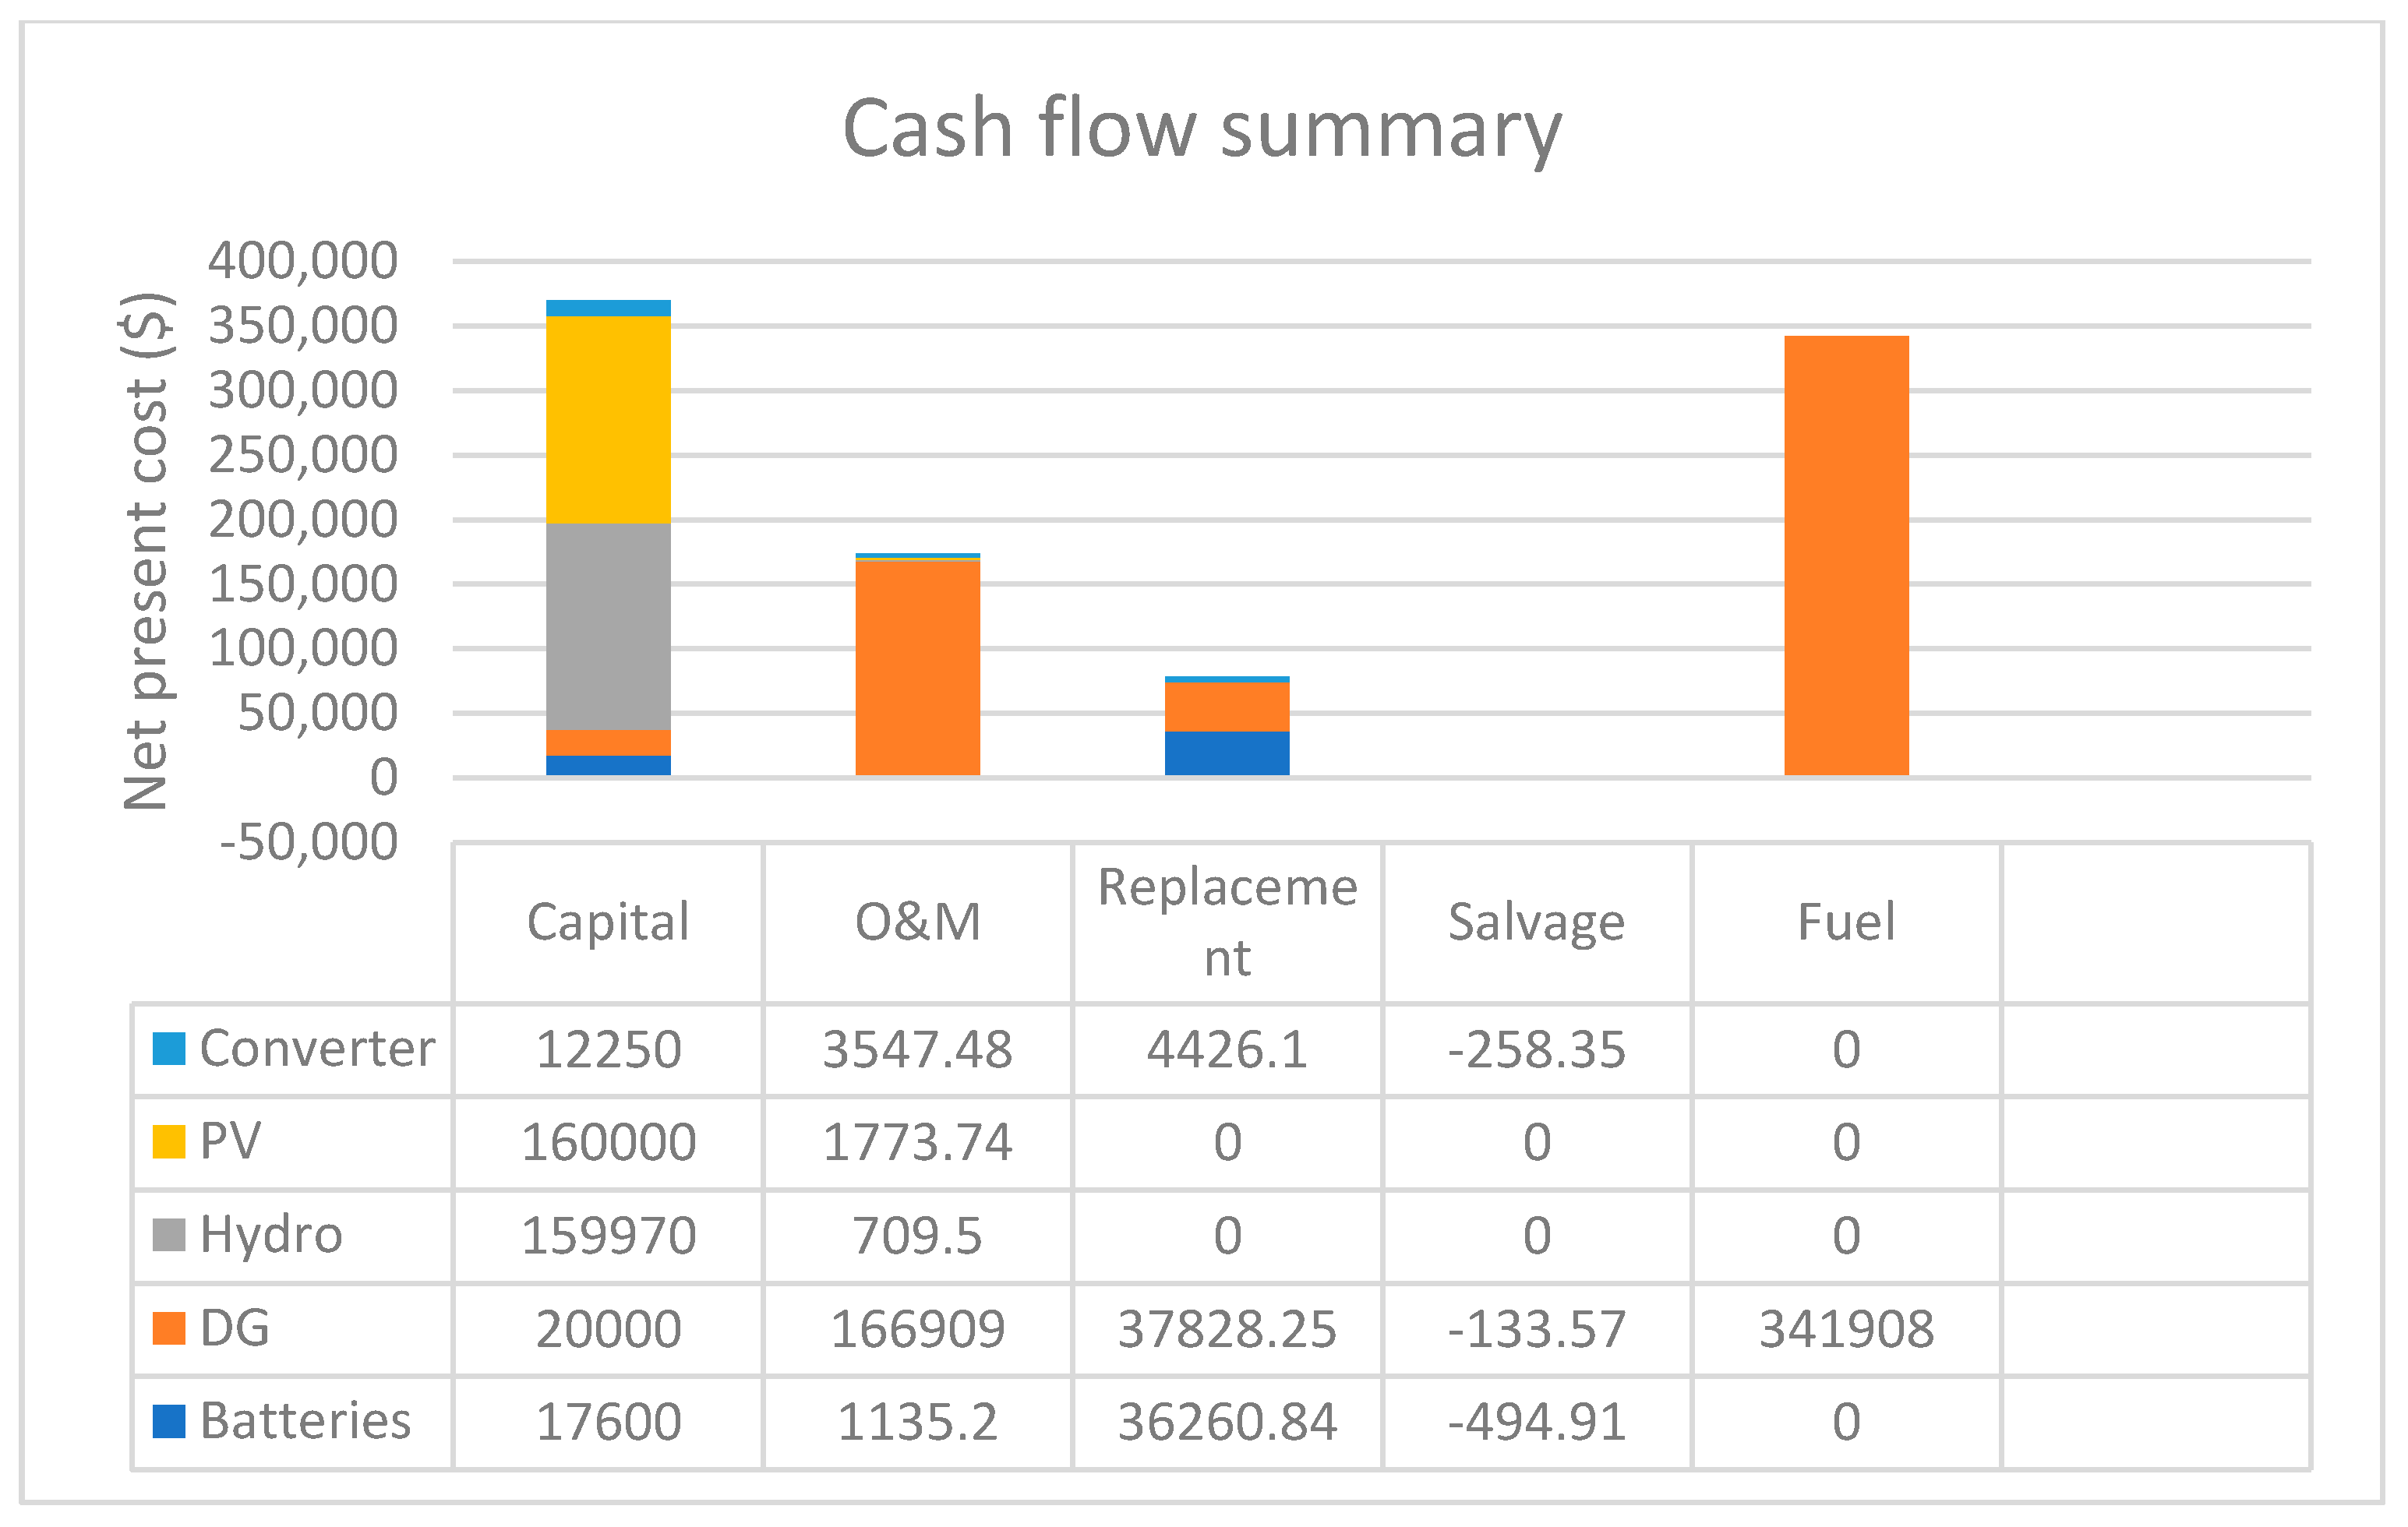
4.1. Optimization Results

In this section, we discuss the optimization results of the power system produced at a fuel price of $0.63/L and a discount rate of 13.5%. The hybrid system configuration obtained from the simulation analysis is shown in Table 2. The configuration includes PV/diesel, PV/hydro/battery, PV/hydro/diesel/battery, and PV/diesel with battery system configurations. The table reveals that PV/diesel/micro-hydro/battery configuration is a more economically optimal solution than other models and that the PV/diesel configuration has the worst economic prospect. The optimal system consists of a 50 kW PV, 94.1 kW hydro turbine with 111 kWh nominal battery capacity, 100 kW DG capacity, and a 50 kW converter. The operating cost for this optimized configuration is $83,667/year with a COE of $0.112/kWh and an NPC of $963,431 and an initial capital cost of $369,820. The results also indicate that the optimal configuration reduces the operating cost, COE, and NPC by 76%, 64%, and 64.3% as compared with the PV/diesel system (worst case), respectively. The renewable fraction representing the contribution of RESs in the total power generated by the entire system was found to be 77.2%. This result shows that the system produces more energy from renewable power sources with the additional energy supplied by the diesel system. The outcome also shows that dispatch strategy significantly affected the renewable penetration rate. For example, when the simulation was conducted for the optimal system using CC and LF strategy, the renewable fraction was found to be 77.2% and 81.6%, respectively, for the same load demand. The optimal dispatch strategy for the proposed system was found to be cycle charging, as shown in Table 2. The optimized system produces an annual total of 1,518,895 kWh of energy, whereas the hydro turbine system contributes about 1,178,600 kWh/year which represents around 77.6% of the total production. The diesel plant system supplies a share of 18.3% (277,222 kWh/year), with the extra electricity provided by the PV system at a share of 4.15%. Figure 9 shows the monthly power generation of each component.
Furthermore, the PV/hydro/battery configuration shows 100% renewable penetration with no fuel consumed because of the absence of a diesel plant. This system is superior in terms of environmental aspects because no pollutant emissions are reported. However, it has economic negatives because the NPC and COE are 125% and 127% more than that of the optimal configuration. Moreover, the optimized system had a small unmet electric load of 15,412 kWh/year, which was only 1.25% with a capacity shortage of 35,816 kWh/year (2.91%) of total capacity. However, the capacity shortage was considered to be acceptable, showing that the system had the maximum uptime and was able to satisfy most of its electrical load.
Concerning the performance of the diesel plants, the outcome revealed that the optimal system had the lowest annual consumption of 76,492 L of fuel, at 8.73 L/h, as shown in Figure 10, when operated for about 4,705 h per year. The diesel fuel consumption of this system was 77.1% less than that of the PV/diesel configuration (worst case). The generator operational life was found to be 3.19 years because it was considered to have a lifespan of 15,000 h [51].
The cash flow summary, presented in Figure 11, reveals that both capital and fuel costs contribute to the highest share of the total system cost. The high capital cost was because of the amount of money spent on the installation of the hydro and PV system, whereas the fuel cost was attributed to the generator operating conditions. The maintenance of the moving part of the diesel plant also led to high operation and maintenance (O&M) costs of around $174,075. The replacement cost, however, was reported to be a low value of $78,515, because the renewable power systems incurred no cost from replacement, since their lifetime was the same as that of the project’s lifetime.

4.2. Environmental Analysis

The production of greenhouse gases (GHGs) and pollutant emissions in hybrid power systems are attributed to the fuel consumption level of the DG system. In this paper, CO2 and other GHGs emissions were used to determine the environmental effect of the HESs. The concentration of pollutants and GHGs produced is directly related to global warming, and a trillion tons of carbon emitted can cause a peak warming of around 2 °C [8]. Ngan and Tan [52] recommended maintaining the amount of carbon release below a trillion tons to limit the effect of global warming. The type and amount of harmful pollutant emissions (CO2, CO, SO2, NOx, unburned hydrocarbons, and particulate matter) produced by the optimized system and PV/diesel configuration (worst case) are shown in Table 3. The optimum configuration was considered to be environmentally friendly because it emitted the least pollutant gas as compared with the PV/diesel system and other system designs analyzed. The results also revealed that the optimal system prevented about 77.1% of CO2 gas emission from being released to the surrounding air as compared with the PV/diesel system (worst case). The table shows that the prime contributor to unhealthy atmospheric air in this location is carbon dioxide (CO2), followed by carbon monoxide, while particulate matter contributes the least to total pollutant emissions [51].

4.3. Sensitivity Assessment

Sensitivity analysis was performed on the optimized configuration by varying some variables that could directly affect the cost and its overall performance. In this section, the following parameters were analyzed: real interest rate, RE component (solar irradiation and hydro stream flow rate), capacity shortage, and battery minimum SOC.

4.3.1. Real Interest Rate

The interest rate (RIR) is a function of both the nominal discount and expected inflation rates that are utilized in HOMER to compute from NPC, the discount factors, and annualized costs. The effects of varying this parameter from 12% to 18% on the operating cost, NPC, and COE are shown in Figure 12. The figure reveals that this variable is linearly related to the COE, as given in Equation (8), because the interest rate increases with an increase in total annualized cost (TAC), which is directly proportional to COE. However, the total NPC and operating cost decreases linearly as the interest rate increases. The COE increases from $0.108/kWh for a 12% interest rate to $0.124/kWh as the interest rate rises to 18%. The NPC decreases by approximately 20%, while the operating cost is affected slightly with about a 0.69% reduction, as the interest rate increases from 12% to 17%. Again, an increase in the interest rate by 50% is found to increase the COE by about 14.8%.

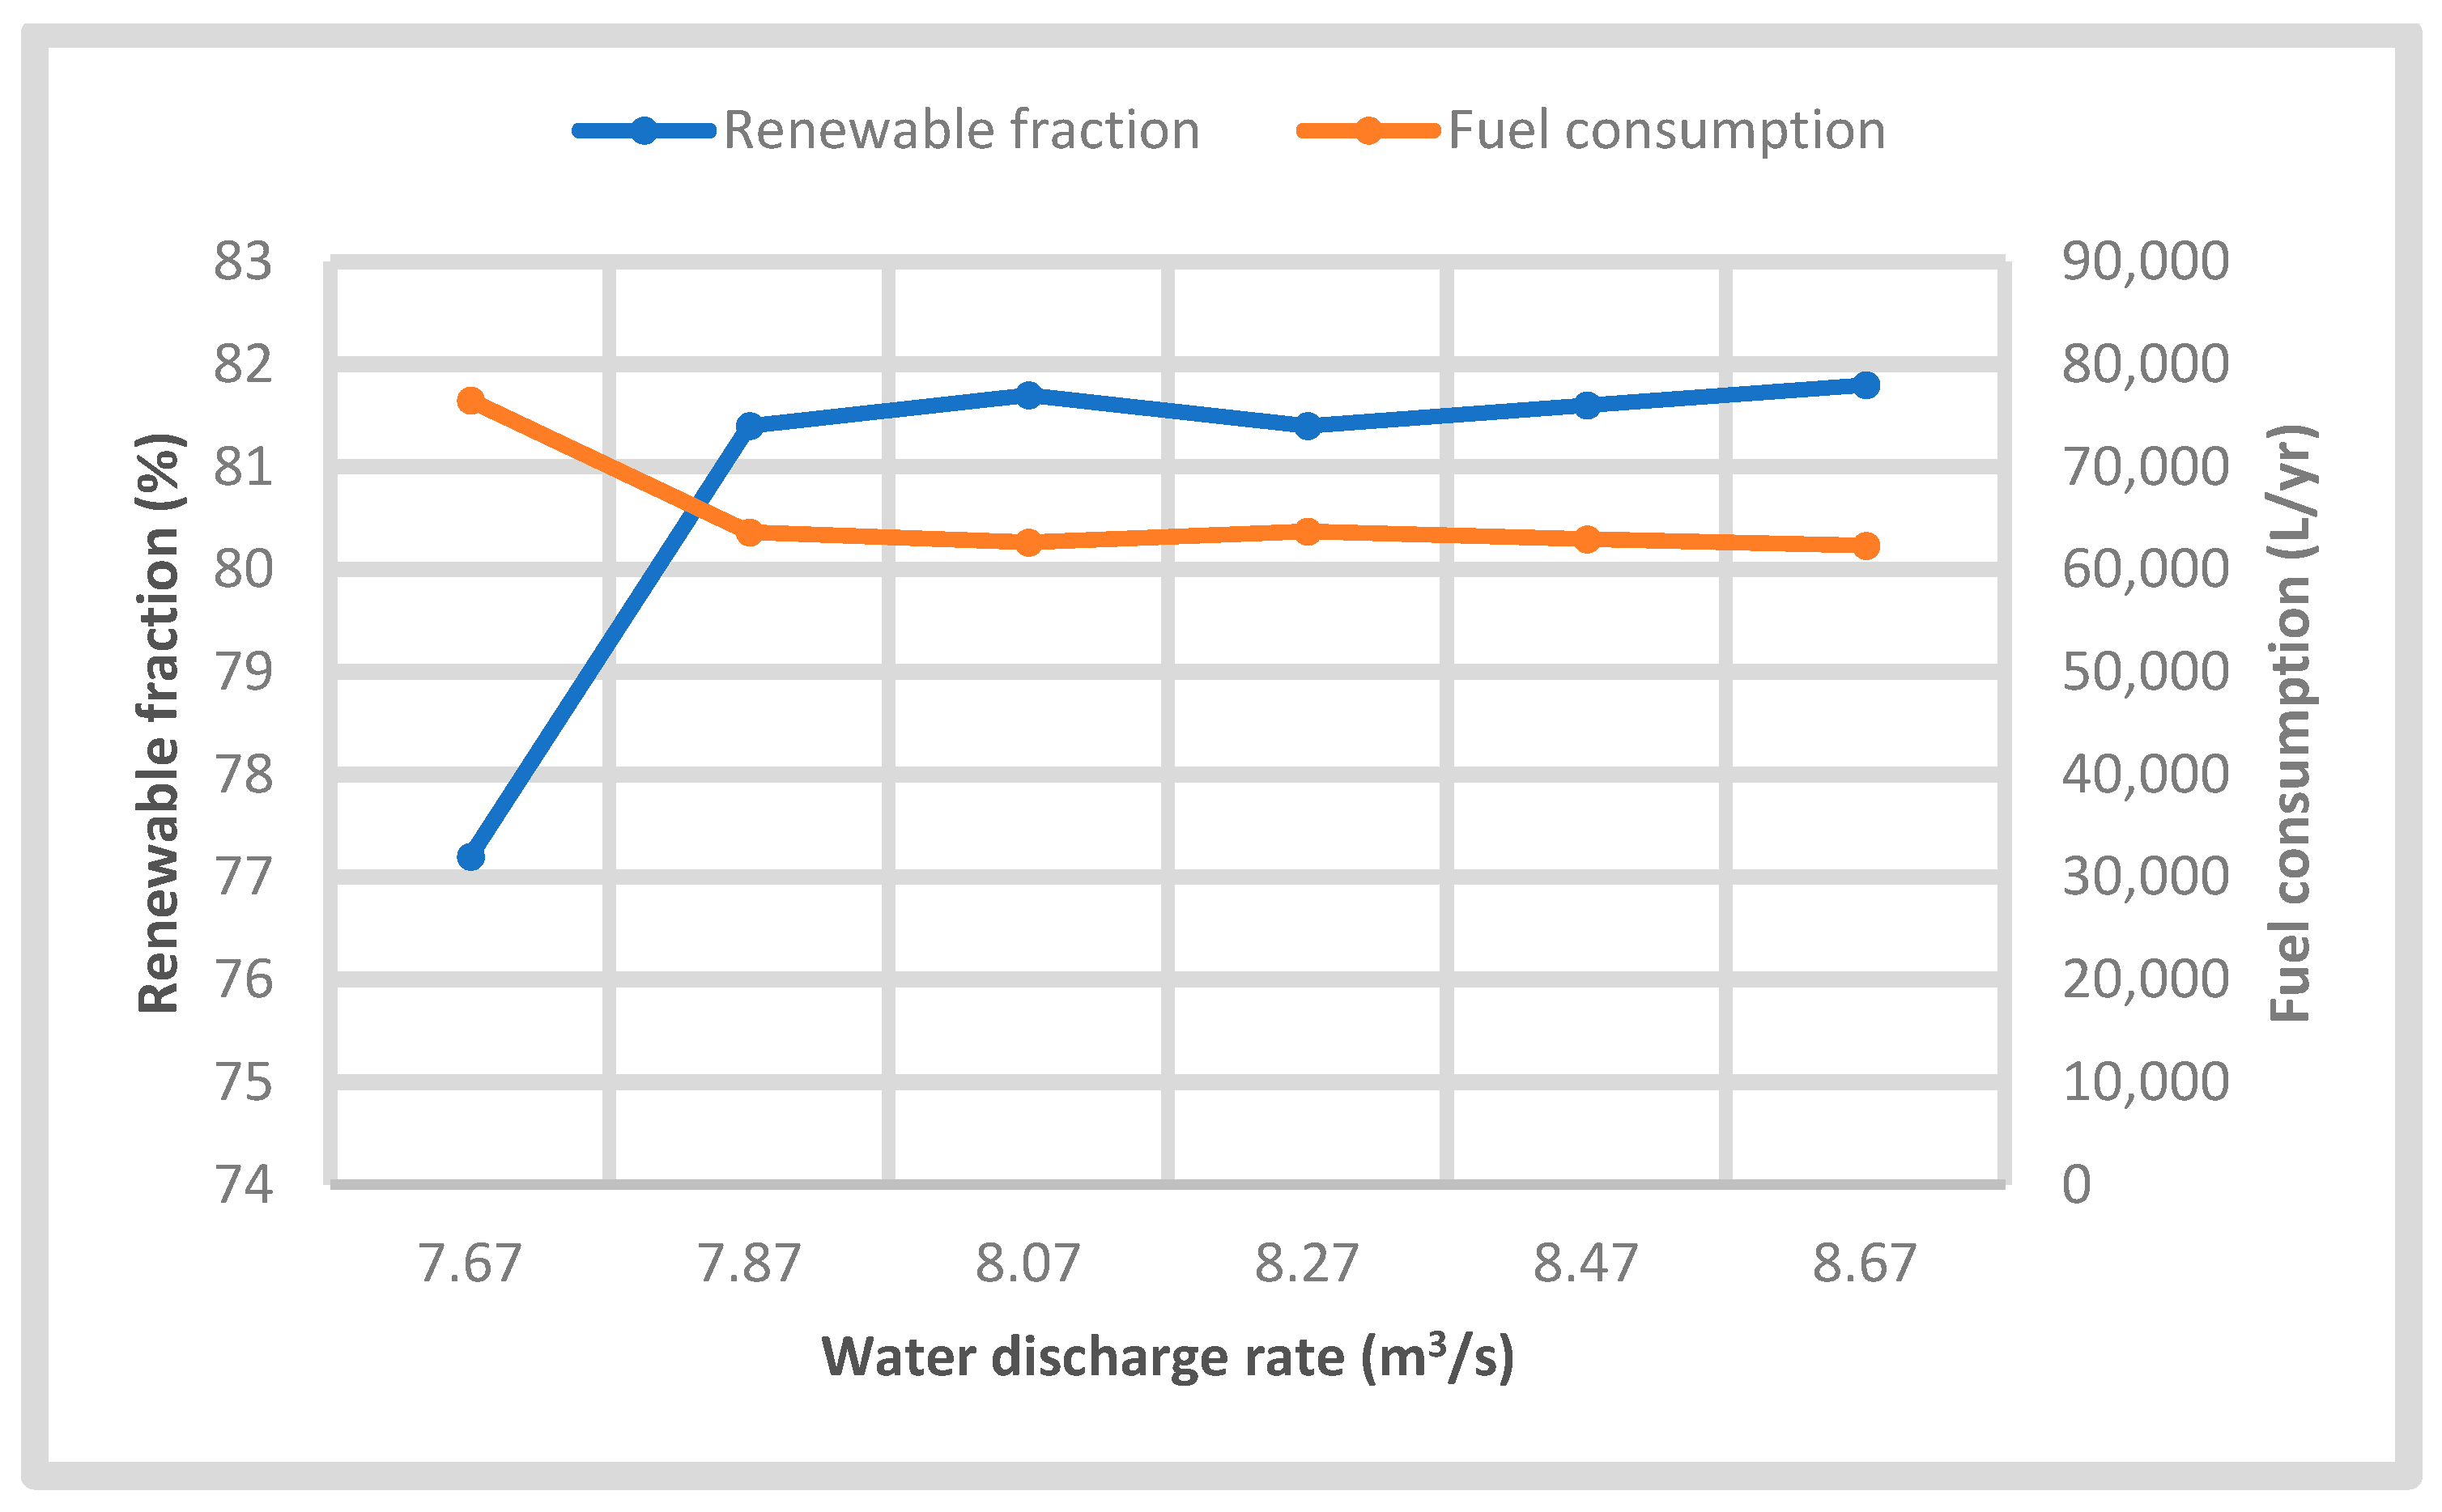
4.3.2. Renewable Energy Component Parameters

The level of global solar irradiation (GSI) and availability of water stream flow (WSF) rate in a place determines the periods it will take for the PV and hydro system to meet the load requirement. High solar insolation and water discharge reduce the working hours of DG, as well as the fuel consumption rate, and vice-versa. Furthermore, the amount of electricity contributed by RE systems (PV and hydro) depends on the level of streamflow and solar radiation and intensity; thus, varying these parameters can affect the system’s operational performance and cost. In this case, the annual average global solar irradiation was increased from 4.71 to 9.71 kWh/m2 daily at an interval of 1 kWh/m2/day, whereas the average annual streamflow was varied in the range of 7.67 to 8.67 m3/s with an increasing step of 0.2 m3/s.
The effects of varying solar radiation on the COE, NPC, and operating costs are illustrated in Figure 13, and Figure 14 presents a graph of NPC, operating cost, and COE as a function of water discharge variation. As indicated in Figure 13, the NPC and COE decrease by only 0.76% and 0.89%, respectively, whereas the operating cost reduces by about 4.2% when the level of global solar radiation increased from 4.71 to 9.71 kWh/m2/day in the HES. Again, similar to solar radiation, Figure 14 shows that the NPC decreased linearly from $963,431 to $920,009 (4.5% reduction) along with the COE that reduced from $0.112/kWh to $0.107/kWh (4.46% decrease), and the operating cost reported the highest reduction of 8.8%, as the water discharge rate increased from 7.67 m3/s to 8.67 m3/s. The amount of decrease in NPC and COE in both cases could be justified by the reduction in diesel consumption, as shown in Figure 15 and Figure 16, as well as the cost related to diesel. Moreover, the renewable penetration rate increased as the GSI and WSF increased. The results also show, in the case of GSI, that the COE remains constant for solar irradiation above 5.51 kWh/m2/day. The results clearly show the impact of these parameters on the overall system cost as well as the electricity cost.

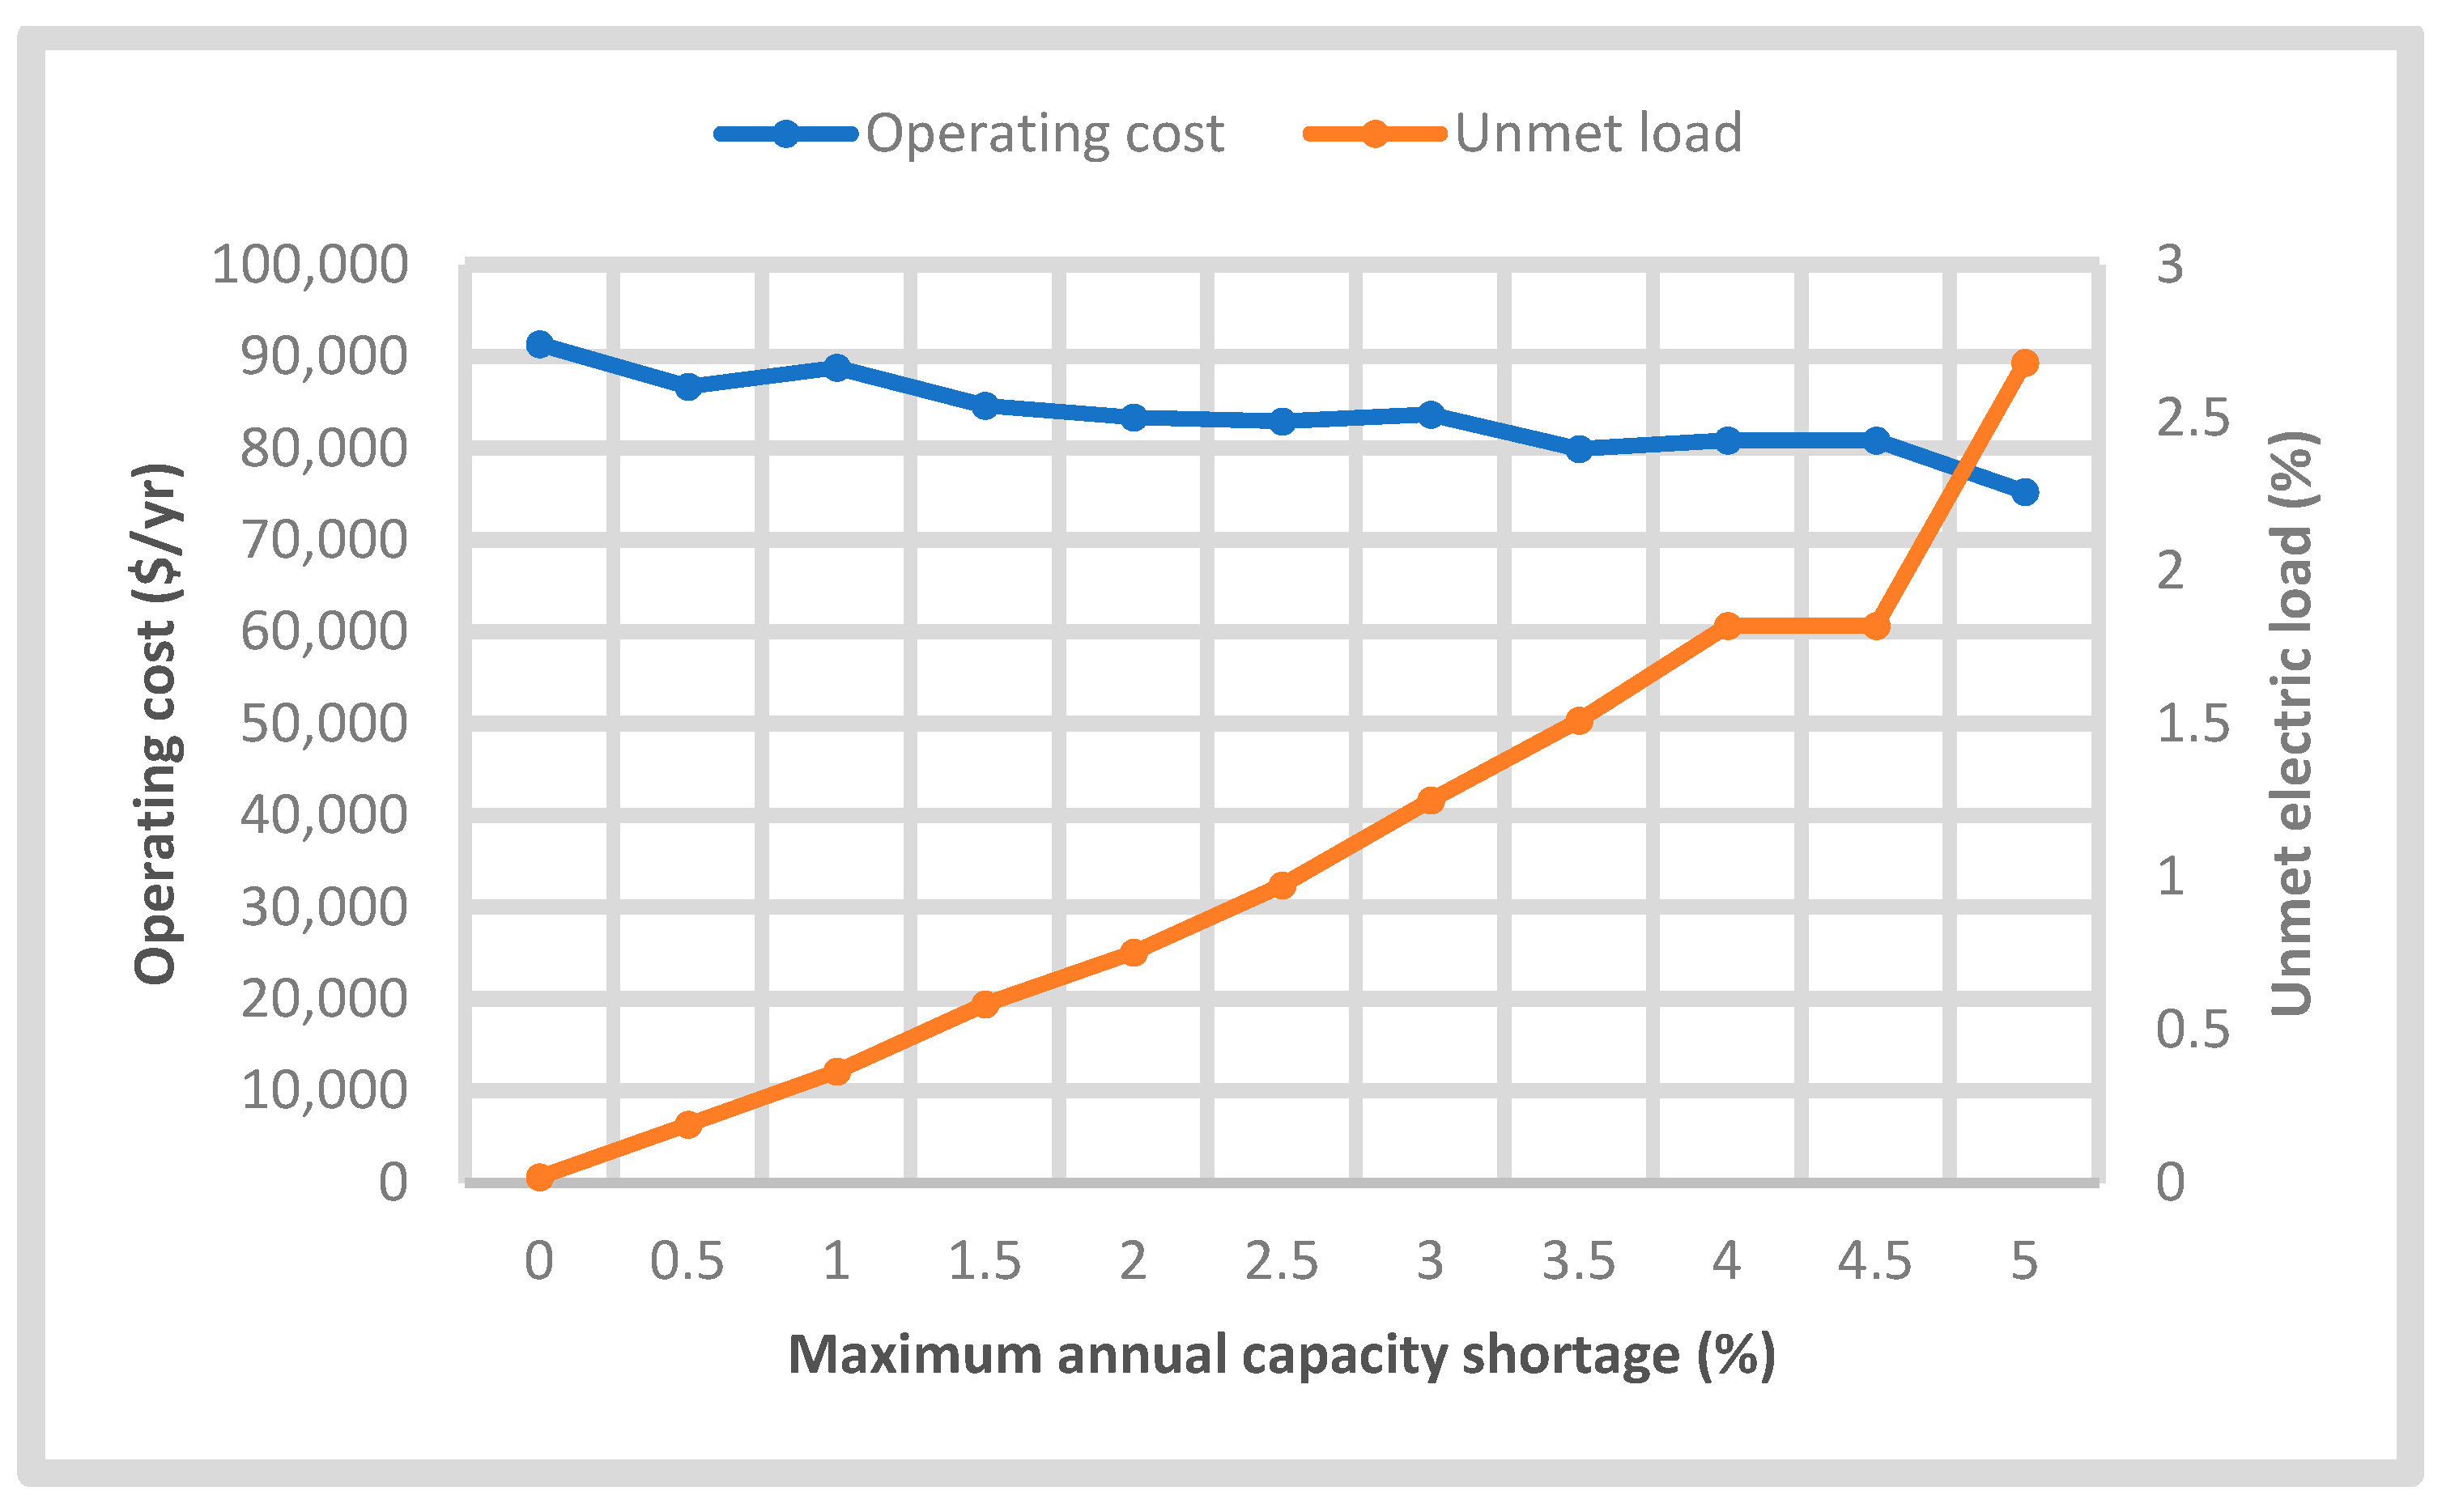
4.3.3. Maximum Annual Capacity Shortage (MACS)

The maximum annual capacity shortage (MACS) shortage is the maximum allowable amount of the total deficit that occurs between the required capacity and the actual capacity the system can supply divided by the total load, whereas the capacity shortage fraction is a function of total capacity shortage and the total electrical load [48], and any system having a higher amount of this fraction is considered to be unacceptable. The results can be altered in some cases if a certain amount of capacity shortage is allowed, such as the occurrence of a very high peak demand lasting for a very short duration. However, selecting zero for the maximum annual capacity shortage means that the system must serve the electric load at all times including the very high peak demand.
Givler and Lilienthal [47] recommended varying this parameter within a range of 0.5% and 5% to determine the performance and cost-effectiveness of a RE system. In this part, the maximum annual capacity shortage was allowed to vary between 0% (in which the system must serve 100% of the load at all times) and 5% (in which the system must serve 95% of the load at all times) to check the operational and economic behavior of the HES. Figure 17 and Figure 18 show that allowing a certain percentage of capacity shortage can significantly affect the system’s total NPC and unserved annual load, as well as the energy cost and operating cost. The NPC and COE of the system reduce from $1,069,184 to $915,297 and from $0.122/kWh to $0.108/kWh, respectively, when the MACS rises from 0% to 5%. In addition, this increase causes a 17.6% reduction in operating cost, while the unfulfilled load increases from 0.018% to 2.68%.

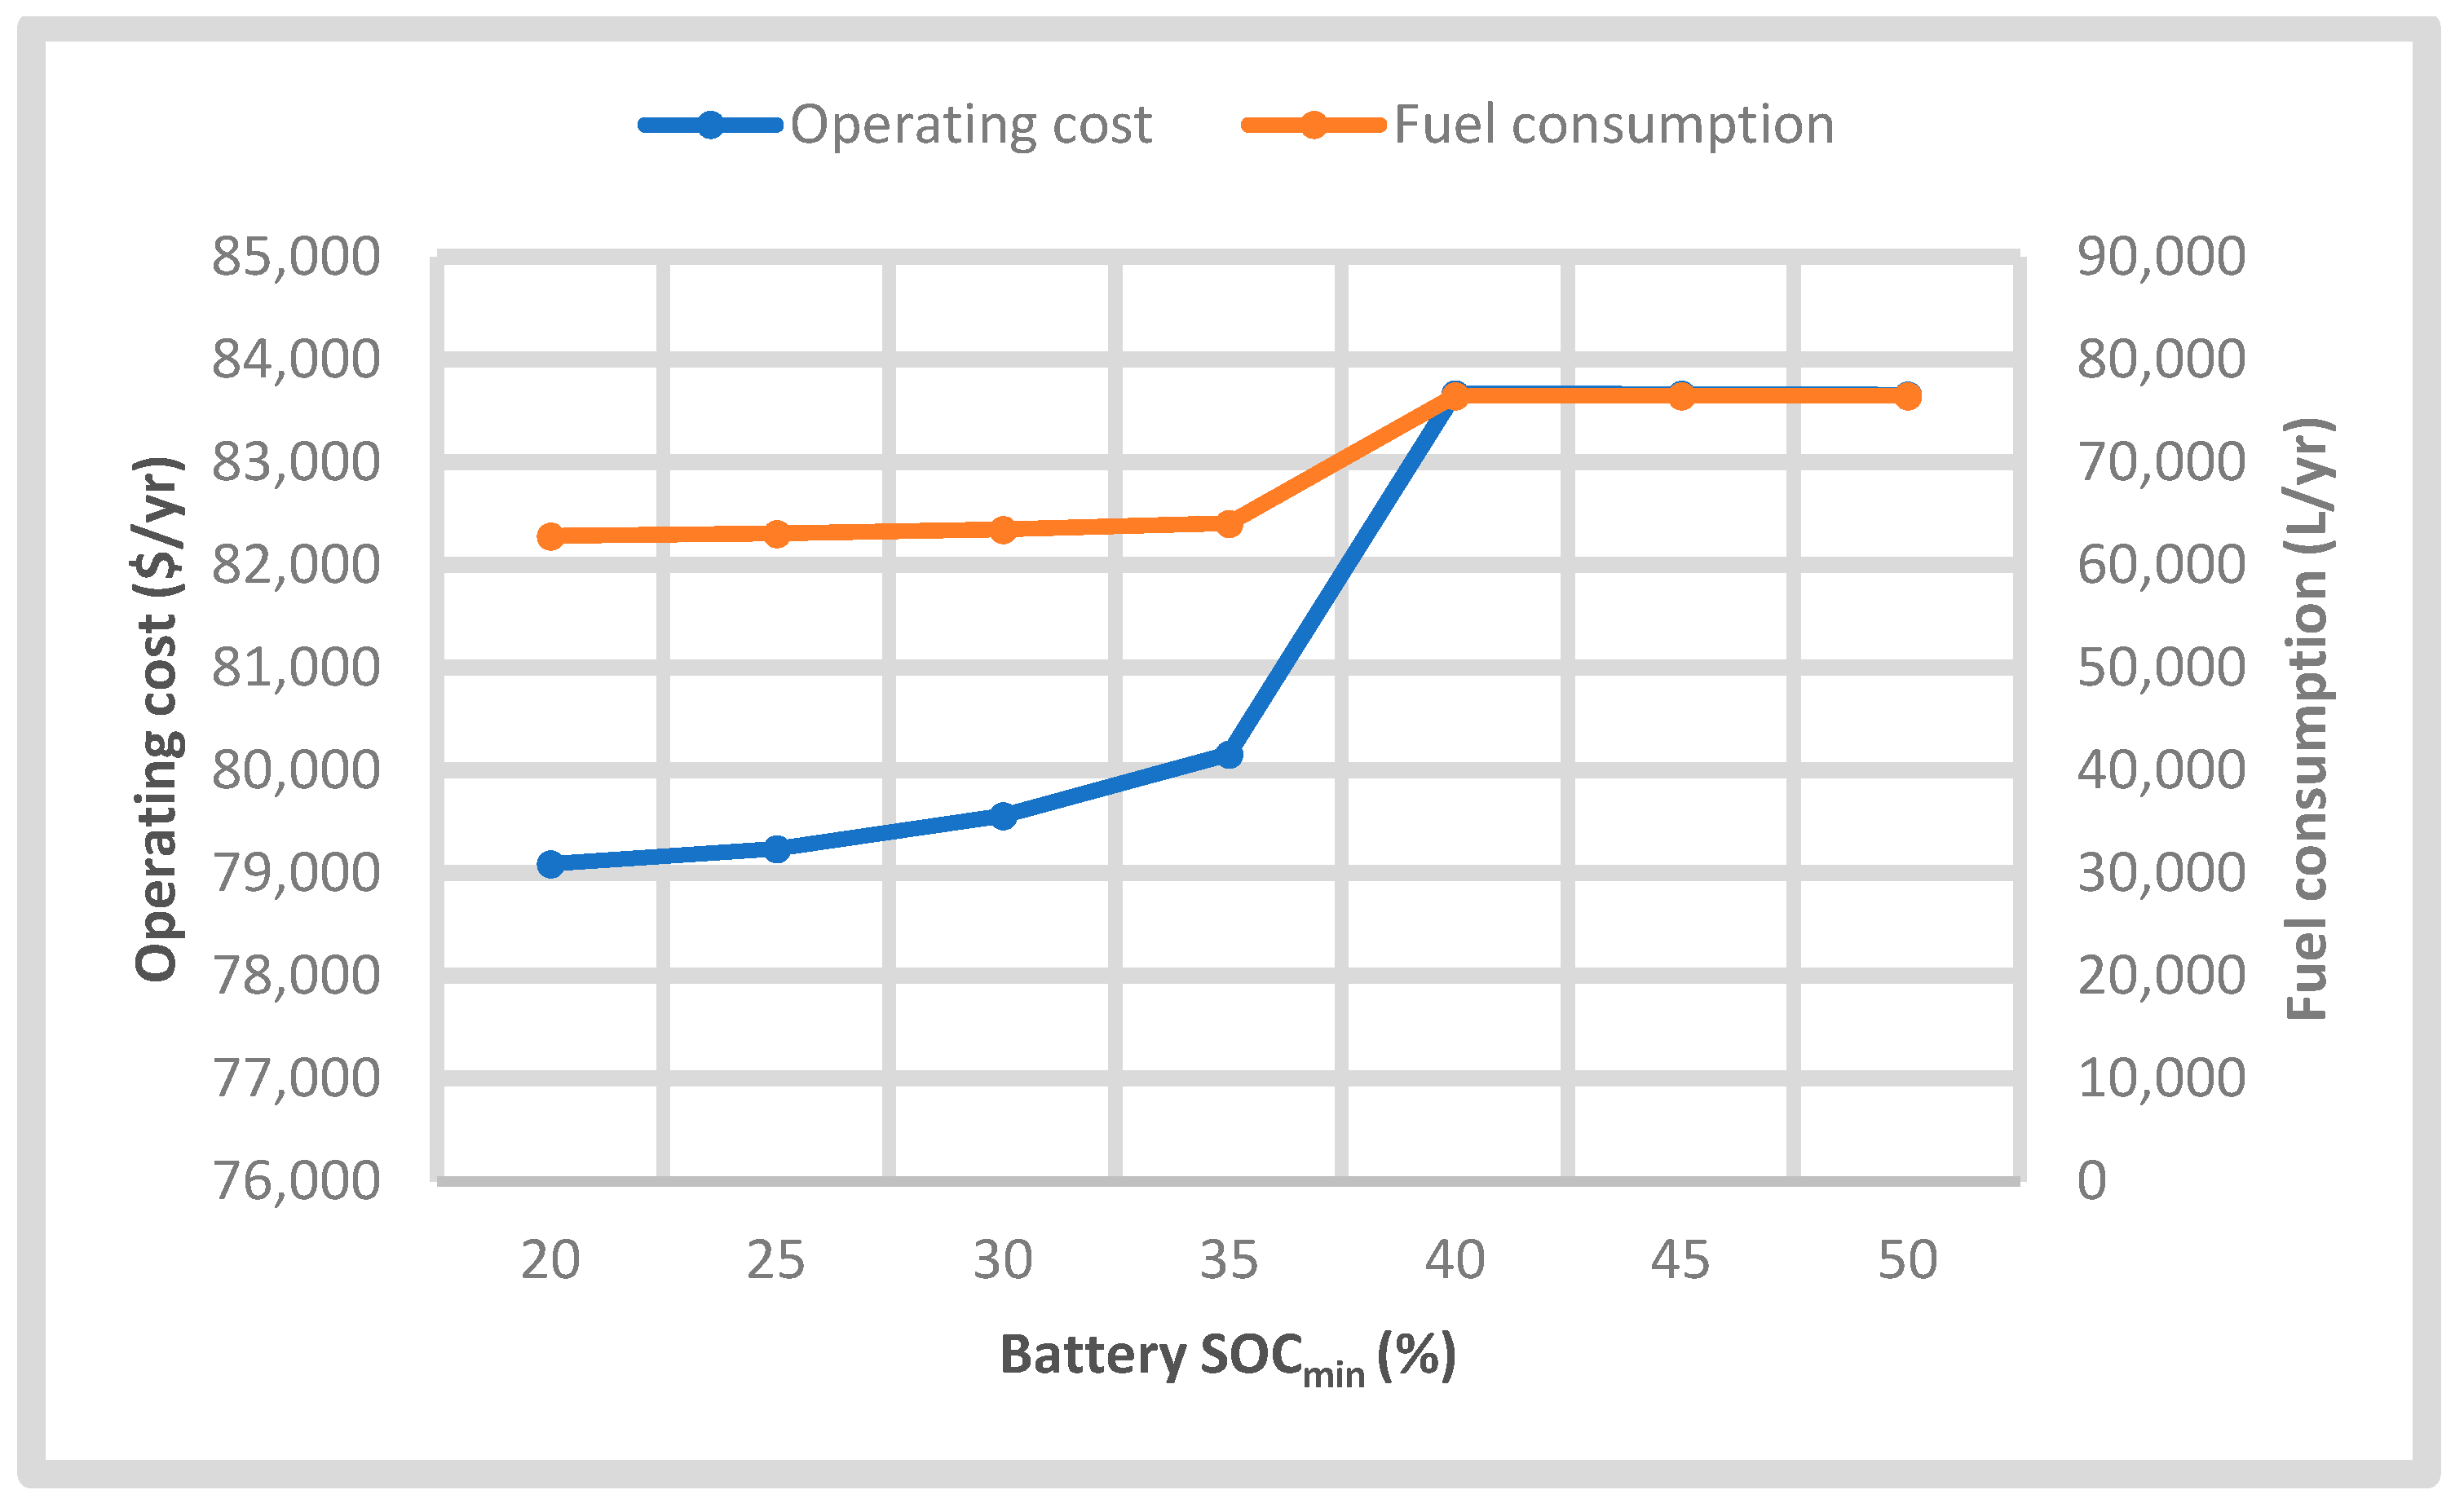
4.3.4. Battery Minimum State of Charge (SOCmin)

The battery system minimum state of charge (SOCmin) is the relative charge state below which the storage system is never drawn. Most storage batteries that are rechargeable are expected not to be completely discharged, otherwise, such action can permanently damage the batteries. The percentage range from 30 to 50 is normally selected for the battery SOC to avoid an excessive discharge that could damage the battery bank and to increase the battery’s lifetime [49]. In this analysis, the effect of varying the SOCmin in the range of 20% to 50% in 5% increments on the hybrid system operational performance and the total cost was evaluated. The effect of increasing the SOCmin on the total NPC, COE, operating cost, and fuel consumption rate is illustrated in Figure 19 and Figure 20 The results show that a rise in the SOCmin from 20% to 50% causes the NPC and COE to increase by 1.59% and 1.8%, while the operating cost and annual consumption increase from $79,093/yr. to $83,658/yr. and from 62,812 L to 76,479 L of fuel. The increase in the annual liters of fuel consumed shows that the system relies more on the DG in meeting the load demand whenever the battery minimum SOC increases. In addition, the results show that increasing the SOCmin poses a significant environmental challenge, as more carbon emission would be produced because of its direct relationship with the amount of fuel in-take by the diesel plant.

5. Conclusions

In this article, we present an optimal design and environmental evaluation of an off-grid hybrid energy system meant to power a rural village in Nigeria. The HOMER analysis tool was employed for the economic evaluation of the proposed energy supply system along with the technical feasibility based on the energy sources available in the southern part of the country. Four different system configurations from a combination of hydro, DG, battery storage, and PV generation system were analyzed during the simulation process to obtain the most suitable and least expensive option, while considering the environmental effect of each system design. The simulation results reveal that the hybrid system with 50 kW PV panels, 94.1 kW hydro system with 111 kWh nominal battery capacity, 100 kW DG capacity, and a 50 kW power converter is the most economically feasible option for this location as compared with the other models, with the lowest NPC and COE being $963,431 and $0.112/kWh, respectively. In addition, the area shows a high potential for RE projects, as the RE penetration stands at a high rate of 77.2% that has reduced the operating hours and consumption of the diesel plants to 4,705 h/yr. and 76,492 L of fuel; thus, this system is appropriate for the environment because it helps to maintain a clean and safe atmosphere because it has low pollutants and GHGs.
The sensitivity assessment conducted on the optimum configuration shows that parameters such as the real interest rate, RE component (solar irradiation and hydro stream flow rate), capacity shortage, and battery minimum SOC have significant effects on the costs and operational performance of the system. The obtained results show that the total NPC and electricity cost varies whenever these parameters change at different rates, showing the sensitivity of the HES parameters toward variations in these variables. Lastly, the results of this work should assist in the implementation of rural electricity framework plans and increase the RE share in the total energy mix, supporting the limitation of the global warming effect. Further research is required involving the feasibility study of solar, wind, and hydro resources considering the six geopolitical zones of Nigeria.

Author Contributions

All authors contributed equally. All authors have read and agreed to the published version of the manuscript.

Funding

This research received no external funding.

Acknowledgments

The support of the deanship of graduate studies at King Abdul-Aziz University for postgraduate scholarship is highly appreciated.

Conflicts of Interest

The authors declare no conflict of interest.

References

  1. Okafor, N.; Sunmola, A.; Onwuzu, F.; Inyang, M.; Udoma, U. Recent initiatives to reform the Nigerian electricity market. Pract. Law UK Artic. 2018, 1–11. Available online: https://uk.practicallaw.thomsonreuters.com/w-013-8954 (accessed on 15 November 2019).
  2. Williams, A.; Porter, S. Comparison of hydropower options for developing countries with regard to the environmental, social and economic aspects. Small 2006, 1, 10. [Google Scholar]
  3. Renewable, I.; Agency, E. Off-Grid Renewable Energy Solutions to Expand Electricity Access: An Opportunity Not to Be Missed. Available online: https://www.irena.org/-/media/Files/IRENA/Agency/Publication/2019/Jan/IRENA_Off-grid_RE_Access_2019.pdf (accessed on 15 November 2019).
  4. Sambo, A. Strategic developments in renewable energy in Nigeria. Int. Assoc. Energy Econ. 2009, 16, 15–19. [Google Scholar]
  5. Shaaban, M.; Petinrin, J.O. Renewable energy potentials in Nigeria: Meeting rural energy needs. Renew. Sustain. Energy Rev. 2014, 29, 72–84. [Google Scholar] [CrossRef]
  6. United Nations Framework Convention on Climate Change Kyoto Protocol. Available online: https://unfccc.int/kyoto_protocol (accessed on 15 November 2019).
  7. The Worldbank Sustainable Energy for All (SE4ALL). Available online: https://data.worldbank.org/indicator/eg.fec.rnew.zs (accessed on 15 November 2019).
  8. Rezzouk, H.; Mellit, A. Feasibility study and sensitivity analysis of a stand-alone photovoltaic-diesel-battery hybrid energy system in the north of Algeria. Renew. Sustain. Energy Rev. 2015, 43, 1134–1150. [Google Scholar] [CrossRef]
  9. Oyedepo, S.O. Energy and sustainable development in Nigeria: The way forward. Energy Sustain. Soc. 2012, 2, 1–17. [Google Scholar] [CrossRef] [Green Version]
  10. Shaahid, S.M.; El-Amin, I. Techno-economic evaluation of off-grid hybrid photovoltaic-diesel-battery power systems for rural electrification in Saudi Arabia-A way forward for sustainable development. Renew. Sustain. Energy Rev. 2009, 13, 625–633. [Google Scholar] [CrossRef]
  11. Mandal, S.; Das, B.K.; Hoque, N. Optimum sizing of a stand-alone hybrid energy system for rural electrification in Bangladesh. J. Clean. Prod. 2018, 200, 12–27. [Google Scholar] [CrossRef]
  12. Aziz, A.S.; Tajuddin, M.F.N.; Adzman, M.R.; Azmi, A.; Ramli, M.A.M. Optimization and sensitivity analysis of standalone hybrid energy systems for rural electrification: A case study of Iraq. Renew. Energy 2019, 138, 775–792. [Google Scholar] [CrossRef]
  13. Das, H.S.; Yatim, A.H.M.; Tan, C.W.; Lau, K.Y. Proposition of a PV/tidal powered micro-hydro and diesel hybrid system: A southern Bangladesh focus. Renew. Sustain. Energy Rev. 2016, 53, 1137–1148. [Google Scholar] [CrossRef]
  14. Imam, A.A.; Al-turki, Y.A.; Kumar, R.S. Techno-economic feasibility assessment of grid-connected PV systems for residential buildings in Saudi Arabia—A Case Study. Sustainability 2020, 12, 262. [Google Scholar] [CrossRef] [Green Version]
  15. Aderemi, B.A.; Daniel Chowdhury, S.P.; Olwal, T.O.; Abu-Mahfouz, A.M. Techno-economic feasibility of hybrid solar photovoltaic and battery energy storage power system for a mobile cellular base station in Soshanguve, South Africa. Energies 2018, 11, 1572. [Google Scholar] [CrossRef] [Green Version]
  16. El-houari, H.; Allouhi, A.; Rehman, S.; Buker, M.S. Design, simulation, and economic optimization of an off-grid photovoltaic system for rural electrification. Energies 2019, 12, 4735. [Google Scholar] [CrossRef] [Green Version]
  17. IRENA. Renewable Power Generation Costs in 2018; International Renewable Energy Agency: Masdar City, Abu Dhabi, UAE, 2019.
  18. Masson, G.; Kaizuka, I.; Nowak, S.; Brunisholz, M.; Serra, G.; Cambiè, C.; Neubourg, G. Trends 2018 in Photovoltaics Applications; Survey Report of Selected IEA Countries between 1992 and 2017; International Energy Agency: St. Ursen, Switzerland, 2018; pp. 43–49. ISBN 9783906042794.
  19. Abdilahi, A.M.; Mohd Yatim, A.H.; Mustafa, M.W.; Khalaf, O.T.; Shumran, A.F.; Mohamed Nor, F. Feasibility study of renewable energy-based microgrid system in Somaliland’s urban centers. Renew. Sustain. Energy Rev. 2014, 40, 1048–1059. [Google Scholar] [CrossRef]
  20. Okoye, C.O.; Oranekwu-Okoye, B.C. Economic feasibility of solar PV system for rural electrification in Sub-Sahara Africa. Renew. Sustain. Energy Rev. 2018, 82, 2537–2547. [Google Scholar] [CrossRef]
  21. Lamidi, R.O.; Jiang, L.; Wang, Y.; Pathare, P.B.; Aguilar, M.C.; Wang, R.; Eshoul, N.M.; Roskilly, A.P. Techno-economic analysis of a cogeneration system for post-harvest loss reduction: A case study in sub-Saharan rural community. Energies 2019, 12, 872. [Google Scholar] [CrossRef] [Green Version]
  22. Bhandari, B.; Lee, K.T.; Lee, C.S.; Song, C.K.; Maskey, R.K.; Ahn, S.H. A novel off-grid hybrid power system comprised of solar photovoltaic, wind, and hydro energy sources. Appl. Energy 2014, 133, 236–242. [Google Scholar] [CrossRef]
  23. Ramli, M.A.M.; Hiendro, A.; Al-Turki, Y.A. Techno-economic energy analysis of wind/solar hybrid system: Case study for western coastal area of Saudi Arabia. Renew. Energy 2016, 91, 374–385. [Google Scholar] [CrossRef]
  24. Sofimieari, I.; Wazir, M.; Mustafa, B.; Obite, F. Modelling and analysis of a PV/wind/diesel hybrid standalone microgrid for rural electrification in Nigeria. Bull. Electr. Eng. Inform. 2019, 8, 1468–1477. [Google Scholar] [CrossRef]
  25. Salisu, S.; Wazir, M.; Olatomiwa, L. Assessment of technical and economic feasibility for a hybrid PV-wind-diesel-battery energy system in a remote community of north central Nigeria. Alex. Eng. J. 2019, 58, 1103–1118. [Google Scholar] [CrossRef]
  26. Kolhe, M.L.; Ranaweera, K.M.I.U.; Gunawardana, A.G.B.S. Techno-economic sizing of off-grid hybrid renewable energy system for rural electrification in Sri Lanka. Sustain. Energy Technol. Assess. 2015, 11, 53–64. [Google Scholar] [CrossRef]
  27. Adaramola, M.S.; Paul, S.S.; Oyewola, O.M. Assessment of decentralized hybrid PV solar-diesel power system for applications in northern part of Nigeria. Energy Sustain. Dev. 2014, 19, 72–82. [Google Scholar] [CrossRef]
  28. Olatomiwa, L. Optimal configuration assessments of hybrid renewable power supply for rural healthcare facilities. Energy Rep. 2016, 2, 141–146. [Google Scholar] [CrossRef] [Green Version]
  29. Oladigbolu, J.O. Optimal Configuration and Economic Assessment of a Hybrid PV/diesel Energy System for Remote Rural healthcare load: An Approach towards Rural Development. Int. J. Sci. Eng. Res. 2019, 10, 1309–1313. [Google Scholar]
  30. Akinyele, D. Analysis of photovoltaic mini-grid systems for remote locations: A techno-economic approach. Int. J. Energy Res. 2018, 42, 1363–1380. [Google Scholar] [CrossRef]
  31. Brimmo, A.T.; Sodiq, A.; Sofela, S.; Kolo, I. Sustainable energy development in Nigeria: Wind, hydropower, geothermal and nuclear. Renew. Sustain. Energy Rev. 2017, 74, 474–490. [Google Scholar] [CrossRef]
  32. Iea Nigeria Renewable Energy Master Plan. Available online: https://www.iea.org (accessed on 16 November 2019).
  33. Uhunmwangho, R.; Odje, M.; Okedu, K.E. Comparative analysis of mini hydro turbines for Bumaji Stream, Boki, Cross River State, Nigeria. Sustain. Energy Technol. Assess. 2018, 27, 102–108. [Google Scholar] [CrossRef]
  34. Lawrence, O. The effects of global warming and climate variability on water resources development: A case study of Otamiri-Njaba River Basin of Imo State, Nigeria. Int. J. Res. Stud. Sci. Eng. Technol. 2017, 4, 22–31. [Google Scholar]
  35. Ohunakin, O.S.; Adaramola, M.S.; Oyewola, O.M.; Fagbenle, R.O. Solar energy applications and development in Nigeria: Drivers and barriers. Renew. Sustain. Energy Rev. 2014, 32, 294–301. [Google Scholar] [CrossRef]
  36. Shaahid, S.M.Ã.; Elhadidy, M.A. Economic analysis of hybrid photovoltaic–diesel–battery power systems for residential loads in hot regions—A step to clean future. Renew. Sustain. Energy Rev. 2008, 12, 488–503. [Google Scholar] [CrossRef]
  37. Ita, E.O. Aquatic Plants and Wetland Wildlife Resources of Nigeria. Available online: http://www.fao.org/3/t3660e/t3660e01.htm (accessed on 20 January 2020).
  38. Salisu, S.; Sadiq, B.O.; Abubakar, A.S.; Jibril, Y.; Garba, S. Solar Energy Efficient Building: A Feasibility Study in Sokoto State of Nigeria. Int. J. Sci. Eng. Res. 2014, 670. [Google Scholar]
  39. Nigeria Electricity System Operator. Available online: https://nsong.org/AboutUs/Locations.aspx (accessed on 19 January 2020).
  40. Olatomiwa, L.; Blanchard, R.; Mekhilef, S.; Akinyele, D. Hybrid renewable energy supply for rural healthcare facilities: An approach to quality healthcare delivery. Sustain. Energy Technol. Assess. 2018, 30, 121–138. [Google Scholar] [CrossRef] [Green Version]
  41. Ihiagwa, Moke Village Nigeria. Available online: https://en.wikipedia.org/wiki/Ihiagwa (accessed on 19 January 2020).
  42. Oviroh, P.O.; Jen, T. The energy cost analysis of hybrid systems and diesel generators in powering selected base transceiver station locations in Nigeria. Energies 2018, 11, 687. [Google Scholar] [CrossRef] [Green Version]
  43. Oladigbolu, J.O.; Ramli, M.A.M.; Al-turki, Y.A. Techno-economic and sensitivity analyses for an optimal hybrid power system which is adaptable and effective for rural electrification: A case study of Nigeria. Sustainability 2019, 11, 4959. [Google Scholar] [CrossRef] [Green Version]
  44. Obi, L.; Law-Obi, F. Small hydropower development: Key for sustainable rural electric power generation in Imo State of Nigeria. Int. J. Adv. Res. Sci. Technol. 2016, 3, 1275–1284. [Google Scholar]
  45. NASA/SSE. Surface Meteorology and Solar Energy. Available online: https://power.larc.nasa.gov/ (accessed on 16 October 2019).
  46. Ogueke, N.V.; Ikpamezie, I.I.; Anyanwu, E.E. The potential of a small hydro/photovoltaic hybrid system for electricity generation in FUTO, Nigeria. Int. J. Ambient Energy 2016, 37, 256–265. [Google Scholar] [CrossRef]
  47. Givler, T.; Lilienthal, P. Using HOMER Software, NREL’s Micropower Optimization Model, to Explore the Role of Gen-Sets in Small Solar Power Systems; Case Study: Sri Lanka; National Renewable Energy Lab.: Golden, CO, USA, 2005; Volume 3.
  48. HOMER Energy. HOMER Pro Version 3.7 User Manual; HOMER Energy: Boulder, CO, USA, 2016; Volume 7. [Google Scholar]
  49. Gilman, P.; Lilienthal, P. Micropower System Modeling with Homer. In Integration of Alternative Sources of Energy; Felix, A., Farret, M., Godoy, S., Eds.; John Wiley & Sons, Inc.: Hoboken, NJ, USA, 2006; pp. 379–418. [Google Scholar]
  50. Global Petrol Prices. Available online: https://www.globalpetrolprices.com/Nigeria/diesel_prices/ (accessed on 23 May 2020).
  51. Oladigbolu, J.O. Economic evaluation and determination of optimal hybrid energy supply systems for residential and healthcare facilities in rural and urban areas. King Abdulaziz Univ. Sci. Publ. Cent. 2020, 1–99. [Google Scholar]
  52. Ngan, M.S.; Tan, C.W. Assessment of economic viability for PV/wind/diesel hybrid energy system in southern Peninsular Malaysia. Renew. Sustain. Energy Rev. 2012, 16, 634–647. [Google Scholar] [CrossRef]
Figure 1. Map of Nigeria. (a) Hydrological river basins; (b) Solar radiation and solar electricity potential. Reproduced from references [37,38].
Electronics 09 01491 g001
Figure 2. Schematic diagram of the proposed photovoltaic (PV)/hydro/diesel/battery hybrid energy system (HES).
Electronics 09 01491 g002
Figure 3. Load profile of Mboke village. (a) Hourly load profile; (b) Yearly load profile.
Electronics 09 01491 g003
Figure 4. Monthly average solar irradiation for the village of Mboke.
Electronics 09 01491 g004
Figure 5. Monthly average ambient temperature for the village of Mboke.
Electronics 09 01491 g005
Figure 6. Monthly average water discharge [46].
Electronics 09 01491 g006
Figure 7. Moody diagram showing friction factor and relative pipe roughness for different flow regimes [48].
Electronics 09 01491 g007
Figure 8. Hybrid system economic evaluation flowchart.
Electronics 09 01491 g008
Figure 9. Monthly electric power production.
Electronics 09 01491 g009
Figure 10. Monthly average fuel consumption of a 100 kW diesel generator (DG).
Electronics 09 01491 g010
Figure 11. Cash flow summary of PV/hydro/diesel/battery scheme.
Electronics 09 01491 g011
Figure 12. Effect of increasing interest rate on the operating cost, net present cost (NPC), and cost of energy (COE).
Electronics 09 01491 g012
Figure 13. Effect of global solar irradiation (GSI) on the NPC, COE, and operating cost of the HES.
Electronics 09 01491 g013
Figure 14. Impact of water streamflow (WSF) on the NPC, COE, and operating cost of the HES.
Electronics 09 01491 g014
Figure 15. Impact of GSI on the renewable fraction and annual fuel consumption.
Electronics 09 01491 g015
Figure 16. Effect of WSF on the renewable fraction and annual fuel consumption.
Electronics 09 01491 g016
Figure 17. Impact of increasing the maximum annual capacity shortage on the NPC and COE of the system.
Electronics 09 01491 g017
Figure 18. Effect of increasing the maximum annual capacity shortage on the operating cost and unserved electric load.
Electronics 09 01491 g018
Figure 19. Impact of the battery minimum state of charge (SOCmin) on the system total NPC and COE.
Electronics 09 01491 g019
Figure 20. Effect of battery SOCmin on the operating cost and fuel consumption rate of the HES.
Electronics 09 01491 g020
Table 1. System component specifications and costs.
Component Parameters/ReferenceSpecification
1. PV panel [12,40]
Efficiency at the standard test condition13%
Temperature coefficient−0.48%/°C
Initial cost$3200/kW
Cost of replacement$3000/kW
Operating and maintenance cost$5/kW/year
2. Hydropower system [12]
Initial cost$1700/kW
Cost of replacement$500/kW
Operating and maintenance cost$100/year
Efficiency75%
3. Battery [43]
ModelSurrette 6CS25P
Nominal voltage6 V
Nominal capacity6.94 kWh
Initial cost$1100
Cost of replacement$1100
Operating and maintenance cost$10/year
4. Converter [40]
Capital cost$245/kW
Cost of replacement$245/kW
Operating and maintenance cost$10/year
Efficiency90%
5. Diesel generator [40]
Initial cost$200/kW
Cost of replacement$200/kW
Maintenance cost$0.05/kW/h
Minimum load ratio25%
Table 2. Categorized optimization results summary of the system configurations.
PV (kW)DG (kW)BatteryHydro (kW)Converter (kW)DSNPC ($)COE ($/kWh)Operating Cost ($/year)Renewable Fraction (%)Diesel (L)Average Generator Hours (h/yr)
501001694.150CC963,4310.11283,66777.276,4924705
200-37694.1200LF2.17 M0.254127,674100--
5022048-100CC2.60 M0.301327,3961.25326,0737577
50250--50LF2.70 M0.312348,9701.30334,2008760
Table 3. Pollutant emissions produced by the optimal hybrid system and PV/diesel system (worst case).
PollutantProposed PV/Hydro/Diesel/Battery System (kg/year)PV/Diesel System (kg/year)
Carbon dioxide200,247874,890
Carbon monoxide12505461
Unburned hydrocarbons55.1241
Particulate matter7.5032.8
Sulfur dioxide4902142
Nitrogen oxides11755133

