1. Introduction
Conventional electrical grids are defined as centralized power plants supplying energy to customers or consumers. Classically, loads were distributed at the customer’s facilities without much management and monitoring of the electricity consumption. In addition, there is an increasing demand for the construction of expansive electricity infrastructure throughout the world to maintain economic development. Thanks to the advances of technology, the administration and control of equipment and loads have been developed. These equipment and loads are either configured to run on schedules or monitor specific parameters. Currently, the integration of communications and information systems into the traditional electric power grids facilitate a new and smart power system. This modern power grid is called a smart grid—a comprehensive phrase that encompasses the application of secure, two-way communication, and information technology to electrical power grids. There are various smart grid definitions. However, the most accepted one is the interoperability of power, communication, and information technologies to enhance electric power infrastructure serving loads and ensure the development of end-use applications.
According to the US Department of Homeland Security (DHS) [
1], a smart grid is defined as a “special” critical infrastructure supporting essential services to sustain society since it is necessary to many of the 18 critical infrastructures. In 2016, the Japanese Cabinet adopted its “Society 5.0” vision [
2] to create new strategies for economic and social development. The program represents the vision of a super-intelligent society that will contribute to better quality of life and address social problems in the world. Consequently, smart grids are defined as one of the key components that support Society 5.0.
It is clear that cyber attacks on the smart grid system may have devastating consequences for our daily lives, leading to critical infrastructure breakdown and economic disruption. As a result, smart grid systems must be protected from a growing range of cyber attacks. Unfortunately, their flexibility and expanded capabilities create more sophisticated cybersecurity issues. The introduction of new smart grid technologies and applications, including IoT devices, smart appliances, customer energy management systems, and smart meters, will lead to unpredictable new privacy threats and problems. With a complicated system that integrates power generation, transmission, and distribution, protection responsibility spreads beyond the typical walls of the datacenter. For example, an attacker can, either intentionally or unintentionally, energize a power line to threaten lives. A power line may also be de-energized to disrupt the transmission and control systems, which negatively impacts the safety of employees and the community.
In recent years, there have been numerous cyber attacks against smart grid systems. The US Industrial Control Systems Cyber Emergency Response Team (ICS-CERT) stated that nearly one-third of reported incidents in 2014 were in the energy sector [
3]. In 2007, the Iranian nuclear power station attack slowed down the country’s vital nuclear power development [
4]. This attack was made using Stuxnet, an authoritative and structured virus, which was developed to infiltrate the programmable industrial system. The operation of a large part of the uranium enrichment cycle could also have been slowed down and completely blocked. By 2014, a sophisticated hacker team called Dragonfly had attacked more than 1000 energy companies [
5]. The group successfully broke into the core systems that control the energy firms in North America and Europe. Mainly through malware in emails, websites, and third-party programs, Dragonfly obtained access to the control systems of power plants. The attackers’ goal was cyber espionage, but the interference was fortunately detected before Dragonfly could harm or disrupt energy supplies in affected areas. During the Ukrainian civil war in Donbass, on 25 December 2015, a cyber attack on the electrical power station in Ivano-Frankivsk, Ukraine, forced 80,000 people into the dark [
6]. This attack was inflicted by using spear-phishing and a BlackEnergy trojan horse. Developed by a hostile state, BlackEnergy can delete data, destroy hard disks, and control infected computers. Further, after attacking the utility equipment, a coordinated denial-of-service attack was conducted on the phone numbers of companies running the power station. As a result, users could not get support to inform the companies about the collapse. The DHS reported that 2017 saw an increase in cyber attacks, which expanded even more in 2018, from infiltration into the US electricity network to over 4300 French network cyber attacks. Indeed, these occurrences are evidence that these attacks can happen and their real-life repercussions exist. This initiated a period of extreme cyber attacks that extended beyond isolated viruses and hacker groups of extremists. Governments and coordinated groups can also be responsible for attacks on smart grid systems, which may result in blackouts and even the destruction of equipment.
IT experts, cybersecurity professionals, and even end-users must acquire all the practical knowledge and skills to prevent and handle these security incidents adequately. However, topics related to automation (for the integration of renewables), as well as ICT (computer networks/protocols, cybersecurity) and other physical domains, are usually not fully covered by traditional training and education approaches. These experiences can only be gained from hands-on learning, for example, via smart grid attack co-simulations. Co-simulation is the coordinated execution of at least two simulation models, depending on their interface and runtime. Furthermore, it is a complicated network and a power grid integrated system. Thus, co-simulation technology is proposed as an emerging enabling technique to tackle these complexities. Despite the increasing concern about the advantages and scientific difficulties of smart grid vulnerability analysis, to the best of our knowledge, research in this area has been limited and the field has not been fully explored. There has been little effort to investigate attack simulations and to evaluate their impacts on the infrastructure. Therefore, it is essential to develop a new framework to support smart grid attack co-simulation.
In this context, we propose a novel co-simulation framework called GridAttackSim to enable the simulation of smart grid infrastructure characteristics, and to simulate various cybersecurity attacks and evaluate their consequences. Our methodology, which uses the combination of the tools Framework for Network Co-Simulation (FNCS), GridLab-D, and ns-3, is illustrated in this paper.
The main contributions of this research are:
We first conducted a comprehensive study of the existing research on smart grid attack co-simulation.
We proposed GridAttackSim, the co-simulation framework that facilitates the simulation of the various customized smart grid system topologies that involve both power grid and network components.
Our simulator not only features a set of built-in attack profiles but also allows researchers and energy companies interested in enhancing smart grid security to develop new ones.
By providing a friendly GUI, the users can execute the simulation without the need for programming knowledge.
The simulation results can be compared and visualized, which makes it easy to recognize the behavior, impacts, and consequences of the attacks.
A case study using the simple test feeder and IEEE 13 node was conducted to validate the proposed framework.
The proposed framework can potentially be deployed in cybersecurity training for IT experts, cyber-security professionals, and even advanced/interested end-users.
The remainder of this paper is organized as follows.
Section 2 provides some background on smart grid attack co-simulation and related work.
Section 3 discusses in detail our proposed co-simulation architecture, including the processing module, attack pattern library, GriLAB-D, ns-3, FNCS broker, and model manager. The framework implementation is provided in
Section 4. In
Section 5, we discuss the selected attack co-simulation results. The contributions of this research are discussed in
Section 6. Conclusions are finally drawn in
Section 7.
2. Background and Related Work
Co-simulation is characterized as the integration of at least two simulation models that differ in representation and runtime. It is an effective way of capturing the interaction and the mutual effects between a power grid and a communication component. Various extensive research efforts have been made in smart grid modeling and simulation, as well as the definition of attack patterns. However, these factors are often handled separately. Our previous study [
7] provides a complete overview of the latest co-simulation tools and their functionalities for smart grid investigation. The research determined that the combination of GridLAB-D, FCNS, and ns-3 is a promising direction for smart grid study. To validate that the combination can simulate the security threats on the smart grid system, two simple case studies were conducted with the IEEE 13 node test feeder model only. There are limitations to the number of supported smart grid models (one smart grid model), attack types (two attack types), and result visualization functions. The design of the framework, GUI, and the attack schedule function were not included. Therefore, the study can be considered as a preliminary step for our current research. This paper is a substantial extension of our previous research in order to address the aforementioned limitations.
The electric power and communication synchronizing simulator (EPOCHS) [
8] was one of the first co-simulation frameworks for the smart grid. EPOCHS consists of ns-2, an open-source network simulator, and PSLF, a commercial electric simulator. EPOCHS was designed to study the influences of communication networks on electromechanical conditions. The significant applications of this partial open-source project comprise management, security, and wide-area monitoring. Unfortunately, EPOCHS does not support cybersecurity attack simulation.
SGsim [
9] is a simulation framework for real-time simulations of diverse smart grid applications. This open-source framework is built on top of OpenDSS as a power simulation and OMNET++ as the backend for communication, respectively. Moreover, the simulation framework supports the standard smart grid tools, for instance, openPDC and smart grid communication-related standards, including IEEE C37.118. The goal of SGsim is to evaluate the impact of communications on control actions. In the smart grid research community, SGsim has been widely respected. However, the case studies, components, and supported standards are still limited. Similarly to EPOCHS, the cybersecurity attack simulation function is not supported.
TASSCS [
10] aims to promote cyber-attack detection and recovery technique experimentation and evaluation research in SCADA-based control systems.Several simulation technologies, including PowerWorld simulation, OPNET emulation, and hardware, were integrated as the components of TASSCS. Modbus, a type of SCADA system architecture and communications protocol, provides a simulation-based control system. The results demonstrate how ASPS can be applied to identify and mitigate the consequences of compromised HMI and DoS attacks.
SCADASim [
11] is a SCADA simulation that enables external applications and devices to be integrated. Although the tool is virtual, it can measure the impacts of attacks on real devices and applications. Four categories of attacks on a smart grid system, including DDos, eavesdropping, man-in-the-middle, and spoofing, can be simulated. SCADASim is based on the discrete OMNET++ event simulation engine and includes modules that communicate with each other by passing a message. OMNET++ allows external applications such as shared libraries and sockets, and source code to be integrated into SCADASim.
NeSSi2 [
12] is a framework for network simulation developed on a JIAC service agent interface. NeSSi2 focuses on security scenarios, such as attack analysis and countermeasure evaluation. The research in [
13] developed the safety model of NeSSi2 and illustrated the consequences of attacks on the advanced metering infrastructures (AMIs) network. An open ring topology, typically used in large German cities, is specified for the communication and the energy networks. However, NeSSi2 can only simulate and evaluate the consequences of DDoS attacks on critical infrastructure.
ASTORIA [
14] is an attack simulation and evaluation framework for the smart grid framework. At the core of ASTORIA, PY-POWER and ns-3 were applied as the power flow and network simulator, respectively. Mosaik was implemented as a broker to enable the integration between ns-3 and PY-POWER. ASTORIA allows attacks to be injected and their impacts to be evaluated through a simulated environment. The attack profiles, which consist of generic formatted configuration files, instantiate these attacks. These attack profiles allow the configurations of several attack parameters, for instance, attack type, attack schedule, frequency/intensity, and source and target components. Two familiar SCADA cyber-attacks, DoS attack and malicious software infection, were simulated. However, the research does not define specific metrics for security evaluation. It only demonstrates the system vulnerabilities by showing sampled data.
Although these simulation techniques can perform both power grid and communication network simulations, they are typically used in small networks with a limited scope. The simulation approaches are primarily developed for specific circumstances, which are hard to extend. Additionally, the implementation and use of current co-simulation frameworks are quite complicated. IT experts, IT managers, and the end-users need to implement proprietary software or create a network model in an unfamiliar environment. There are a lack of studies focused on cybersecurity attack simulations. The ability to schedule an attack in the co-simulation tool is omitted. Additionally, most of the current research supports only a few attack types.
The framework for network co-simulation (FNCS) [
15] is a high-performance computing (HPC) simulation platform. The broker manages the communication between the power grid simulator GridLAB-D and the network simulator ns-3. Indeed, it enables a synchronized simulation in configurable time steps. Our previous research [
7] indicated that the integration between GridLAB-D, ns-3, and FNCS is an encouraging solution for the study of smart grid cybersecurity, which can improve the speed of co-simulation by 20%. Unfortunately, few research efforts have been made to evaluate the implications of cyber attacks against the smart grid system by utilizing this combination. Therefore, this study was undertaken to fill the gap in FNCS’s current research by the framework with friendly GUI, robustness, and an extendable attack pattern library with an attack schedule, resulting in visualization.
Table 1 chronologically shows the majority of the various simulation systems that have been implemented in the energy domain in recent years.
3. GridAttackSim-Proposed Framework for Cyber Attack Simulation on Smart Grids
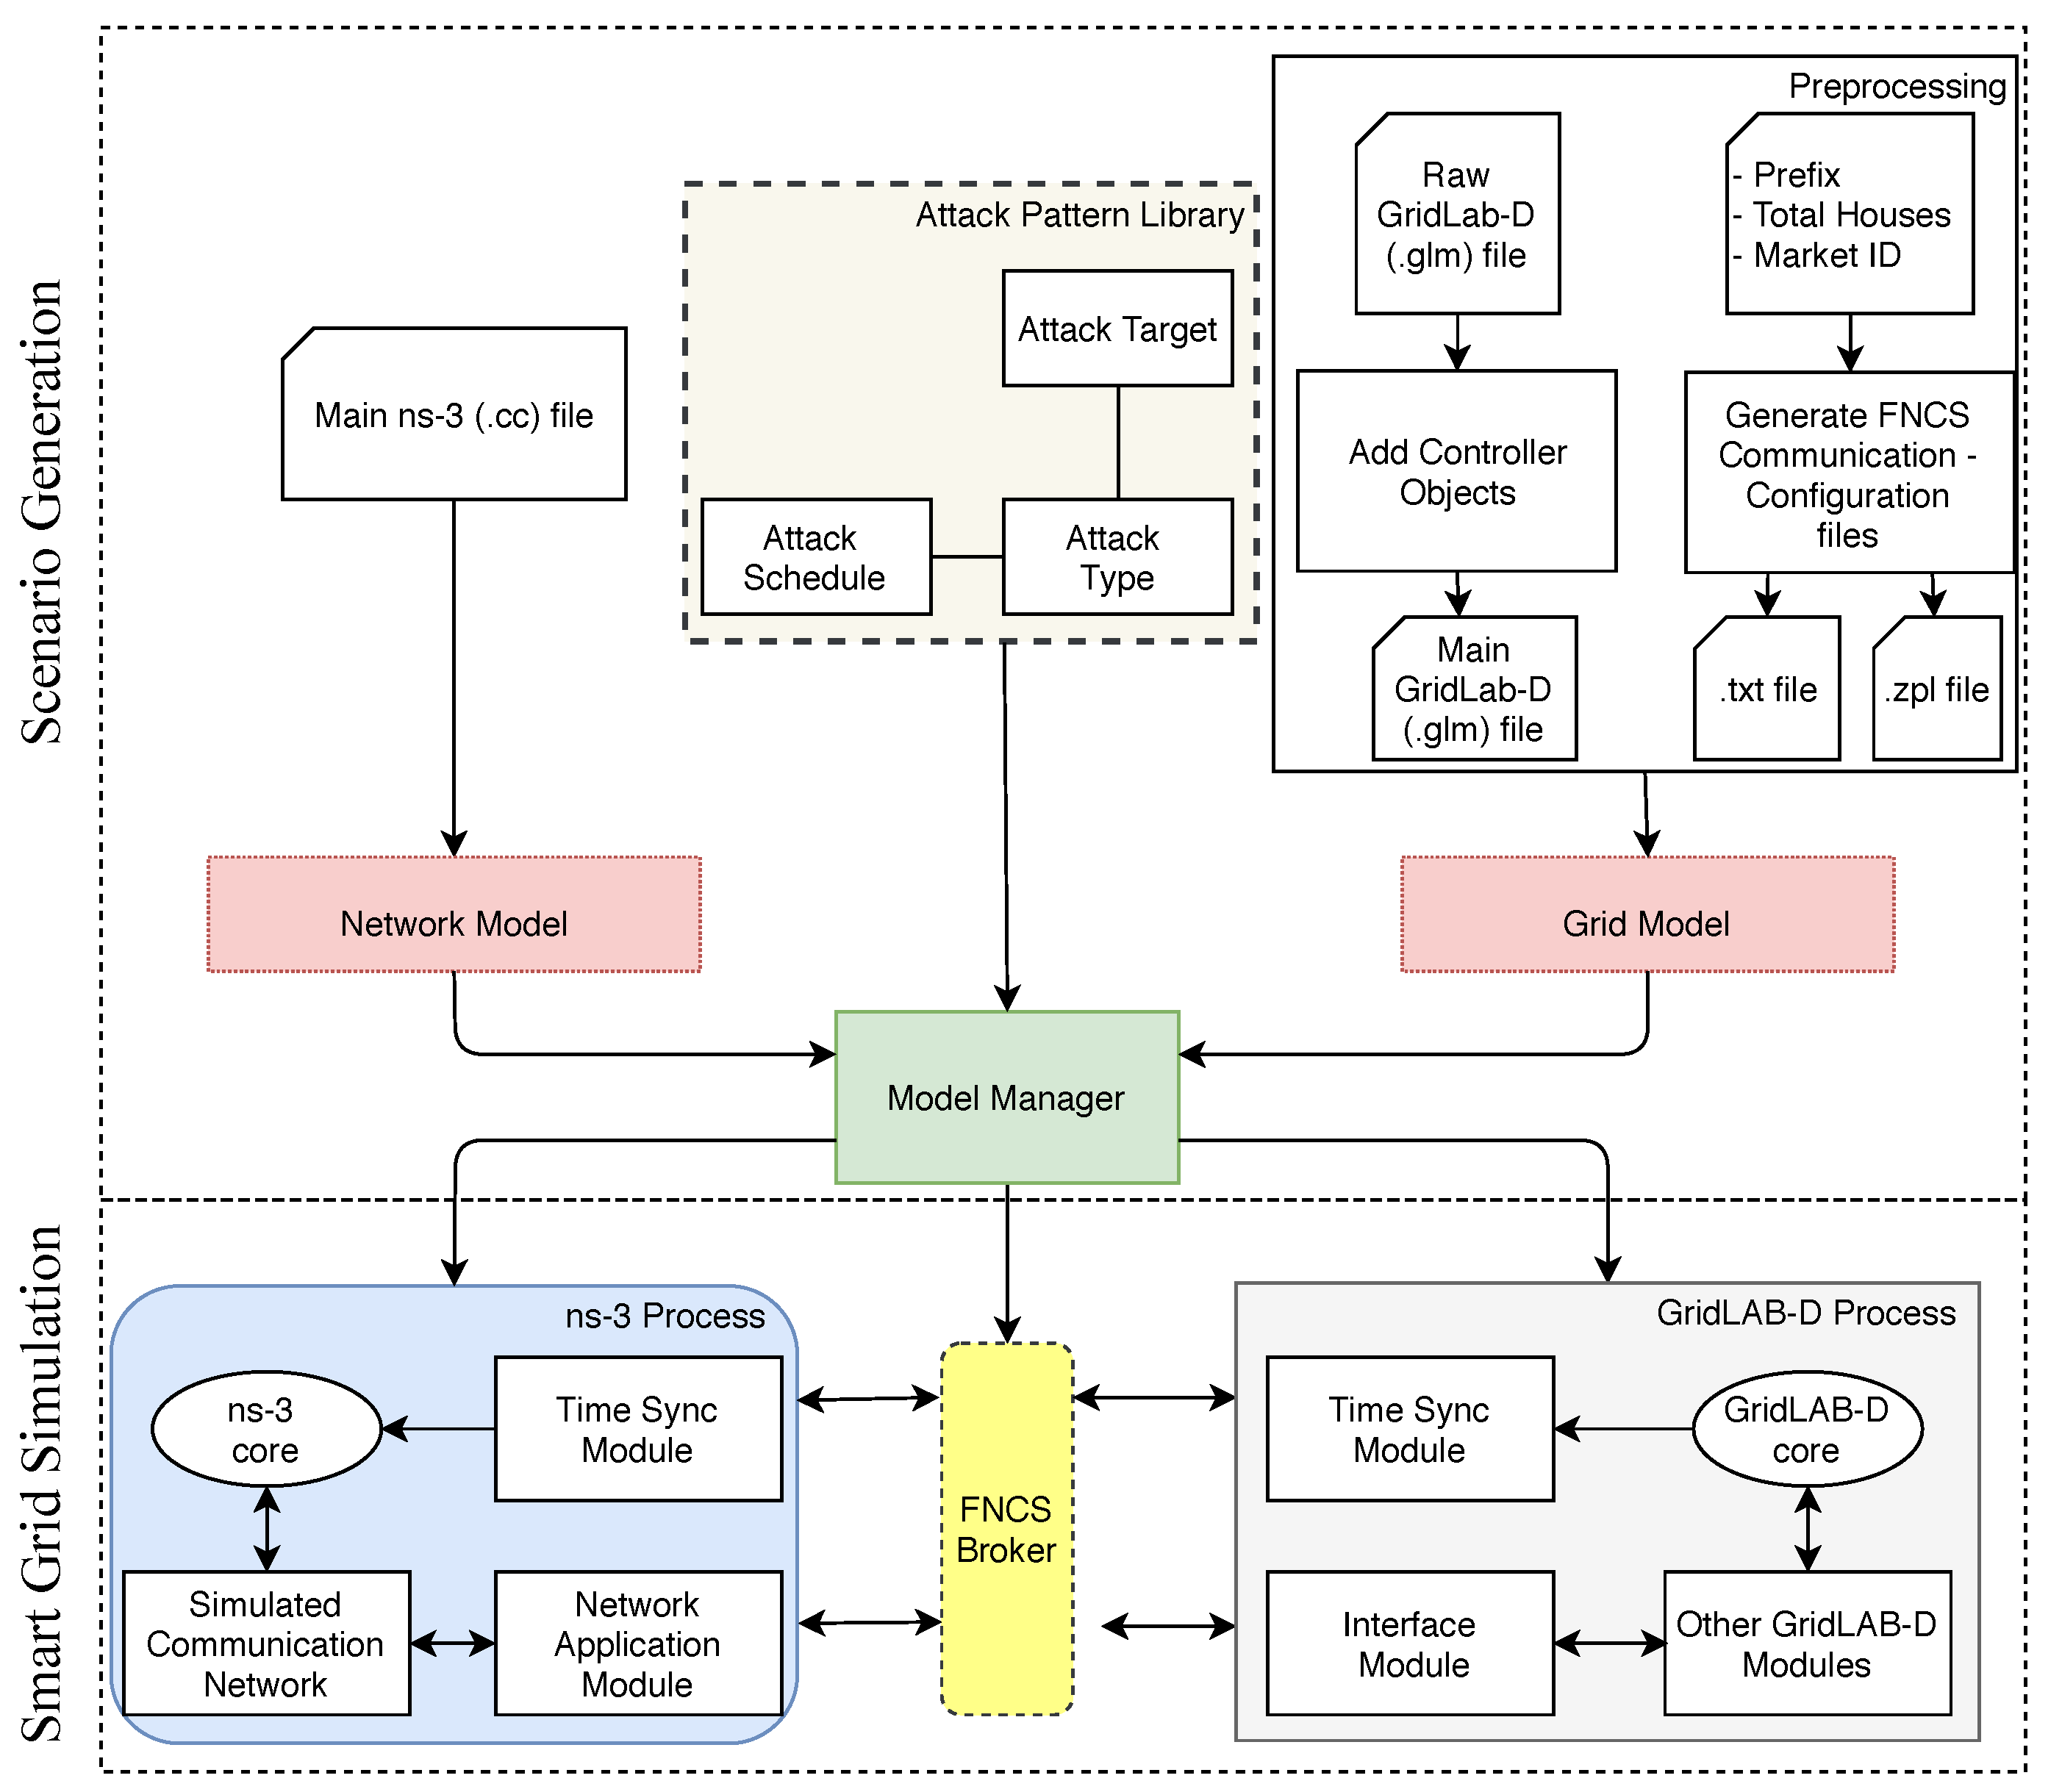
Based on a co-simulation approach where it is not only feasible to integrate the communication network and power grid but also to provide the ability to conduct various attack simulations, we propose the smart grid attack co-simulation framework or GridAttackSim, which is illustrated in
Figure 1. GridAttackSim is centered on six main components, namely, the preprocessing module, attack pattern library, GridLAB-D, ns-3, FNCS broker, and model manager.
3.1. Preprocessing Module
The preprocessing module consists of two components: GLM append and communication configuration files generation functions. It aims to prepare the environment and configure the FNCS simulator properly to connect the FNCS broker applications. An appropriate configuration requires at least a global unique simulator term. Besides that, the simulator must specify the subscribed topics for the FNCS broker.
The input of GLM append is a raw IEEE test feeder file in GridLAB-D format (.glm), which was initially created by Pacific Northwest National Laboratory (PNNL), US Department of Energy. The GLM append function adds the auction object and fncs_msg object into the input file to configure the connection between FNCS broker and GridLAB-D process.
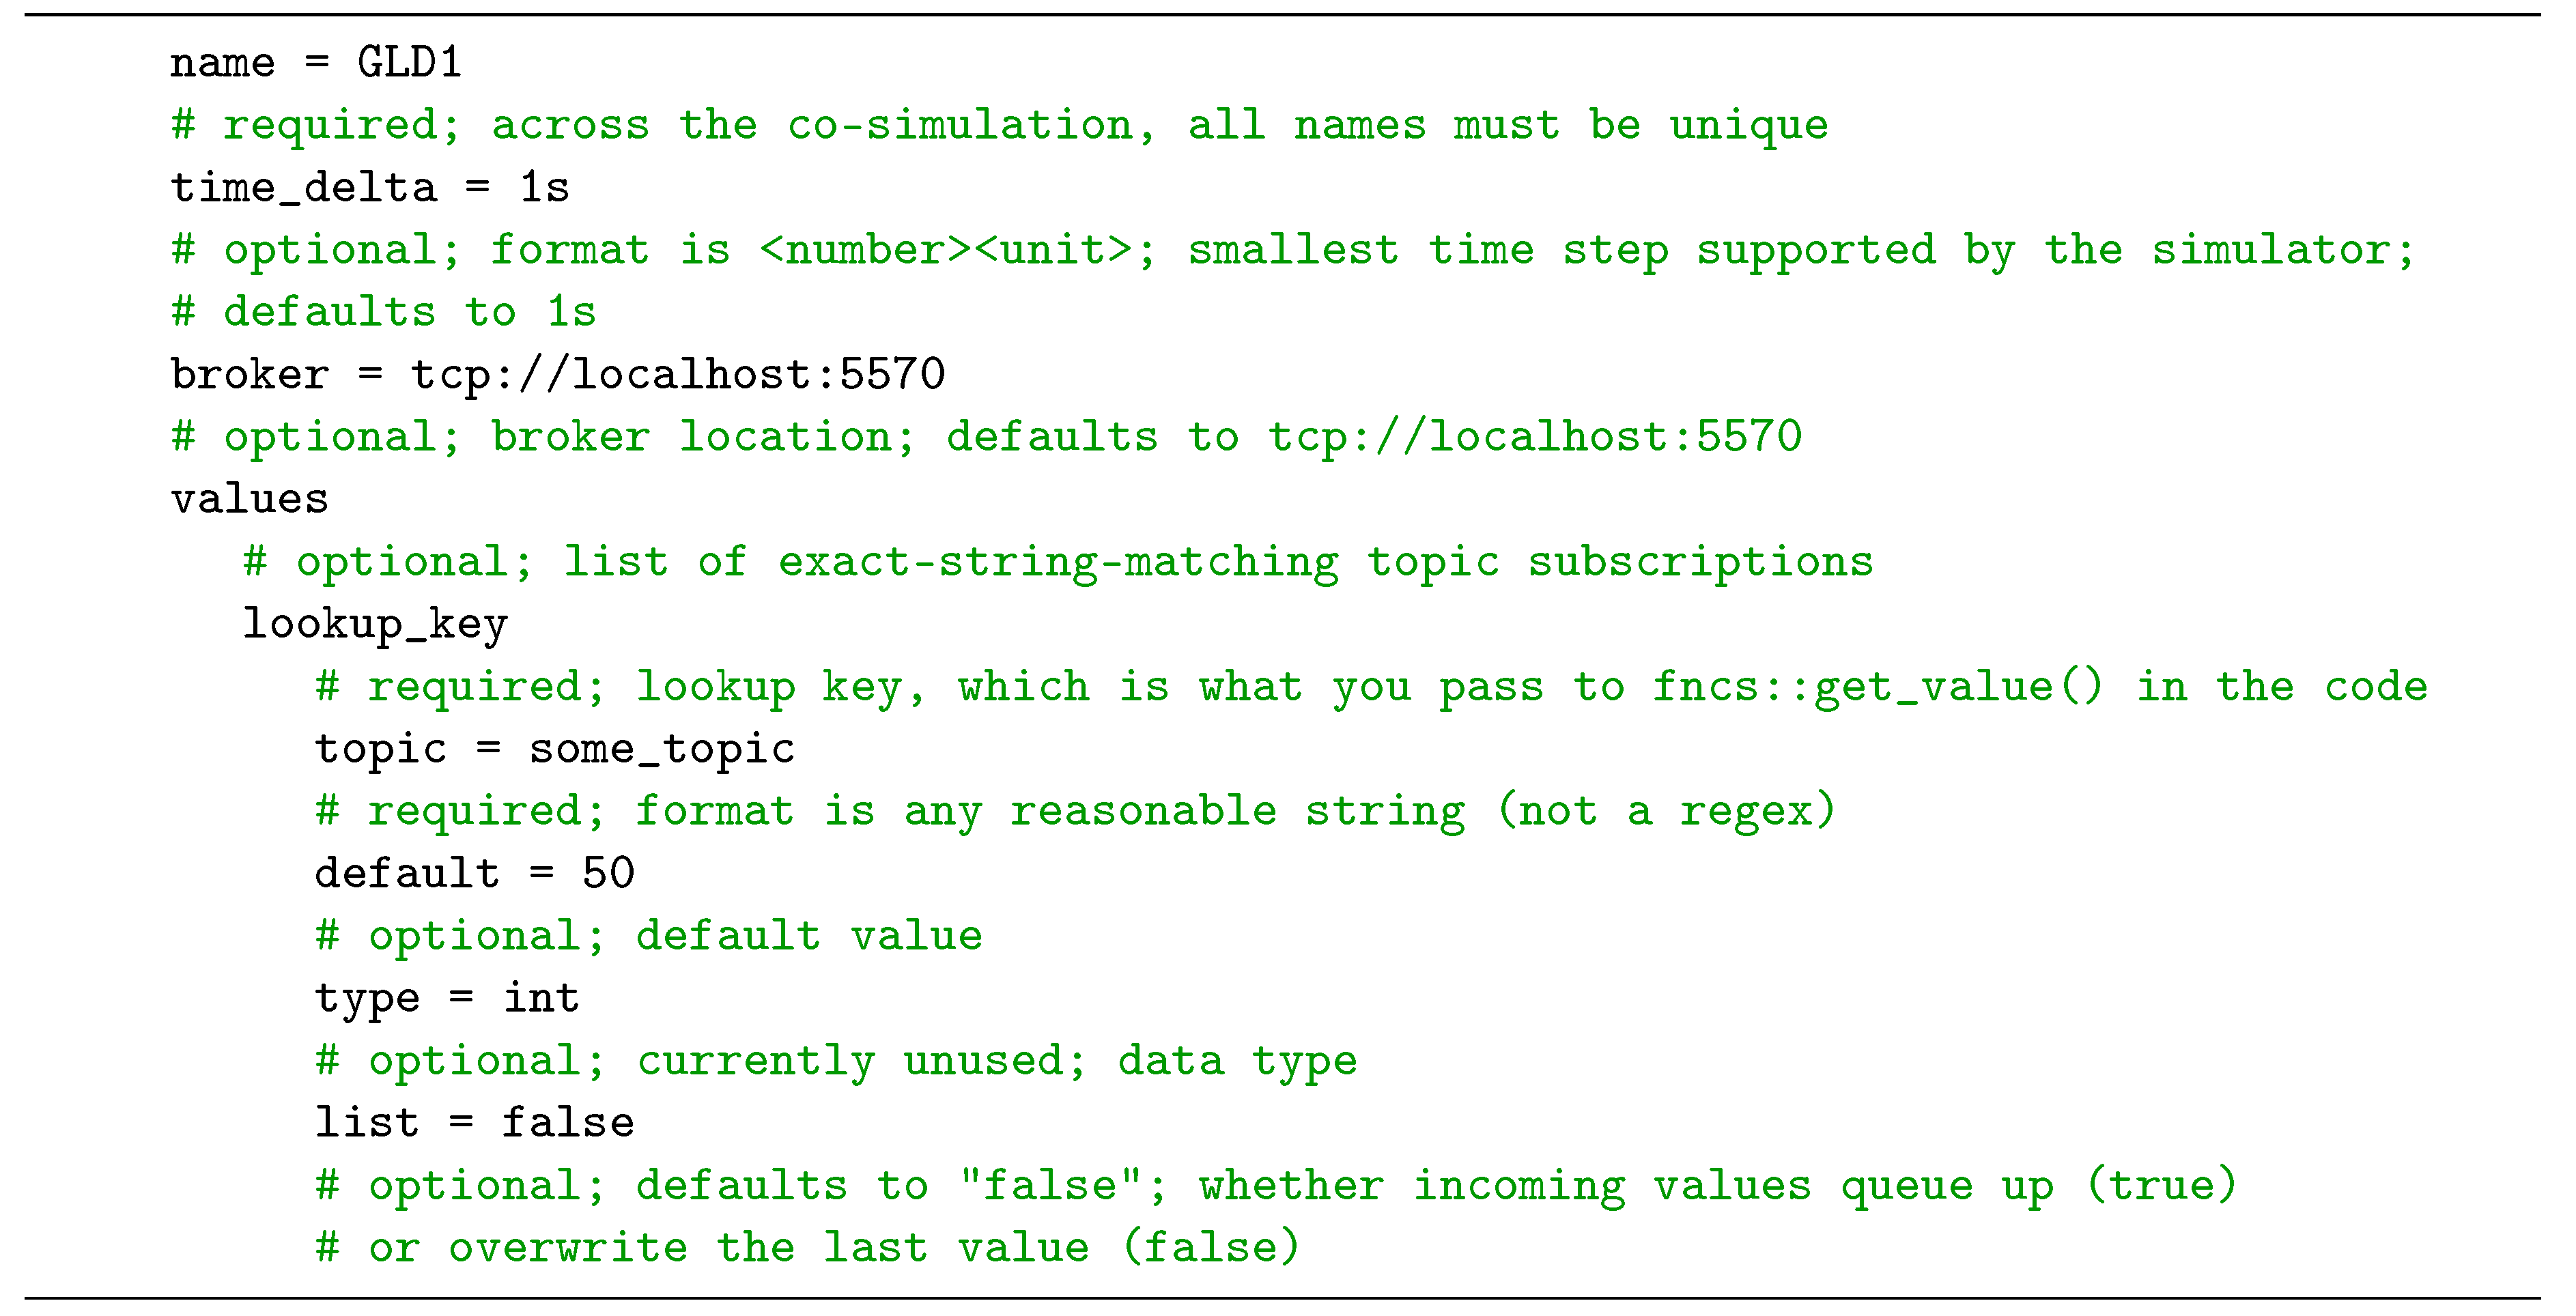
The communication configuration files generation function receives the market ID, the total number of houses, and the prefix of the controller inside each house as the input. The generated files are a .txt file and a .zpl file. The aim of the txt-formatted file is to configure the communication between the ns-3 process and the FNCS broker. The zpl-formatted file or FNCS ZPL (ZeroMQ Property Language) configure file, which is based on the ZPL (ZeroMQ Property Language) structure, configures the simulator to subscribe to the interesting topics, for example, market ID, submit bid state, market clearing price, average price, and the price’s standard deviation. A corresponding “fncs.zpl” file should be available for each simulator. By default, this fncs.zpl is supposed to be in the actual working directory that launches the simulator.
Figure 2 depicts an example of the fncs.zpl format.
3.2. Attack Pattern Library
The proposed framework allows attacks to be injected and their impact to be evaluated through a simulated environment. Through the attack pattern library, these attacks are instantiated. The attack pattern library is in charge of modeling the attacks on the smart grid system. It contains a standardized configuration JSON format file to allow the definition of different types of attack behavior. The setting of various attack parameters is enabled, including attack type, attack target components, and the start time and end time of an attack in the simulation. The structure of the attack pattern library is provided in
Table 2. Such a library allows reconfiguration at run-time to explore a wide range of attacks on the same smart grid architecture.
This is achieved by the combination of three sub-modules, namely, attack type, attack target, and attack schedule, which was introduced by research in [
16]. By developing such approaches, it is possible to model the behavior of an attack on the system, including what kind of attack can be carried out (what question), where the vulnerable parts are (where question), and when the attack happens (when question).
The attack type sub-module is employed to address the “what” question. It is utilized to characterize specific types and categories of attacks. Indeed, the sub-module is responsible for different types of malicious actions to be executed on the system.
When a particular type of attack is defined, the attack target needs to be specified. It is used to answer the "where" question. The sub-module sets the vulnerable parts of the smart grid system that are affected in a specific attack circumstance. The targets can be various, including communication networks, nodes, control systems, and end-point regularities.
The attack schedule sub-module describes the temporal occurrence of conducting a particular attack type. This sub-module aims to answer the "when" question. The schedule determines when to execute a certain type of attack.
3.3. GridLAB-D
Developed by PNNL, GridLAB-D [
17] is the pioneer of modern power distribution simulation systems. This open-source, time-series simulation can simulate all aspects of a power grid system from substation to end-use loads. There are four main components of a GridLAB-D process, including the GridLAB-D core, time sync module, interface module, and other modules. Consistently, the combination incorporates advanced simulation techniques and high-performance optimization methodologies to support sophisticated applications. There are various significant features of GridLAB-D. For instance, GridLAB-D end-use models, such as equipment, devices, and user models, are incorporated with the current agent-based simulation techniques. Besides, GridLAB-D is powered by distributed models of energy resources, namely, load shedding infrastructure and the distributed generator and storage models. Retail market modeling services are available, such as the selection of contracts, the simulation of businesses and transactions, and SCADA modeling and metering technologies. The tool has external links with various other tools, for example, Matlab, Microsoft Access, Microsoft Excel, MySQL, and text-based tools, along with distribution automation models, for instance, SynerGEE. Moreover, it can be associated with a variety of data management and analysis tools from third-party organizations. GridLAB-D has been validated by applying both current types of use simulation and standard distribution analysis methods. Thus, to service executives, regulators, particular stakeholders, and consumers, GridLAB-D is invaluable.
3.4. ns-3
ns-3 [
18] is a free, expandable network simulation framework for networking studies, simulation, and training. Introduced in 2008, ns-3 is a successor of ns-2, a powerful network simulator. ns-3 has commonly been used as the simulator specific for network systems. On the top of ns-3 architecture, a robust network model library is available, including protocols for multicasting, IP-based applications (TCP, UDP), routing, and wireless and wired networks. The four main components of ns-3 are available in an ns-3 process to support all other simulator elements, comprising a core, simulator, and common and node modules, namely, an ns-3 core, a time sync module, a simulated communicated network, and a network application module. Although ns-3’s core is designed using the C++ language, it supports both Python scripting, CMDENV, TKENV, TVENV, and the OTcl interface. Thus, without recompiling ns-3 or understanding the C++ language, developers can still develop and modify simulations. In addition, ns-3 allows enhanced scalability and improved software integration with the support of the Python language.
3.5. FNCS Broker
The FNCS broker supports the integration between both simulators, GridLAB-D and ns-3. The framework enables multi-platform co-simulation, such as single, multiple, cluster, and cloud nodes. On one end of the spectrum, GridLAB-D simulates the power grid. In the middle, the FNCS broker is designed to maintain communication between cyber-physical components. At the other end of the spectrum, ns-3 simulates data communication networks and monitors system activity. Moreover, every FNCS-federated simulator must register with the FNCS broker. This registration allows centralized process control of the simulator. Furthermore, the design objective of FNCS is to reuse existing simulators to provide the environment for co-simulation in real-time. The time synchronization steps are calculated in conjunction with the next time steps in the simulators and depending on whether there are messages in transit.
3.6. Model Manager
The model manager serves as the engine of the proposed framework. It is the central part of the smart grid attack simulation system. On one hand, it manages the composition of the simulation scenarios and controls the execution of the simulations. On the other hand, it also implements the initialization of both simulators, configuring the network model, the power grid topology, and the parameters of the simulator. When the simulation of a scenario is started, the model manager wakes up the preprocessing module to prepare the simulation environment. The resource models, including grid model and network model, are loaded first. Then, if an attack is selected, the attack pattern library will be called. The core of the power grid model and the network model are updated. Consequently, the model manager executes the ns-3, GridLAB-D processes, and the FNCS broker. Finally, it loads and visualizes the simulation results.
4. Implementation of GridAttackSim
In this section, we elaborate on the proof-of-concept prototype of the proposed framework. Based on the structures introduced in the previous section, a smart grid co-simulation application was created using the Python programming language. Tkinter [
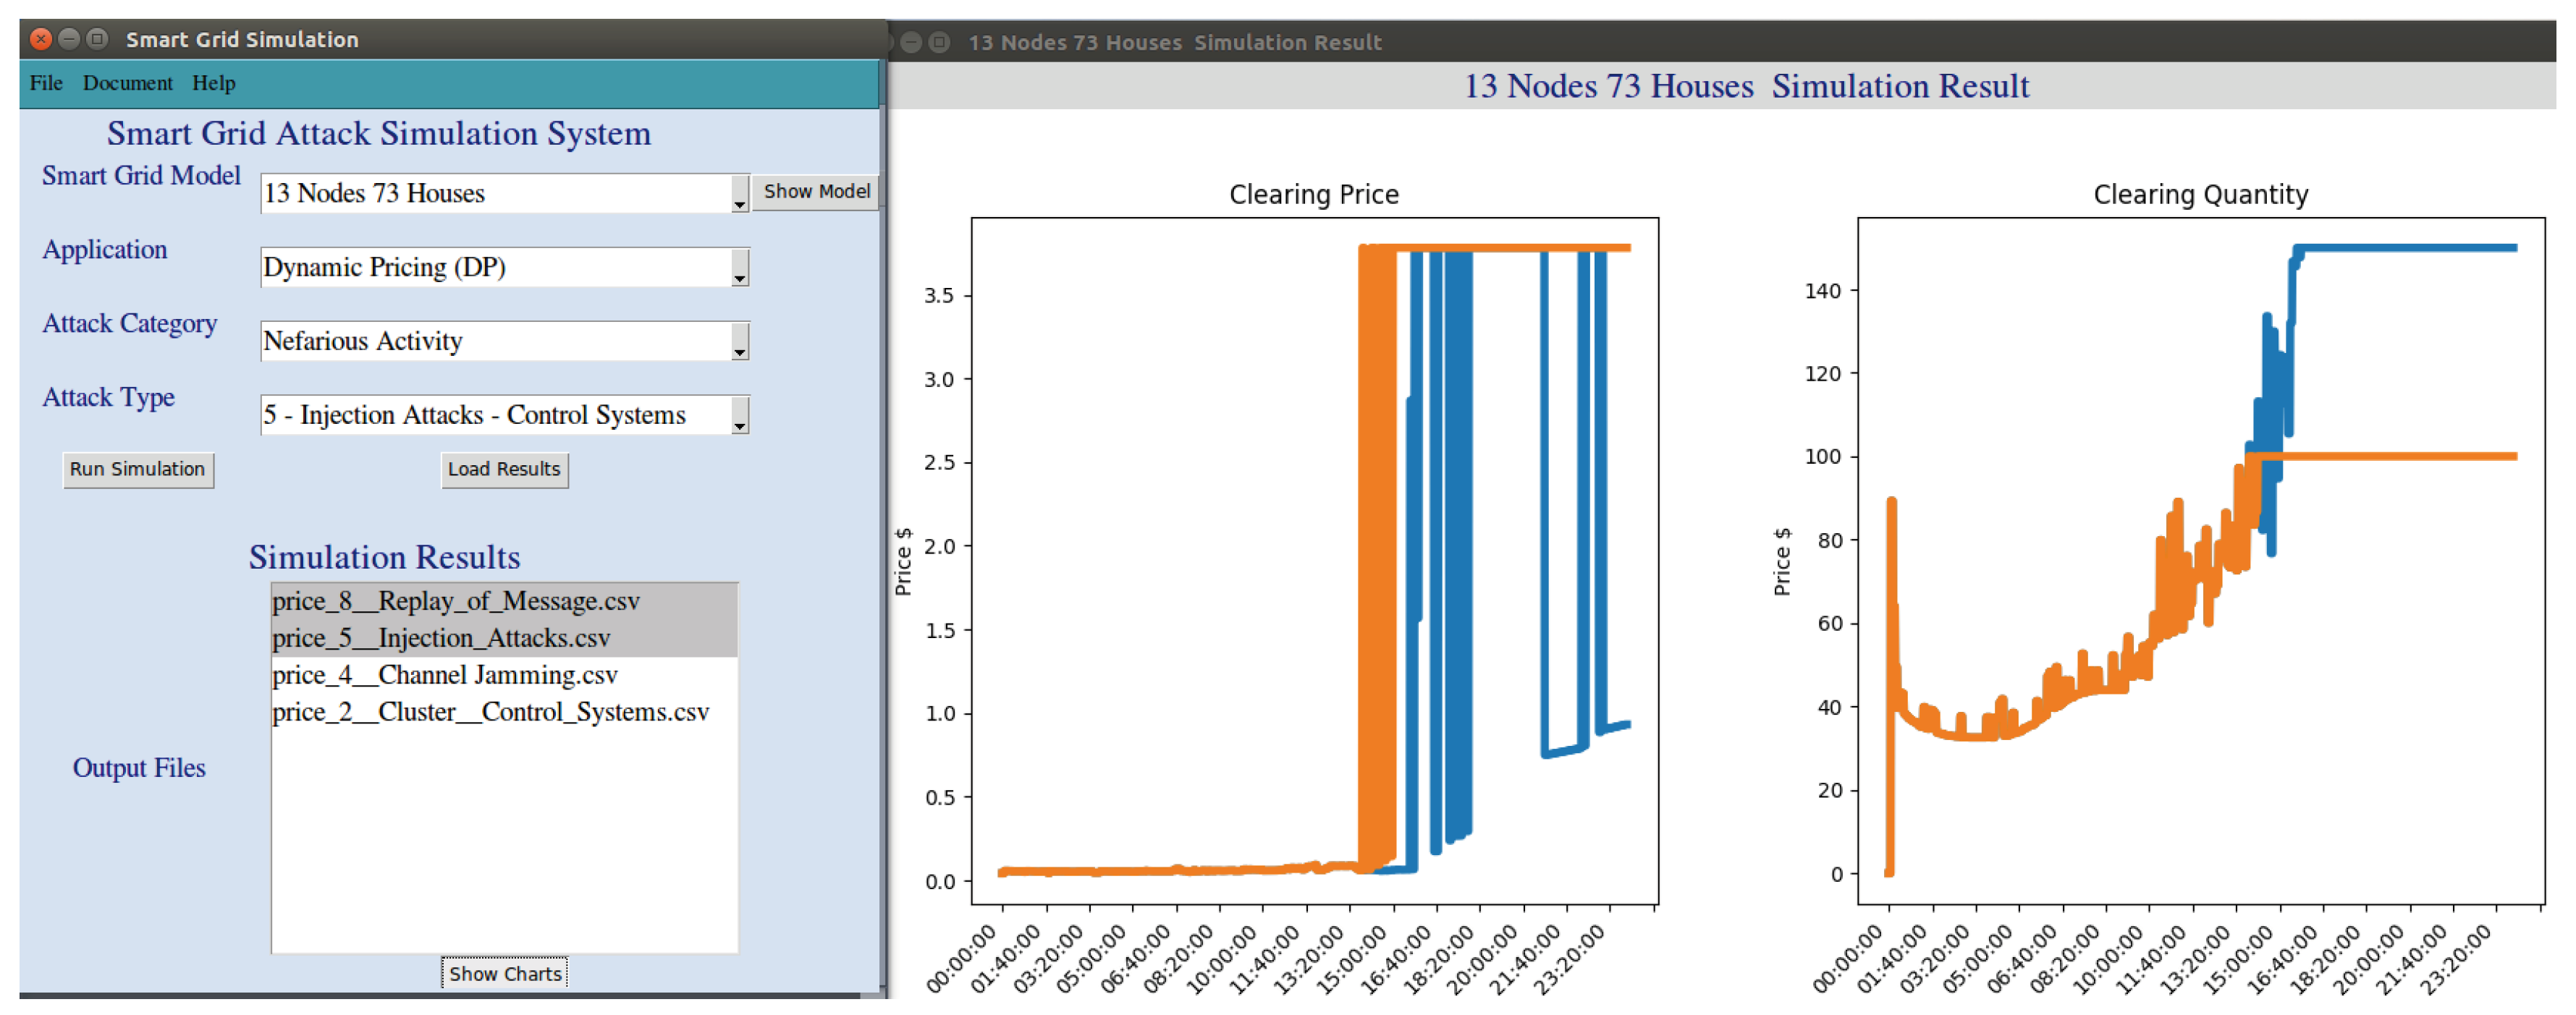
19], a Python binding to the Tk GUI toolkit, was utilized to build the smart grid simulation (or GridAttackSim) desktop application, which is depicted in
Figure 3.
The structure of this section is as follows. First, an overview of the smart grid Model is given. Second, the details of two smart grid applications, including demand respond and dynamic pricing, are provided. Then, the supported attack is described. Finally, we show how to run the simulation and visualize the results.
4.1. Smart Grid Model
There are two essential components of the smart grid model, namely, the power grid and communication network model. Therefore, both GridLAB-D and ns-3 are needed to model a smart grid system. Each smart grid model has a specific number of houses that act as residential loads or dynamic power consumptions. Each of these dynamic power consumptions is equipped with a heating, ventilation, and air conditioning (HVAC) system, which is controlled by a specific passive controller. The example of a smart grid Model with 73 Houses and an IEEE 13 node test feeder is shown in
Figure 4.
4.1.1. Network Model
For the communication network, an ns-3 network model was developed with a number of nodes representing smart meters implemented in residential load. These smart meters are organized into small groups that constitute local networks. Each smart meter was assigned an IP address. Then, this IP address was mapped to the given name for each residential load from the GridLAB-D model. The collected data in each group are routed to a data aggregator by an edge network node through a point-to-point communication connection. Since the User Datagram Protocol (UDP) is a connectionless protocol that leads to a lower transmission delay compared to Transmission Control Protocol (TCP), UDP has been utilized for the communication system. The ns-3 Carrier Sense Multiple Access (CSMA) device models a simple Ethernet bus network, which is the Carrier Sense Multiple Access with Collision Detection (CSMA/CD) transmission protocol. In this research, the ns-3 CSMA/CD model has been used to define data rates and delay values. ns-3 is a powerful network modeling simulator. Therefore, more complicated network models can be applied in the future.
4.1.2. Power Grid Model
For the power grid model, a GridLAB-D power system was designed based on the simple test feeder and IEEE test feeders [
20], including four node and 13 node versions. The goal of these test feeders is to provide a distribution system model that represents a broad class of design and analytical challenges. The test feeders were originally developed to test new power flow methods. However, they have been utilized for a variety of research studies due to utility and accessibility. The general structure of these test feeders includes (1) substations represented as the energy provider, (2) transformers to adjust the voltage levels, (3) meters to measure the power consumption, (4) loads to consume energy, and (5) transmission lines.
The simple test feeder [
21] is a very small test feeder created by PNNL to test the function of FNCS. The test feeder consists of a substation swing bus and residential loads. This designed substation is made up of a three-phase swing bus with a 7200 V nominal voltage and a power rating of 1500 kW per phase (4500 kW in total). In the middle of the substation transformer and residential loads, there is a total load meter to measure the energy consumption and estimate the demand power. Moreover, the collected data allow the substation to adjust the energy supply to the system accordingly. The residential loads link to the power line through triplex meters.
IEEE 4 node test feeder, or the 4-bus feeder [
22], was originally created in 2001, ten years after the original 1991 IEEE test feeders were released. By providing a simple model, the test feeder has the capability of a program to analyze all the possible three-phase transformer connections. Besides, it steps up and steps down operations in various balanced and unbalanced load scenarios. Due to their small size, the test feeder error rate is expected to be less than 0.05%. Thus, the 4-bus feeder is widely used in distributed energy resources research and power flow analysis.
The IEEE 13 node test feeder, or the 13-bus feeder [
23], was first introduced in 1992. During the Power and Energy Society Summer Meeting in 2000, this small and highly loaded test feeder was approved. It features many of the standard technologies employed in current grids, such as shunt capacitor banks, voltage regulators, underground and overhead lines, and unbalanced loads. Operating at 4.16 kV, the 13-bus feeder aims to experiment with common features of distribution analysis applications. It is the starting point for power-flow convergence problems in highly unbalanced systems research.
4.2. Smart Grid Applications
A range of smart grid applications are available, comprising advanced metering infrastructure (AMI), demand response (DR), dynamic pricing (DP), phasor measurement units (PMU), and wide-area monitoring, protection, and control (WAMPAC). In several smart grid applications, for instance, DR and DP, high bandwidth communications are necessary to facilitate high-speed, wide-area monitoring, and security. However, such standards do not apply for all applications; for instance, AMI only needs to update billing information once every 24 h.
Peak demand is when the network’s electricity consumption is the highest, which can strain the electricity grid and cause power outages. Therefore, peak demand reduction is an emerging energy industry problem. To deal with this issue, more financial investments should be made to construct the electrical system. This expense will lead to rises in electricity prices. However, research has shown that demands of 25% of the distribution and 10% of the generation and transmission assets, which is worth more than 100 billion dollars, are less than 400 hours a year. Fortunately, DP and DR enable the smart grid system to reduce peak demand. Consequently, we implemented DR and DP as model applications in this study.
DR is an adjustment in a consumer’s power usage to better balance electricity demand with supply. It attempts to ensure reliable power supply during periods of high demand by allowing consumers to minimize or adjust their energy usage dynamically. Instead of adjusting the energy supply to the system, DR aims to adjust the power consumption of the end-users. Consequently, unlike most of the traditional power grid systems, users can play a significant role in electric grid operation. Thus, the utility has various benefits, such as emergency operations and regulating services, as well as peak load reduction.
DP is a pricing model where utilities create flexible prices for electricity based on current market demands. It is an appropriate technique for strengthening the DR function. The three methods for determining prices in DP are critical peak price (CPP), time-of-use (TOU), and real time price (RTP). RTP has successfully allowed the estimation of price elasticity at different times. Hence, it is widely used for electricity systems in developed countries.
In this study, to enable DR and DP function, the dynamic residential loads or the houses participated in a transitive energy market and submitted the quantity and price bids to the auction system. Depending on current electricity demands and the time of day, the substation determines the energy reference prices and sets the energy market’s maximum power capacity. In a finite time interval, the reference bids price and control signals are transmitted to the market controller by both demanders and the supplier. On the one hand, the supplier bids the maximum power and the price that it can supply to the system at a given time. On the other hand, demanders bid power they can forgo at a given price. To realistically delay communications between components, all bids and price signals are transmitted via the aforementioned ns-3 model. The bidding process is stopped after the specified time cycle, typically from 5 to 15 min. Then, the market-clearing process is started. In this process, both supply and demand bids have been sorted. Supply bids are sorted from lowest to highest. In contrast, demand bids are sorted from highest to lowest. The curves are then generated by the total quantities of these values. The intersection of curves is essentially the clearing price and the demand quantity. The passive controller in the HVAC system adjusts the thermostat control band by moving the temperature band or increasing the hysteresis after receiving the clearing quantity from the market for each time interval. This cycle continues for each interval.
4.3. Supported Attacks
The attack categories have been selected based on a guideline created by the European Union Agency for Cybersecurity (ENISA) [
24]. To cover all the threats that threaten the smart grid system directly, ENISA has classified the threats into six categories based on the summarization of advanced guidelines from NISTIR 7628 [
25], enhancing security throughout the supply chain (IBM Center) [
26], and smart grid information assurance and security technology assessment (Sacramento State) [
27], and others. The six high-level attack categories are (1) nefarious activity, (2) eavesdropping, interception, and hijacking, (3) outages, (4) unintentional data damage, (5) deliberate data damage, and (6) other threats. In the scope of this research, we focused on two well-known categories: (1) nefarious activity, and (2) eavesdropping, interception, and hijacking.
Nefarious activity is defined as deliberate actions targeting the core infrastructure and the network of the smart grid system by conducting malicious activities with the intention of either stealing, altering, or destroying a specified target. It categorizes the most common threats on the smart grid system, including advanced persistent threats (APTs), DNS attacks, channel jamming, generation and use of rogue certificates, identity theft, injection attacks, malicious code, social engineering, unauthorized access to systems, and web-based attacks.
Eavesdropping/interception/hijacking is the set of actions that aims to listen to, modify, interrupt, seize control, or delete the transmitted data of a smart grid communication without permission. It contains the main network-related threats, such as information theft, man-in-the-middle (MITM), network reconnaissance, routing attacks, replay of messages, smart meter connection hijacking, and wardriving.
Based on the two well-known attack categories mentioned earlier, the nine typical attack types are selected. They are organized into four groups, comprising channel jamming, malicious code, injection attacks, and replay of messages.
Channel jamming is the term used to describe the intentional actions of jamming, blocking, disrupting, or interfering with the transmission of authorized wireless communications by decreasing the Signal-to-inference-plus-noise ratio (SINR). Channel jamming is a kind of denial-of-service attack. These attacks aim to make smart grid resources inaccessible for internal and external users. The attack targets are various layers of the network and applications, such as physical and data links.
Injection attacks are a wide range of attack vectors that enable an adversary to inject untrusted input data or code to a software system mainly in the end-point systems. Such an attack is actualized by an interpreter as part of a command or query that changes the way the program is executed. The two variants of injection attacks are malicious code injection and malformed data injection.
Malicious code means any code in any component of a program or script that has an adverse impact, security violation, or causes destruction of a smart grid system. Depending on the installed software, these can threaten a smart grid in the functioning of all associated IT segments. Malicious code consists of numerous threats, such as exploit kits, worms, trojans, backdoor/trapdoor, service spoofing, and ICMP-flooding attacks.
For the framework implementation, the attack simulations on a smart grid system have been conducted by altering the input values of GridLAB-D and ns-3 simulators. The configuration of the attack pattern library with the variables that need to be changed to simulate an attack is summarized in
Table 3. Note that different types of attacks might affect the same variables, yielding multiple possibilities for diagnosis.
4.4. Running Simulations and Visualizing Results
After the smart grid model, application, attack category, and attack type have been selected, the simulation is ready to run. The model manager module calls the preprocessing module, and accesses the attack pattern library and network model. At this time, the environment is configured, and the simulation can be executed. Three terminal windows are opened, one for the ns-3 process, one for GridLAB-D operation, and the last for the fncs_broker. Once the simulation finishes, it is possible to track what occurred in the system, how the attacks disrupted the network activity, which components were compromised, and what the consequences of the attack are, all in the same application, which is a key contribution of our GridAttackSim approach.
Data input and output is an essential part of any simulation, and simulations with the combination of FNCS, GridLAB-D, and ns-3 are no exception. After finishing the simulation, the outputs in the CSV (comma-separated values) format can be loaded. It is a basic file format used mostly for storing tabular data, for example, a database or spreadsheet. Furthermore, they are the primary method for recording simulation results. The framework uses the recorder and collector objects of the GridLAB-D tape module to create aggregated values over the entire model or a time-series of selected values. The outputs can include but are not limited to the power load, clearing price, clearing quantity, and the voltages of a single node or the whole system. By using the friendly GUI, users can select the simulation outputs, and then visualize the results. This function enables the users to quickly make a visual comparison between the regular operation and attack scenarios. Therefore, the behavior, impact, and consequence of the attacks can be easily recognized. Currently, line graphs and bar graphs are supported.
5. Selected Results
In this section, the results achieved in our experiments are demonstrated. The study analyzed the consequences of the simulated cyber-attacks on the energy providers and their customers in terms of financial and operational losses, total loads, clearing price, and clearing quantity. The principal objective of our research is to introduce a smart grid co-simulation environment that can be extended to simulate and analyze the various type of attacks and analyze their impact. Note that developers and smart grid researchers interested in attack simulation can easily extend the proposed framework with additional attack pattern libraries and simulation scenarios. However, only some selected results are discussed in this paper due to the scope of this study. In addition, the results of the simple test feeder, which is the smallest in this study, and the IEEE 13 node test feeder, which is the largest, are shown. The attack types selected, channel jamming and injection attack, are two of the most common attack types on the smart grid system defined by ENISA. Indeed, the co-simulation results in both metrics, including the total real-time load, current market-clearing price, current market-clearing quantity, and economic impact, are visually significant, which strongly supports cyber-security training for IT experts, cyber-security professionals, and even advanced/interested end-users.
In our study, the co-simulator uses FNCS, GridLAB-D, and ns-3 on Intel Core i7 CPU 3.1 GHz with a Linux 64-bit operating system, and 16 GB DDR3 RAM to carry out the simulation. Based on the models mentioned in
Section 4.1, we consider two typical case studies with the simple test feeder and IEEE 13 Node. In these models, the default data rate for point-to-point connectivity and local area networks are 4 Mbps and 10 Gbps, respectively. Additionally, the default transmission delays are set as 3 milliseconds for both. According to the available climate databases, a one-day simulation period from 00:00:00 21 July 2009 until 00:00:00 22 July 2009 was gone through, using the weather information from the National Solar Radiation Database (NSRDB) of Seattle, WA, USA.
5.1. Channel Jamming Attack with the Simple Test Feeder
The GridLAB-D model comprises 255 houses participating in a transactive market. Accordingly, the ns-3 model contains a 250-node network divided into groups of 20. The default price cap and maximum capacity bid quantity are set as $3.78 and 1500 kW, respectively.
In this circumstance, we assumed that, by directly transmitting an interference signal, an adversary could completely block wireless communications, disturbing the normal operation, leading to execution problems, or even disrupting the control system. The attack was simulated by increasing the communication delays until the total load, cleared market price, and cleared quantity had been significantly affected. Eventually, the data rate of point-to-point connectivity and local area networks were sequentially adjusted from 4 Mbps and 10 Gbps to 0.5 Mbps and 1 Gbps, while the delay values were increased from 3 ms to 100 ms. The purpose of this scenario is not only to demonstrate the consequences of a chanel jamming attack but also to illustrate how a dysfunctional network system affects the energy market.
Figure 5 shows the results obtained in a one-day simulation for normal operation and the channel jamming attack scenarios. In
Figure 5a, we can see the total real-time load of the system collected at the substation’s meter.
Figure 5b presents the current market-clearing quantity, while the current market-clearing price is demonstrated in
Figure 5c.
Figure 5d presents the economic impact of the attack. Although the clearing quantity curves are identical, the clearing price and the total load curves are partly distinct from normal and attack situations. The peak hours are noticed from around 16:00 until around midnight. At approximately 16:00, the total feeder load exceeds the market’s pre-defined maximum capacity bid quantity. As a result, the market-clearing price has been increased to flatten energy consumption at the capacity limit as well as encourage more DR. Since there is more energy demand, the market-clearing price jumps to the price cap 3.8
$/kWh, significantly affecting the cleared price for nearly 5 hours. At around 22:00, the clearing price curve under the channel jamming attack suddenly dropped to around
$1, then slowly decreased to low prices. These low prices encouraged customers to purchase more energy. Consequently, the total load curve due to the channel jamming attack fluctuated and reached over 1600 kW. Note that, in a normal operation scenario, the clearing price and total load curves only decrease after the peak period.
These differences are caused by a significant number of delayed bids, especially re-bids later in the market interval. Since more packets have been lost under the simulated channel jamming attack, the delivery ratio of packets is statistically insignificant. If the average package delivery ratio in the normal scenario is 100%, this channel jamming attack decreases 20.14% of the typical package delivery ratio. The lack of real-time data transmission between end-users and market controllers leads to a market malfunction. Because the interval re-bids do not fully arrive at the auction system before the clearing market process, the system uses out-of-date data to calculate the bid curve. While this failure does not affect the result in most market clearings, at 22:00, the issue is sufficiently large to influence the results due to the continuously stressed system and high price. Thus, the performance of DR and DP is not obvious.
As shown in
Figure 5d, this circumstance affords end-users significant profit; nevertheless, energy suppliers suffer considerable losses. Considering that the energy consumption and bill amount in normal operation are 100%, this attack can provoke more than 3.2% of energy consumption and a financial loss of 2.9% to the electric utility in a short period of only 24 h.
A promising option to avoid channel jamming attacks is the use of jamming mitigation technologies, for instance, the identification of trigger nodes, as discussed in [
28].
5.2. Injection Attack with IEEE 13 Node
For the GridLAB-D model, there are 73 houses participating in a transactive market. Therefore, there are also 73 network nodes in the ns-3 model. These nodes are divided into groups of 20. The pre-defined price cap is $3.78, and the maximum capacity bid quantity is set as 150 kW.
The false data injection attack was recently identified as a notable type of cyber attack against large-scale smart grid measurement and monitoring systems. To support their final goal of misleading the system operation and control centers, the adversaries exploit system vulnerabilities then inject malicious code to manipulate the data collected from the network. In this simulation, we assumed that the injected malicious code in the control center of the auction system could modify the maximum bid quantity from 150 kW to lower (50 kW) or higher (200 kW) values. In contrast, the default data rate and delay values are not affected in this scenario. By analyzing the total energy used, market-clearing quantity, and market-clearing price, the experiment aimed to evaluate the efficiency of the dynamic pricing as well as the performance of the DR application under the cybersecurity attack.
The results of normal operation and injection attack in a 24 h simulation, including (a) the total load, (b) market-clearing quantity, (c) market-clearing price, and (d) economic impact are presented in
Figure 6. The attack schedule was set as specified by the peak hours, which are from 14:00 to 21:00. Only the window of interest, including one hour before and after the attack period, is shown.
More electricity is supplied to the market by injecting a fake 200 kW maximum capacity bid. Hence, the price is comfortable most of the time except for the two-hour rush period starting from 18:00 when the clearing price suddenly jumped up to the price cap. As a result, consumers can afford to use more energy even during the rush period without bothering much about their monthly bills. If the energy consumption and bill amount in the normal scenario are 100%, as shown in
Figure 6d, 107.6% of energy was consumed in this attack. Consequently, the highest total load was 210 kW in this scenario. However, the end-users paid just 18.1% of the bill amount, which means the power company dropped 81.9% of their profit in only a 9-hour period of the window of interest, from 13:00 to 22:00. This is the most profitable scenario for the end-user.
By injecting a false, small maximum capacity bid at 50 kW, less electricity is provided to the auction market. Consequently, the clearing price immediately hits the price cap at the beginning of the attack period and maintained the
$3.78 value until it finished. Unfortunately, the efforts of end-users to adapt their electricity usage have limited impact, and DR function is less efficient. Therefore, the total energy consumption in this attack is 3.2% higher than the normal scenario, as depicted in
Figure 6d. The highest total load is nearly 200 kW. Unfortunately, this is the most severe economic impact for the end-user, with a 153.1% bill amount increase when compared to the normal scenario.
Therefore, to achieve a win-win situation between the energy suppliers and end-users, injection attacks should be considered and prevented. Various technologies to detect and prevent injection attacks are discussed in [
29,
30].
6. Discussion
We are in the era of Society 5.0, where technology is changing the way that humans live, interact, and communicate with each other. Smart grid IoT, which comprises the power grid and network components, is one of the critical components of Society 5.0. There have been several cyber attacks on smart grid systems in recent years that have caused various consequences, including blackouts, confidential information loss, or even physical harm to power equipment. Consequently, the protection of smart grid systems against cybersecurity attacks is essential. To properly handle these security issues, IT professionals, security experts, and even end-users must possess all the practical knowledge and skills required. Therefore, the application of the smart grid co-simulation system for IT experts, cybersecurity professional, and even end-user training is strongly recommended. Unfortunately, there are few existing efforts to fill this research gap.
Although the current technologies can simulate both the electricity grid and communication network, they are usually used in small and limited networks. To tackle this issue, we applied GridLAB-D, a powerful power grid simulator, and ns-3, a feature-rich network modeling simulator. Additionally, our simulators are extendable since they support various programming languages, APIs, and external libraries. Unfortunately, this combination causes several difficulties, for instance, differences in time scales, time synchronization, data transmission delays, and flexible model reuse. Therefore, the FNCS broker is used to manage and handle this integration efficiently.
Our main contribution is a framework that reproduces a real smart grid environment with various cybersecurity attacks and then allows evaluation of their consequences, all in one place. Furthermore, the friendly GUI and built-in attack profiles allow regular users to execute the simulations automatically as well as analyze the results without a deep understanding of software technology, abstracting away the underlying complexity of integrating tools. Although most of the current research supports a few attack types, more attack types can be integrated into our framework due to our extendable attack pattern library structure for IT experts and electric utilities interested in improving smart grid security. While related studies have omitted the attack schedule function, our framework fills this gap by introducing the attack schedule capability.
We expect that the framework can be implemented for customers’ cybersecurity training. For instance, by visualizing graphics, the end-users can adequately understand the economic consequences when smart grid systems are being attacked. For the system operators, the framework can be used not only to assess the consequences of various attack types but also to enable early development and evaluation of new anomaly detection and mitigation methods before their implementation. Moreover, the framework can be used to determine the most effective approaches to implementing smart grid technology, in particular for communicating specifications for effective system operation.
7. Conclusions
In this paper, we first conducted a comprehensive study of the existing efforts in the field, and then presented our framework for smart grid attack co-simulation, called GridAttackSim. Our proposed framework features a robust smart grid attack co-simulation tool, a friendly GUI, an extendable attack pattern library with attack schedule, and result visualization functions. Furthermore, case studies with the simple test feeder and IEEE 13 Node models were conducted to validate our framework.
GridAttackSim enables the comparison between the normal operation and attack scenarios for various smart grid metrics, including the total load, cleared market price, clear market quantity, energy consumption, and bill amount. Consequently, we anticipate that GridAttackSim can be used both by IT experts and cybersecurity professionals not only for analyzing the impact of attacks on the smart grid system but also for end-user training.
The main problem faced in this research is the design of the network model. ns-3 is a robust network simulator; therefore, our basic network model should not be treated as the only solution that can be created using this tool. In addition, the current framework supports three types of test feeder, including a test system of the IEEE 13 node test feeder Model. The maximum number of houses (or dynamic loads) can be up to 1000 houses. Our model simulates a combined CPS model where, at each iteration, both the power system model and the communication model are jointly solved and synchronized. Therefore, our considered model is doing an appropriate amount of computational tasks for this thousand house model. As the framework is quite flexible, it is also possible to extend the work with a bigger network. For future work, we intend to improve this by designing more network models suitable for the power grid models. We also plan to further investigate additional test feeder models, applications, attack types, and scenarios that can be integrated into our GridAttackSim framework.


