Article

Complex Permittivity Measurement of High-Loss Biological Material with Improved Cavity Perturbation Method in the Range of 26.5–40 GHz

1
School of Electronic Science and Engineering, University of Electronic Science and Technology of China, Chengdu 610054, China
2
School of Physics, University of Electronic Science and Technology of China, Chengdu 610054, China
3
School of Life Science and Technology, University of Electronic Science and Technology of China, Chengdu 610054, China
4
Chengdu Institute of Biology, Chinese Academy of Sciences, Chengdu 610054, China
*
Author to whom correspondence should be addressed.
Electronics 2020, 9(8), 1200; https://doi.org/10.3390/electronics9081200
Submission received: 6 July 2020 / Revised: 21 July 2020 / Accepted: 24 July 2020 / Published: 27 July 2020
(This article belongs to the Section Bioelectronics)

Abstract

:
In this paper, we performed and designed a new rectangular cavity to identify and analyze the complex permittivity of two cancer cells (Breast-MDA231, Uveal melanoma) that have a high dielectric constant and dielectric loss. The rectangular cavity device is based on the improved cavity perturbation technology. The sample of the improved cavity perturbation device is placed at the position of a/n close to the wall of the cavity, where a is the wide side of the cavity and n is the positive even number. For high-loss biological materials, the improved cavity perturbation method has higher accuracy than the traditional cavity perturbation method. The results present that the relative dielectric constants of a single cell at Ka-band (26.5–40 GHz) are in the range 8–15, and the relative dielectric loss is 24–31. The information of the cancer cells at Ka-band waves can be helpful for further cancer detection and clinical treatment.

1. Introduction

The permittivity of material depicts the ability to permit the storage of electric energy by clarifying the relationship between the electric flux density and the electric field. It is a function of frequency and the basic physical properties of the material. If the relationship between the material permittivity and the physical properties of interest can be established, the physical properties of the material can be inferred from the permittivity measurements. This concept has been successfully used for the measurement of various agricultural properties, such as the water content of grain [1]. The characterization of material properties at microwave frequencies has a long history. Since the early 1950s, a great deal of new measurement methods and techniques have been developed and applied in these fields, such as the transmission/reflection methods, resonator perturbation method, and planar circuit method [2]. More recently, the physical properties of biological materials such as normal and diseased human breast tissue [3] and the dielectric properties of animal tissues at radio and microwave frequencies [4] have been identified by using the measurement of permittivity.
The complex permittivity of biological materials such as tissue and cells presents very important value in the field of disease diagnosis and treatment [5,6,7]. Many researchers have conducted extensive research to identify the dielectric parameters of different human tissues, body fluids, and cells [8]. In the past three decades, the permittivity of several biomaterials was studied with the impedance-based technique at low frequency in the range of 100 Hz to 10 MHz [9,10,11,12].
In the meantime, the complex dielectric properties of various cells in specific solutions, such as cancer cells, were also measured by researchers using the dielectric spectroscopy method [13,14,15,16]. Many impedance models with different assumptions have been used to determine the complex dielectric parameters of particles in solution. The results show that the complex dielectric constant of the particles has a frequency response [17]. In addition, a large number of microwave measurement methods of the material are performed by applying coaxial detection, transmission line methods, free space methods, and cavity methods [18,19,20]. In our paper, we performed a revised cavity perturbation method that has a higher precision than the traditional measurement method. We also designed a new rectangular cavity device to identify and analyze the complex permittivity of two cancer cells (Breast-MDA231, Uveal melanoma), which have a high dielectric constant and dielectric loss at the Ka-band.
With the development of microfluidic technology, more and more cell complex dielectric properties are characterized by microfluidic technology, and exciting results have been achieved [21]. However, when using microfluidic technology to study the complex dielectric properties of cells, it is difficult to capture and characterize individual cells. Therefore, researchers have proposed a variety of equivalent measurement methods to indirectly measure the complex dielectric parameters of single cells by characterizing the complex dielectric properties of cell culture fluids. With the utilization of the proposed rectangular cavity perturbation method, we can obtain complex dielectric parameters for cell cultures with specific small volumes and numbers. When the complex dielectric parameters of a small amount of cell-containing culture medium are measured, Hanai’s mixed formula can be used to obtain the complex dielectric parameters of a single cell [22].

2. Theory of Improved Cavity Perturbation Technology

The complex permittivity (ε*) consists of a real part (ε’) and an imaginary part (ε’’). The real part (ε’) is used to describe the strength of the interaction between the material and the electric field. The imaginary part (ε’’) is used to describe the energy loss associated with the electric field [23].
The cavity perturbation technique has been used to accurately measure the complex permittivity of insulating materials at a microwave frequency. The theory of cavity perturbation was proposed by Bethe and Schwinger [24] for the first time. They considered two situations that could cause perturbation: (1) a small dielectric sample inserted into the cavity, and (2) a small deformation on the boundary surface of the cavity. Researchers have suggested various theoretical analyses of cavity perturbation techniques [25,26,27,28]. Measuring the complex permittivity of a material is performed by inserting a small, appropriately shaped sample material into a cavity and determining the properties of the resultant change in the resonant frequency and loaded Q-factor [29].
After years of development, the resonant cavity perturbation method has received more and more attention and has been used by multiple research groups to accurately measure the complex dielectric parameters of insulating materials at microwave frequencies. When a tiny object (relative to the volume of the cavity) is introduced into the microwave cavity, the electric field in the cavity will be disturbed, which will cause the resonance frequency and quality factor [30,31]. Since the changes in frequency and the quality factor can be accurately measured, if we know the characteristics of the cavity and the disturbed cavity, with the help of the perturbation formula, we can get the electrical characteristics of the object to be measured—that is, the complex dielectric parameters. When biological materials, such as cells, are used for measurement, due to their own characteristics, large volumes of samples cannot be prepared. Therefore, the cavity perturbation method provides a potential option for accurately measuring the complex dielectric parameters of tiny biological materials.
The basic formula of the complex dielectric parameters of the sample to be measured in the rectangular cavity perturbation method is [32]:
ε = V c ( f 0 f ) 2 V s f + 1
ε = V c 4 V s ( 1 Q 1 Q 0 )
where f0 and Q0 represent the resonant frequency and the Q-factor of the cavity before the sample is placed; while f and Q represent the resonant frequency and the Q-factor of the cavity after the sample was placed, respectively. Vc and Vs represent the volume of the cavity and the sample under test. Hence, we can determine the complex permittivity by measuring the frequency shift and Q-factor. For many years, the relationships have been used for material complex permittivity determination. However, for high loss materials, the basic cavity perturbation assumption that the perturbed fields are approximately the same as the original fields is not satisfied, so complex permittivity is not well calculated by the above Equations (1) and (2). Many researchers have proposed different resonant cavity perturbation measurement methods. When the sample to be tested and introduced into the cavity is a high-conductivity material (such as a biological material), the S21 curve, which represents the forward voltage in the two-port network, becomes gentle, making it difficult to obtain half-power bandwidth from the measured S21 curve. So, Akyel Cevdet et al. [33] developed a measurement method to calculate the Q-factor using the bandwidth of the S21 curve at m dB. It is also an effective measurement method to reduce the volume of the sample to be tested and thus reduce the absorption of the electric field in the cavity by the high-loss material. As a result, the test process better satisfies the basic assumption of the perturbation method. Based on this assumption, Lin Mi et al. [34] developed a newly derived equation that is more general than the standard forms in that the material sample under investigation could have a sample length that is shorter than the height of the cavity resonator. The accurate measurement of the Q-factor and resonant frequency shows a great importance in the resonant perturbation method, on which researchers have made many useful attempts [35,36]. Gyüre-Garami B et al. [37] proposed a feedback-oscillator-based measurement for the Q-factor and resonance frequency that is conceptually simple but provides very high sensitivity. In this paper, we developed a revised cavity perturbation method to measure the complex permittivity of high loss materials by changing the sample’s location. By changing the position of the sample in the cavity, the perturbation assumption is re-established. Higher accuracy can be obtained with the modified perturbation equation for high loss biomaterial measurement.
As shown in Figure 1, a cylindrical sample with a radius r is placed in the cavity. The electromagnetic wave propagates along the z direction. a is the width and l is the length of rectangular cavity, while a/n represent the distance between the center of a sample and the long side of the rectangular cavity. The resonant cavity is operated in the TE107 (an odd number p means the maximum electric field intensity value is located at the center of the cavity) mode.
When the sample under test is located at the location of (a/n, l/2), we can finally get the revised cavity perturbation equation:
ε = V c ( f 0 f ) 2 V s f sin 2 ( π / n ) + 1
ε = V c 4 V s sin 2 ( π / n ) ( 1 Q 1 Q 0 ) .
The symbols in Equations (3) and (4) have the same meaning as those in Equations (1) and (2); n is a positive even number that is used to determine the position of the sample in the cavity. Comparing Equations (1) and (2) with Equations (3) and (4), we can note that when n = 2, which means the sample under test is located in the middle of the cavity, Equations (3) and (4) are equivalent to Equations (1) and (2), which means that our proposed cavity perturbation Equations (3) and (4) are applicable to the traditional situation in which the sample was located at the middle of the cavity.
In order to verify the accuracy of the proposed cavity equation, we performed a series of simulations. By using the standard WR-28 waveguide with inner dimensions of 7.11 mm × 3.56 mm, we designed a rectangular resonant cavity operating at the TE107 model with a resonant frequency of 30.13 GHz. The inner diameter of the cylindrical sample to be tested is r = 0.12 mm, and it is inserted parallel to the narrow side of the resonant cavity—that is, the effective volume of the sample to be tested Vc = π*r^2*b, where b is the length of the narrow side of the cavity. The structural parameters of the resonant cavity and volume of the cavity and sample are shown in Table 1. As shown in Figure 2, the sample is placed at (a/n, l/2). When n = 2, the sample is located at the center of the cavity, which is the conventional perturbation sample placement position. When n = 16, the sample is placed close to the side of the cavity, which is a revised perturbation method. In ANSYS High Frequency Structure Simulator (HFSS) software, the following model is used to study, as shown in Figure 2. Figure 2a shows a simulation model diagram for n = 16, and Figure 2b shows a simulation model diagram for n = 2.
According to the proposed perturbation method shown in Equations (3) and (4), we made some computer simulations at the TE107 model with the resonant frequency of 30.10 GHz. The results are shown in Figure 3a,b. Figure 3a shows the improved results and unimproved calculated results when the material’s dielectric constant changes between 20 and 80. Figure 3b shows the revised and unrevised calculated results of the dielectric loss tangent relative error when the material’s dielectric constant changes between 20 and 80. The loss tangent of the sample is defined as the ratio of the imaginary part and the real part of the complex permittivity, as shown in Equation (5). With the utilization of the proposed Equations (3) and (4), we can get more accurate results when measuring high loss and high dielectric parameter materials.
tan δ = ε / ε
where we consider materials with high loss and large dielectric parameters, the real part of the complex permittivity calculated by the traditional perturbation Equations (1) and (2) was larger than the actual value, which has a maximum of 50% positive deviation. Meanwhile, the loss tangent calculated was smaller than the actual value. Using the improved resonant cavity perturbation in Equations (3) and (4), as proposed in our paper, the real part of complex permittivity was larger than the actual value too, and the maximum deviation of the real part was close to 20%, which is much better than the traditional ones. Similarly, the calculated loss tangent value is smaller than the actual value, and the maximum negative deviation is only 20%. The simulation results showed that compared with the traditional perturbation method (n = 2), the proposed revised perturbation method (n = 16) has higher accuracy and sensitivity when measuring high dielectric parameters and high-loss biomaterials. Through the proposed perturbation method, we can effectively characterize the dielectric properties of non-invasive, unlabeled biomaterials.
Several researchers have developed different mathematical approximations to correlate the complex permittivity of mixtures (microsphere and solvent) with microsphere and solvent individual complex permittivity. Maxwell mixing formulations of spherical microsphere in homogeneous solvent are shown as follows [22]:
ε e f f = ε m + 3 V f ε m ( ε p ε m ) ( ε p 2 ε m ) V f ( ε p ε m )
where ε eff , ε p , and ε m are the complex permittivity of the mixture, microsphere, and solvent, respectively. Vf refers to the volume fraction of the microsphere. At low volume fractions (less than 0.1), the equation has an excellent approximation. When considering the high volume fraction situation, Taylor [38] used another formula that has been developed by Hanai [39], which is shown as follows:
( ε p ε e f f ) ( ε p ε m ) = ( 1 V f ) ( ε e f f ε m ) 1 / 3
When we consider the biological samples in our measurement, the cell of the Breast-MDA231 and Uveal melanoma are isolated from the culture dishes using standard adherent cell isolation protocols. Then, the cell solution was centrifuged for 5 min to form the cell suspension. A part of the cell sample has been observed under a microscope to ensure that all cells have spherical shapes. Then, we can consider the cells to be equivalent to microspheres, and culture medium to be equivalent to solvent. By applying Hanai’s mixed formula, the complex permittivity of a single cell in a culture medium can be calculated by measuring the complex permittivity of the mixture (cells and culture medium).

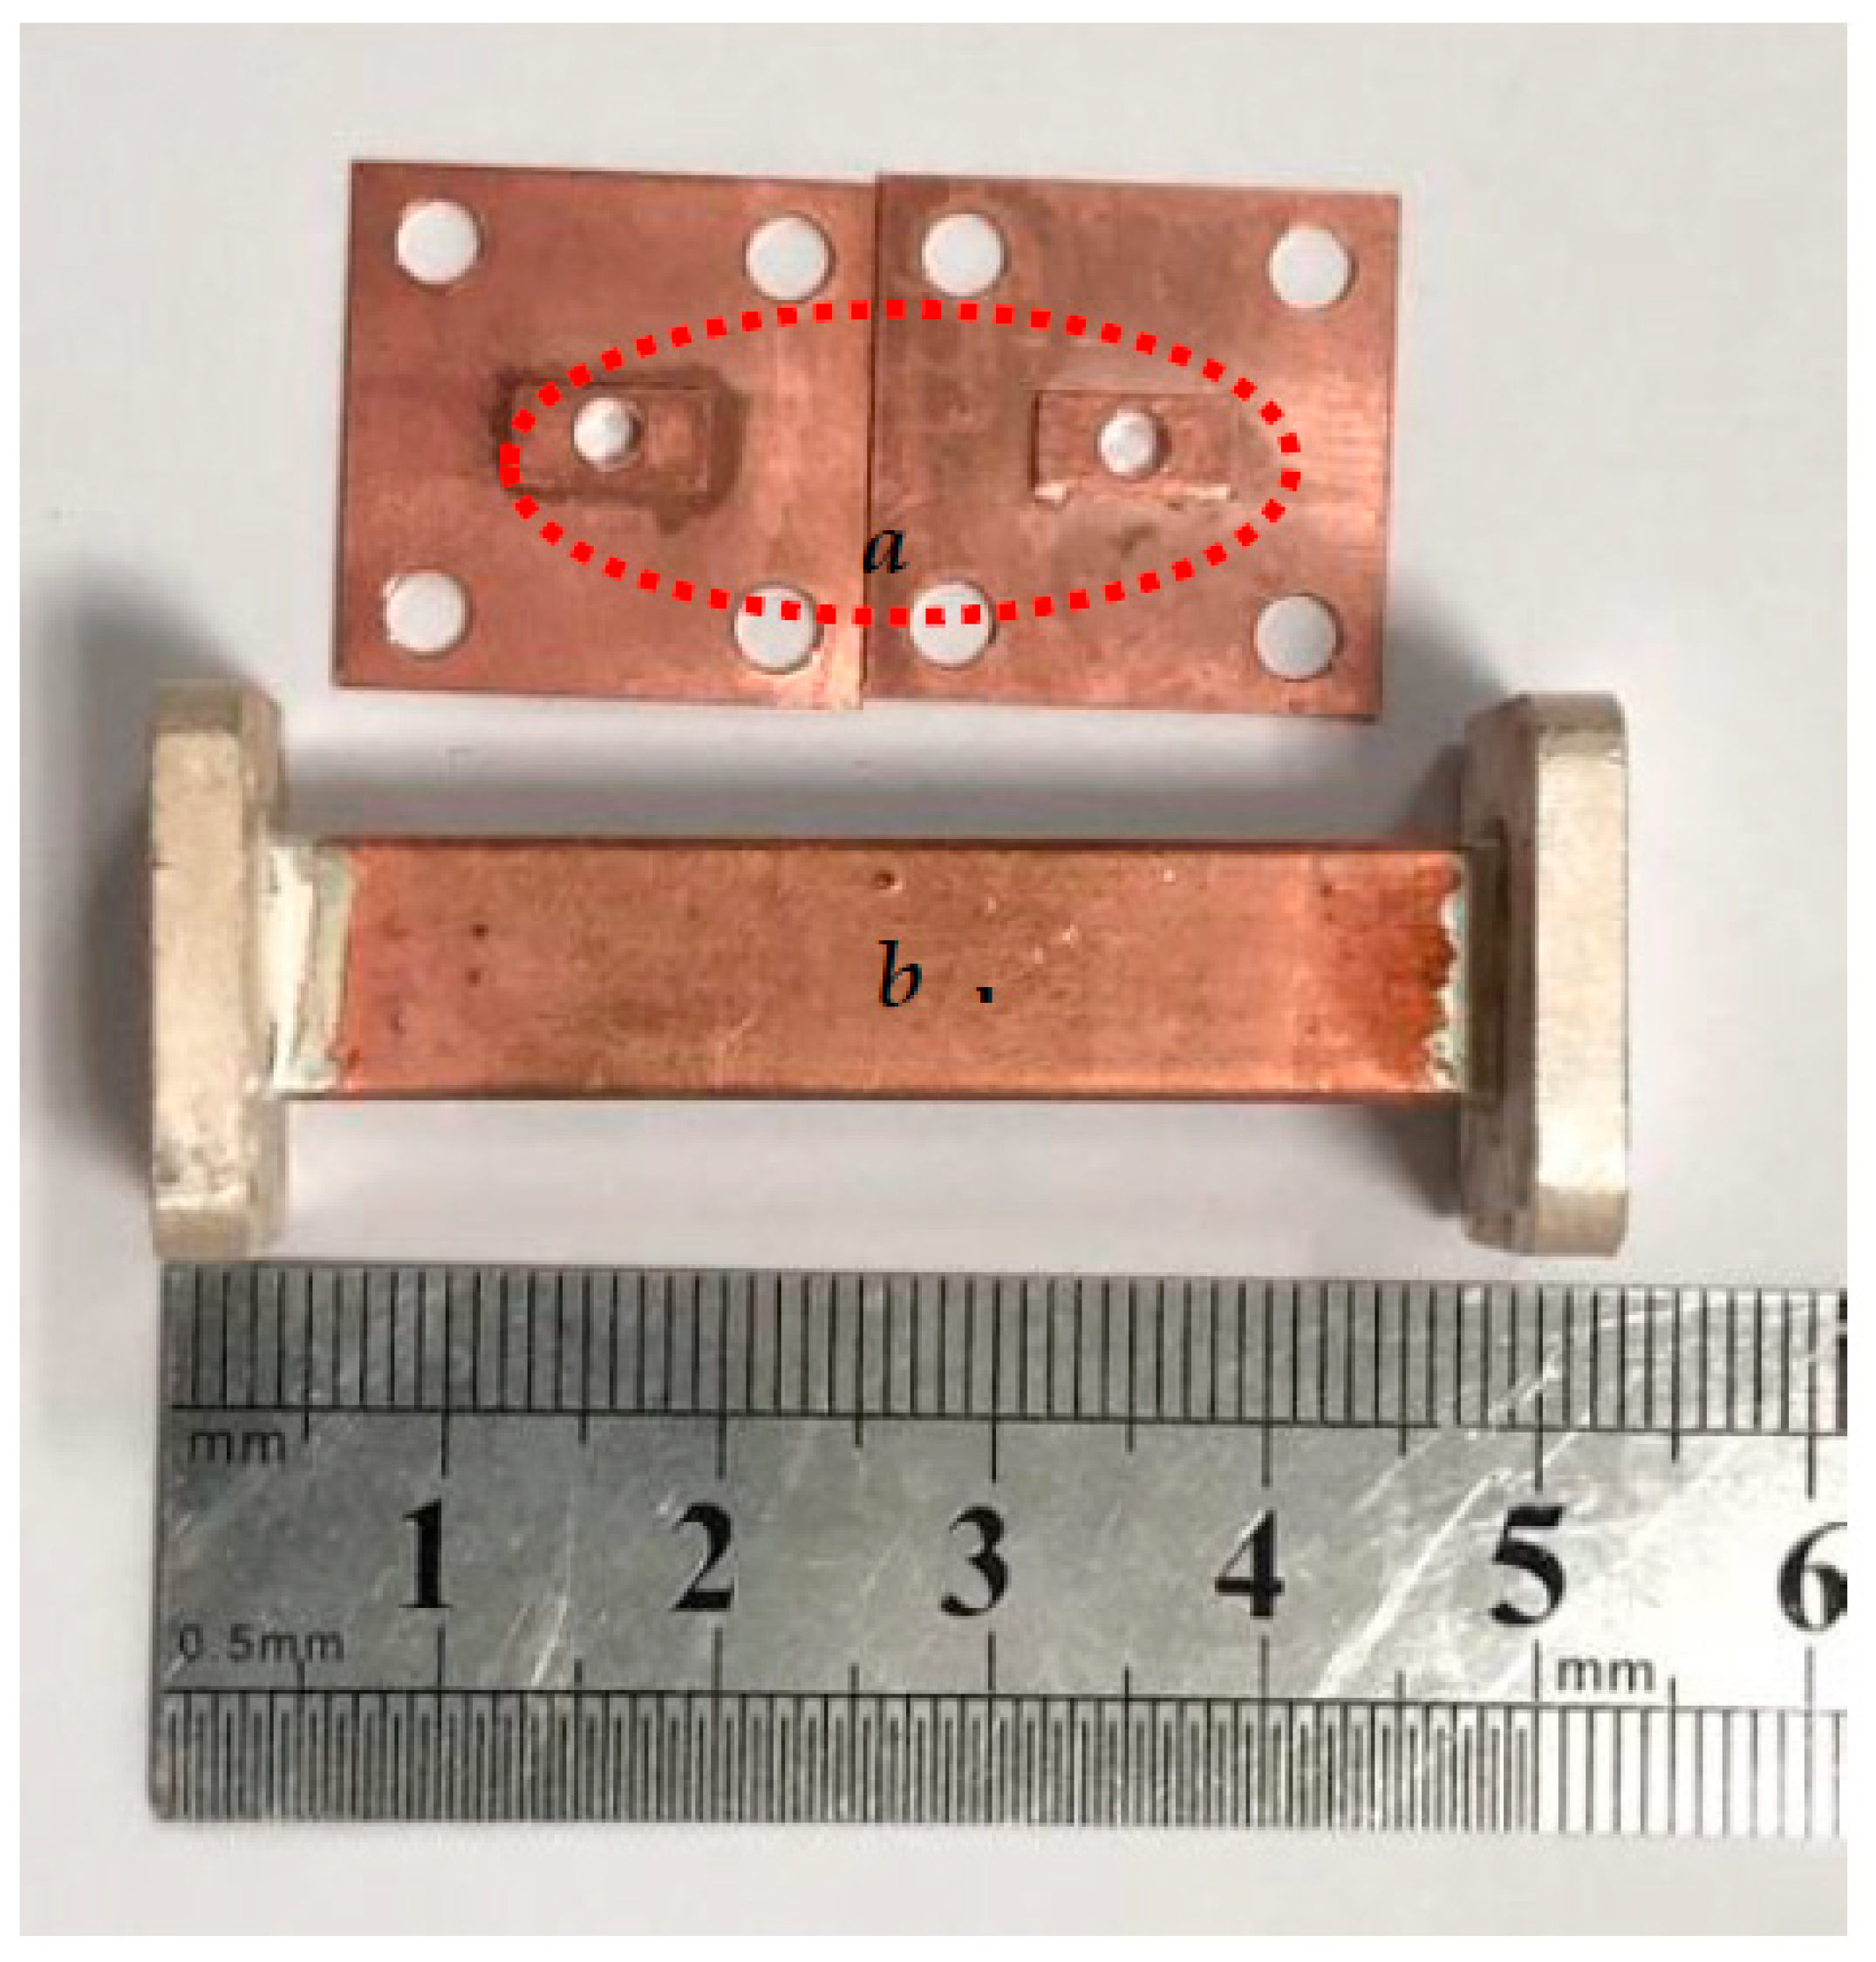
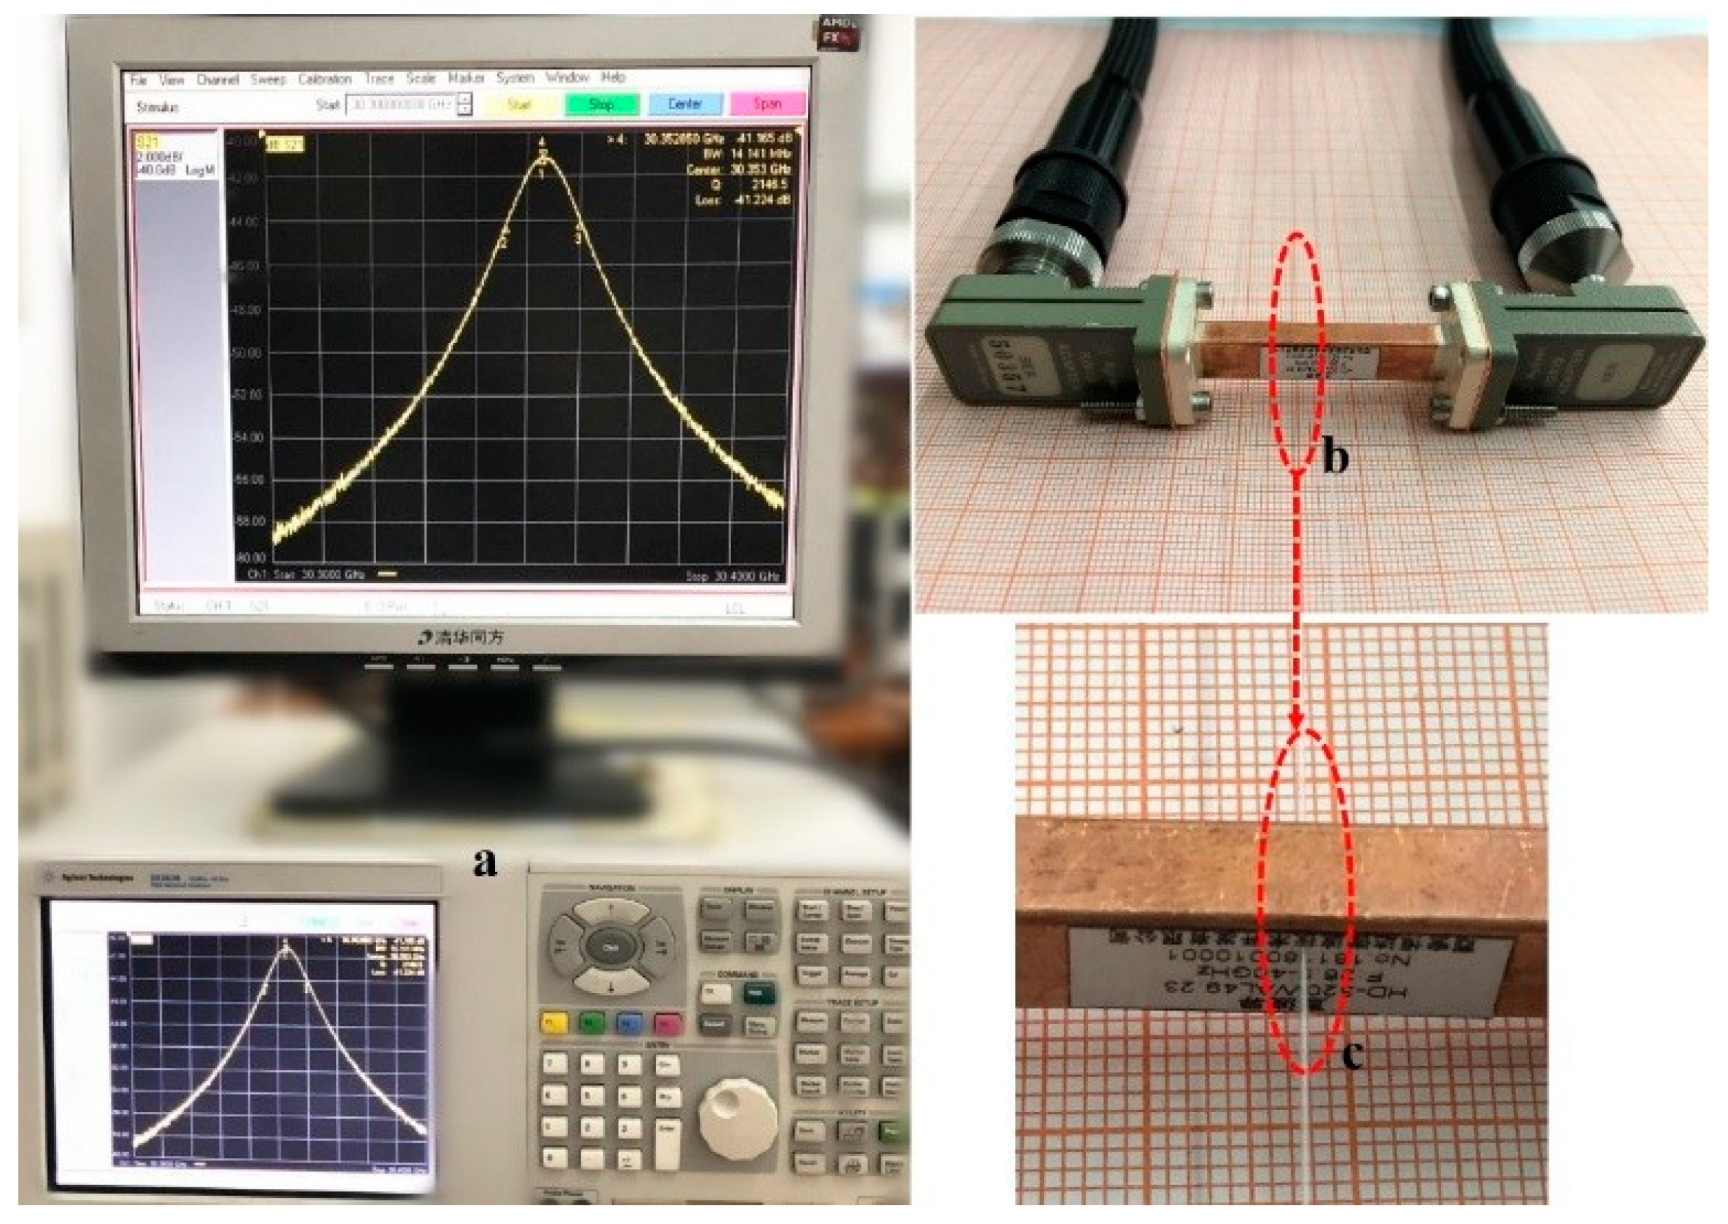
3. Experimental Verification

In order to obtain the complex permittivity of a single cell at the Ka-band, the revised cavity perturbation method proposed above and Hanai’s mixed formula are used in this paper. A rectangular cavity resonator is designed and fabricated using a standard WR-28 waveguide at the Ka-band with an inner dimension of 7.11 mm × 3.56 mm. Depending upon the modes to be propagated, the length has been taken at 48.56 mm. The rectangular waveguide cavity is connected to the two ports of the Agilent E8363B PNA Network Analyzer S-parameter test set of the measuring system. As shown in Figure 4, the coupling structure of the upper portion of the rectangular waveguide is used to realize a resonant frequency of 30.35 GHz, which operates the TE107 mode in the resonant cavity. The structural dimensions of the rectangular waveguide and the dimensions of the coupling structure are shown in Table 1.
The calibrated vector network analyzer (Agilent’s E8363B) is set to transmit the measurement mode (S21). At the same time, in order to achieve narrow-band accurate measurement, we selected 30.30–30.40 GHz for the TE107 mode and the 1601 scanning point in the 100 MHz range as the measurement bandwidth. Figure 5 shows the complete measurement setup with the inserted capillary tube at the location of (a/16, l/2) of the WR-28 rectangular cavity. The inner radius of the capillary is about 0.12 mm, and the volume of the sample is about 0.16 μL.
In order to verify the stability of the proposed cavity perturbation measurement system, anhydrous alcohol was measured as a standard sample. The complex dielectric parameters of different concentrations of alcohol solution were measured using the proposed cavity perturbation method. Each kind of alcohol solution was repeatedly measured five times, and then the real and imaginary parts of the complex dielectric parameters of different concentrations were calculated using the proposed cavity perturbation Equations (3) and (4). The results show that for the alcohol solution, the complex dielectric parameters show a regular change with the increase of water content. Figure 6 shows the S21 curve of the different concentrations of anhydrous alcohol solution obtained by the measurement system, and Table 2 shows the frequency shift and Q-factor of the different concentrations of anhydrous alcohol solution obtained by the measurement system. Figure 7 shows the measurement data of the real and imaginary part of the complex dielectric parameters of different concentrations of alcohol solution. The measurement data were the average of the five measurement results, and the error bar represents the standard deviation. As the water content increases, the S21 curve of the anhydrous alcohol solution becomes more and more gradual, the frequency shift becomes larger, and the Q-factor becomes smaller, which means that the absorption of the electric field by the solution becomes larger—that is, the imaginary part of the complex dielectric parameter becomes larger. The result shows that as the water content increases, the real and imaginary parts of the complex dielectric parameters of the alcohol solution increase.
According to the Debye model of the complex permittivity of anhydrous alcohol, the real part of the complex dielectric parameter of anhydrous alcohol is 3.360, and the imaginary part is 1.113 in the measurement frequency range [40]. The revised resonant cavity perturbation method for the measurement of the complex permittivity of anhydrous alcohol is 3.842 for the real part and 1.128 for the imaginary part. The measurement results of anhydrous alcohol solution show that the revised resonant cavity perturbation complex dielectric parameter measurement system has high stability and accuracy.
Theoretical and simulation results show that the proposed cavity perturbation method is especially suitable for high loss and high dielectric parameter materials, such as the measurement of complex dielectric parameters of biological materials. Different from the traditional cavity perturbation method, the proposed cavity perturbation method can realize the measurement of complex dielectric parameters of high-loss materials by changing the position of high-loss materials in the cavity and the corresponding proposed perturbation equation. Based on the above theoretical and simulation analysis, we designed and fabricated a rectangular resonator working in the Ka-band to measure the complex dielectric parameters of two cancer cells (Breast-MDA231, Uveal melanoma). Based on Hanai’s mixed solution formula, we obtained the complex dielectric parameters of individual cancer cells.

4. Measurement Results of Two Types of Cancer Cells

Two different cancer cells (Breast-MDA231, Uveal melanoma) are obtained from School of Life Science and Technology, University of Electronic Science and Technology of China. The Breast-MDA231 and Uveal melanoma cells were isolated from the culture dishes using standard adherent cell isolation protocols. Then, the separated cells were counted under the microscope, and the average size of the cells was evaluated. Finally, the cells were placed in the phosphate buffer saline (PBS) solution and centrifuged for 5 min at 900 rpm to form the cell suspension. The volume of pellets was measured, and the density of the mixture was calculated. The diameters of a typical breast cancer cell and melanoma cell are 30 μm and 25 μm, respectively. The number of cells in 2 μL is 5.3 × 10³, and the final cell volume fraction is 0.037 and 0.021, respectively. A syringe pump was used to draw cancer cells in bulk into 10 micro-tubes. The complex permittivity of a single cell was calculated using Equation (7) after the measurement of the mixture cell and medium.
The complex dielectric parameters of two cancer cells (Breast-MDA231, Uveal melanoma) were measured using the proposed resonant cavity perturbation complex dielectric parameter measurement system. Three discrete resonant frequency points of the Ka-band are used for measurement, and the structural parameters of each rectangular cavity are shown in Table 3. All measurements are narrowband scanning to improve the measurement accuracy. The measurement procedure was performed as follows:
(1)
An empty capillary tube was inserted at the position of a/16 close to the wall of the cavity, where a is the wide side of the WR28 rectangular waveguide. Unloaded measurements of resonant frequency (f0) and quality factor (Q0) were obtained and measured, the inner diameter of the capillary is small, and the entire measurement time is very short. Therefore, it can be assumed that the liquid sample is not volatilized, and the volume does not change during the entire measurement process.
(2)
The standard sample liquid anhydrous alcohol is filled in the capillary tube with an inner diameter of 0.12 mm and then sealed. The resonance frequency (fs) and loaded quality factor (Qs) are measured and recorded.
(3)
Suspended cancer cells with the volume of 0.16 μL were filled in the capillary tube and then inserted at the same location for measurements. The resonance frequency (fmix) and loaded quality factor (Qmix) are measured and recorded.
(4)
The same process is used to measure the medium(solvent) without cancer cells. The resonance frequency (fm) and loaded quality factor (Qm) are measured and recorded.
(5)
Measurements were performed on two different cancer cell samples. The full test duration of each sample was less than 15 s to avoid heating effects.
(6)
With the utilization of Hanai’s mixed formula, the complex permittivity of a single cell can be calculated from the measurement data of the mixture cell/medium and medium solution.
The whole measurement process was performed at a room temperature of 25 °C and humidity of 69%. Each test was performed five times and then averaged as the final result. Coupled thermometers and humidity were used to make sure that there was no change in the temperature and humidity during the whole measurement process.
We measured the complex dielectric parameters of various mixed solutions using a modified resonant cavity perturbation complex dielectric parameter measurement system after calibration. The complex dielectric constants of two different cancer cells were measured. The complex permittivity of a single cell has been calculated by measuring the dielectric parameters of the medium containing a certain amount of cells. Using Hanai’s mixed formula, the complex permittivity of two kinds of cancer cells can be derived accurately. Due to the large number of cells in the capillary, we can consider that the measured and derived data are statistically valid.
In our work, the complex dielectric parameters of two cancer cells (Breast-MDA231 and Uveal melanoma) were measured at the Ka-band. The results are shown in Table 4. For the two types of cancer cells, the real and imaginary parts of the complex permittivity showed a small decrease as the frequency increased. At the same time, we also noticed that the real and imaginary parts of the complex permittivity of two types of cancer cells show a small difference at the same frequency. The difference of the imaginary part is more obvious than that of the real part, which can provide the possibility of characterization and detection of one cancer type from the other. The complex dielectric parameters of the Ka-band single cells are numerically close to the complex dielectric parameters of deionized water, which can be explained by water as the main component of the cell.

5. Conclusions

In the above, we have introduced the basic principle of the improved rectangular resonator perturbation method, and we also designed and processed a test device based on this principle. In order to verify the effectiveness of the measurement device, we measured the complex dielectric parameters of different concentrations of alcohol solutions. The results show that compared with the traditional perturbation method, the improved perturbation method has higher accuracy when measuring large dielectric parameters and high-loss materials. We conducted a series of experiments to reduce artificial error. The results show that the improved cavity perturbation method has higher accuracy when measuring high loss, high dielectric parameters of biological materials.
In our work, complex dielectric parameters were determined using the revised cavity perturbation method in the Ka-band for the first time, which provided a possibility for cell identification and differentiation techniques. Using a small amount of high-loss biomaterials and high-precision cavity perturbation techniques, we determined the complex dielectric parameters of living cancer cells. The results of this study show that in the Ka-band, the dielectric constant of cancer cells is between 8 and 15, and the dielectric loss is between 24 and 31. Cancer cells are high-loss biological materials. Moreover, the complex dielectric parameters of cancer cells did not change significantly within the range of the Ka-band.
The determination of complex dielectric parameters of different cancer cells can realize the detection, identification, and differentiation of cancer cells in a microfluidic system. In addition, the dielectric properties of cells can also be used to model cells. Since cells are a high-loss material, this property can be applied in the fields of cell ablation and cancer treatment in the future.

Author Contributions

Conceptualization, J.M.; Funding acquisition, Y.G.; Methodology, J.M., J.T., K.W., L.G. and H.J.; Resources, Q.X.; Supervision, B.Z. and Y.G.; Writing—original draft, J.M.; Writing—review and editing, Z.W. and S.W. All authors have read and agreed to the published version of the manuscript.

Funding

This research received no external funding.

Acknowledgments

This work is supported by National Natural Science Foundation of China (Grant Nos. 61921002) and Cooperation Project of Sichuan (Grant No 2018HH0132).

Conflicts of Interest

The authors declare no conflict of interest.

References

  1. Kraszewski, A.W.; Trabelsi, S.; Nelson, S.O. Moisture content determination in grain by measuring microwave parameters. Meas. Sci. Technol. 1997, 8, 857–863. [Google Scholar] [CrossRef]
  2. Chen, L.-F.; Ong, C.; Neo, C.; Varadan, V.; Varadan, V.K. Microwave Electronics: Measurement and Materials Characterization; John Wiley & Sons, Inc.: Hoboken, NJ, USA, 2004. [Google Scholar]
  3. Nelson, S.; Trabelsi, S. A century of grain and seed moisture measurement by sensing electrical properties. Trans. ASABE 2012, 55, 629–636. [Google Scholar] [CrossRef]
  4. Duhamel, F.; Huynen, I.; Vander Vorst, A. Measurements of complex permittivity of biological and organic liquids up to 110 GHz. In Proceedings of the 1997 IEEE MTT-S International Microwave Symposium Digest, Denver, CO, USA, 8–13 June 1997; pp. 107–110. [Google Scholar]
  5. Michel, E.; Hernandez, D.; Lee, S.Y. Electrical conductivity and permittivity maps of brain tissues derived from water content based on T1-weighted acquisition. Magn. Reson. Med. 2017, 77, 1094–1103. [Google Scholar] [CrossRef] [PubMed]
  6. Peyman, A.; Kos, B.; Djokic, M.; Trotovsek, B.; Limbaeck-Stokin, C.; Sersa, G.; Miklavcic, D. Variation in dielectric properties due to pathological changes in human liver. Bioelectromagnetics 2015, 36, 603–612. [Google Scholar] [CrossRef] [PubMed]
  7. Semenov, S.; Huynh, T.; Williams, T.; Nicholson, B.; Vasilenko, A. Dielectric properties of brain tissue at 1 GHz in acute ischemic stroke: Experimental study on swine. Bioelectromagnetics 2017, 38, 158–163. [Google Scholar] [CrossRef]
  8. Minerick, A.R.; Zhou, R.; Takhistov, P.; Chang, H.C. Manipulation and characterization of red blood cells with alternating current fields in microdevices. Electrophoresis 2003, 24, 3703–3717. [Google Scholar] [CrossRef]
  9. Bharati, S.; Rishi, P.; Tripathi, S.K.; Koul, A. Changes in the electrical properties at an early stage of mouse liver carcinogenesis. Bioelectromagnetics 2013, 34, 429–436. [Google Scholar] [CrossRef]
  10. Bouazizi, A.; Zaibi, G.; Samet, M.; Kachouri, A. Parametric study on the dielectric properties of biological tissues. In Proceedings of the 2015 16th International Conference on Sciences and Techniques of Automatic Control and Computer Engineering (STA), Monastir, Tunisia, 21–23 December 2015; pp. 54–57. [Google Scholar]
  11. Kwon, H.; Guasch, M.; Nagy, J.A.; Rutkove, S.B.; Sanchez, B. New electrical impedance methods for the in situ measurement of the complex permittivity of anisotropic skeletal muscle using multipolar needles. Sci. Rep. 2019, 9, 3145. [Google Scholar] [CrossRef] [Green Version]
  12. Yang, L.; Zhang, G.; Song, J.; Dai, M.; Xu, C.; Dong, X.; Fu, F. Ex-Vivo Characterization of Bioimpedance Spectroscopy of Normal, Ischemic and Hemorrhagic Rabbit Brain Tissue at Frequencies from 10 Hz to 1 MHz. Sensors 2016, 16, 1942. [Google Scholar] [CrossRef] [Green Version]
  13. Chen, T.; Artis, F.; Dubuc, D.; Fournie, J.; Poupot, M.; Grenier, K. Microwave biosensor dedicated to the dielectric spectroscopy of a single alive biological cell in its culture medium. In Proceedings of the 2013 IEEE MTT-S International Microwave Symposium Digest (MTT), Seattle, WA, USA, 2–7 June 2013; pp. 1–4. [Google Scholar]
  14. Chen, T.; Dubuc, D.; Poupot, M.; Fournié, J.-J.; Grenier, K. Broadband discrimination of living and dead lymphoma cells with a microwave interdigitated capacitor. In Proceedings of the 2013 IEEE Topical Conference on Biomedical Wireless Technologies, Networks, and Sensing Systems, Austin, TX, USA, 20–23 January 2013; pp. 64–66. [Google Scholar]
  15. Ko, J.; Carpenter, E.; Issadore, D. Detection and isolation of circulating exosomes and microvesicles for cancer monitoring and diagnostics using micro-/nano-based devices. Analyst 2016, 141, 450–460. [Google Scholar] [CrossRef] [Green Version]
  16. Morgan, H.; Sun, T.; Holmes, D.; Gawad, S.; Green, N.G. Single cell dielectric spectroscopy. J. Phys. D Appl. Phys. 2007, 40, 61–70. [Google Scholar] [CrossRef]
  17. Zhou, Y.; Basu, S.; Laue, E.; Seshia, A.A. Single cell studies of mouse embryonic stem cell (mESC) differentiation by electrical impedance measurements in a microfluidic device. Biosens Bioelectron. 2016, 81, 249–258. [Google Scholar] [CrossRef] [PubMed] [Green Version]
  18. Alekseev, S.I.; Ziskin, M.C. Human skin permittivity determined by millimeter wave reflection measurements. Bioelectromagnetics 2007, 28, 331–339. [Google Scholar] [CrossRef] [PubMed]
  19. Seo, S.; Stintzing, T.; Block, I.; Pavlidis, D.; Rieke, M.; Layer, P.G. High frequency wideband permittivity measurements of biological substances using coplanar waveguides and application to cell suspensions. In Proceedings of the 2008 IEEE MTT-S International Microwave Symposium Digest, Atlanta, GA, USA, 15–20 June 2008; pp. 915–918. [Google Scholar]
  20. Sun, T.; Morgan, H. Single-cell microfluidic impedance cytometry: A review. Microfluid. Nanofluidics 2010, 8, 423–443. [Google Scholar] [CrossRef]
  21. Chen, W.; Dubuc, D.; Grenier, K. Microwave dielectric spectroscopy of a single biological cell with improved sensitivity up to 40 GHz. In Proceedings of the 2015 IEEE MTT-S International Microwave Symposium, Phoenix, AZ, USA, 17–22 May 2015; pp. 1–3. [Google Scholar]
  22. Jylhä, L. Modeling of Electrical Properties of Composites. 2008. Available online: https://aaltodoc.aalto.fi/handle/123456789/4583 (accessed on 8 February 2020).
  23. Stiharu, I.; Alazzam, A.; Nerguizian, V.; Roman, D. Single living cell manipulation and identification using microsystems technologies. Microsyst. Nanoeng. 2015, 1, 1–8. [Google Scholar] [CrossRef] [Green Version]
  24. Waldron, R.A. Perturbation theory of resonant cavities. Proc. IEE-Part C Monogr. 1960, 107, 272–274. [Google Scholar] [CrossRef]
  25. Buravov, L.; Shchegolev, I. Method of conductivitry measurement on small crystals at frequency 10ˆ10 HZ. Exp. Tech 1971, 14, 528–531. [Google Scholar]
  26. Klein, O.; Donovan, S.; Dressel, M.; Grüner, G. Microwave cavity perturbation technique: Part I: Principles. Int. J. Infrared Millim. Waves 1993, 14, 2423–2457. [Google Scholar] [CrossRef]
  27. Donovan, S.; Klein, O.; Dressel, M.; Holczer, K.; Grüner, G. Microwave cavity perturbation technique: Part II: Experimental scheme. Int. J. Infrared Millim. Waves 1993, 14, 2459–2487. [Google Scholar] [CrossRef]
  28. Dressel, M.; Klein, O.; Donovan, S.; Grüner, G. Microwave cavity perturbation technique: Part III: Applications. Int. J. Infrared Millim. Waves 1993, 14, 2489–2517. [Google Scholar] [CrossRef]
  29. Chang, K.; Wiley, J. Encyclopedia of RF and Microwave Engineering; Wiley-Interscience: Hoboken, NJ, USA, 2005. [Google Scholar]
  30. Grimnes, S.; Martinsen, O. Bioimpedance and Bioelectricity Basics; Academic Press: Cambridge, MA, USA, 2000. [Google Scholar]
  31. Kraszewski, A.W.; Nelson, S.O. Observations on resonant cavity perturbation by dielectric objects. IEEE Trans. Microw. Theory Tech. 1992, 40, 151–155. [Google Scholar] [CrossRef]
  32. Lakhtakia, A.; Varadan, V.K.; Varadan, V.V. Time-Harmonic Electromagnetic Fields in Chiral Media; Springer: Berlin/Heidelberg, Germany, 1989. [Google Scholar]
  33. Akyel, C.; Bosisio, R.G. New developments on automated-active circuits for permittivity measurements at microwave frequencies. IEEE Trans. Instrum. Meas. 1989, 38, 496–504. [Google Scholar] [CrossRef]
  34. Lin, M.; Afsar, M.N. A new cavity perturbation technique for accurate measurement of dielectric parameters. In Proceedings of the 2006 IEEE MTT-S International Microwave Symposium Digest, San Francisco, CA, USA, 11–16 June 2006; pp. 1630–1633. [Google Scholar]
  35. Gresits, I.; Thuróczy, G.; Sági, O.; Homolya, I.; Bagaméry, G.; Gajári, D.; Babos, M.; Major, P.; Márkus, B.; Simon, F. A highly accurate determination of absorbed power during magnetic hyperthermia. J. Phys. D Appl. Phys. 2019, 52, 375–401. [Google Scholar] [CrossRef] [Green Version]
  36. Gyüre, B.; Márkus, B.; Bernáth, B.; Murányi, F.; Simon, F. A time domain based method for the accurate measurement of Q-factor and resonance frequency of microwave resonators. J. Phys. D Appl. Phys. 2015, 86, 094702. [Google Scholar] [CrossRef] [PubMed] [Green Version]
  37. Gyüre-Garami, B.; Sági, O.; Márkus, B.; Simon, F. A highly accurate measurement of resonator Q-factor and resonance frequency. Rev. Sci. Instrum. 2018, 89, 113903. [Google Scholar] [CrossRef] [Green Version]
  38. Taylor, L. Dielectric properties of mixtures. IEEE Trans. Antennas Propag. 1965, 13, 943–947. [Google Scholar] [CrossRef]
  39. Hanai, T.; Asami, K.; Koizumi, N. Dielectric Theory of Concentrated Suspensions of Shell-Spheres in Particular Reference to the Analysis of Biologica Cell Suspensions. 1979. Available online: https://repository.kulib.kyoto-u.ac.jp/dspace/bitstream/2433/76842/1/chd057_4_297.pdf (accessed on 20 December 2019).
  40. Meriakri, V.; Chigrai, E. Determination of alcohol and sugar content in water solutions by means of microwave. In Proceedings of the Fifth International Kharkov Symposium on Physics and Engineering of Microwaves, Millimeter, and Submillimeter Waves, Kharkov, Ukraine, 21–26 June 2004; pp. 821–823. [Google Scholar]
Figure 1. (a) The xoz plane view of the rectangular cavity; (b) the xoy plane view of the rectangular cavity.
Electronics 09 01200 g001
Figure 2. The simulation diagram of a rectangular cavity based on the WR-28 rectangular waveguide. (a) n = 16, (b) n = 2.
Electronics 09 01200 g002
Figure 3. (a) Revised results and unrevised calculated results when the real part of complex permittivity changes from 20 to 80 (with a loss tangent of 0.25); (b) Revised and unrevised calculated results of dielectric loss tangent relative error when the real part of complex permittivity changes from 20 to 80 (with a loss tangent of 0.25).
Electronics 09 01200 g003
Figure 4. (a) The fabricated coupling structure and (b) The rectangular waveguide of WR-28.
Electronics 09 01200 g004
Figure 5. The experiment setup for the measurement. (a) Agilent E8368B PNA Network analyzer (the markers on the S21 trace are for the peak (resonant) frequency and the –3 dB bandwidth); (b) Ka-band resonant cavity; (c) capillary with sample.
Electronics 09 01200 g005
Figure 6. The measured S21 curve of the different concentrations of alcohol solution.
Electronics 09 01200 g006
Figure 7. The measurement data of real (a) and imaginary (b) part of the complex dielectric parameters of different concentrations of alcohol solution.
Electronics 09 01200 g007
Table 1. Structural parameters of the resonant cavity for simulation.
Cavity ModeTE107
Length of cavity 48.60 mm
Resonant frequency30.13 GHz
Diameter of the coupling hole2.40 mm
The volume of cavity1.23 × 103 mm3
The volume of sample0.16 mm3
Table 2. The resonant frequency and Q-factor of the different concentrations of alcohol solution.
MaterialFrequency Shift (MHz)Q-Factor
Empty--2463.8
0% (Deionized water)9.833569.46
10%6.458720.15
20%5.252838.20
30%4.7771014.6
40%4.4311151.0
50%3.4751325.7
60%3.1911447.4
70%2.8371641.1
80%2.7501842.5
90%2.0672006.8
100% (alcohol)2.1102174.4
Table 3. Structural parameters of the resonant cavity for fabrication and measurement.
Cavity ModeTE105TE107TE109
Length of cavity48.7 mm48.7 mm48.7 mm
Resonant frequency26.58 GHz30.35 GHz35.11 GHz
Diameter of the coupling hole2.6 mm2.4 mm3.0 mm
Table 4. Dielectric constant and dielectric loss of Breast-MDA231 and Uveal melanoma at the Ka-band.
FrequencyBreast-MDA231Uveal Melanoma
ε ε ε ε
26.6 GHz13.8 ± 0.830.3 ± 0.814.6 ± 1.034.3 ± 1.1
30.3 GHz12.6 ± 1.228.2 ± 1.311.2 ± 2.431.6 ± 1.4
35.1 GHz10.3 ± 1.125.7 ± 1.08.2 ± 0.127.5 ± 1.8

