Article

A Combination Strategy of Feature Selection Based on an Integrated Optimization Algorithm and Weighted K-Nearest Neighbor to Improve the Performance of Network Intrusion Detection

1
School of Computer Science, Hubei University of Technology, Wuhan 430068, China
2
Department of Automation, Lublin University of Technology, Nadbystrzycka 36, 20-618 Lublin, Poland
3
Department of Mechanics and Machine Building, University of Economics and Innovations in Lublin, Projektowa 4, 20-209 Lublin, Poland
4
Department of Telecommunications, Lviv Polytechnic National University, Bandery 12, 79013 Lviv, Ukraine
*
Author to whom correspondence should be addressed.
Electronics 2020, 9(8), 1206; https://doi.org/10.3390/electronics9081206
Submission received: 13 June 2020 / Revised: 19 July 2020 / Accepted: 21 July 2020 / Published: 27 July 2020
(This article belongs to the Section Networks)

Abstract

:
With the widespread use of the Internet, network security issues have attracted more and more attention, and network intrusion detection has become one of the main security technologies. As for network intrusion detection, the original data source always has a high dimension and a large amount of data, which greatly influence the efficiency and the accuracy. Thus, both feature selection and the classifier then play a significant role in raising the performance of network intrusion detection. This paper takes the results of classification optimization of weighted K-nearest neighbor (KNN) with those of the feature selection algorithm into consideration, and proposes a combination strategy of feature selection based on an integrated optimization algorithm and weighted KNN, in order to improve the performance of network intrusion detection. Experimental results show that the weighted KNN can increase the efficiency at the expense of a small amount of the accuracy. Thus, the proposed combination strategy of feature selection based on an integrated optimization algorithm and weighted KNN can then improve both the efficiency and the accuracy of network intrusion detection.

1. Introduction

1.1. Background

With the popularization of the Internet, network security issues have attracted more and more attention. As one of the main security technologies, network intrusion detection technology emerges as the times require. There are two basic forms of intrusion detection system, namely the host intrusion detection system and network intrusion detection system. The host intrusion detection system generally takes the log of the operating system as the data source, and some hosts will interact with each other through the active system to obtain intrusion detection information. Using the network intrusion detection system, through monitoring the traffic on the network, the information can be obtained and extracted. Then, the known attack event is matched to determine whether it belongs to the attack event. As for network intrusion detection, both the system log and network data in the system can be analyzed to determine whether the system is attacked. However, not every data can help to filter attack data, so optimizing data might be one of the effective methods to improve the reliability and timeliness of the network intrusion detection system [1,2].
Since the network intrusion detection system mainly uses a large amount of data sourced with a high dimension, and the performance of a classifier depends on the quantity and quality of features used for attack detection and classification, feature selection based on the optimization algorithm promotes the identification of the most significant features for network intrusion detection, while the classifier can also be optimized [3,4,5]. In order to improve the performance of network intrusion detection, this paper tries to solve the problem from the viewpoints of both the feature selection based on the optimization algorithm and the classifier.
The feature selection of data is to retain the features with a greater contribution in the data and remove some redundant features or even noise features. At present, the feature selection is mainly divided into two methods, which are wrapper and filter. As for the wrapper method, Bouzgou et al. [6] proposed an approach combining mutual information and a limit learning machine, and the experiment proves that the proposed method of packaging mutual information is superior to the method of multi-layer perceptron in the calculation efficiency and error difference percentage. As for the filter method, binary transformation of the optimization algorithm has more advantages in solving problems. Particle swarm optimization (PSO) [7] algorithm is a commonly used optimization algorithm which imitates the characteristics of birds foraging in space, in which the points in space move towards the global optimal solution and the local optimal solution, and the moving speed of the points constantly changes according to the point moving speed in space. The use of the PSO algorithm and its variants has solved many problems in network intrusion detection [8], and it seems that nature inspired algorithms may possibly be utilized to help improve the performance of network intrusion detection.
Most of the classification algorithms use the known data to classify the unknown data, so as to get the category with classified data. The traditional method is K-nearest neighbor (KNN) [9]. KNN uses the Euclidean distance between the data as the judgment classification standard to classify the data to be tested, but the data is not always perfectly separated by the lines or faces of space. The support vector machine (SVM) [10] might possibly solve this kind of problem very well. When the categories of data cannot be separated perfectly, the SVM can map the data to a high-dimensional plane, so as to find a plane to separate them. Compared with other classification algorithms, naïve Bayes [11] classification is relatively simple, and its basic idea is that, for the known data to be classified, the probability of each category under this condition can be calculated, so as to determine the category of the data.

1.2. Related Work

Considering the optimization algorithm for feature detection of network intrusion detection, the moth-flame optimization (MFO) [12] algorithm is an intelligent optimization algorithm which originates from the behavior simulation of moth flying around the flame. Nowadays, the MFO algorithm is deeply studied to solve multi-objective problems, unconstrained optimization problems, global optimization problems, and so on [13,14,15,16,17,18]. The MFO algorithm has been proved to be effective in networks [19,20], manufacturing [21], power systems [22,23,24], control [25], energy [26,27,28], reliability analysis [29,30,31], autonomous robot navigation [32], testing [33], photovoltaic modules [34], biomedical science [35,36,37], and so on. The MFO algorithm can then be utilized to optimize and improve the accuracy of the classification algorithm for the purpose of network intrusion detection.
In the MFO algorithm, the moth only updates its position according to its own flame, so it has strong local search ability. However, its global convergence is relatively poor, and it is easy to fall into a local optimum. Xu et al. [38] presented an enhanced moth-flame optimization (EMFO) technique based on cultural learning (CL) and Gaussian mutation (GM), in which CL helps MFO to enhance its searching ability and the operator of GM is introduced to overcome the disadvantage of falling into local optimum. Pelusi et al. [39] proposed an improved MFO algorithm with a hybrid search phase to overcome the degeneration of the global search capability and convergence speed for the original MFO algorithm. Bhesdadiya et al. [40] proposed a hybrid method of the PSO algorithm with the MFO algorithm to extract the quality characteristics of both PSO and MFO.
Majhi et al. [41] introduced the MFO algorithm as a learning algorithm to optimize the feedforward of neural network and to classify the websites. Yu et al. [42] proposed a method to embed a quantum rotation gate and simulated annealing into the MFO algorithm, and validated the method in solving the problems of both feature selection and engineering design. Gupta et al. [43] proposed a modified MFO algorithm based on the navigation method of moths named transverse orientation for the selection of usability features to get an optimal solution. Elaziz et al. [44] introduced an alternative method to create an optimal subset from features that in turn represent the whole features through improving the efficiency of the MFO algorithm in searching for an optimal subset. Pankaja et al. [45] proposed a deep belief network (DBN) method based on the MFO algorithm for plant leaf recognition. Chaithanya et al. [46] applied the MFO algorithm to optimize the random forest (RF) parameters and obtain the optimal number of the regression tree to build an efficient methodology for network intrusion detection.
It seems that the MFO algorithm might possibly be optimized to improve its global convergence for the sake of feature selection, and the integration with the PSO algorithm offers a promising way to improve the performance of network intrusion detection.

1.3. Main Aim

The main aim of this paper is to take the results of classification optimization of weighted KNN with those of feature selection algorithm into consideration, and propose a combination strategy of feature selection based on an integrated optimization algorithm and weighted KNN, in order to improve the performance of network intrusion detection.
The remainder of this paper is organized as follows. Section 2 studies the feature selection based on the MFO algorithm integrating with the PSO algorithm, and presents a binary conversion method for feature selection. Section 3 demonstrates a combination strategy of feature selection based on the integrated optimization algorithm and weighted KNN for the sake of improving the performance of network intrusion detection. Section 4 validates the proposed combination strategy using experiments. Section 5 concludes this paper.

2. Feature Selection Based on an Integrated Optimization Algorithm

2.1. Moth-Flame Optimization (MFO) Algorithm

In the MFO algorithm, the set of moths is defined as M , in which M i is the i-th moth and M i j is the corresponding position of the i-th moth. Additionally, O M is defined as its fitness value.
M = ( M 1 M i ) = ( M 1 M 1 j M i 1 M i j ) .
The set of flames is defined as F , in which F i is the i-th flame and F i j is the corresponding position of the i-th flame. Additionally, O F is defined as its fitness value.
F = ( F 1 F i ) = ( F 1 F 1 j F i 1 F i j ) .
The MFO algorithm can be defined as the global optimal triple shown as follows:
MFO   = ( I , P , T ) ,
I : φ { M , O M } ,
P :   M M ,
T : M { t r u e , f a l s e } .
The description of the MFO algorithm can then be demonstrated as follow:
M = I ( ) w h i l e   T ( M )   i s   e q u a l   t o   f a l s e M = P ( M ) ; E n d
Since the MFO algorithm is inspired by the lateral flight of moths, the moths are updated by the flames as follows:
M i = S ( M i , F j ) ,
S ( M i , F j ) = D i e b t c o s ( 2 π t ) + F j   ,
D i = | F j M i | .
The formula for flame updating is as follows:
f l a m e n o = r o u n d ( N L N 1 T ) ,
where N is the number of initial flames, T is total number of the iterations, and L is current number of the iterations.
The flow of the MFO algorithm is described as follows:
Step 1: M is initialized by Formula (2), and O M is calculated according to M ;
Step 2: The position of M and O M is not changed, and F and O F can be obtained by matching and sequencing M and O M ;
Step 3: According to Formula (8), the number of moths is calculated, and the moths and flames at the end are removed;
Step 4: The distance between the moth and its corresponding D i is calculated by Formula (7);
Step 5: The updated value of each moth is calculated by substituting D i into Formula (6);
Step 6: According to M , calculate O M ;
Step 7: Judge whether the end condition is met. Otherwise, go to Step 2.

2.2. Particle Swarm Optimization (PSO) Algorithm

The PSO algorithm is inspired by the collective flight of birds. The whole bird group seems to move under the control of a center. Assuming that there is only one place in the whole area, the easiest way to find things is to move towards the nearest bird. The PSO algorithm is then proposed, which takes birds in space. Supposing it is a particle, each particle has both social cognitive ability and self-cognitive ability, social cognitive ability and the optimal solution in the whole population, self-cognitive ability, and the optimal solution of the individual to the current position. Each dimension of each particle has its own speed V i = ( v i 1 , v i 2 , , v i j ) T and moving distance X i = ( x i 1 , x i 2 , . . . , x i j ) T , the formulas of updating the speed and the moving distance are as follows.
v i j = v i j + c 1 r a n d ( p b e s t i j x i j ) + c 2 r a n d ( g b e s t j x i j ) ,
x i j = x i j + v i j   ,
where learning factors c 1 and c 2 are generally between [0, 2], r a n d belongs to [0, 1], p b e s t is the historical optimal solution and g b e s t is the global optimal solution.
The flow of the PSO algorithm is as follows:
Step 1: Initialization of random position, population N and its velocity V ;
Step 2: Evaluate the fitness of each particle;
Step 3: For each particle, its current fitness value is compared with its historical optimal fitness value. If it is better, it is taken as p b e s t ;
Step 4: For each particle, its current fitness value is compared with the global optimal fitness value. If it is better, it is taken as g b e s t ;
Step 5: Put p b e s t and g b e s t into Formula (9) to get the velocity V ;
Step 6: Substituting the velocity V into Formula (10) to get a new position;
Step 7: Judge whether the end condition is met, otherwise go to Step 2.

2.3. An Integrated Optimization Algorithm

The principle of the MFO algorithm is to use each moth to make spiral flight around its corresponding flame to find the optimal solution. Considering the fact that the MFO algorithm is poor in the global search ability and easy to fall into the local optimum when it is applied to the feature selection of network intrusion detection, integration with the PSO algorithm may possibly get a better global search ability. Based on this, an optimization algorithm by integrating MFO with PSO (namely PMFO in short) is proposed.
The renewal of moths in the MFO algorithm is to find the optimal solution by spiraling each moth around the flame, and each moth in MFO only converges to its corresponding flame point. So let the moth first move to the direction of the global optimal solution (because each iteration of the flame is sorted according to the fitness value from large to small, so it is the global optimal solution) and the flame corresponding to each particle (since the flame is the historical optimal solution of the first moth), and then use the Formula (6) to do the local search, so that the search range of the moth can be increased and the effect is better. The proposed PMFO algorithm is demonstrated as follows.
Compared with MFO, the position updating mode of PMFO is different. Each moth corresponds to its own speed V i = ( v i 1 , v i 2 , . . . , v i j ) T . The speed updating formula is as follow:
v i j = v i j + c 1 r a n d ( F i j x i j ) + c 2 r a n d ( F 1 j x i j ) .
In which F i j is the historical optimal solution of each moth and F 1 j is the historical optimal solution of all moths up to this generation.
The moth moves first in the direction of F i j and F 0 j , and the updating formula is as follows:
M i j = v i j + M i j .
At this time, the moth has flown forward for a certain distance, and then the updated position of the moth is used. If the result of the moth updating in PMFO is directly converted into binary system, the speed impact or the distance impact will be too large, so that the moth updating will be stopped. Thus, the distance renewal of PMFO moth is changed to the following formula.
D i = | F i M i | / n u m A t t r i b u t e .
In which n u m A t t r i b u t e is the number of features.
In order to alleviate the influence of excessive speed V in PMFO, both upper limit V m a x and lower limit V m i n are set.
M is the moth that flies spirally to find the best solution, with the formula as follows:
M i j = D i × e b t c o s ( 2 p t ) + F i j .
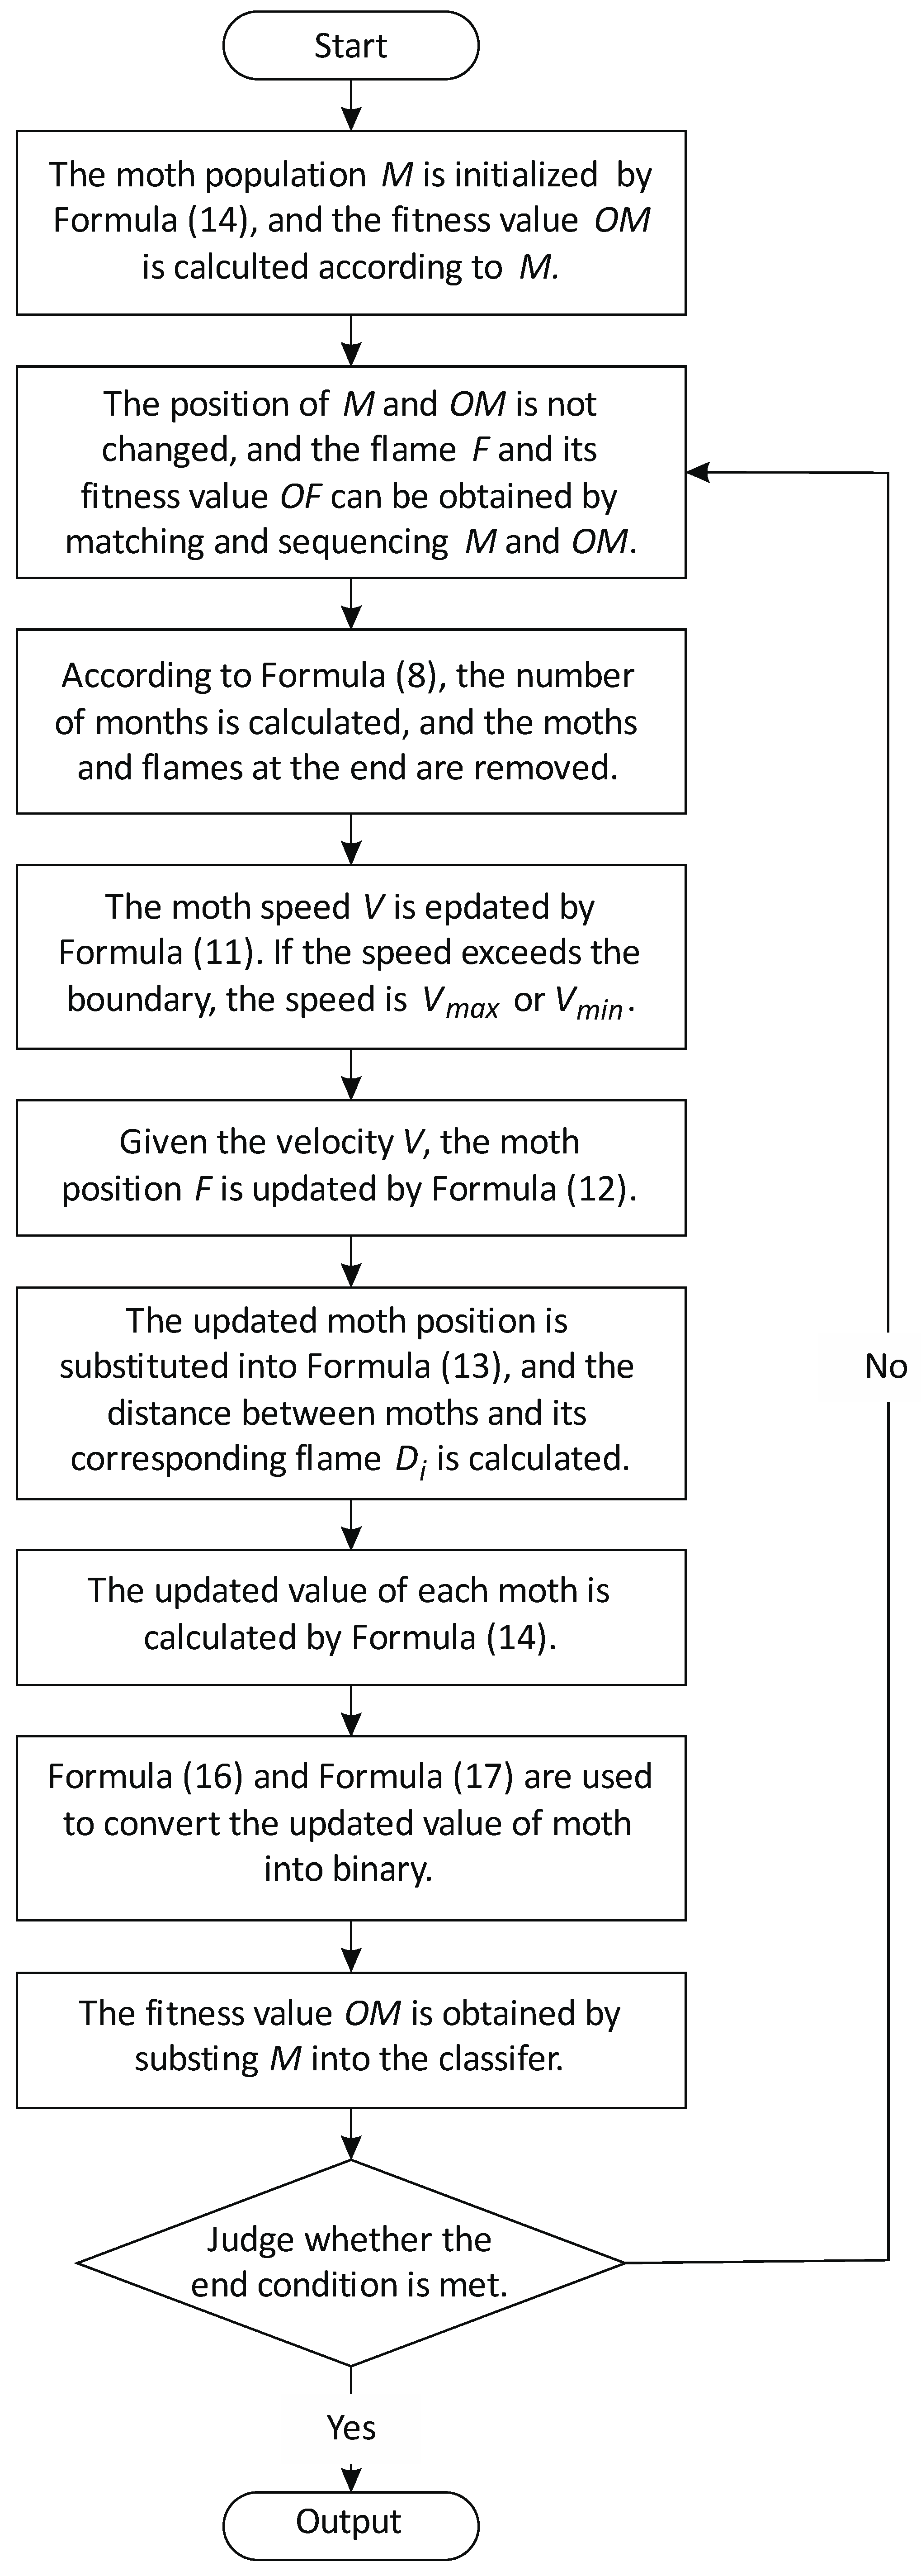
Figure 1 provides the flow chart of proposed PMFO algorithm.
As is shown in Figure 1, the proposed integrated optimization algorithm is described as follows.
Step 1: The moth population M is initialized, and OM is calculated according to M ;
Step 2: The position of M and O M is not changed, and F and its O F can be obtained by matching and sequencing M and OM;
Step 3: According to Formula (8), the number of moths is calculated, and the moths and flames at the end are removed;
Step 4: The moth speed V is updated by Formula (11). If the speed exceeds the boundary, the speed is V m a x or V m i n ;
Step 5: Given the velocity V , the moth position F is updated by Formula (12);
Step 6: The updated moth position is substituted into Formula (13), and the distance between moth and its corresponding D i is calculated;
Step 7: The fitness value O M is obtained by substituting M into the classifier;
Step 8: Judge whether the end condition is met, otherwise go to Step 2.

2.4. Binary Conversion Method for Feature Selection

Since the proposed integrated optimization algorithm cannot be applied in the field of feature selection, a binary conversion method is proposed for feature selection. To do this, the following two principles are needed for the population initialization and the binary conversion.
  • Population initialization
    In a binary algorithm, the value of particle feature can only be 0 or 1, in which 1 means the feature is selected, and 0 means not selected. Generally, 50% probability of feature selection is a common method of population initialization. The initialization function of selected particles is as follow.
    M i j = { 1   r a n d ( ) > 0.5 0   o t h e r w i s e .
  • Binary conversion
    In order to solve the position updating problem of the algorithm above in binary space [47], this paper uses sigmoid function to map the updated real value of moth to [0, 1] to realize the 0 and 1 conversion of moth position. The binary conversion formula is as follows:
    s i g ( M i j ) = 1 1 + e ( M i j ) ,
    M i j = { 1   r a n d ( ) > = s i g ( M i j ) 0   o t h e r w i s e ,
    where M i j is the updated position of moth, and r a n d ( )   is the random number between [0, 1].
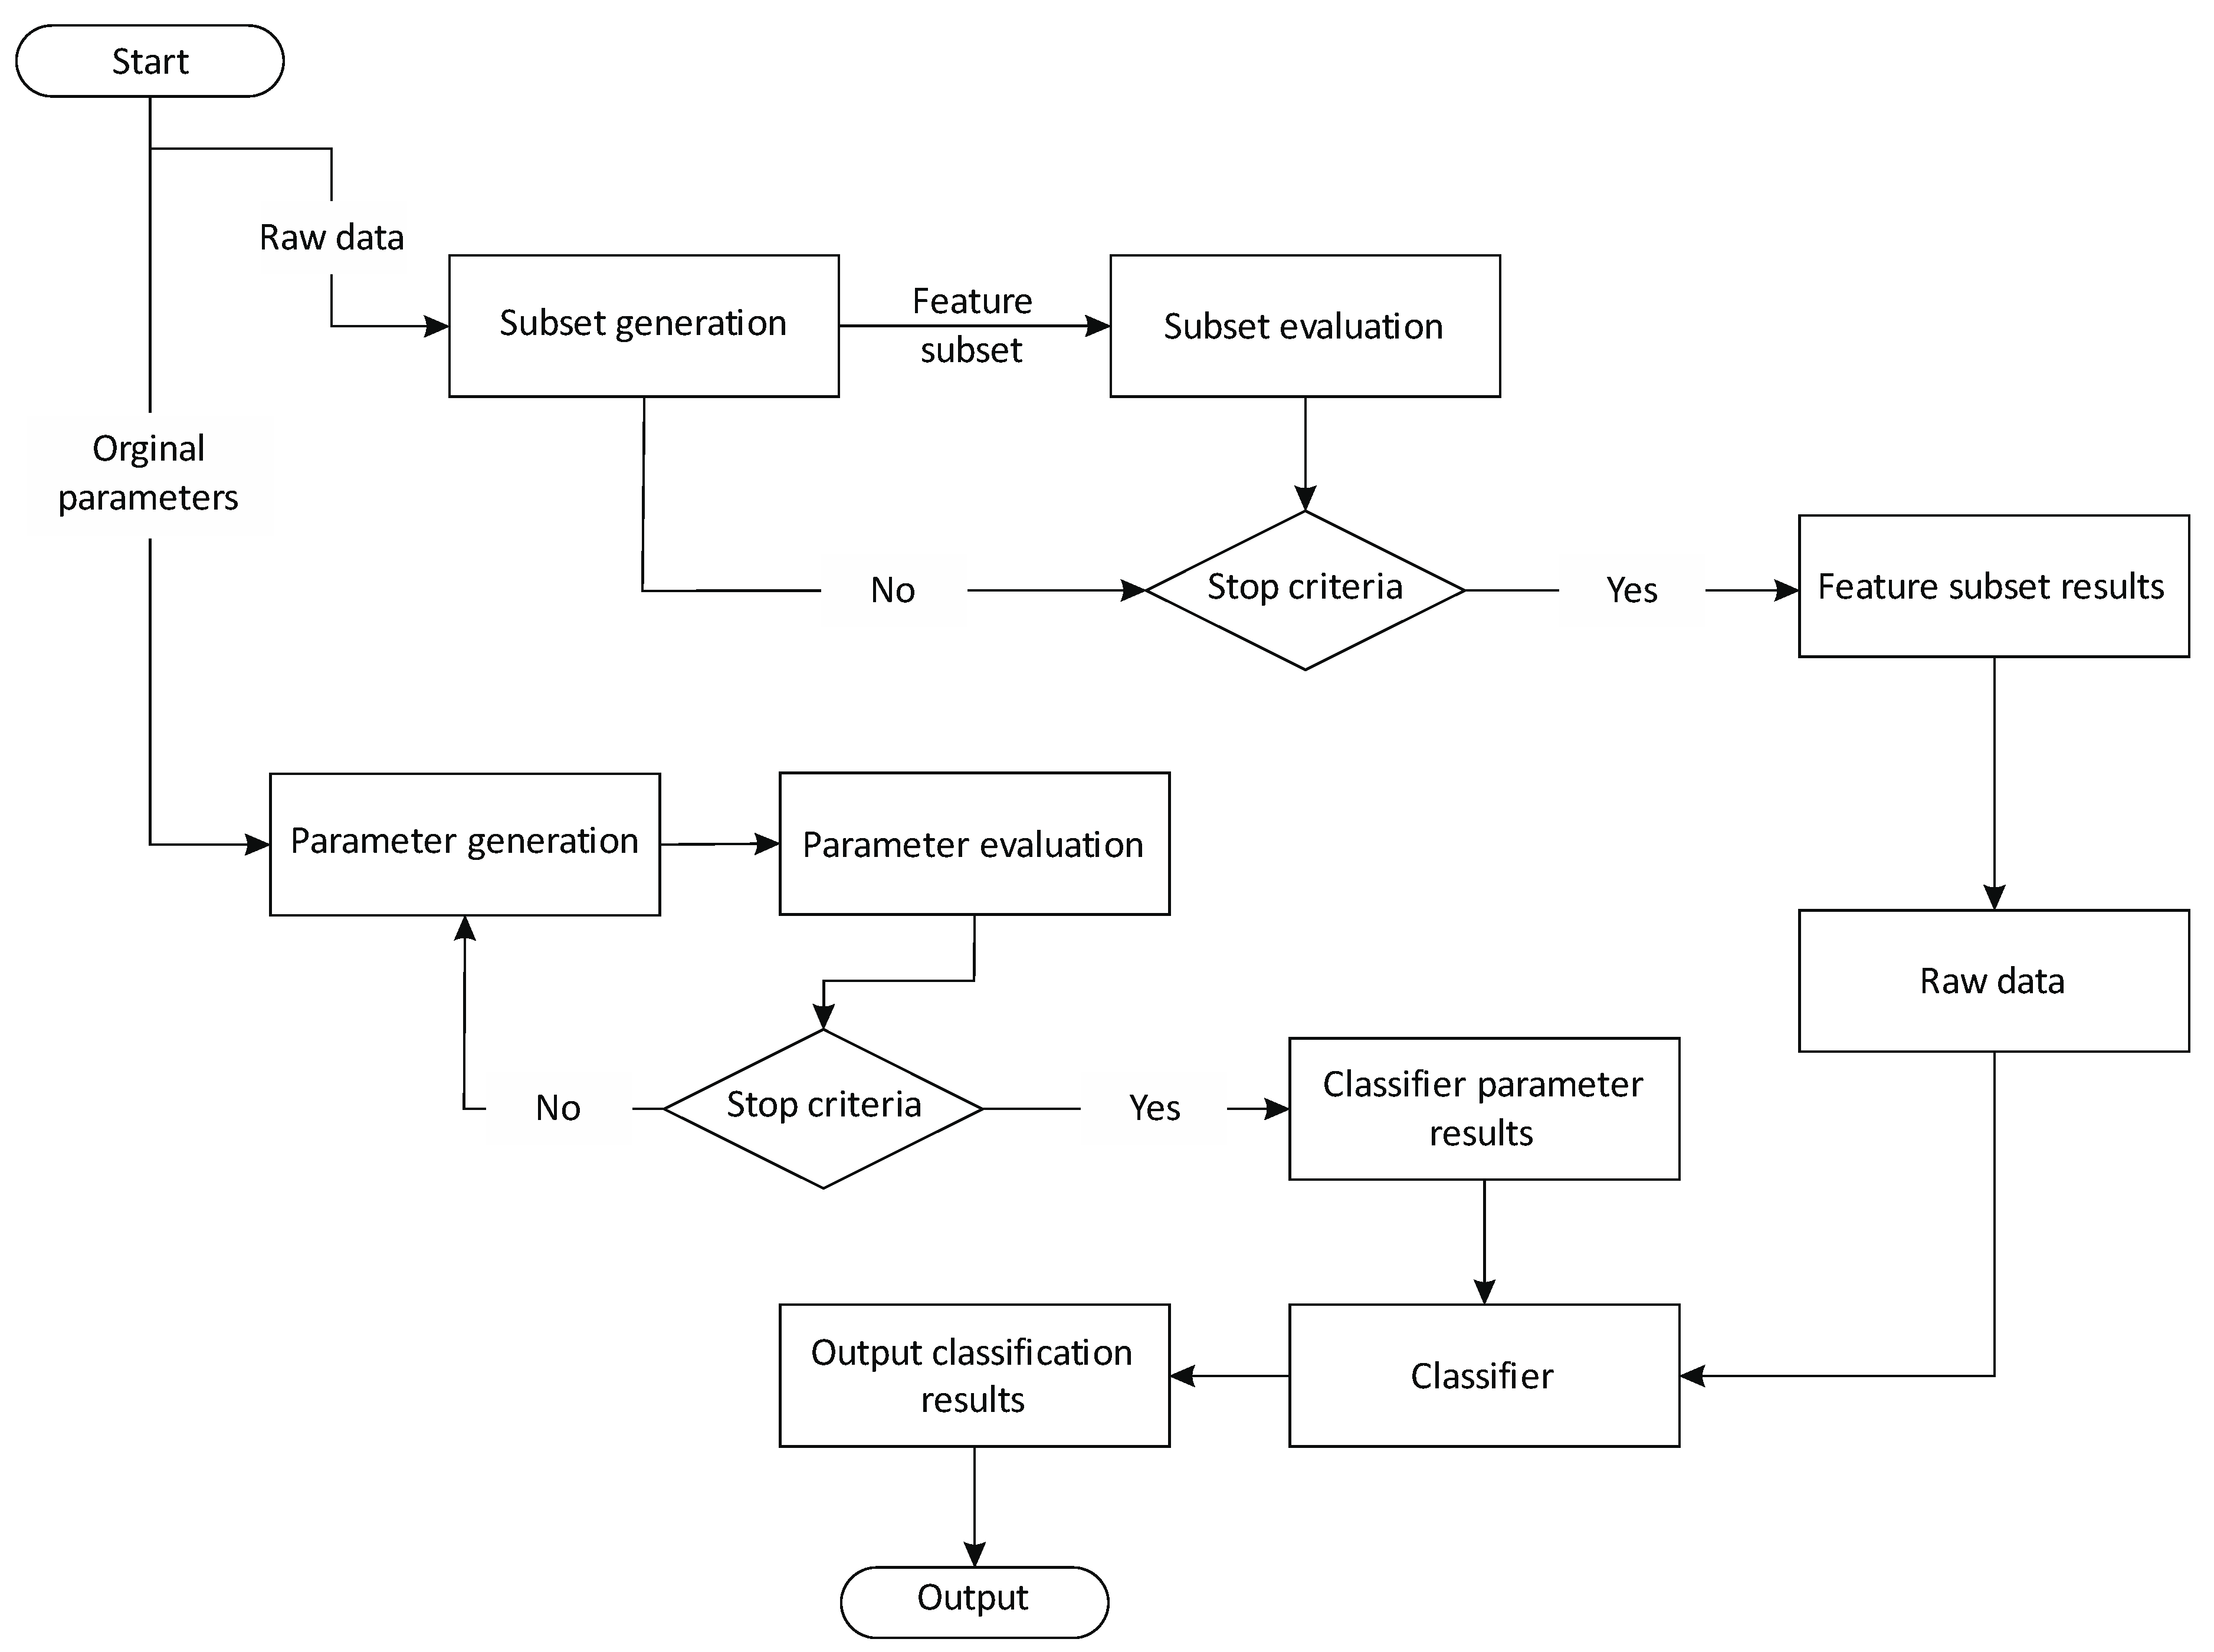
Figure 2 shows the flow chart of the binary PMFO (namely BPMFO in short) algorithm.
As shown in Figure 2, the BPMFO algorithm process is described as follows.
Step 1: The moth population M is initialized by Formula (14), and O M is calculated according to M;
Step 2: The position of M and O M is not changed, and F and its O F can be obtained by matching and sequencing M and OM;
Step 3: According to Formula (8), the number of moths is calculated, and the moths and flames at the end are removed;
Step 4: The moth speed V is updated by Formula (11). If the speed exceeds the boundary, the speed is V m a x or V m i n ;
Step 5: Given the velocity V, the moth position F is updated by Formula (12);
Step 6: The updated moth position is substituted into Formula (13), and the distance between moth and its D i is calculated;
Step 7: The updated value of each moth is calculated by Formula (14);
Step 8: Formula (16) and Formula (17) are used to convert the updated value of moth into binary;
Step 9: The fitness value OM is obtained by substituting M into the classifier;
Step 10: Judge whether the end condition is met, otherwise go to Step 2.

3. A Combination Strategy to Improve the Performance of Network Intrusion Detection

3.1. Classification Algorithms for Network Intrusion Detection

A classification algorithm is an algorithm to classify the unknown data. At present, there are many kinds of classification algorithms, but they are basically based on the known data (training set) to classify the unknown data (test set). In general, the same kind of data has similar characteristics, and different kinds of data have obvious differences. However, in special cases, some of the same kind of data have very different characteristics, and different kinds of data may have similar characteristics. Thus, how to classify the data more accurately is the goal of each classification algorithm. Currently, the commonly used classification methods for network intrusion detection are KNN, SVM, naive Bayes, and so on.

3.1.1. K-Nearest Neighbor (KNN)

The KNN algorithm classifies by measuring the distance between data. The idea of KNN is that, in the feature space of the samples, select the most similar samples. As for the KNN algorithm, all the samples selected are classified correctly, and only a few sample data close to them are related to the determination of the category. Euclidean distance or Manhattan distance is generally used in KNN.
In short, the KNN algorithm classifies unknown data according to more data in objects, rather than a single sample.

3.1.2. Support Vector Machine (SVM)

The SVM is a two-classification model which is used to find a high-dimensional plane with the largest interval to solve the classification problem of a low-dimensional plane.
  • When the samples are linearly separable, SVM can be learned by the method of maximum hard interval.
  • When the samples are approximately linearly separable, SVM can be learned by the method of maximum soft interval.
  • When the samples are not separable linearly, SVM can be learned by the method of maximum core technology and soft interval.

3.1.3. Naive Bayes

Compared with other classification algorithms, Naive Bayes classification algorithm is relatively simple. Its basic idea is to find out the probability of each category under this condition for the known data to be classified, so as to determine the category of the data.
The naive Bayes classification algorithm can be divided into following three stages.
  • In the stage of preparing for classification, naive Bayes relies on attributes to distinguish categories, so this stage is a necessary stage for naive Bayes. Its main task is to determine the characteristics of attributes according to specific data sets, integrate the samples of the data sets to be classified by people, and integrate the data sets into training sets. This stage will have a crucial impact on the following classifier classification.
  • In the training stage, the main purpose is to generate a classifier, calculate the frequency of data appearing in the training set and the probability evaluation of each tag by the classification of feature attributes, and then record the calculation. This stage is a mechanical stage, which can be completed by the program.
  • In the application stage, classifiers are used to classify items. This stage is also a mechanical stage, which is completed by the program.

3.2. A Combination Strategy with Weighted KNN

Weighted KNN is used to calculate the Euclidean distance between the samples to be classified and the training samples, to add a weight to each dimension of the distance formula in KNN, to find the KNN samples closest to the samples to be classified, and then to judge the categories of the samples to be classified according to the categories of the KNN samples. In short, most of the samples belong to a certain category, then the samples also belong to a certain category.
Suppose the training set is S = { S 1 , S 2 , , S m } , then S i = { S i 1 , S i 2 , , S i n } (   S i S ) . Assume that the number of samples to be classified is g, then C = { C 1 ,   C 2 , ,   C g } and C i = { C g 1 , C g 2 , , C g n } ( C i C ) . Additionally, the set of distance weights is K, and K i = { K 11 , K i 2 , , K q n } ( K i K ) . The distance weighting formula is calculated as follows:
d i s t a n c e ( S m , C g , K q ) = i = 0 n K q i ( S m i C g i ) 2 .
In the original data set C = { s 1 ,   s 2 , ,   s g } , s 1 ,   s 2 , ,   s g are features of the original data set. S 1 = { s 1 ,   s 2 , ,   s g } are selected by feature selection with S 1 S . At the same time, the original data set S = { s 1 ,   s 2 , ,   s n } is substituted into the weighted KNN. The result of feature selection is K = { k 1 ,   k 2 , ,   k n } , and the result of weight selection of weighted KNN is S 1 = { s 1 ,   s 2 , ,   s m } . Finally, the new feature subset S 1 selected from feature selection is substituted into the weighted KNN of weight K i to get the final classification result. The parameters of weighted KNN are combined with the results of feature selection based on the proposed integrated optimization algorithm, aiming at improving both the efficiency and the accuracy of network intrusion detection.
As for the combination strategy of feature selection based on the proposed integrated optimization algorithm and weighted KNN, the weight optimization of the weighted KNN and feature selection are independent of each other. When the result of feature selection or weighted KNN weight changes, the result of the other will not be affected. The procedure of the proposed combination strategy is then demonstrated in Figure 3.

4. Experimental Results

4.1. Method Validation of MFO-Optimized Weighted KNN

4.1.1. Data Sets for Network Intrusion Detection

Network intrusion detection system infers whether unknown access belongs to attack access through known data. The commonly used data set is KDD Cup 99 data set [48]. Each piece of data is defined as a data sequence from the beginning to the end of a connection. The whole data set can be roughly labeled as attack and normal. There are 39 kinds of abnormal attack access, 22 kinds of them in the training set, and 17 unknown attacks in the test set.
This paper uses about 10% of the data in the KDD Cup 99 data set. 4000 and 8000 data are extracted, half of which are classified as the training set and the other half of which are classified as the test set. The attack types are labeled as anomaly, and other data types are labeled as normal.
This paper first pre-processes the data set to 0–1 standardized as follow:
v = v m A M A m A ,
where V is the current value, m A is the minimum value, M A is the maximum value, and v is the updated value.

4.1.2. Experimental Results and Analysis

Take the MFO algorithm, the PSO algorithm, and the grey wolf optimizer (GWO) algorithm for the experiments, and the maximum number of iterations is 50. The parameter settings for validation are described in Table 1.
Table 2 and Table 3 provide the results of 20 simulation experiments, in which MFO-KNN, PSO-KNN, and GWO-KNN include the average fitness value, running time and standard deviation. The basic classifiers include KNN, SVM, and naive Bayes, which have only the average fitness value and running time, since they do not improve weights.
It can be seen from Table 2 that, when both the test set and the training set are 2000, the average fitness value of MFO-KNN is higher than that of PSO-KNN and GWO-KNN, the running time is shorter than that of PSO-KNN and GWO-KNN, and the standard deviation is lower than that of PSO-KNN and GWO-KNN.
It can be seen from Table 3 that, when both the test set and the training set are 4000, the average fitness value of MFO-KNN is higher than that of PSO-KNN and GWO-KNN, the running time is shorter than that of PSO-KNN and GWO-KNN, and the standard deviation is lower than that of PSO-KNN and GWO-KNN.
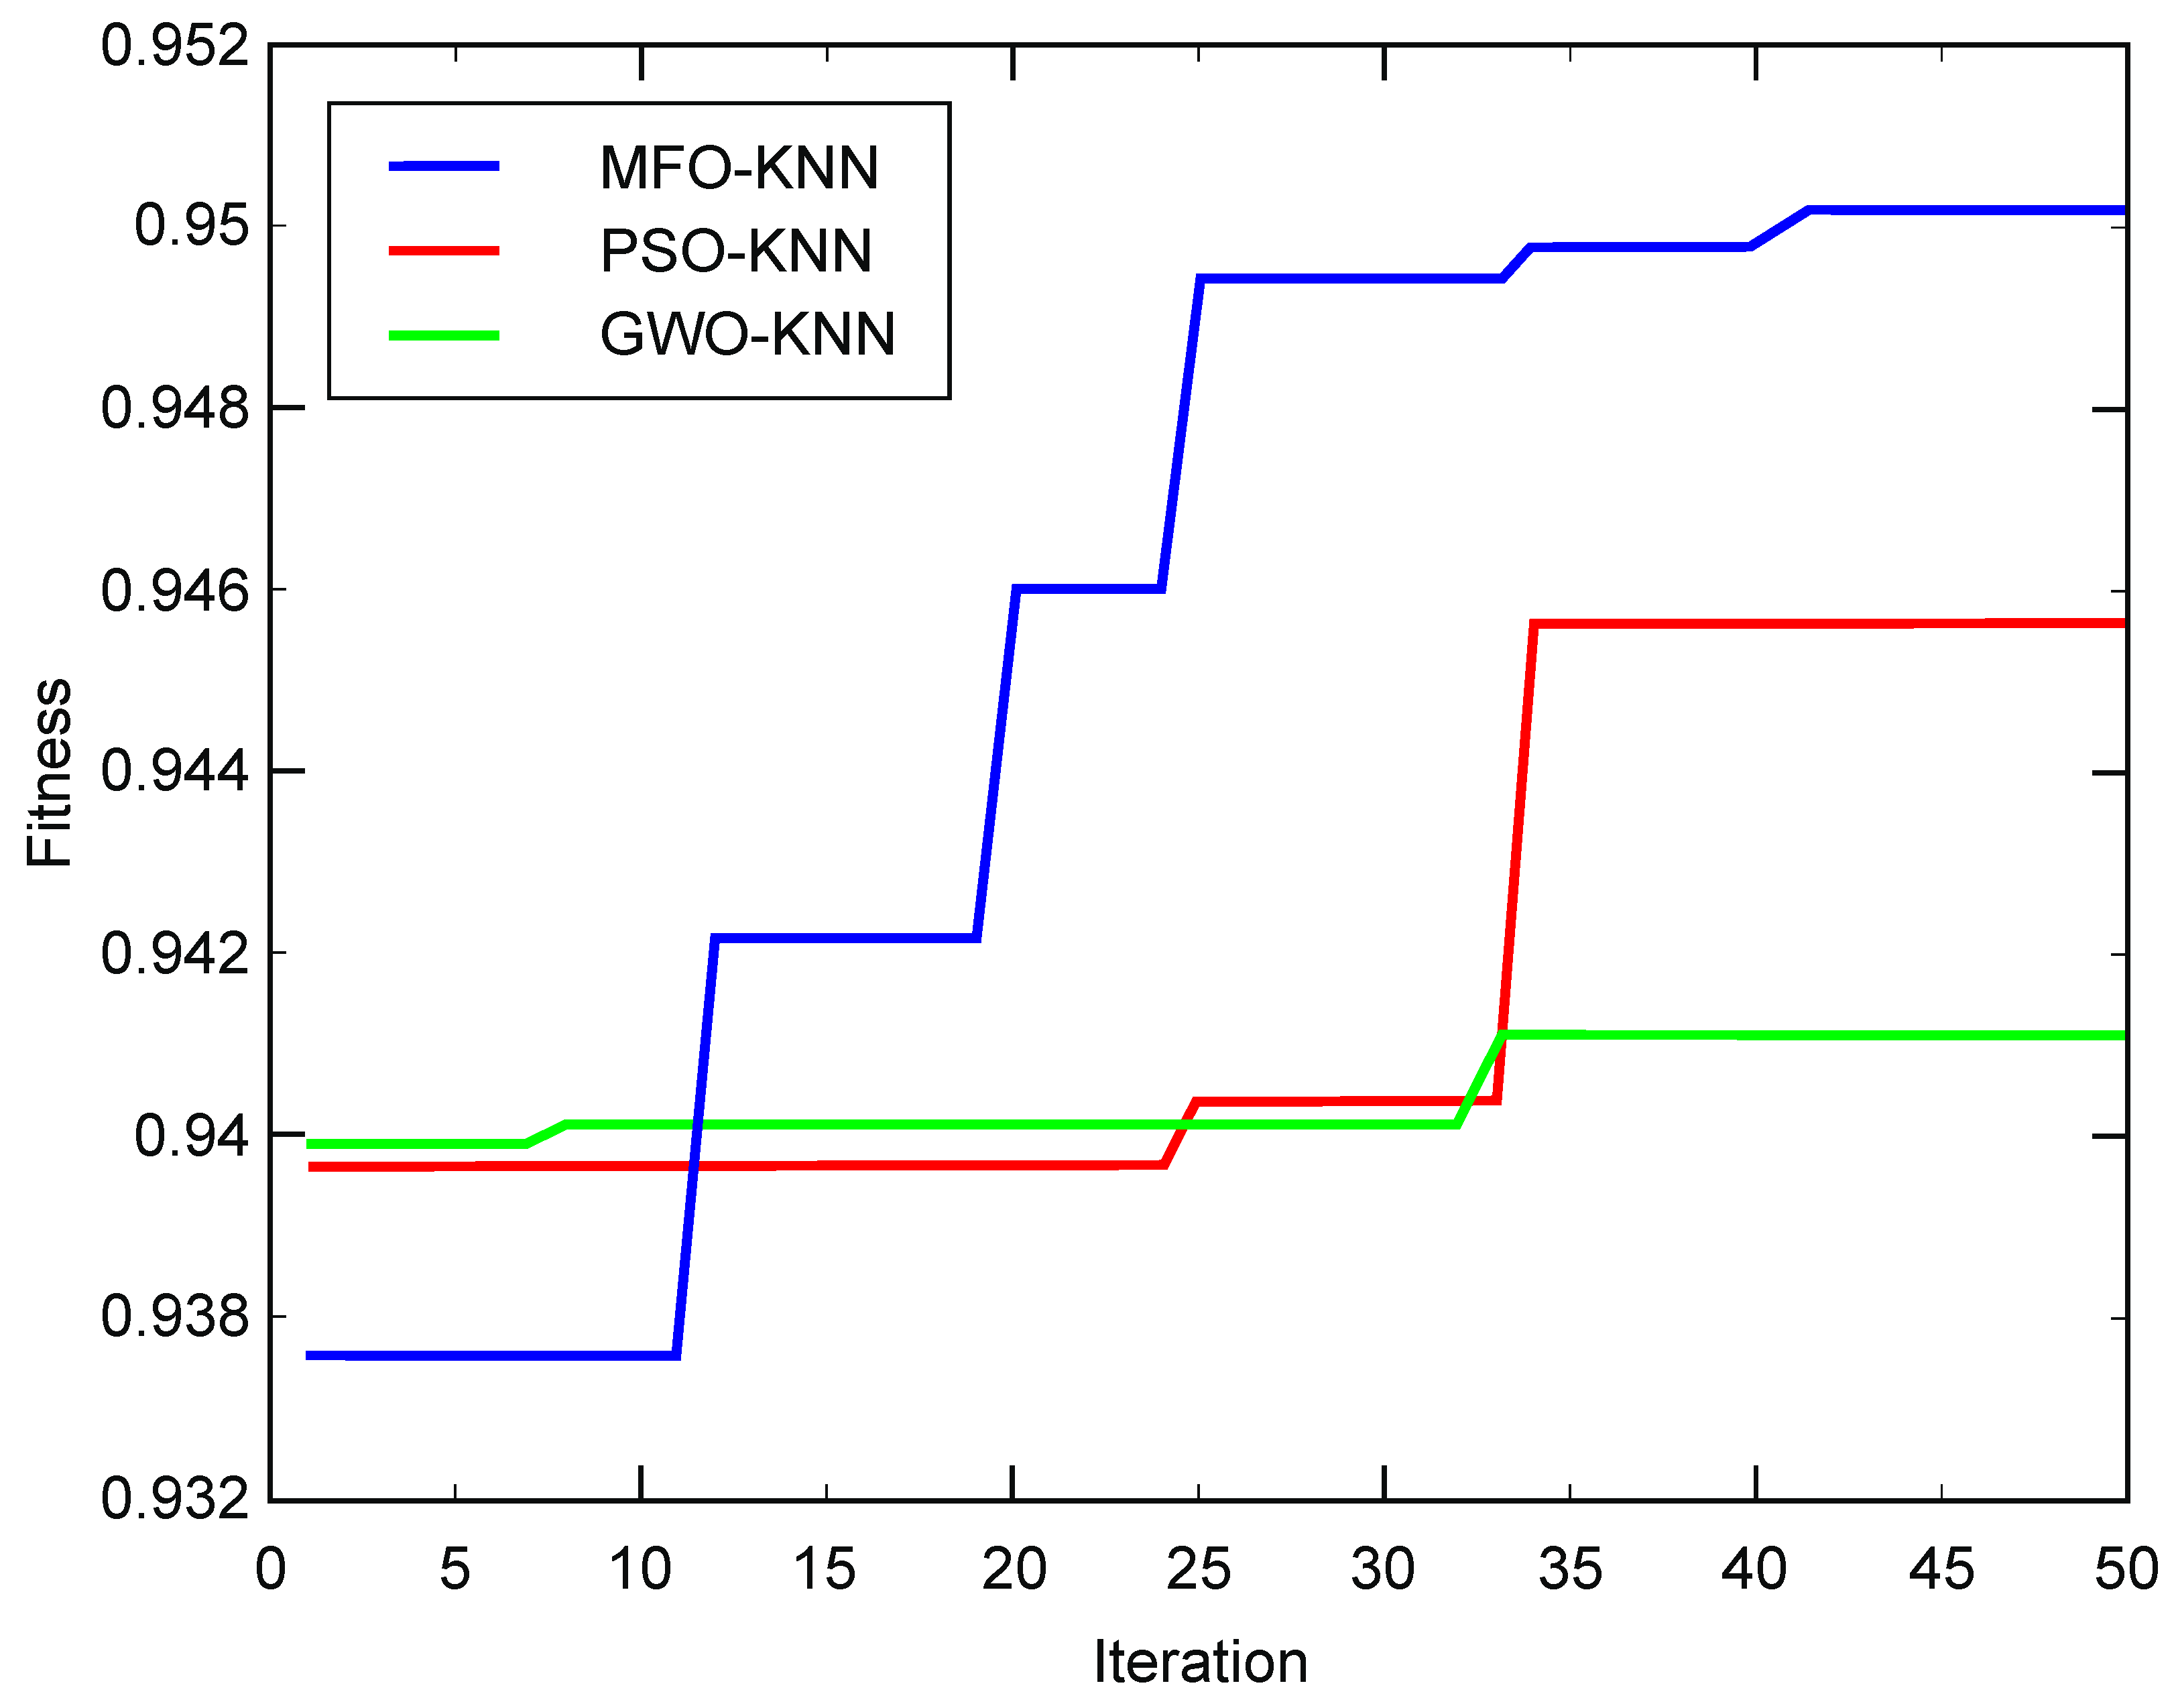
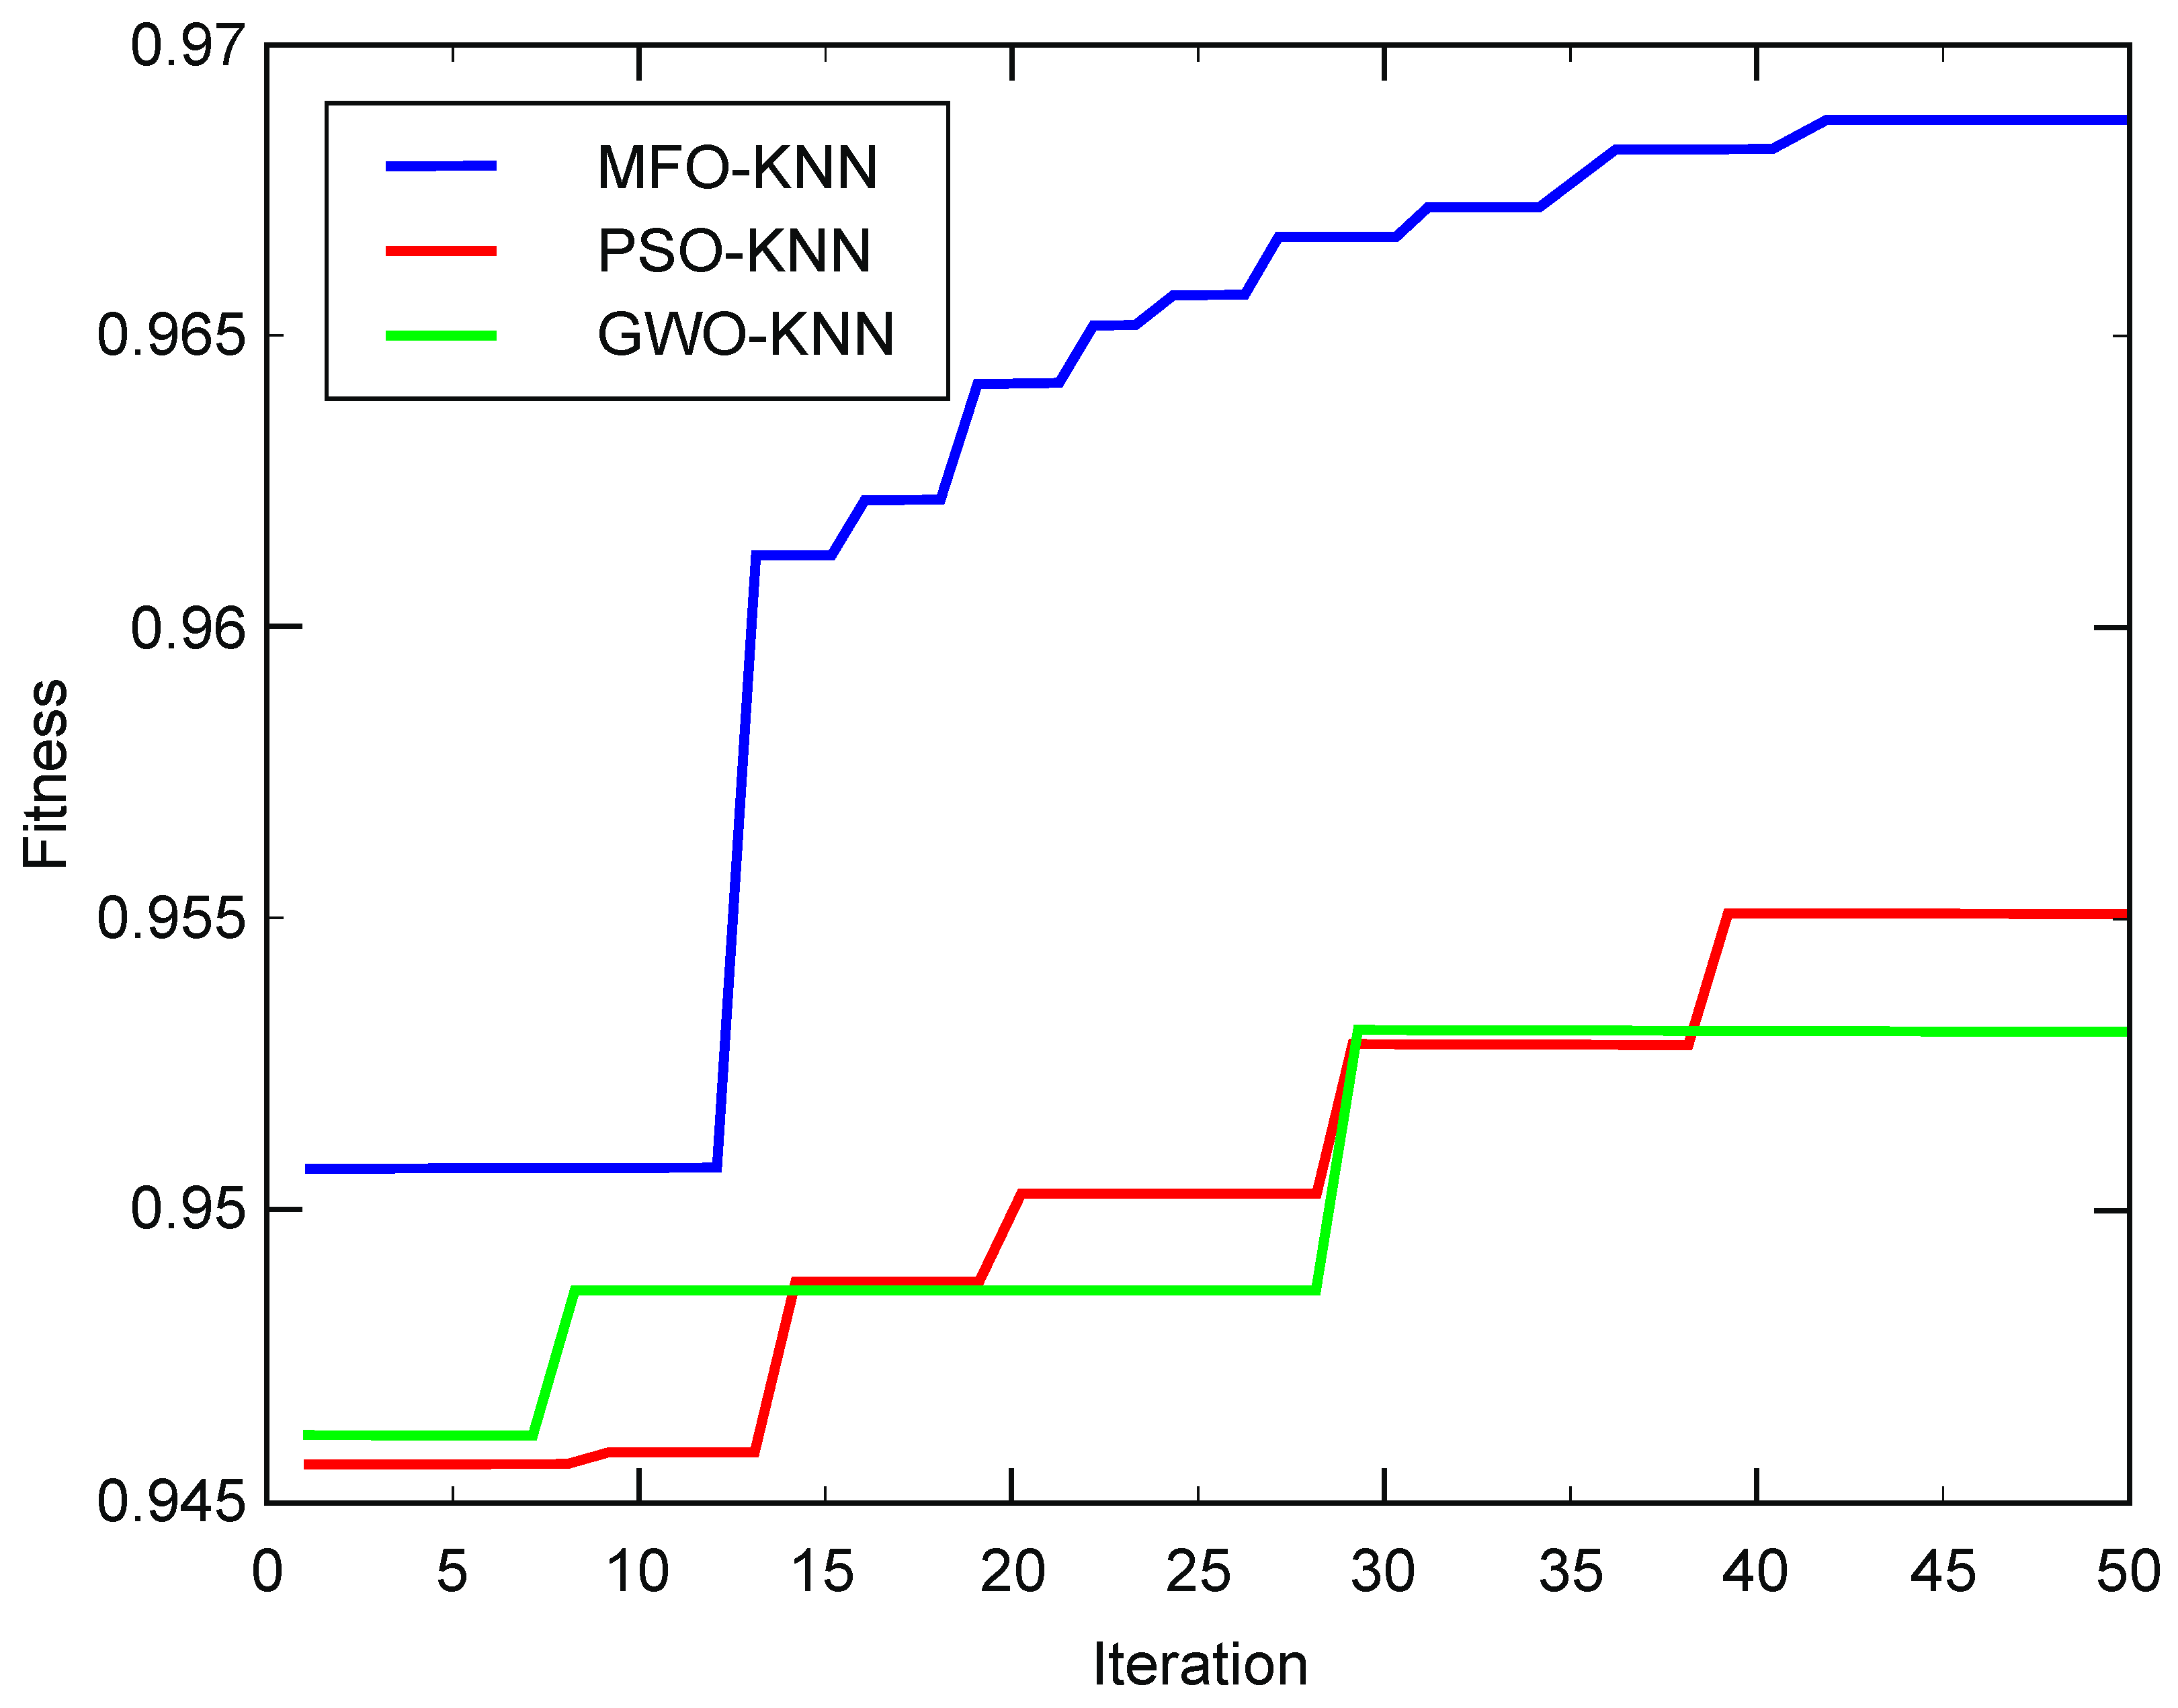
Figure 4 and Figure 5 then show the fitness curves for MFO-KNN, PSO-KNN, and GWO-KNN of different data sets.
The convergence curves of the fitness values shown in Figure 4 and Figure 5 indicate that, the convergence effect of the MFO-KNN algorithm is better than that of the PSO-KNN algorithm and that of the GWO-KNN algorithm.
In summary, the MFO-optimized weighted KNN is superior to PSO-optimized weighted KNN and GWO-optimized weighted KNN in terms of solving ability, stability, and running time when applied to network intrusion detection.

4.2. Test Functions for the Integrated Optimization Algorithm

In order to validate the integrated optimization algorithm proposed in this paper, the PMFO algorithm and the MFO algorithm are considered to be applied in the test functions. Therefore, eight test functions are selected in this paper, four of which are unimodal test functions and another four are multimodal test functions [49]. Each function runs 20 times, and each iteration is 500 times. Then the performance of the algorithm is evaluated from two dimensions of average value and variance. Table 4 provides parameter setting of the validated algorithms.
Table 5 shows four unimodal functions as the test functions. Table 6 provides the results of unimodal test functions shown in Table 5.
As shown in Table 5, four functions are unimodal functions, in which the function dimension is fixed to 20, the definition domain of f 1 ( x ) and f 3 ( x ) is (−100, 100), and the definition domain of f 2 ( x ) and f 4 ( x ) is (−10, 10), and there is no local optimal value.
As is indicated in Table 6, the average value of MFO in the function f 1 ( x ) is 15.67 times of PMFO, the variance is 4.8 times; the average value of MFO in the function f 2 ( x ) is 1.5 times of PMFO, the variance is 3 times; the average value of PMFO in the function f 3 ( x ) is 2.17 times of MFO, the variance is 4.78 times; the average value of PMFO in the function f 4 ( x ) is 0.83 times of MFO, and the variance is 1.23 times.
Table 7 lists four multimodal test functions for validation, and Table 8 provides the results of multimodal test functions shown in Table 7.
As shown in Table 7, four functions are multimodal functions, in which the function dimension is fixed to 20, the definition domain of f 5 ( x ) is (−100, 100), the definition domain of f 6 ( x ) is (−500, 500) and the definition domain of f 7 ( x ) and f 8 ( x ) is (−50, 50), and there is no local optimal value.
As is indicated in Table 8, the average value of MFO in the function f 5 ( x ) is 50.33 times of PMFO, the variance is 1.94 times; the average value of MFO in the function f 6 ( x ) is 2.35 times of PMFO, the variance is 0.03 times; the average value of MFO in the function f 7 ( x ) is 8.16 times of PMFO, the variance is 0.82 times; the average value of MFO in the function f 8 ( x ) is 2.67 times of PMFO, and the variance is 0.49 times.
It can be concluded from the experimental results above that, in the unimodal functions f 1 ( x ) , f 2 ( x ) , f 3 ( x ) and f 4 ( x ) , solving ability and stability of both the PMFO algorithm and the MFO algorithm are almost the same, and in the multimodal test functions f 5 ( x ) , f 6 ( x ) , f 7 ( x ) , and f 8 ( x ) , the PMFO algorithm is superior to the MFO algorithm in solving ability, but inferior to the MFO algorithm in the stability.

4.3. Binary Simulation Experiments for Feature Selection

In this paper, the UCI data set is considered to validate the BPMFO algorithm. Six data sets from UCI [50] are used, including Glass, Breast, Abalone, Wine, Iris, and Ecoli, which are shown in Table 9.
Because of the missing data in the Breast data set, this experiment considers deleting the missing data, and other data sets use the original data set. Two optimization algorithms, that are BPMFO and Binary MFO (namely BMFO in short) are used in the experiment. They are classified by SVM, and the kernel function of SVM is Gaussian function. The population of the algorithms is 10, and the number of iterations is 20. The cross-validation method chooses k-fold cross validation, with the value of k being 3, and the number of iterations is 20. Table 10 provides parameter setting of the validated algorithms.
The algorithms are evaluated from two aspects of average fitness value and filtering redundancy feature. Table 11 provides the comparison results of six data sets from UCI shown in Table 9.
The BPMFO algorithm retains features 1 and 8 in the Glass data set, features 2, 3, 5, and 8 in the Breast data set, features 3, 6, and 8 in the Abalone data set, features 4, 7, 10, 12, and 13 in the Wine data set, feature 3 in the Iris data set, and features 1, 2, 4, and 6 in the Ecoli data set.
The reserved features of PMFO in Glass data set are 1, 3, 4, and 5, the reserved features in Breast data set are 3 and 4, the reserved features in Abalone data set are 3, 6, and 7, the features retained in the Wine data set are 1, 4, 6, 9, 12, and 13, the feature retained in the Iris data set is 3, and the features retained in the Ecoli data set are 1, 2, 4, 5, 6, and 7.
As is indicated in Table 11, in terms of fitness value, the fitness value of BPMFO in Glass data set is 0.0152 higher than that of BMFO, 0.042433 higher in Breast data set, 0.003228 higher in Abalone data set, 0.008817 higher in Wine data set, and 0.000312 higher in Ecoli data set. Note that the fitness value of BPMFO in the Iris data set is the same as that of BMFO.
It can be concluded from the experimental results above that, compared to the BMFO algorithm, the BPMFO algorithm has a certain improvement in solving ability, and has a significant improvement in eliminating redundant features and selecting features with a high contribution, which presents a practical value in feature selection.

4.4. Validation of The Combination Strategy

4.4.1. Selection of KNN Weights

In this section, the parameters of KNN are the same as PMFO optimizing KNN in Section 4.3 under the condition of 8000 data sets, and the experiment runs for 50 times. The average value of KNN weight for 50 times is then calculated and applied to the experiment. Table 12 is the weight table obtained from the experiment.

4.4.2. Selection of Feature Subsets

In this paper, the feature selection is applied to network intrusion detection. Both the occurrence times for feature numbers and the frequency of each feature are calculated.
Table 13 provides the occurrence times for feature numbers, and Table 14 gives the frequency of each feature.
As is indicated in Table 13, the number of features with the highest occurrence time is 10. As for Table 14, these 10 features with the highest frequency are selected, which are respectively the feature 2 with frequency 37, the feature 3 with frequency 17, the feature 9 with frequency 17, the feature 22 with frequency 28, the feature 23 with frequency 29, the feature 28 with frequency 14, the feature 31 with frequency 19, the feature 33 with frequency 15, the feature 34 with frequency 17, and the feature 35 with frequency 42. To sum up, the feature selection is 2, 3, 9, 22, 23, 28, 31, 33, 34, 35.

4.4.3. Simulation Experiments

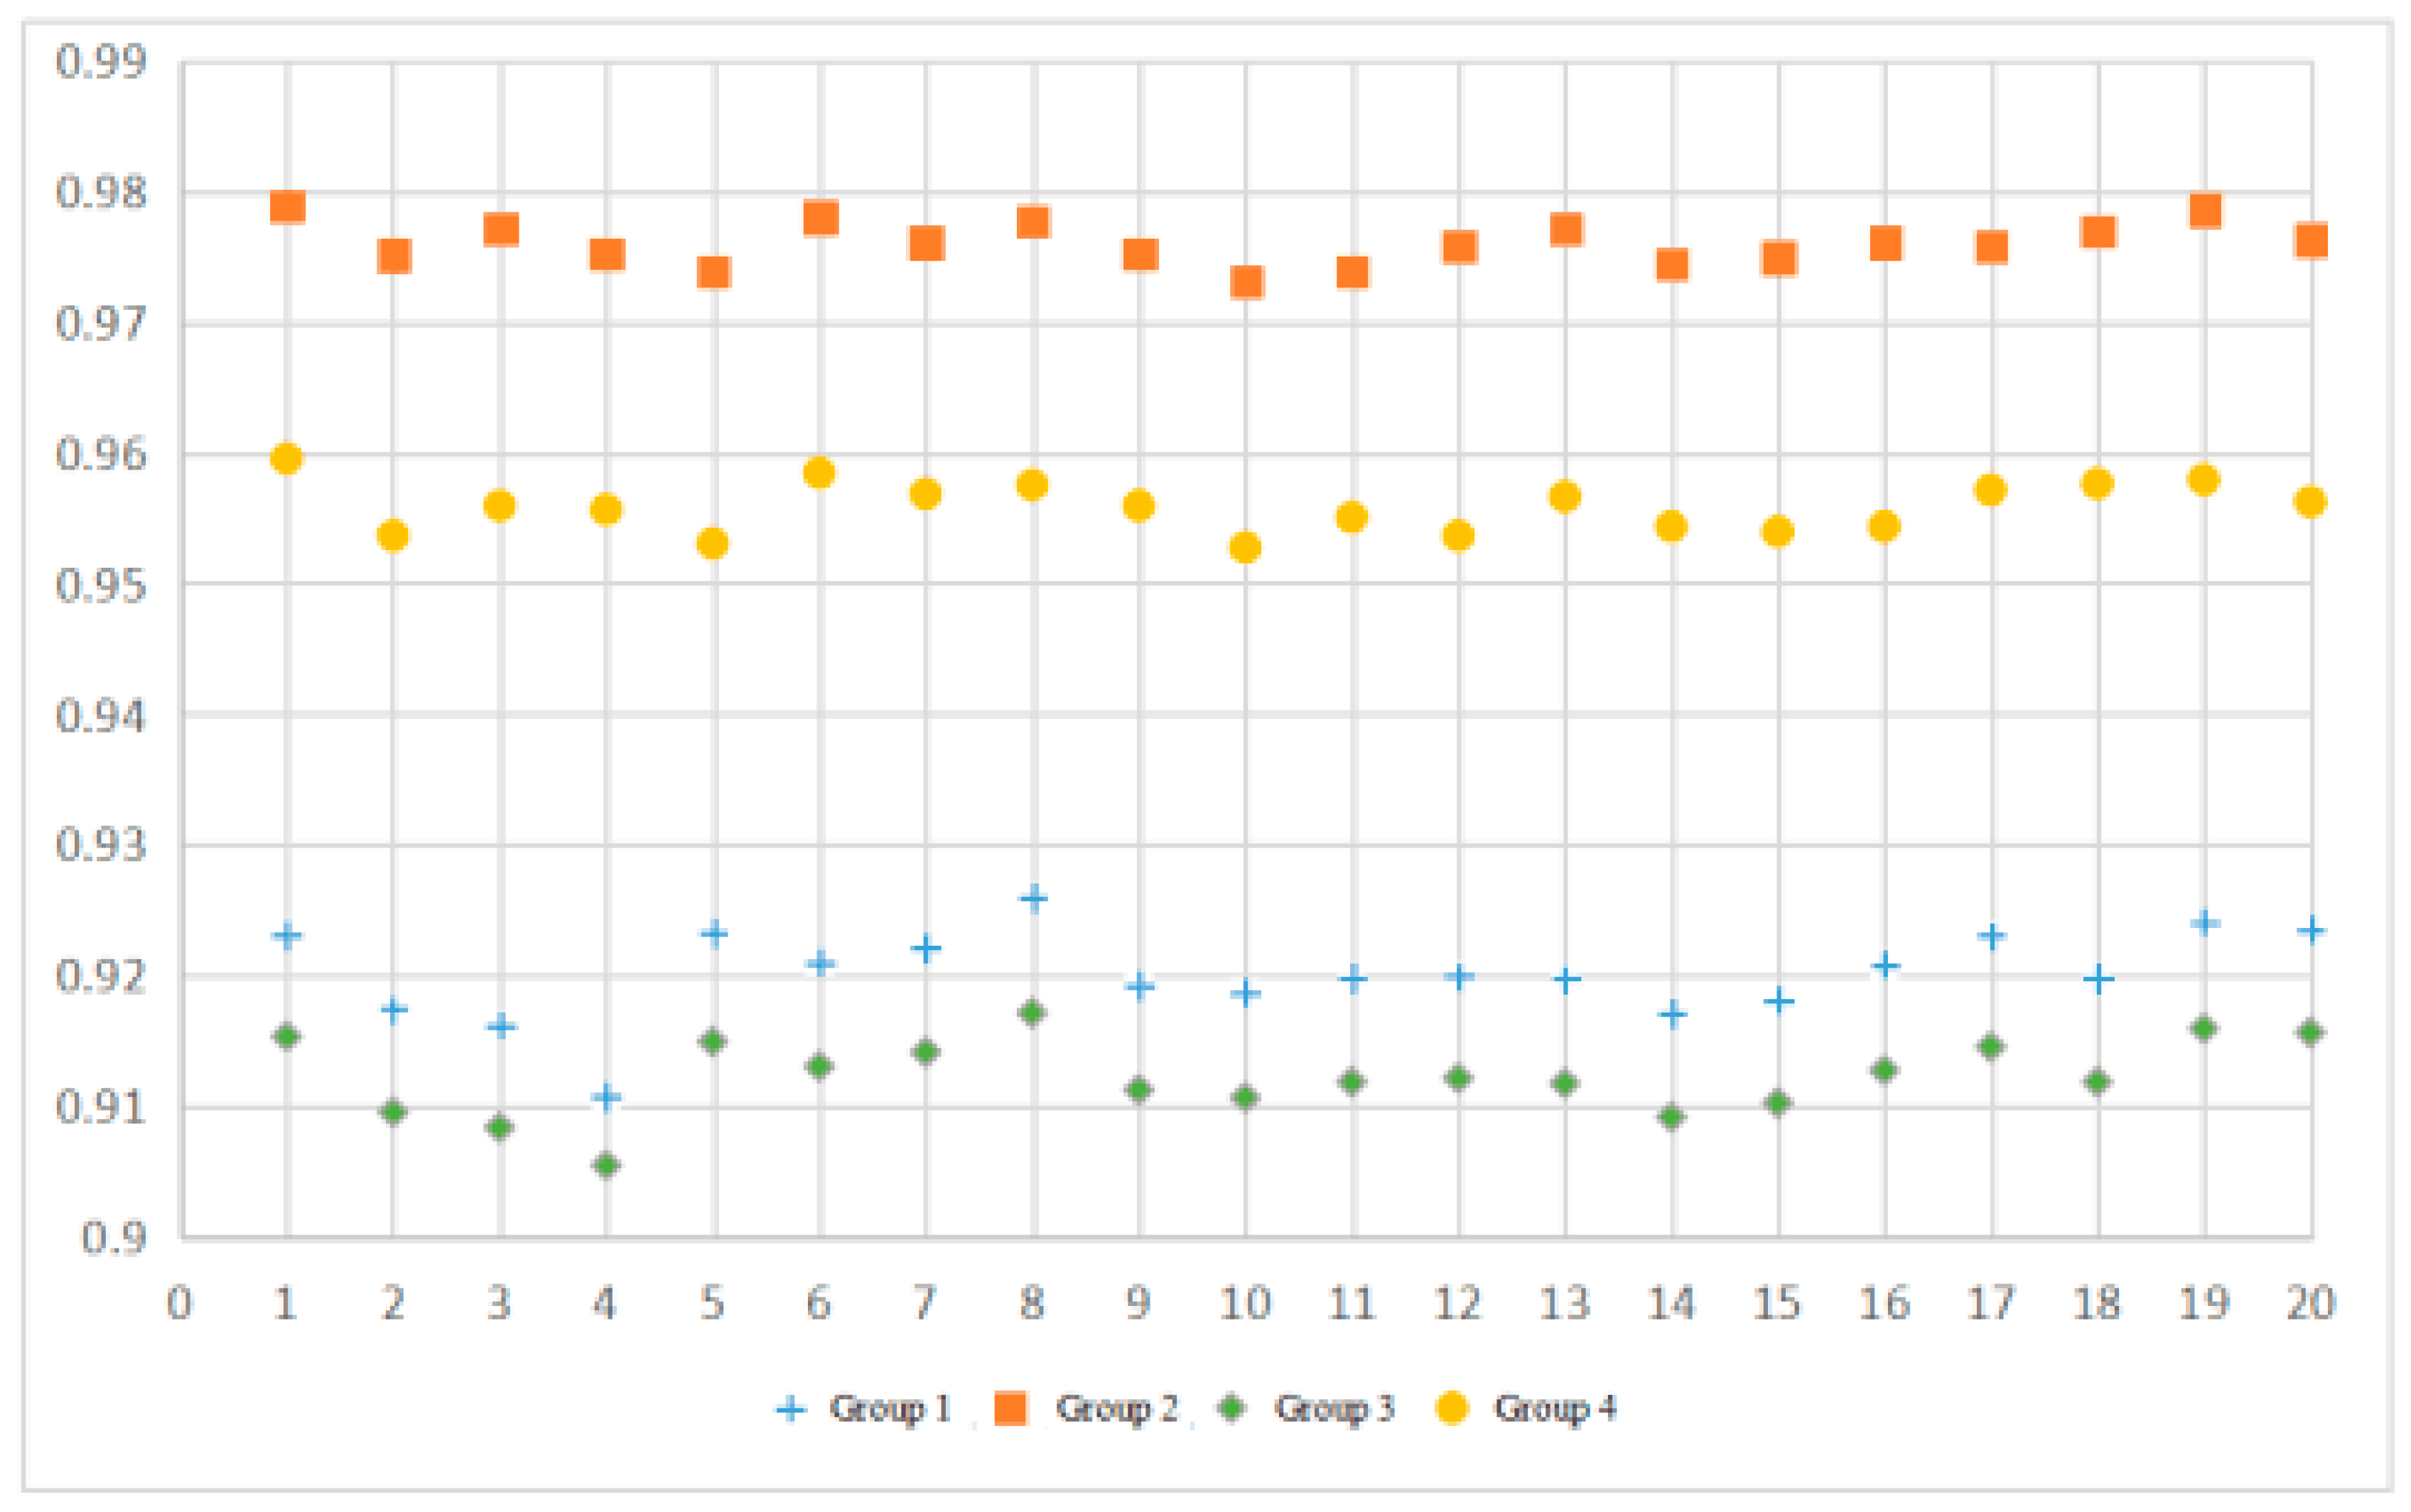
For the purpose of simulation, four groups of comparative experiments are considered. In Group 1, both KNN weight selection and feature selection are used; in Group 2, only KNN weight selection is used; in Group 3, only feature selection is used; in Group 4, ordinary KNN is used and feature selection is not used.
The data set includes 20,000 data randomly selected from the original data set. Of those, 10,000 data are randomly selected for each experiment, half of which are training sets, and the other half of which are test sets. Each experiment is run 20 times. The experimental results are measured from two aspects including the average fitness value and the average running time.
The details of the simulation test results are demonstrated as follows:
In Group 1, the selected features are 2, 3, 9, 22, 23, 28, 31, 33, 34, 35, and the weights of KNN are 9.65, 4.28, 2.88, 4.69, 7.44, 7.31, 5.61, 2.11, 4.25, and 5.93.
In Group 2, all features are selected, and KNN weight is the result of weight optimization explained in this paper.
In Group 3, the selected features are 2, 3, 9, 22, 23, 28, 31, 33, 34, 35, and KNN weights are all 1.
In Group 4, all features are selected, and KNN weights are all 1.
Figure 6 provides the experimental results of running 20 times, and Table 15 shows the simulation experimental results for the average fitness values and the average running times.
As is shown in Figure 6 and Table 15, there are the results as follows:
  • In terms of running time, Group 1 is 9884 ms faster than Group 2, 10,622 ms faster than Group 4, roughly the same as Group 3
  • In terms of accuracy, Group 1 is 0.007085 higher than Group 3, Group 2 is 0.02024 higher than Group 4, Group 1 is 0.055884 lower than Group 2, and Group 1 is 0.035644 lower than Group 4.
  • In terms of weighted KNN, Group 1 is 0.007085 higher than Group 3, and Group 2 is 0.02024 higher than Group 4.
  • In terms of feature selection, Group 1 is 0.055884 lower than Group 2, Group 1 is 0.035644 lower than Group 4, but Group 1 is 9884 ms faster than Group 2, 10,622 ms faster than Group 4.
As for the same data set, Group 2 using weighted KNN and not using feature selection is higher than Group 4 using ordinary KNN but not using feature selection, higher than Group 1 using both feature selection and weighted KNN, higher than Group 3 using feature selection but not using weighted KNN.
It can be concluded from the experimental results above that the weighted KNN can greatly increase the efficiency at the expense of a small amount of the accuracy. In summary, the application of the proposed integrated optimization algorithm to promote both the feature selection and the weight of weighted KNN can significantly improve the accuracy of network intrusion detection, and almost equally in terms of efficiency.

5. Conclusions

In view of the problem that the MFO algorithm converges too fast and easily falls into local optimum, this paper first proposes an integrated optimization algorithm, namely the PMFO algorithm, which utilizes the MFO algorithm with a strong local search ability, and integrates the PSO algorithm with a speed updating method to make the individual population move along the direction of a global and historical optimum and increase the global convergence. Considering the characteristics of a large amount of data, high data dimension, and low recognition rate in current network intrusion detection, this paper then applies the proposed integrated optimization algorithm to classifier optimization and feature selection of network intrusion detection.
In order to improve both the efficiency and the accuracy of network intrusion detection, this paper aims to propose a combination strategy of feature selection based on the integrated optimization algorithm and weighted KNN, which combines the result of feature selection with the result of classifier optimization. This paper then combines the results of classification optimization of weighted KNN with those of feature selection, and apply them to network intrusion detection. The simulation results show that the combined strategy can effectively improve the performance of network intrusion detection.
In this paper, only KNN is considered to improve the performance of network intrusion detection. However, SVM and naive Bayes might also be selected for this purpose. In the future, SVM and naive Bayes will be utilized for parameter optimization.

Author Contributions

Methodology H.X., K.P., C.F., and A.M.; validation, C.F., O.K., and M.B.; investigation, H.X. and K.P.; writing—original draft preparation, C.F.; writing—review and editing, H.X., O.K., and M.B.; project administration, H.X. and K.P.; funding acquisition, H.X., K.P., C.F., and A.M. All authors have read and agreed to the published version of the manuscript.

Funding

This research was funded by the National Natural Science Foundation of China, grant number 61602162 and 61440024. This work was financed in the framework of the project Lublin University of Technology—Regional Excellence Initiative, funded by the Polish Ministry of Science and Higher Education, contract no. 030/RID/2018/19 and contract no. FN-31/E/EE/2019.

Acknowledgments

The authors would like to thank Qianyun Li for her help in editing this paper.

Conflicts of Interest

The authors declare no conflict of interest.

References

  1. Jun, S.; Przystupa, K.; Beshley, M.; Kochan, O.; Beshley, H.; Klymash, M.; Wang, J.; Pieniak, D. A Cost-Efficient Software Based Router and Traffic Generator for Simulation and Testing of IP Network. Electronics 2020, 9, 40. [Google Scholar] [CrossRef] [Green Version]
  2. Song, W.; Beshley, M.; Przystupa, K.; Beshley, H.; Kochan, O.; Pryslupskyi, A.; Pieniak, D.; Su, J. A Software Deep Packet Inspection System for Network Traffic Analysis and Anomaly Detection. Sensors 2020, 20, 1637. [Google Scholar] [CrossRef] [PubMed] [Green Version]
  3. Liao, H.J.; Lin, C.H.R.; Lin, Y.C. Intrusion detection system: A comprehensive review. J. Netw. Comput. Appl. 2013, 36, 16–24. [Google Scholar] [CrossRef]
  4. Binbusayyis, A.; Vaiyapuri, T. Comprehensive analysis and recommendation of feature evaluation measures for intrusion detection. Heliyon 2020, 6, e04262. [Google Scholar] [CrossRef] [PubMed]
  5. Thakkar, A.; Lohiya, R. Role of swarm and evolutionary algorithms for intrusion detection system: A survey. Swarm Evol. Comput. 2020, 53, 100631. [Google Scholar] [CrossRef]
  6. Bouzgou, H.; Gueymard, C.A. Fast Short-Term Global Solar Irradiance Forecasting with Wrapper Mutual Information. Renew. Energy 2018, 133, 1055–1065. [Google Scholar] [CrossRef]
  7. Kennedy, J.; Eberhart, R. Particle swarm optimization. In Proceedings of the IEEE International Conference on Neural Networks, Perth, Australia, 27 November–1 December 1995; pp. 1942–1948. [Google Scholar]
  8. Nayak, J.; Vakula, K.; Dinesh, P.; Naik, B. Significance of particle swarm optimization in intrusion detection: Crossing a decade. In Proceedings of the Applications of Robotics in Industry Using Advanced Mechanisms, Bhubaneswar, India, 16–17 August 2019; pp. 187–202. [Google Scholar]
  9. Peterson, L. K-nearest neighbor. Scholarpedia 2009, 4, 1883. [Google Scholar] [CrossRef]
  10. Saunders, C.; Stitson, M.O.; Weston, J.; Holloway, R.; Bottou, L.; Scholkopf, B. Support Vector Machine. Comput. Sci. 2002, 1, 1–28. [Google Scholar]
  11. Kononenko, I. Semi-naive bayesian classifier. Lect. Notes Comput. Sci. 1991, 482, 206–219. [Google Scholar]
  12. Mirjalili, S. Moth-flame optimization algorithm: A novel nature-inspired heuristic paradigm. Knowl. Based Syst. 2015, 89, 228–249. [Google Scholar] [CrossRef]
  13. Savsani, V.; Tawhid, M.A. Non-dominated sorting moth flame optimization (NS-MFO) for multi-objective problems. Eng. Appl. Artif. Intell. 2017, 63, 20–32. [Google Scholar] [CrossRef]
  14. Apinantanakon, W.; Sunat, K. OMFO: A New Opposition-Based Moth-Flame Optimization Algorithm for Solving Unconstrained Optimization Problems. Recent Advances in Information and Communication Technology 2017. IC2IT 2017. Adv. Intell. Syst. Comput. 2017, 566. [Google Scholar] [CrossRef]
  15. Zhang, S.; Zhou, Y.Q.; Luo, Q.F. A Complex-Valued Encoding Moth-Flame Optimization Algorithm for Global Optimization. Evol. Syst. 2019, 11643, 1–15. [Google Scholar] [CrossRef]
  16. Xu, Y.; Chen, H.; Heidari, A.A. An efficient chaotic mutative moth-flame-inspired optimizer for global optimization tasks. Expert Syst. Appl. 2019, 129, 135–155. [Google Scholar] [CrossRef]
  17. Xu, Y.; Chen, H.; Luo, J. Enhanced Moth-flame optimizer with mutation strategy for global optimization. Inf. Sci. 2019, 492, 181–203. [Google Scholar] [CrossRef]
  18. Yeromenko, V.; Kochan, O. The conditional least squares method for thermocouples error modeling. In Proceedings of the 2013 IEEE 7th International Conference on Intelligent Data Acquisition and Advanced Computing Systems IDAACS-2013, Berlin, Germany, 12–14 September 2013; pp. 157–162. [Google Scholar]
  19. Singh, P.; Prakash, S. Optical network unit placement in Fiber-Wireless (FiWi) access network by Moth-Flame optimization algorithm. Opt. Fiber Technol. 2017, 36, 403–411. [Google Scholar] [CrossRef]
  20. Kotary, D.K.; Nanda, S.J. Distributed robust data clustering in wireless sensor networks using diffusion moth flame optimization. Eng. Appl. Artif. Intell. 2020, 87, 103342. [Google Scholar] [CrossRef]
  21. Yıldız, B.S.; Yıldız, A.R. Moth-flame optimization algorithm to determine optimal machining parameters in manufacturing processes. Materialprufung 2017, 59, 425–429. [Google Scholar] [CrossRef]
  22. Fayyaz, S.; Ahmad, A.; Singh, V.K.; Bhoi, A.K. Solution of Economic Load Dispatch Problems through Moth Flame Optimization Algorithm. Lect. Notes Electr. Eng. 2019, 462, 287–294. [Google Scholar]
  23. Przystupa, K. Selected methods for improving power reliability. Przegląd Elektrotechniczny 2018, 94, 270–273. [Google Scholar]
  24. Kozieł, J.; Przystupa, K. Using the FTA method to analyze the quality of an uninterruptible power supply unitreparation UPS. Przegląd Elektrotechniczny 2019, 95, 77–80. [Google Scholar] [CrossRef] [Green Version]
  25. Acharyulu, B.V.S.; Mohanty, B.; Hota, P.K. Comparative Performance Analysis of PID Controller with Filter for Automatic Generation Control with Moth-Flame Optimization Algorithm. Appl. Artif. Intell. Tech. Eng. 2019, 698, 509–518. [Google Scholar]
  26. Nowdeh, S.A.; Moghaddam, M.J.H.; Nasri, S.; Abdelaziz, A.Y.; Ghanbari, M.; Faraji, I. A New Hybrid Moth Flame Optimizer-Perturb and Observe Method for Maximum Power Point Tracking in Photovoltaic Energy System. Appl. Artif. Intell. Tech. Eng. 2020, 401–420. [Google Scholar] [CrossRef]
  27. Jain, P.; Saxena, A. An opposition theory enabled moth flame optimizer for strategic bidding in uniform spot energy market. Eng. Sci. Technol. Int. J. 2019, 22, 1047–1067. [Google Scholar] [CrossRef]
  28. Bouakkaz, M.S.; Boukadoum, A.; Boudebbouz, O. Dynamic performance evaluation and improvement of PV energy generation systems using Moth Flame Optimization with combined fractional order PID and sliding mode controller. Sol. Energy 2020, 199, 411–424. [Google Scholar] [CrossRef]
  29. Hraiba, A.; Touil, A.; Mousrij, A. An Enhanced Moth-Flame Optimizer for Reliability Analysis. Embed. Syst. Artif. Intell. 2020, 1076, 741–751. [Google Scholar]
  30. Przystupa, K.; Ambrożkiewicz, B.; Litak, G. Diagnostics of Transient States in Hydraulic Pump System with Short Time Fourier Transform. Advances in Science and Technology. Res. J. 2020, 14, 178–183. [Google Scholar]
  31. Przystupa, K. Planning repair strategies with the application of modified FMEA method. In Proceedings of the XV Konferencja Naukowo-Techniczna Techniki Komputerowe w Inżynierii TKI 2018, Mikołajki, Poland, 16–19 October 2018. [Google Scholar]
  32. Jalali, S.M.J.; Hedjam, R.; Khosravi, A.; Heidari, A.A.; Mirjalili, S.; Nahavandi, S. Autonomous Robot Navigation Using Moth-Flame-Based Neuroevolution. Evol. Mach. Learn. Tech. 2020, 67–83. [Google Scholar] [CrossRef]
  33. Sharma, R.; Saha, A. Fermat Spiral-Based Moth-Flame Optimization Algorithm for Object-Oriented Testing. Adv. Comput. Intell. Syst. 2020, 19–34. [Google Scholar] [CrossRef]
  34. Zhang, H.L.; Ali, A.H.; Wang, M.J.; Zhang, L.J.; Chen, H.L.; Li, C.Y. Orthogonal Nelder-Mead moth flame method for parameters identification of photovoltaic modules. Energy Convers. Manag. 2020, 211, 112764. [Google Scholar] [CrossRef]
  35. Majhi, S.K. How Effective Is the Moth-Flame Optimization in Diabetes Data Classification. Recent Dev. Mach. Learn. Data Anal. 2019, 470, 79–87. [Google Scholar]
  36. Debendra, M.; Ratnakar, D.; Banshidhar, M. Automated breast cancer detection in digital mammograms: A moth flame optimization based ELM approach. Biomed. Signal Process. Control 2020, 59, 101912. [Google Scholar]
  37. Lei, X.; Fang, M.; Fujita, H. Moth–flame optimization-based algorithm with synthetic dynamic PPI networks for discovering protein complexes. Knowl. Based Syst. 2019, 172, 76–85. [Google Scholar] [CrossRef]
  38. Xu, L.; Li, Y.; Li, K. Enhanced Moth-flame Optimization Based on Cultural Learning and Gaussian Mutation. J. Bionic Eng. 2018, 15, 751–763. [Google Scholar] [CrossRef]
  39. Pelusi, D.; Mascella, R.; Tallini, L.G. An Improved Moth-Flame Optimization algorithm with hybrid search phase. Knowl. Based Syst. 2020, 191, 105277. [Google Scholar] [CrossRef]
  40. Bhesdadiya, R.H.; Trivedi, I.N.; Jangir, P.; Kumar, A.; Jangir, N.; Totlani, R. A Novel Hybrid Approach Particle Swarm Optimizer with Moth-Flame Optimizer Algorithm. Adv. Comput. Comput. Sci. 2017, 553, 569–577. [Google Scholar]
  41. Majhi, S.K.; Mahapatra, P. Classification of Phishing Websites Using Moth-Flame Optimized Neural Network. Emerg. Technol. Data Min. Inf. Secur. 2019, 755, 39–48. [Google Scholar]
  42. Yu, C.Y.; Ali, A.H.; Chen, H.L. A Quantum-behaved Simulated Annealing Enhanced Moth-flame Optimization Method. Appl. Math. Model. 2020, 87, 1–19. [Google Scholar] [CrossRef]
  43. Gupta, D.; Ahlawat, A.K.; Sharma, A. Feature selection and evaluation for software usability model using modified moth-flame optimization. Computing 2020. [Google Scholar] [CrossRef]
  44. Elaziz, M.A.; Ewees, A.A.; Ibrahim, R.A. Opposition-based moth-flame optimization improved by differential evolution for feature selection. Math. Comput. Simul. 2020, 168, 48–75. [Google Scholar] [CrossRef]
  45. Pankaja, K.; Suma, V. Mango Leaves Recognition Using Deep Belief Network with Moth-Flame Optimization and Multi-feature Fusion. Smart Intell. Comput. Appl. 2020, 159, 23–31. [Google Scholar]
  46. Chaithanya, P.S.; Raman, M.R.G.; Nivethitha, S.; Seshan, K.S.; Sriram, V.S. An Efficient Intrusion Detection Approach Using Enhanced Random Forest and Moth-Flame Optimization Technique. Comput. Intell. Pattern Recognit. 2020, 999, 877–884. [Google Scholar]
  47. Kumar, V.; Kumar, D. Binary Whale Optimization Algorithm and Its Application to Unit Commitment Problem. Neural Comput. Appl. 2018, 32, 2095–2123. [Google Scholar]
  48. KDD Cup 99 Data Set. Available online: kdd.ics.uci.edu/databases/kddcup99/kddcup99.html (accessed on 17 May 2020).
  49. Elaoud, S.; Loukil, T.; Teghem, J. The Pareto fitness genetic algorithm: Test function study. Eur. J. Oper. Res. 2007, 177, 1703–1719. [Google Scholar]
  50. Sakai, H.; Liu, C.; Nakata, M. Information Dilution: Granule-Based Information Hiding in Table Data—A Case of Lenses Data Set in UCI Machine Learning Repository. In Proceedings of the Third International Conference on Computing Measurement Control & Sensor Network, Matsue, Japan, 20–22 May 2016. [Google Scholar]
Figure 1. Flow chart of the proposed integrated optimization algorithm.
Electronics 09 01206 g001
Figure 2. Flow chart of a binary algorithm for the proposed integrated optimization algorithm.
Electronics 09 01206 g002
Figure 3. The procedure of proposed combination strategy.
Electronics 09 01206 g003
Figure 4. Fitness curve of 4000 data sets.
Electronics 09 01206 g004
Figure 5. Fitness curve of 8000 data sets.
Electronics 09 01206 g005
Figure 6. Experimental results of running 20 times.
Electronics 09 01206 g006
Table 1. Parameter settings for validation.
AlgorithmParameter Setting
MFO-KNNb = 1; K = 10
PSO-KNN C 1 ,   C 2 = 2; Vmax = 1; Vmin = −1; K = 10
GWO-KNNK = 10
KNNK = 10
SVMGamma = 1.0
Naïve BayesNone
Table 2. Experimental results of 4000 data sets.
Average FitnessRunning Time (s)Standard Deviation
MFO-KNN0.94039781.4550.002536
PSO-KNN0.923469135.9180.005140
GWO-KNN0.939882133.4910.003167
KNN0.9250670.764-
SVM0.9193610.594-
Naïve Bayes0.6085960.109-
Table 3. Experimental results of 8000 data sets.
Average FitnessRunning Time (s)Standard Deviation
MFO-KNN0.968548362.9710.002122
PSO-KNN0.958741607.7640.002986
GWO-KNN0.955524616.5830.002622
KNN0.9379341.821-
SVM0.9399211.439-
Naïve Bayes0.6544190.204-
Table 4. Parameter setting of the validated algorithms.
AlgorithmParameter Setting
PMFOC1, C2 = 2; b = 1; Vmax = 1; Vmin = −1
MFOb = 1
Table 5. Unimodal test functions.
Test FunctionDimensionDefinition DomainMinimum Value
f 1 ( x ) = i = 1 n x i 2 20(−100, 100)0
f 2 ( x ) = i = 1 n | x i | + i = 1 n | x i | 20(−10, 10)0
f 3 ( x ) = i = 1 n ( [ x i + 0.5 ] ) 2 20(−100, 100)0
f 4 ( x ) = i = 1 n i x i 4 + r a n d o m ( 0 , 1 ) 20(−10, 10)0
Table 6. Results of unimodal test functions.
Test FunctionAlgorithmAverage ValueVariance
f 1 ( x ) PMFO2.3425 × 10 14 1.2319 × 10 13
MFO3.6716 × 10 13 5.9147 × 10 13
f 2 ( x ) PMFO5.1893 × 10 9 3.0818 × 10 9
MFO7.8062 × 10 9 9.2393 × 10 9
f 3 ( x ) PMFO0.0826360.209585
MFO0.0380620.043858
f 4 ( x ) PMFO0.0902480.050483
MFO0.1088080.044769
Table 7. Multimodal test functions.
Test FunctionDimensionDefinition DomainMin. Value
f 5 ( x ) = i = 1 n [ x i 2 10 cos ( 2 π x i ) + 10 ] 20(−100, 100)0
f 6 ( x ) = 20 20 exp ( 0.2 1 n i = 1 n x 2 ) 20(−500, 500)0
f 7 ( x ) = 1 4000 i = 1 n x i 2 i = 1 n cos ( x i i ) + 1 20(−50, 50)0
f 8 ( x ) = sin 2 ( 3 π x 1 ) + i = 1 n ( x i 1 ) 2 [ 1 + sin 2 ( 3 π x 1 + 1 ) ] + ( x n 1 ) 2 + i = 1 n u ( x i , 5 , 100 , 4 ) u ( x , a , k , m ) = { k ( x a ) x > a 0 a < x < a k ( x + a ) x < a 20(−50, 50)0
Table 8. Results of multimodal test functions.
Test FunctionAlgorithmAverage ValueVariance
f 5 ( x ) PMFO0.15433.176
MFO7.76716.176
f 6 ( x ) PMFO8.6771 × 10 8 5.7615 × 10 6
MFO2.0415 × 10 7 1.7511 × 10 7
f 7 ( x ) PMFO0.0095230.208581
MFO0.0777490.171080
f 8 ( x ) PMFO0.0016490.005124
MFO0.0043950.002523
Table 9. UCI data sets for validation.
Data SetNumber of DataNumber of CategoriesNumber of Features
Glass21469
Breast699211
Abalone4177298
Wine178313
Iris15034
Ecoli33688
Table 10. Parameter setting of the validated algorithms.
AlgorithmParameter Setting
BPMFO C 1 ,   C 2 = 2; b = 1; Vmax = 1; Vmin = −1
BMFOb = 1
Table 11. Comparison results of UCI data sets.
Data SetAlgorithmBefore Feature SelectionAfter Feature SelectionFitness Value
GlassBPMFO920.797978
BMFO940.782778
BreastBPMFO1140.966704
BMFO1120.924271
AbaloneBPMFO830.265281
BMFO830.262053
WineBPMFO1350.943396
BMFO1360.934579
IrisBPMFO410.941945
BMFO410.941945
EcoliBPMFO840.893901
BMFO860.893589
Table 12. Weight of each feature.
FeatureWeightFeatureWeight
15.619589213.658905
29.650791224.694852
34.282662237.443937
46.494251242.886449
58.390892252.702098
67.107178266.152995
75.752698272.928758
83.011028287.309848
92.883600295.841692
102.733738309.088569
114.100507315.612757
125.615577324.074626
136.363829332.119303
143.248322344.254331
154.471637355.930137
165.707215362.171261
175.514407375.624371
185.487701386.962610
194.147335397.559233
204.782790404.223209
Table 13. Occurrence times for feature numbers.
Feature Number57891011121314
Occurrence Time13471411531
Table 14. Frequency of each feature.
FeatureFrequencyFeatureFrequency
19216
2372228
3172329
482411
5102510
68268
7102712
852814
917298
10113014
1193119
1293212
13133315
1493417
1593542
166365
1763714
1810389
1953913
205407
Table 15. Simulation test results.
Group 1Group 2Group 3Group 4
Average fitness value0.9201810.9760650.9130960.955825
Average running time (ms)822818,212815418,150