1. Introduction
Industrial Control Systems (ICS) are used to control physical processes in industry and critical infrastructure. These systems, composed of a combination of software and hardware components, analyze the information received from sensors and, based on the state of a process, issue control commands to actuators. ICS are used in a wide variety of operations such as nuclear power plants, manufacturing, oil and gas pipelines, and water distribution systems. Hence, they are integral to the safety and security of a nation’s critical infrastructure. As a result, initiatives such as the United States of America Presidential Executive Order No. 13,636 (2013) have been passed to protect critical infrastructure [
1]. Due to their critical nature, attacks on ICS that propagate to the physical processes can cause large monetary losses, cause environmental damage, and significantly impact the infrastructure of cities. Well-known attacks such as the Ukraine power blackout [
2], Stuxnet worm [
3], and Maroochy Shire Sewage Spill [
4] demonstrate the impact and consequences of ICS attacks. Furthermore, the Cybersecurity and Infrastructure Security Agency (CISA) has publicly reported that the number of attacks against ICS has steadily grown, with 290 reported attacks in 2016 alone [
5]. This increase in targeted attacks on ICS emphasizes the need for algorithms and tools to provide resilient and smart attack detection mechanisms.
For this reason, many researchers have started focusing on developing techniques and approaches for anomaly detection within ICS processes. Existing state-of-the-art research can be divided into two categories: (I) Formal methods based on mathematical models and behavior specification of processes [
6,
7,
8,
9,
10], and (II) data driven approaches using: (a) machine learning (ML) [
11,
12,
13], (b) deep learning (DL) [
14,
15,
16,
17], and (c) statistical modeling [
18,
19].
Formal logic methods are applied to detect deviations from specified process requirements. Detection is based on formal models of the systems that are created using symbolic grammar and invariant logic. While these models are robust due to their use of mathematical reasoning, they are susceptible to the state explosion problem and scalability issues that result from the complexity of ICS processes [
6]. Furthermore, these methods are resource intensive and technically complex to design and implement. It is even more challenging to use these techniques when faced with safety critical systems that require strict timing features. Constructing a model specifying the exact behavior of an ICS is an expensive process as it requires a precise understanding of ICS physics, which is hard even for current domain experts to obtain [
8].
A second approach to ICS security uses machine learning to detect deviations from normal behavior in a specified feature space. Its shortcomings are that a labeled set of attack data is required, and the method fails to detect novel attacks on a system. In addition to machine learning, deep learning methods use historical data to parse the normal behavior of a system from anomalous behavior. Existing state-of-the-art tools and algorithms are only able to capture a small subset of attacks and require expensive training time and cost due to the large number of features and data that need to be analyzed. Signature-based statistical modeling is a third approach. It is based on creating noise signatures for the sensors. Any deviations from the created signatures are recognized as anomalies. This approach is highly susceptible to noise in the operating environment, which limits it to a small number of devices in a process [
18].
Along with the challenges described above, data driven models have to deal with the sheer variety of data that occurs in ICS. Physical process data is discrete in nature for actuators and continuous for sensors. In addition to the difference in type, these data have varying distributions for each feature. Thus, normalization of all features to a normal distribution for machine learning models cannot be used. At the same time, changes in actuator values are relatively large compared to changes in sensor values. For example, a valve turning ON and OFF could be encoded as 1 and 0, which is a large magnitude change compared to sensor values that may slowly decrease from 1.0 to 0.99. Most research studies in this field have treated both data types similarly, which results in a high rate of false positives by the anomaly detection tools. This result is due to sudden changes or large deltas in the process data as actuators operate. In this paper, we propose a novel feature engineering approach for sensor data to extract more nuanced information, which is used for training the model. Our findings show that using a feature engineering pipeline, where wavelet transformations are used, results in detection of attacks that went undetected without feature engineering.
Building on existing research and advancing the state-of-the-art, this paper presents a supervised deep learning architecture for anomaly detection in a water treatment plant. The novel contributions of this paper are:
A unique feature engineering process in which wavelet transformations are used to transform sensor data and add higher-dimensional features for each sensor in the ICS data set;
Use of a hybrid convolution and long short-term memory (LSTM) neural network to learn windowed temporal dependencies, as well as long term sequence memorization for successful attack detection;
A deep learning methodology that reduces training and detection time—and therefore cost—relative to methods documented in previous works;
Evaluation of multiple deep learning architectures, and examination of their relative performance.
The methodology and the case study presented in this paper can be ued for precise and quick detection of anomalous behaviors in time series data from industrial infrastructure.
Section 2 summarizes related work and discusses limitations in each of the methods.
Section 3 describes the proposed methodology.
Section 4 describes a case study using historical data from the Secure Water Treatment (SWaT) testbed and employing the methodology described in
Section 3.
Section 5 discusses the results of our analyses and potential future work to augment or improve the methodologies proposed.
2. Related Works
Research into anomaly detection in ICS can be divided into two main categories:
data driven models (ML, DL, and statistical modeling), and
formal methods. Formal reasoning techniques are based on specifying the overall security requirements for the control logic, sensor data, and actuators and mathematically proving that the requirements are satisfied in system design and development. In one of the first instances of formal methods being applied in this realm, the mathematical relationship between sensors and actuators in an ICS were derived. These relationships are derived using a state condition graph (SCG) that represents how changes in sensor and actuator data relate to each other [
9]. These relationships are then used to verify sensor and actuator values agree with the derived SCG when the system is running. Application of this approach is limited to features that can cause loss of information. A second formal method uses symbolic grammar and verification of system properties. This approach was implemented by Jones et al. [
20]. Signal temporal logic (STL) is used to formulate safety rules for sensors and actuators, based on a small portion of data from the ICS; however, only a small subset of ICS components are explored. Considering the complexity of ICS and the large volume and variety of data required to be processed and analyzed, causes one to question the scalability of this approach. Similarly, Kang et al. [
8] define process state changes and security properties using first-order linear temporal logic and use a verification engine to detect counter examples that invalidate the security properties. However, this method is limited to finding code vulnerabilities that deviate from the identified security properties, and it protects the system only against known attacks. Finally, Lin et al. [
6] propose a hybrid model that uses passive learning of symbolic models for sensors using timed automata as well as learning Bayesian networks to infer causality between sensor states and actuator states. Since the completeness of a security specification is highly dependent on historical data and the security knowledge of the domain experts, this method’s effectiveness in the higher dimensional feature space of ICS is small.
The second category of techniques is based on data driven models. Data driven models use sensor data and actuator commands to detect deviations from normal process behavior. One of these methods applies machine learning to build anomaly classification models. Weaselboard [
17] employs Bayesian networks in this fashion to detect data manipulation and zero-day attacks. A model built with this method analyzes the sensor and actuator data using a dedicated device that is connected to the backplane of the programmable logic controller (PLC). Inspired by this research, Junejo et al. [
11] tested various machine learning algorithms to design classification models for ICS anomaly detection. However, the models are limited to using a small subset of data within the ICS data set and do not provide strong evidence of the robustness and resilience of the system against unknown attacks.
Urbina et al. [
21] introduced the concept of statistical monitoring of ICS data using CUSUM (cumulative sum control chart) to detect stealthy attacks. This methodology was then used by Goh et al. [
14] in concert with DL models to build detection models that are semi-supervised. They introduce the usage of recurrent neural networks (RNN) and long short-term memory deep learning approaches that learn prediction models for sensor and actuator values. This method learns how the sensor and actuator values are related to each other during normal operation of the physical process to predict these values into the future. Next, CUSUM was used on the difference between values predicted by the model and real-time sensor and actuator values to detect stealthy attacks. In this paper, Goh et al. were limited to analyzing and evaluating their methodology against a single process within a large system. They were also limited to a small number of classes of cyber attacks. To improve on their approach, Shalyga et al. [
16] explore genetic algorithms running on small sets of neural networks to find an architecture that provides the best results for their metrics. Instead of CUSUM, they use exponentially weighted moving average smoothing (EWMA), mean
p-powered error measure, weighted
p-powered error measure, and disjointed prediction windows to improve the quality of anomaly detection. However, their model has a long time lag between the start of an attack and detection of an attack, and it retains low recall within the attack windows. A different architecture was explored by Inoue et al. [
15], using a deep neural network (DNN) and one class of support vector machine (SVM) to detect anomalies. Their work analyzes and evaluates data from all processes of a miniature ICS and explores all available attack data; however, their recall values for
of attacks were zero, and the training of the model was expensive, taking two weeks to complete. This work was followed by Kravchik and Shabtai [
22], where multiple neural network architectures were proposed to construct a forecasting model for the sensor/actuator values, and a learned threshold was used to classify and predict values as anomalous or normal. The authors concluded that a vanilla convolution neural network (CNN) with four layers performed best for anomaly detection for their data set. Although this work presents a high detection rate, some of the attacks are detected well after their successful completion. Because of the critical nature of ICS-driven processes, it is important to detect attacks as quickly as possible to provide system engineers an opportunity to respond to the attack and protect the system. In this paper, we advocate for an anomaly detection model that performs better at detecting attacks while they are still underway. Furthermore, we advocate for a deep learning-based model that is not computationally expensive to train on ICS data. A recently proposed method by Kim et al. [
23] obtained similar results to our model using the SWaT dataset; however, their model is considerably more expensive to train. They report an average training time of 2 h per process using an Intel Xeon CPU E5-2960 v4 2.60GHz, 6 NVIDIA Tesla V100 GPUs, and 512 GB RAM, whereas, our proposed model takes 20–30 min to be trained on the same dataset employing a hardware setup of 8 NVIDIA Tesla V100 GPUs (32 GB RAM) and 80 GB of memory.
To perform data driven detection, data from an ICS needs to be collected. Network packets and sensor/actuator data are the two main sources of ICS data. All of the data-driven models explored above rely on time sampled sensor and actuator data. As mentioned before, these data are discrete (actuators) and continuous (sensors) in nature and have a variety of distributions. Treatment of these data types in the preprocessing pipeline affects how the model behaves and what it learns [
24]. The data driven anomaly detection models described above treat these two features similarly and scale them to a range of 0–1 [
11], or normalize them to zero mean and unit variance [
14,
15,
16]. Scaling brings features down to the same magnitude, while normalizing forces data to a normal distribution. Scaling and normalizing are not the only forms of preprocessing used with ICS data. Some actuators can have three unique values with one of those values occurring in small instances. These values can be missed by models while providing low total errors. Treating unique types of data differently could aid in building models that do not learn to ignore underrepresented values. In addition, sensor values can be decomposed to extract more information for particular features to aid the training of models [
25,
26].
3. Methodology
In this paper, we use a data driven methodology for building an anomaly detection model that raises alarms while attacks are still in action. Sensor and actuator data from an ICS was passed through a preprocessing pipeline where sensor values are decomposed using wavelet transformation and added as features for training. A supervised neural network anomaly detection model was trained and improves on the performance of previous models explored in this domain. To our knowledge, this is the first paper to propose a CNN + LSTM parallel hybrid architecture specifically in the field of ICS and anomaly detection, verify that the model performs better than other supervised as well as semi-supervised methodologies, and require a short duration (20–30 min) to complete training. This section provides an overview of the proposed feature engineering pipeline and classification models, and details the anomaly detection framework.
3.1. Feature Engineering
Preprocessing of data is required in order to overcome the challenges that high dimensional data typical to ICS impose on cyberattack detection components. Because our proposed anomaly detection framework is faced with a large amount of high dimensional sensor and actuator data, along with evolving attack characteristics, we scaled all values to a range of 0–1. Furthermore, wavelet transform [
26] was used to transform sensor signals and obtain temporal information on multiple scales. Wavelet transformation is an invertible transformation that can be used to decompose a signal into a high and low spectrum using high and low pass filters respectively. The low pass spectrum is a down-sampled decomposition of the original signal. The high pass spectrum is the localization of higher frequencies of the original signal. These decompositions are generated by Equation (
1)
where
k is the coefficients index,
and
are low and high pass filters built from a mother wavelet function of signal
x. Once the decomposition coefficients are calculated, we append the low and high spectrum decomposition to the existing feature set of data.
In this context, wavelet transformations are preferred over Fourier transformations because of their ability to keep temporal locality information of the signal frequencies. For our purpose, we use a type of wavelet transformation that is sensitive to the alignment of signal in time called Daubechies discrete wavelet transformation (DWT) [
26]. To keep the original signal coefficients within the transformed low and high spectrum output, we apply a single level DWT transformation.
After the wavelet transformation, we labeled each time step of sensor/actuator values as attack or normal behavior. If a time step contains anomalous, faulty, or attack data, it was manually labeled as an attack instance. Furthermore, the result was converted into a sliding window format where each window size is a hyper-parameter. For each sliding window containing an attack label, the entire window was labeled as an attack behavior.
3.2. Classification Models
The next step in the proposed framework was to train a classification model for the purpose of anomaly detection. First, we concentrated on techniques for detection of temporal patterns in sensor/actuator time series data. Second, it was important to learn not only temporal patterns but also spatial dependencies and the inter-relatedness between various sensors and actuators to be able to efficiently detect attacks. We use a supervised deep neural network methodology to design a two-class (stealthy and non-stealthy) attack detection model for ICS time series sensor/actuator data. The proposed framework relies on convolution and long short-term memory layers.
3.2.1. Long Short-Term Memory Networks (LSTM)
LSTM, which is an extended form of RNN, was used to detect temporal patterns in sensor/actuator time series data. Given an input signal
, where
T is the length of the signal, an LSTM hidden state at time step
t was computed by:
where
are the element-wise sigmoid and hyperbolic tangent functions and ⨀ is the element-wise multiplication operator.
and
are the hidden state and memory cell of the previous time step.
In this context, LSTM defines the influence of the sensor/actuator input by using a sigmoid layer for each gate to be open or closed. As depicted in Equations (2)–(4),
,
, and
are input, forget, and output gates. In Equation (
5), g, which is the recurrent unit, was calculated based on the input at the current time
and the hidden state of the previous time step
. In (7),
is the current hidden state of the LSTM at time
t through tanh activation, and in (6) the memory cell,
, was calculated. The memory cell identifies the contribution of the previous time step and the current input to calculate the hidden state,
.
Figure 1 depicts this mechanism in detail.
As it is depicted in the above formulas, the LSTM model requires storage of additional cell states in memory and needs to compute these cell states. While LSTM’s ability to extract long-term temporal dependencies without suffering from the vanishing gradient problem [
28] helps with effective anomaly detection, it is a relatively computationally expensive model [
29]. The solution is to design an efficient neural network architecture to balance the utility of LSTM while minimizing the computational overhead caused by it. This balance can be achieved through the reduction of the size and depth of LSTM layers in the proposed neural network architecture.
3.2.2. Convolution Neural Network (CNN)
CNN is known to be used to extract features for normal/attack classification of data [
30,
31]. Given an input signal, a CNN with
m filters and a filter size of
n extracts an
m-dimension feature vector from every
n values in the signal. These filters can extract temporal locality from inputs and help learn temporal dependencies in multivariate time series input data [
32]. Therefore, 1D convolutions can efficiently learn temporal and spatial dependencies within time series sensor and actuator input data.
In this work, we use a specific type of convolution layer known as a dilated causal convolution layer. The causal property refers to a convolution layer where
does not depend on inputs from the future (
). This property helps preserve the temporal order of the sequential time series data [
33]. With the added dilation property, we are able to construct a more compact CNN model and still preserve global relationships between the features, because dilations allow each hidden feature in a CNN to observe an increasingly larger input space (receptive field) as the depth of the CNN increases. Hence, it allows an increase in the receptive fields of the layers without the addition of large filters [
29].
To extract the important features from the output of the convolution layers, we use a 1D MaxPooling layer. As depicted in
Figure 2, this layer selects the maximum value in the provided pooling window. This approach allows the convolution layers’ output to be reduced in its dimensions while preserving the important features learned.
3.3. Anomaly Detection Framework
In this section, we discuss the attack scenarios targeted by our proposed architecture and describe the proposed architecture built using the classification models discussed in the previous section. We also discuss the metrics and loss function used in our architecture.
3.3.1. Attack Scenarios
The proposed methodology aims to detect data manipulation attacks that spoof and inject sensor/actuator values into a PLC. These data manipulation attacks can be divided into two categories: (1) stealthy attacks, and (2) non-stealthy attacks. Stealthy attacks slowly manipulate the sensor/actuator values to gradually cause the process behavior to deviate from normal. Impact of these attacks is not observed immediately or within a short time window. Non-stealthy attacks manipulate the sensor/actuator values in shorter periods of time to force the system rapidly outside of normal cyclical behavior. The impact of non-stealthy attacks can be observed through spikes or changes in the sensor/actuator values within a short time window.
To detect both types of attacks, the detection model must learn the relationships between sensors and actuators over a short window as well as longer periods of time. In ICS, these relationships dictate how a change in one sensor/actuator affects other sensors/actuators over time. Therefore, we are learning the behavior of these components without having to encode the rules of the PLC or the physical process itself. This approach helps detect anomalies where a change in one of the components does not trigger an expected change in another component. In the proposed architecture, convolution layers are used in conjunction with LSTM layers to learn the relationships between features over different periods of time. As mentioned in
Section 3.2, convolution layers can learn the temporal dependencies that can be used to identify normal sensor/actuator behavior, as well as known attack behaviors, in a defined time window. Hence, they are useful at detecting non-stealthy attacks. LSTM layers help identify normal as well as attack behavior for stealthy attacks due to their effectiveness at learning longer historical dependencies.
3.3.2. Non-Stealthy Attacks Representation
In the proposed architecture, a convolution layer accepts the sensor/actuator values as the input features after the DWT transformation and learns how these features individually, and as a group, change over a time window. The architecture contains multiple stacked convolution layers with the number of convolution layers treated as a hyper-parameter. Our final architecture uses four convolution layers. Kravchik and Shabtai [
22] recommend using four CNN layers, and our own heuristic search demonstrated that recall values for two and three layers were lower and that no significant increase in recall was realized with additional layers beyond four. Additional layers also required more computing time and memory. Kravchik and Shabtai. Along with the number of layers, each convolution layer requires hyper-parameters to be defined for
,
,
, and
. These hyper-parameters are picked based on empirical analysis of the results obtained from searching combinations of hyper-parameters values. Results of the hyper-parameter searches for each model are presented in their respective case studies in
Section 4.4.
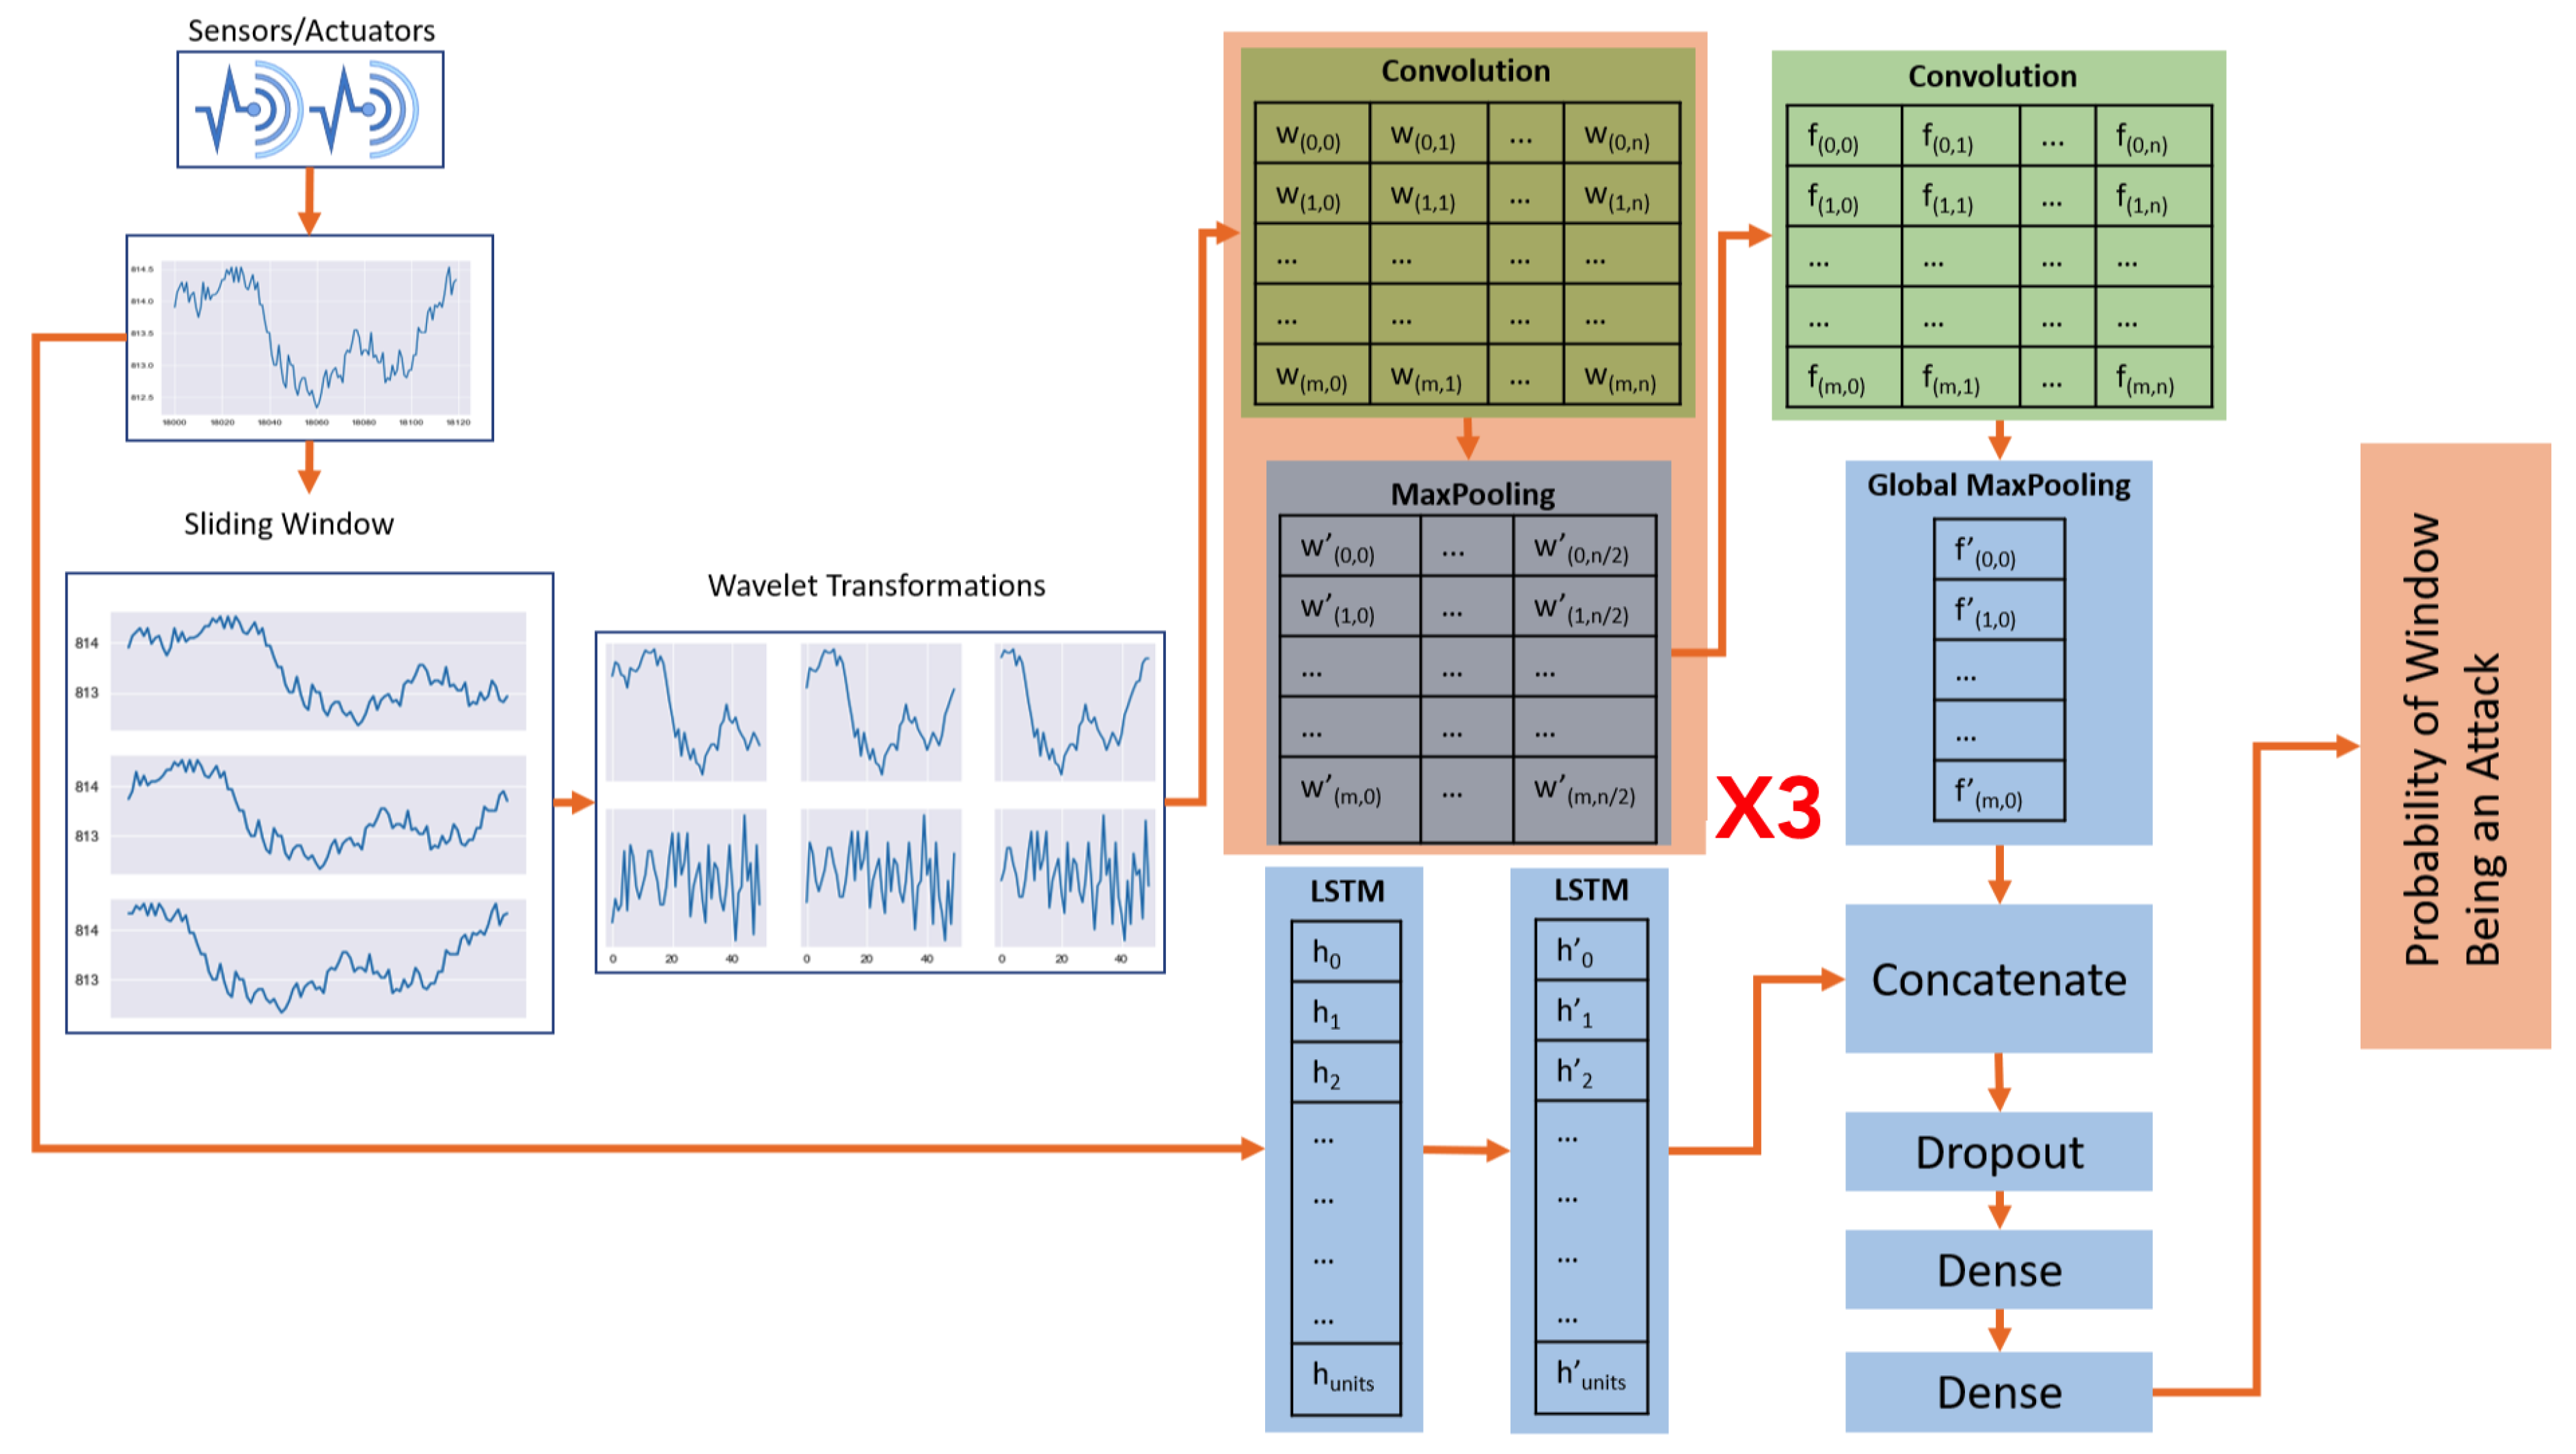
As shown in
Figure 3, each convolution layer is followed by a pooling layer. The first three convolution layers are followed by a 1D MaxPooling layer. In addition, a final convolution layer is followed by a GlobalMaxPooling layer to reduce the dimension of the data and pick the most important features from each convolution filter.
3.3.3. Stealthy Attacks Representation
Along with CNN, LSTM layers are used to learn the temporal dependencies within the data beyond the specified time window on which the CNN is being trained. This approach can identify attacks where sensors/actuators are targeted for a long period of time with gradual physical impact in the system. In our architecture, two LSTM layers are used to learn the long-term dependencies within the input data. Each LSTM layer is initialized with a hyper-parameter of
, where
refers to the dimensionality of the hidden states whose activations will be propagated to output. The initial LSTM layer returns full sequences of cell output (
) for every time step fed into the layer, returning a three dimensional output of
. This output is then passed as input to the second layer, which returns only the last output (
) sequence of
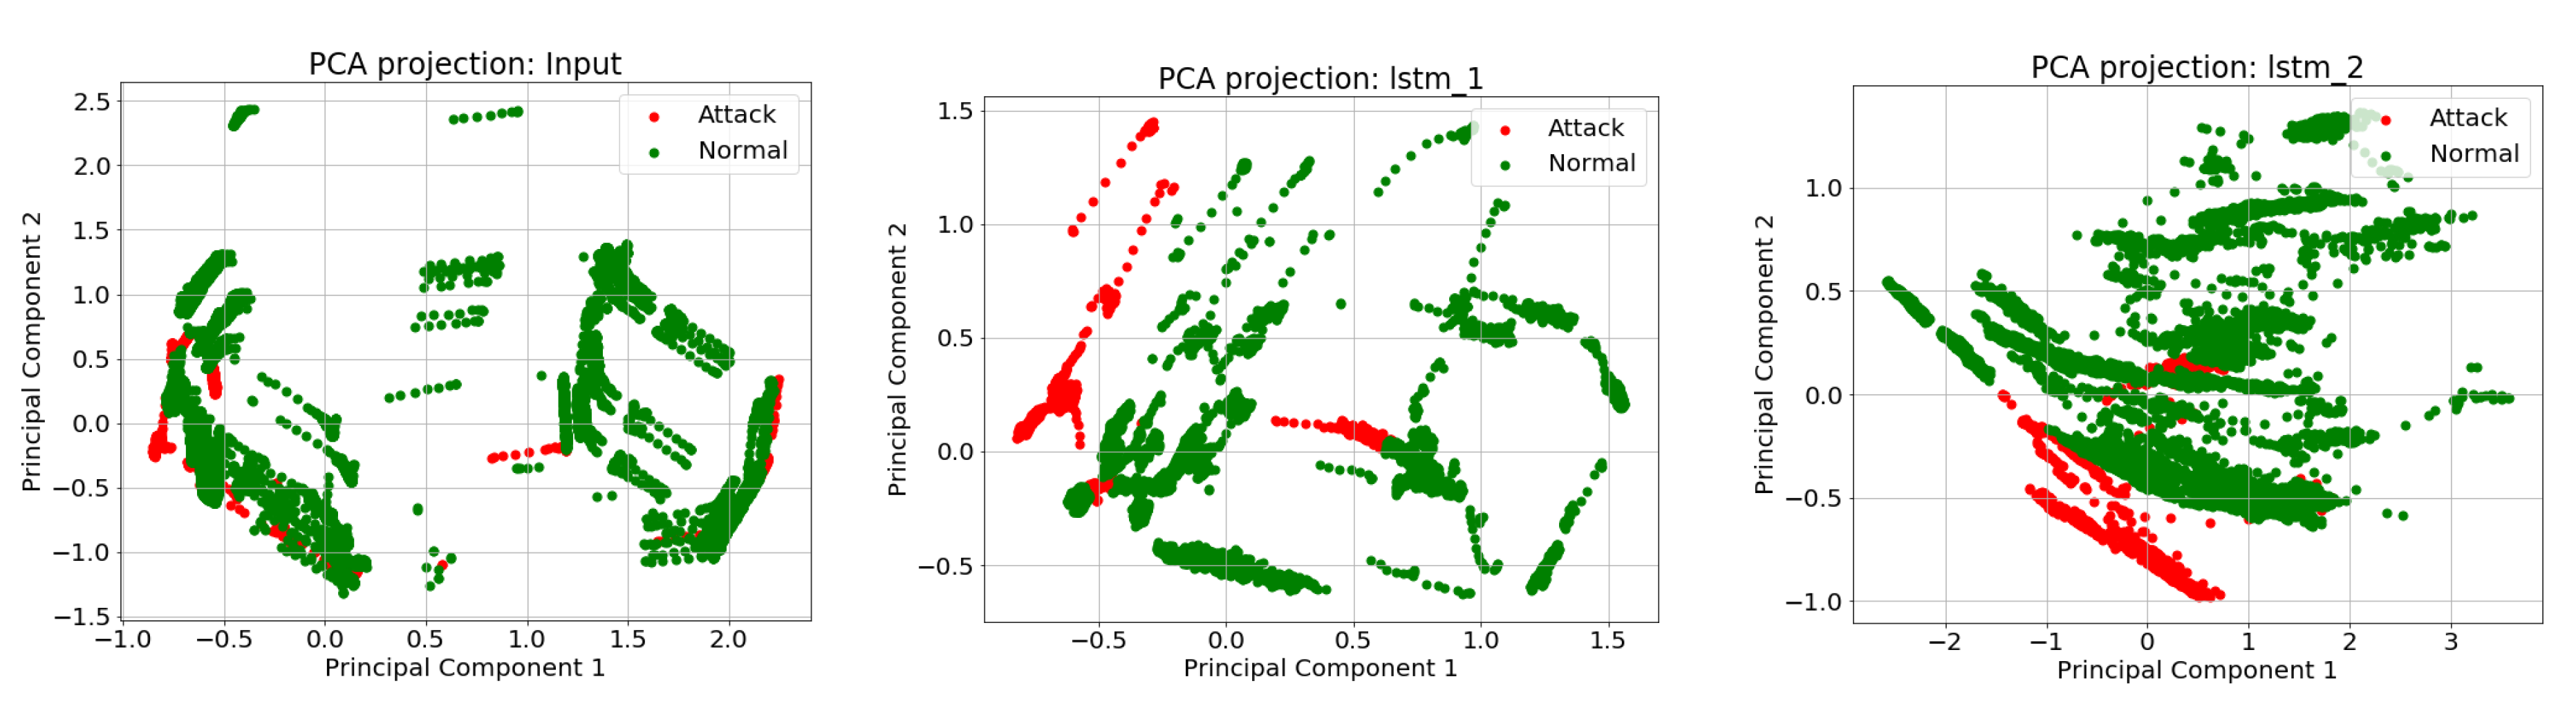
. Output obtained from the LSTM layers will represent input features to effectively separate system normal behavior from anomalous behavior. This process is visible in the principal component analysis (PCA) decomposition,
Figure 4, of the outputs from our two LSTM layers. As observed in
Figure 4, initially the attack values are not separable from normal values within a data set. After passing the input through the LSTM layers, the normal and attack values are more segregated.
3.3.4. Detection
In our architecture, LSTM cells contain 128 activation units, resulting in an output of
. Once the results from LSTM layers are received, they are concatenated with the results from the global max pooling layer. Global max pooling is applied to get a two-dimensional presentation, in which each element is the result of pooling the feature map. The concatenated feature representation is then passed through a dropout layer [
34], with a dropout rate of
, to prevent overfitting through randomly disabling a percentage of the neurons at each training step.
As shown in
Figure 3, the output of the dropout layer is passed through two, fully connected dense layers. These layers each have a single unit size of
. The final dense layer in the architecture outputs the probability 0–1 of an input being an attack. In this context, probability >
is labeled as the time window that the system is under attack, and probability <
is labeled as normal. To achieve this probability bound, the final dense layer uses a
activation function.
3.3.5. Optimizer and Loss Functions
Since our architecture is trained for a binary classification problem of identifying a time-window as normal or attack, we use the loss function of
Binary Cross-Entropy with added class weights as the loss function during training. Binary Cross-Entropy is calculated by using Equation (
8),
where
is the loss function,
y is the true label,
is the class weight assigned to an attack label,
is the weight assigned to a normal label, and
is the prediction from the model. Here, class weights are derived from the ratio of occurrence of normal and attack classes within the training data.
Finally, we use the
Adam [
35] algorithm as an optimizer during the model training process. The
Adam optimizer requires four parameters:
,
,
, and
. We use the parameters’ default values proposed by Kingma and Ba [
35], where
,
,
, and
×
.
3.3.6. Metrics
The aim of our architecture is to detect ICS anomalies and attacks based on the sensor and actuator data. To measure the performance of this architecture, we focus on the metrics of recall (Equation (
9)), precision (Equation (
10)), F1-score (Equation (
11)), and number of attacks detected. While we want the model to have a higher F1-score, this should not come at the expense of leaving a large number of attacks undetected. Therefore, we calculate recall for each individual attack window to verify how well the model is predicting each attack window. For the purpose of this study, an attack is detected if an anomaly is detected within any attack time window.
where
number of windows correctly identified as attack,
number of windows incorrectly identified as normal, and
number of windows incorrectly identified as attack.
3.4. Implementation
Algorithm 1 summarizes the implementation of our methodology for training the anomaly detection model described in the sections above. Sensor and actuator data from ICS (
X), indices of sensors in the data set (
S), manually encoded attack labels (
Y), batch size (
m), and window size (
) are passed as input to train the model. Initially, sensor and actuator data are scaled to a magnitude of
based on the distribution of a small subset of the data. Following the scaling, the data is transformed into a sliding window format using the hyper-parameter
. The sensor data in each window goes through DWT. The transformed data are appended to the input along with the original actuator data. The data is then split into train and test groups. A small percentage of data is used for training. The purpose of training is to establish a performance metric to assess how the model performs when presented with new attack behaviors. After the metric is obtained, a neural network model is trained, using a batch size of
m, with the process described in
Section 3.3. This training algorithm uses a weighted binary cross-entropy function to update the internal weights of the neural network. The obtained weightings are then used to test the anomaly detection model against data it did not observe during the training process. The model can then be deployed to catch attacks in real time within the processes on which it is trained.
| Algorithm 1: Summary of Methodology. |
 |
4. Case Study
The effectiveness of the proposed framework is verified using sensor and actuator data from the Secure Water Treatment (SWaT) test bed [
36]. SWaT is a functional miniature replica of a water treatment plant located at the Singapore Institute of Technology [
37].
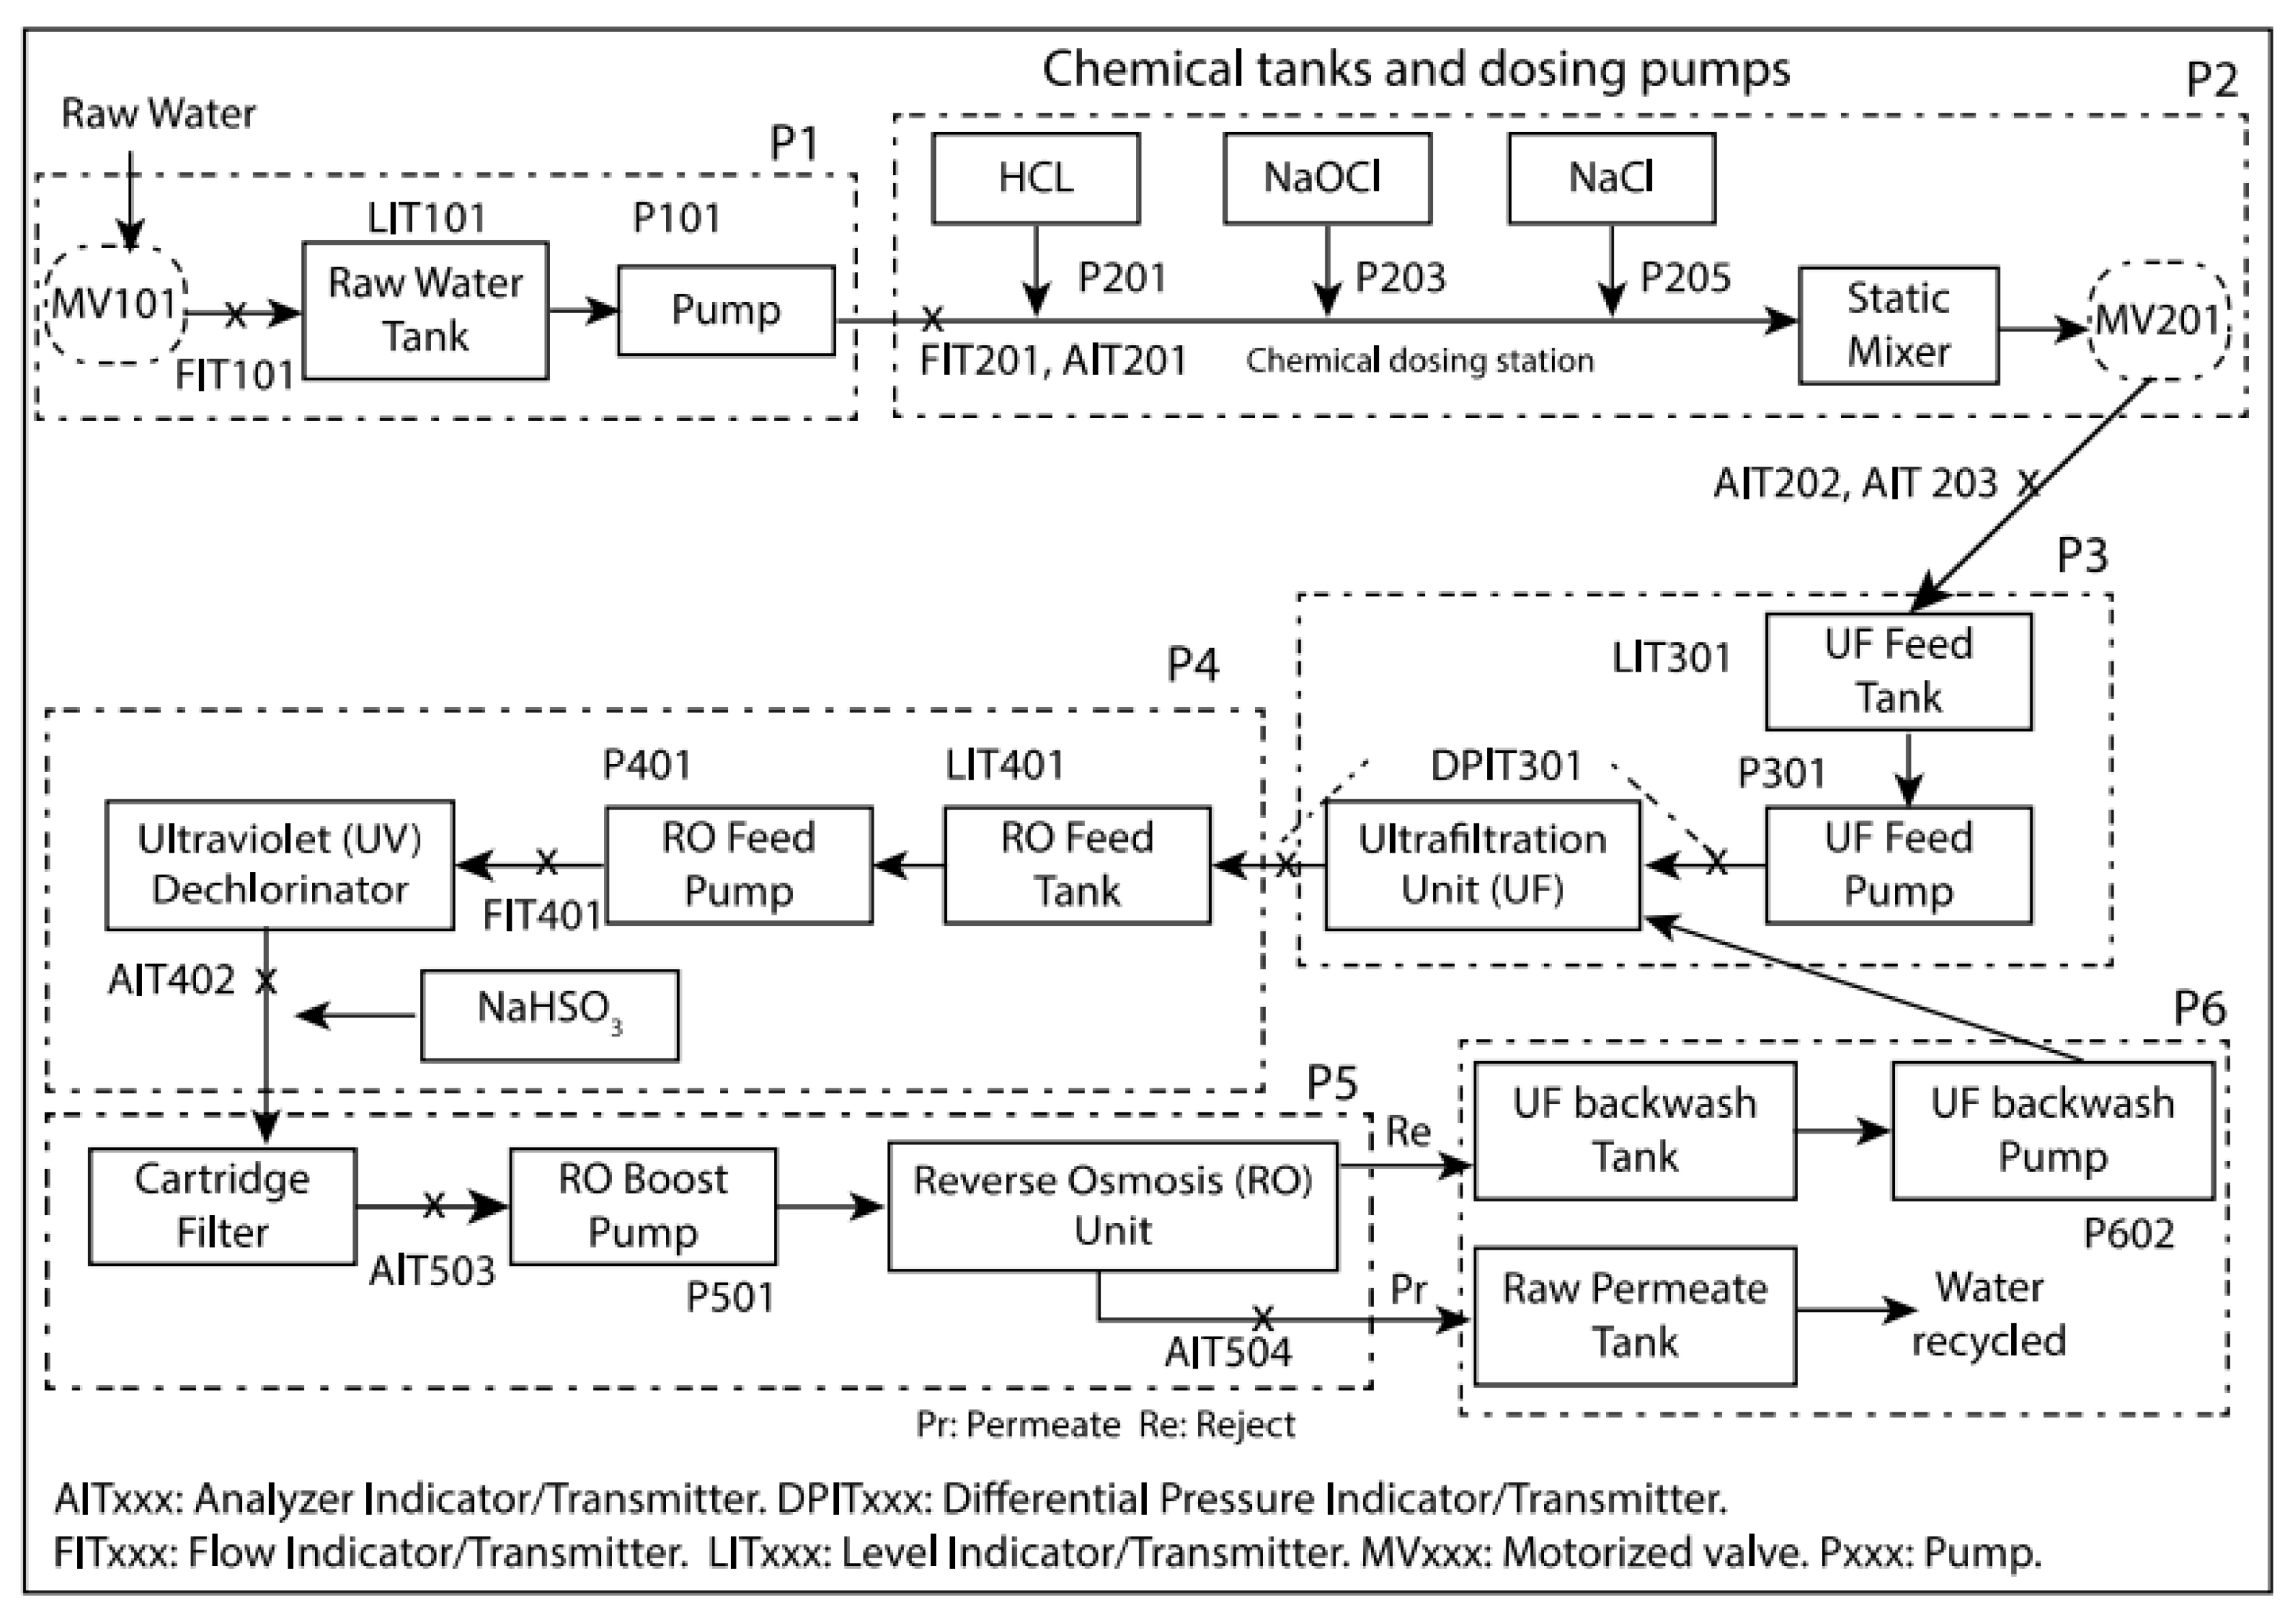
Figure 5 provides a schematic of the SWaT water treatment system. The treatment process, divided into six sub-processes denoted P1 to P6, produces 5 gallons per minute of doubly filtered water. Each of the sub-processes is controlled by a primary PLC and has a redundant hot-standby PLC. The water treatment process starts at P1, as incoming water is taken in and stored in a tank. Then, the water is passed to P2 for quality assessment, and chemical dosing is carried out to bring the water quality to an acceptable threshold. In P3, the water is led through a fine set of filtration membranes to remove the undesired materials, and in P4 chlorination and de-chlorination processes are conducted. In P5, the water is pumped through a reverse osmosis (RO) process. The output from the RO process is stored in P6. The RO concentrate is used for backwashing P3 filtration membranes, and the RO permeate is the end product of the process—recycled water.
4.1. Swat Data-Set
The SWaT data-set [
37] contains
of continuous operations data from 51 sensors and actuators (
Table 1) that are embedded in the six water treatment process steps. The data is collected over seven days of normal operation and four days of a hackathon event where a total of 36 successful attacks were carried out. Descriptions of the attack scenarios can be found on the website (
https://itrust.sutd.edu.sg/itrust-labs_data-sets/data-set_info/#swat) [
37]. Most of the successful attacks are based on injecting contrived process variable values into the PLC, resulting in the PLC accepting the spoofed value as real sensor data. Some are stealthy attacks where the sensor values are modified slowly.
Overall, the data-set contains 53 columns (1 for timestamp, 1 for attack label, 51 for sensor/actuator values) and rows. Data is recorded once per second for a total of 10 days, 13 h, 33 min, and 11 s of data (912,791 s total).
4.2. Data Preprocessing
To deal with noisy data and manage the high cardinality, the SWaT data set is put through three preprocessing steps.
4.2.1. Scaling and Normalization
In order for each feature to contribute effectively to the learning algorithm’s output, the features are scaled to a range of 0–1. In this case, normalization of the features is not feasible because the sensors’ measurements and actuators’ status do not follow a normal distribution. Therefore, normalization of the features would result in the loss of information about their original distributions.
4.2.2. Slicing and Window Based Segmentation
A fixed size sliding window () is selected as a hyper-parameter. In a data set of i entries, () windows are required. To determine , a hyper-parameter search was carried out in the range of 50–300, which resulted in a window size of 200 as the best fit for each model.
4.2.3. Performing Wavelet Transformation
Once the data is split into time windows, wavelet transformation is carried out on the sensor data for each time window. This transformation increases the number of features from 51 to 76.
Finally, the data is divided into train and test sets— of the data is used for training, for testing. of the training set data is labeled as attack data and included in the training set to increase the effectiveness of the detection algorithm. Thus, the model is trained on a small proportion of the attack data, while the remaining attack data is included in the testing set to validate the performance of the model against new attacks.
4.3. Hardware Specification
Training is carried out in Google Compute cloud instances. Different configurations of machines are picked based on the type of model we are training. The convolution only models are trained in a cloud computing instance with an NVIDIA Tesla K-80 GPU (12 GB RAM) and 61 GB of memory. The CNN+LSTM models are trained with a cloud computing instance with 8 NVIDIA Tesla V100 GPUs (32 GB RAM) and 80 GB of memory. To train the SVM model, we use a processor optimized computing instance with 8 vCPUs and 64 GB RAM.
4.4. Anomaly Detection Results
The attack detection performance of the SVM, CNN, and CNN + LSTM anomaly detection models is summarized in
Table 2. Each model was trained and tested using the SWaT data set. A more detailed discussion of each model’s performance follows.
4.4.1. Support Vector Machine
A baseline study was performed based on the support vector machine method presented by Inoue et al. [
15] to verify the performance of unsupervised methodologies with this data set. A one-class classification SVM using a radial basis function kernel is used to learn a classification boundary for normal data (excluding attack data) and identify the outliers. Then the trained model was tested on the attack data to detect anomalies that are not within the learned classification boundary. Results of the SVM (
Table 2) show that the model performed with high precision; however it was not able to detect 16 of 36 attacks and took a long time to train (4 h). On further investigation, we find that SVM missed a combination of stealthy as well as non-stealthy attacks during the testing phase. This inefficiency and failure to detect anomalies were also reported by other researchers who applied unsupervised methodologies [
14,
15,
16] to the SwaT dataset.
4.4.2. Convolutional Neural Network
The initial experiment was based only on the convolution-Maxpooling layers where the ability of CNN to learn temporal dependencies within a time-window helps identify normal and attack behaviors.
As mentioned in
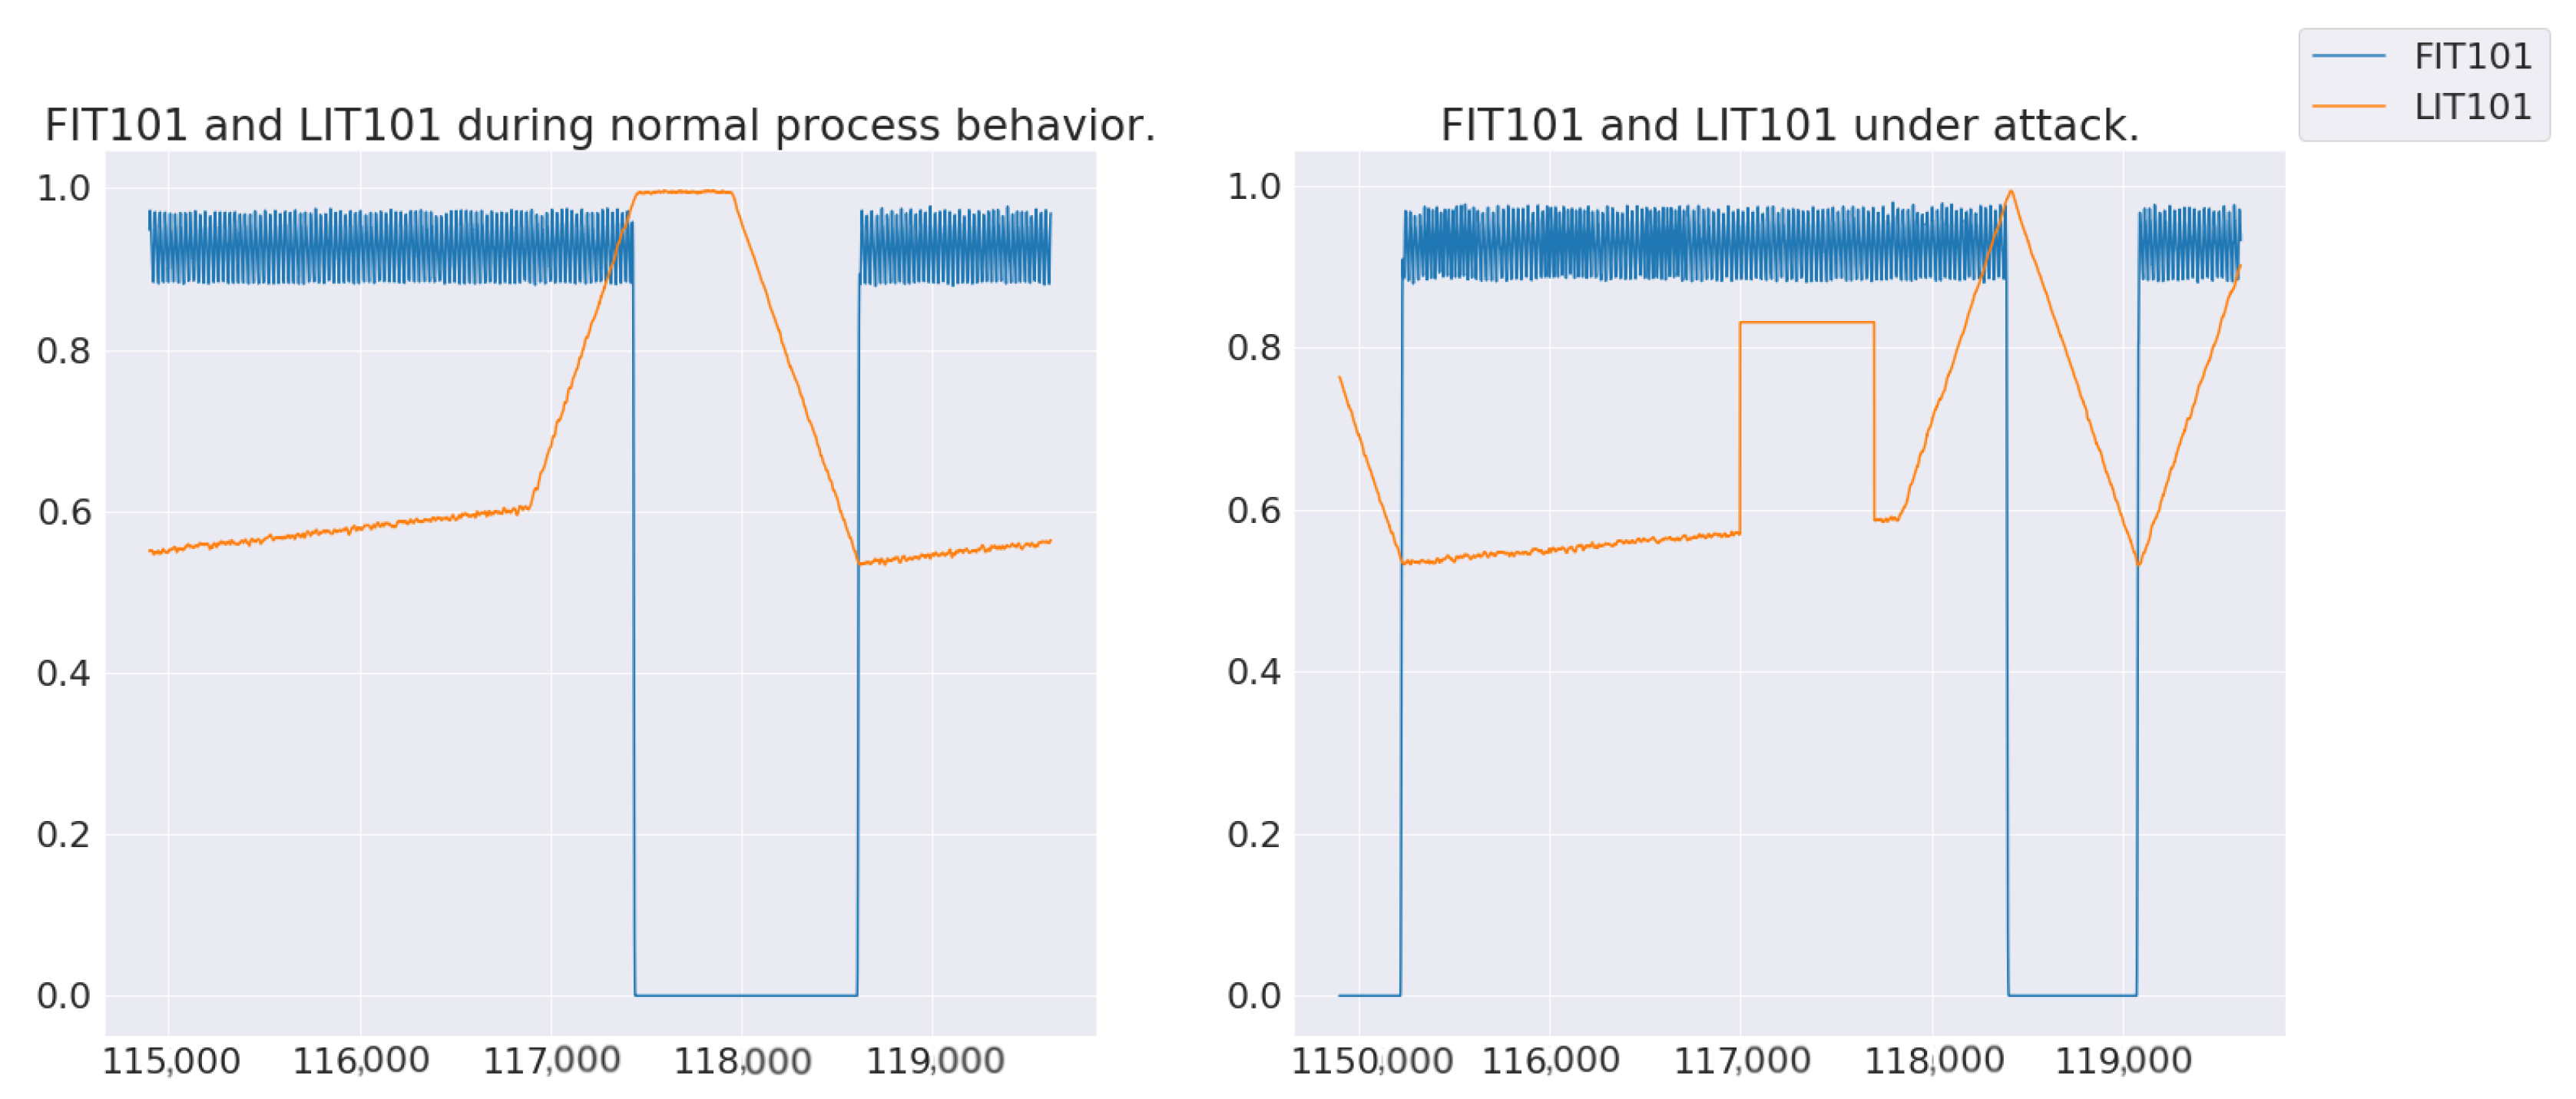
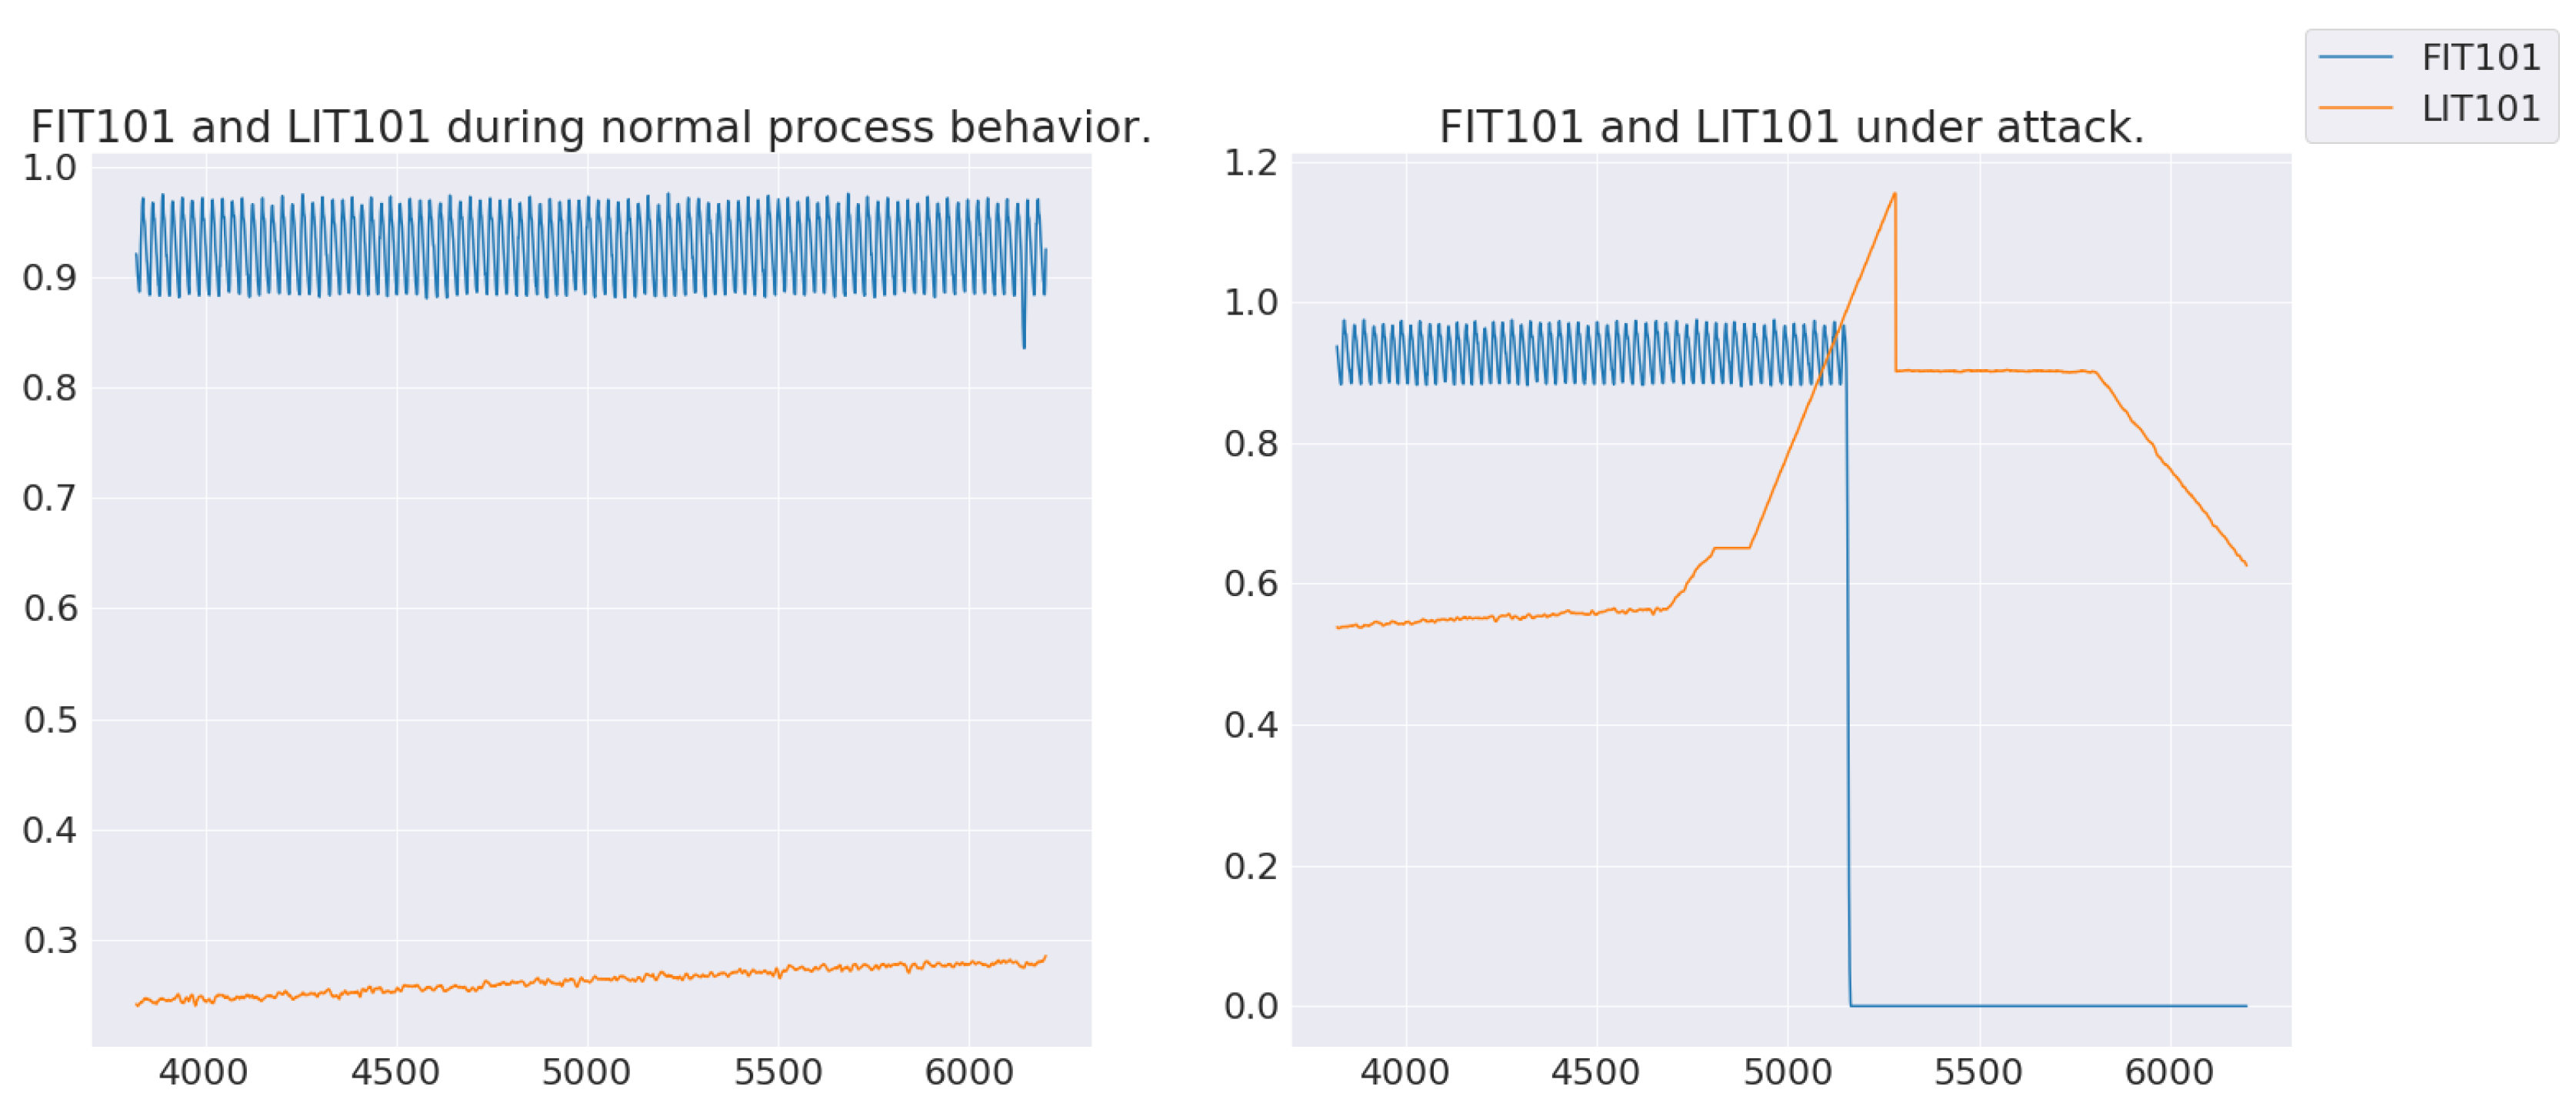
Section 3.3, CNN is able to learn the relationships between sensors/actuators within a time window to detect non-stealthy attacks. For example, learning the relationship between Level Indicator (LIT) 101, Motor Valve (MV) 101, and Flow Indicator (FIT) 101 allows the model to infer the presence of anomalous behavior within the attack window. Therefore, an attack that results in tank overflow in Process 1 through the manipulation of LIT101 and MV101 (
Figure 6) can be detected by the model.
Hyper-Parameters
Hyper-parameter search space for this model is limited to the parameters of dilation rate, window size, and filter size. A grid search for these hyper-parameters resulted in a filter size of 5, the number of filters for each layer of convolution as , and a window size of 200 as the best fit for this CNN architecture.
Results
Training time of the proposed model was 30 minutes, and the cost of training was approximately
when computed in a cloud instance. While the metrics show better performance than the SVM approach, this model still fails to catch 13 of 36 attacks. (See
Table 2) Seven of the 13 missed attacks are stealthy attacks.
4.4.3. Convolutional Neural Network+Long Short-term Memory
To improve on the CNN architecture and overcome the weakness of convolutions where the layers are limited to learning time windowed relationships between sensors and actuators, LSTM layers are included as part of the proposed model. As described in
Section 3, LSTM layers overcome this weakness of convolutions by learning long-term sequences to facilitate detection of stealthy attacks. In this architecture, usage of LSTM improves on the classification of anomalous behaviors that result from gradual changes in sensor/actuator values. For example, stealthy attack #3 (
Figure 7) slowly increases the value of LIT 101 by 1 mm/sec to artificially restrict flow into the tank, causing pump damage. Initially, this model was trained with 1 LSTM layer; however, the model had minimal improvement in its recall score relative to the CNN-only model. After increasing the number of LSTM layers to 2, the recall score and the number of attacks detected improved.
Hyper-Parameters
To find the best model, there are multiple hyper-parameters that need to be optimized: window size, batch size, kernel size of convolutions, and dilation rates. To this end, we explore the range of 1–10 for the kernel size, then the filter sizes are adjusted to match the output size of the LSTM cells. Window sizes were evaluated in the range of 50–300; dilation rates were evaluated in the range of 2–8. Each convolution layer contains a dilation rate of where n is the layer number of the convolution. The search for optimal hyper-parameters in these spaces are carried out using a grid-style search with the aim to optimize recall score.
The hyper-parameters used in the final model are batch size of 200, window size of 200 s, kernel size of 4, filter sizes of , and dilation rates of . In addition, we limit our LSTM cells to 128 dimensions to help the model learn a higher dimensional relationship between various features over a long period of time.
Results
While the proposed model achieved better performance than previous deep learning methodologies, it still failed to detect 9 of 36 attacks within the SWaT data set. Multi-point attacks (20, 21, 24, 25, 30, 32) and three single point attacks (27, 28, 31) are not detected by our anomaly detection model. The three undetected single point attacks and multi-point attack #32 did not cause physical changes within the process, failing in their goal of violating the safety properties of the system. Therefore, the impact of failing to detect these attacks is minimal. However, multi-point attack #30 keeps pumps P-101 and P-102 off to stop water outflow to the other processes. While this attack succeeds, the attack does not cause damage to the other processes in the time it took for the attack to start and stop. Therefore, 4 of the 9 undetected attacks cause physical harm to the system. In attacks
, a level indicator value is set to a value only slightly above an actionable threshold while another component is attacked at the same time. These attacks were harder for our model to catch because noise is present in the level indicator training data—values fluctuate despite needing to be a single value. Further exploration of methods for reducing noise in sensor data could improve model performance regarding these types of attacks. The final model completed training in 25 min while missing 9 of 36 attacks. As shown in
Table 3, this model performs better in detecting single point attacks than the results in Inoue et al. [
15]. Furthermore, our model can be trained within 25 min at a cost of approximately
, which is significantly lower than the 2 weeks that it took for the model proposed by Inoue et al. [
15]. In addition, we find that implementing the assumption provided by Kravchik and Shabtai [
22] increases the number of attacks detected by our proposed model to 32 out of 36 attacks. Under this assumption, alarms that were previously classified as false positives are considered to be true positives since they are raised after an attack period has ended and before the system returned to the normal state. While this approach increases the number of detected attacks, it is not ideal to detect attack after the fact.
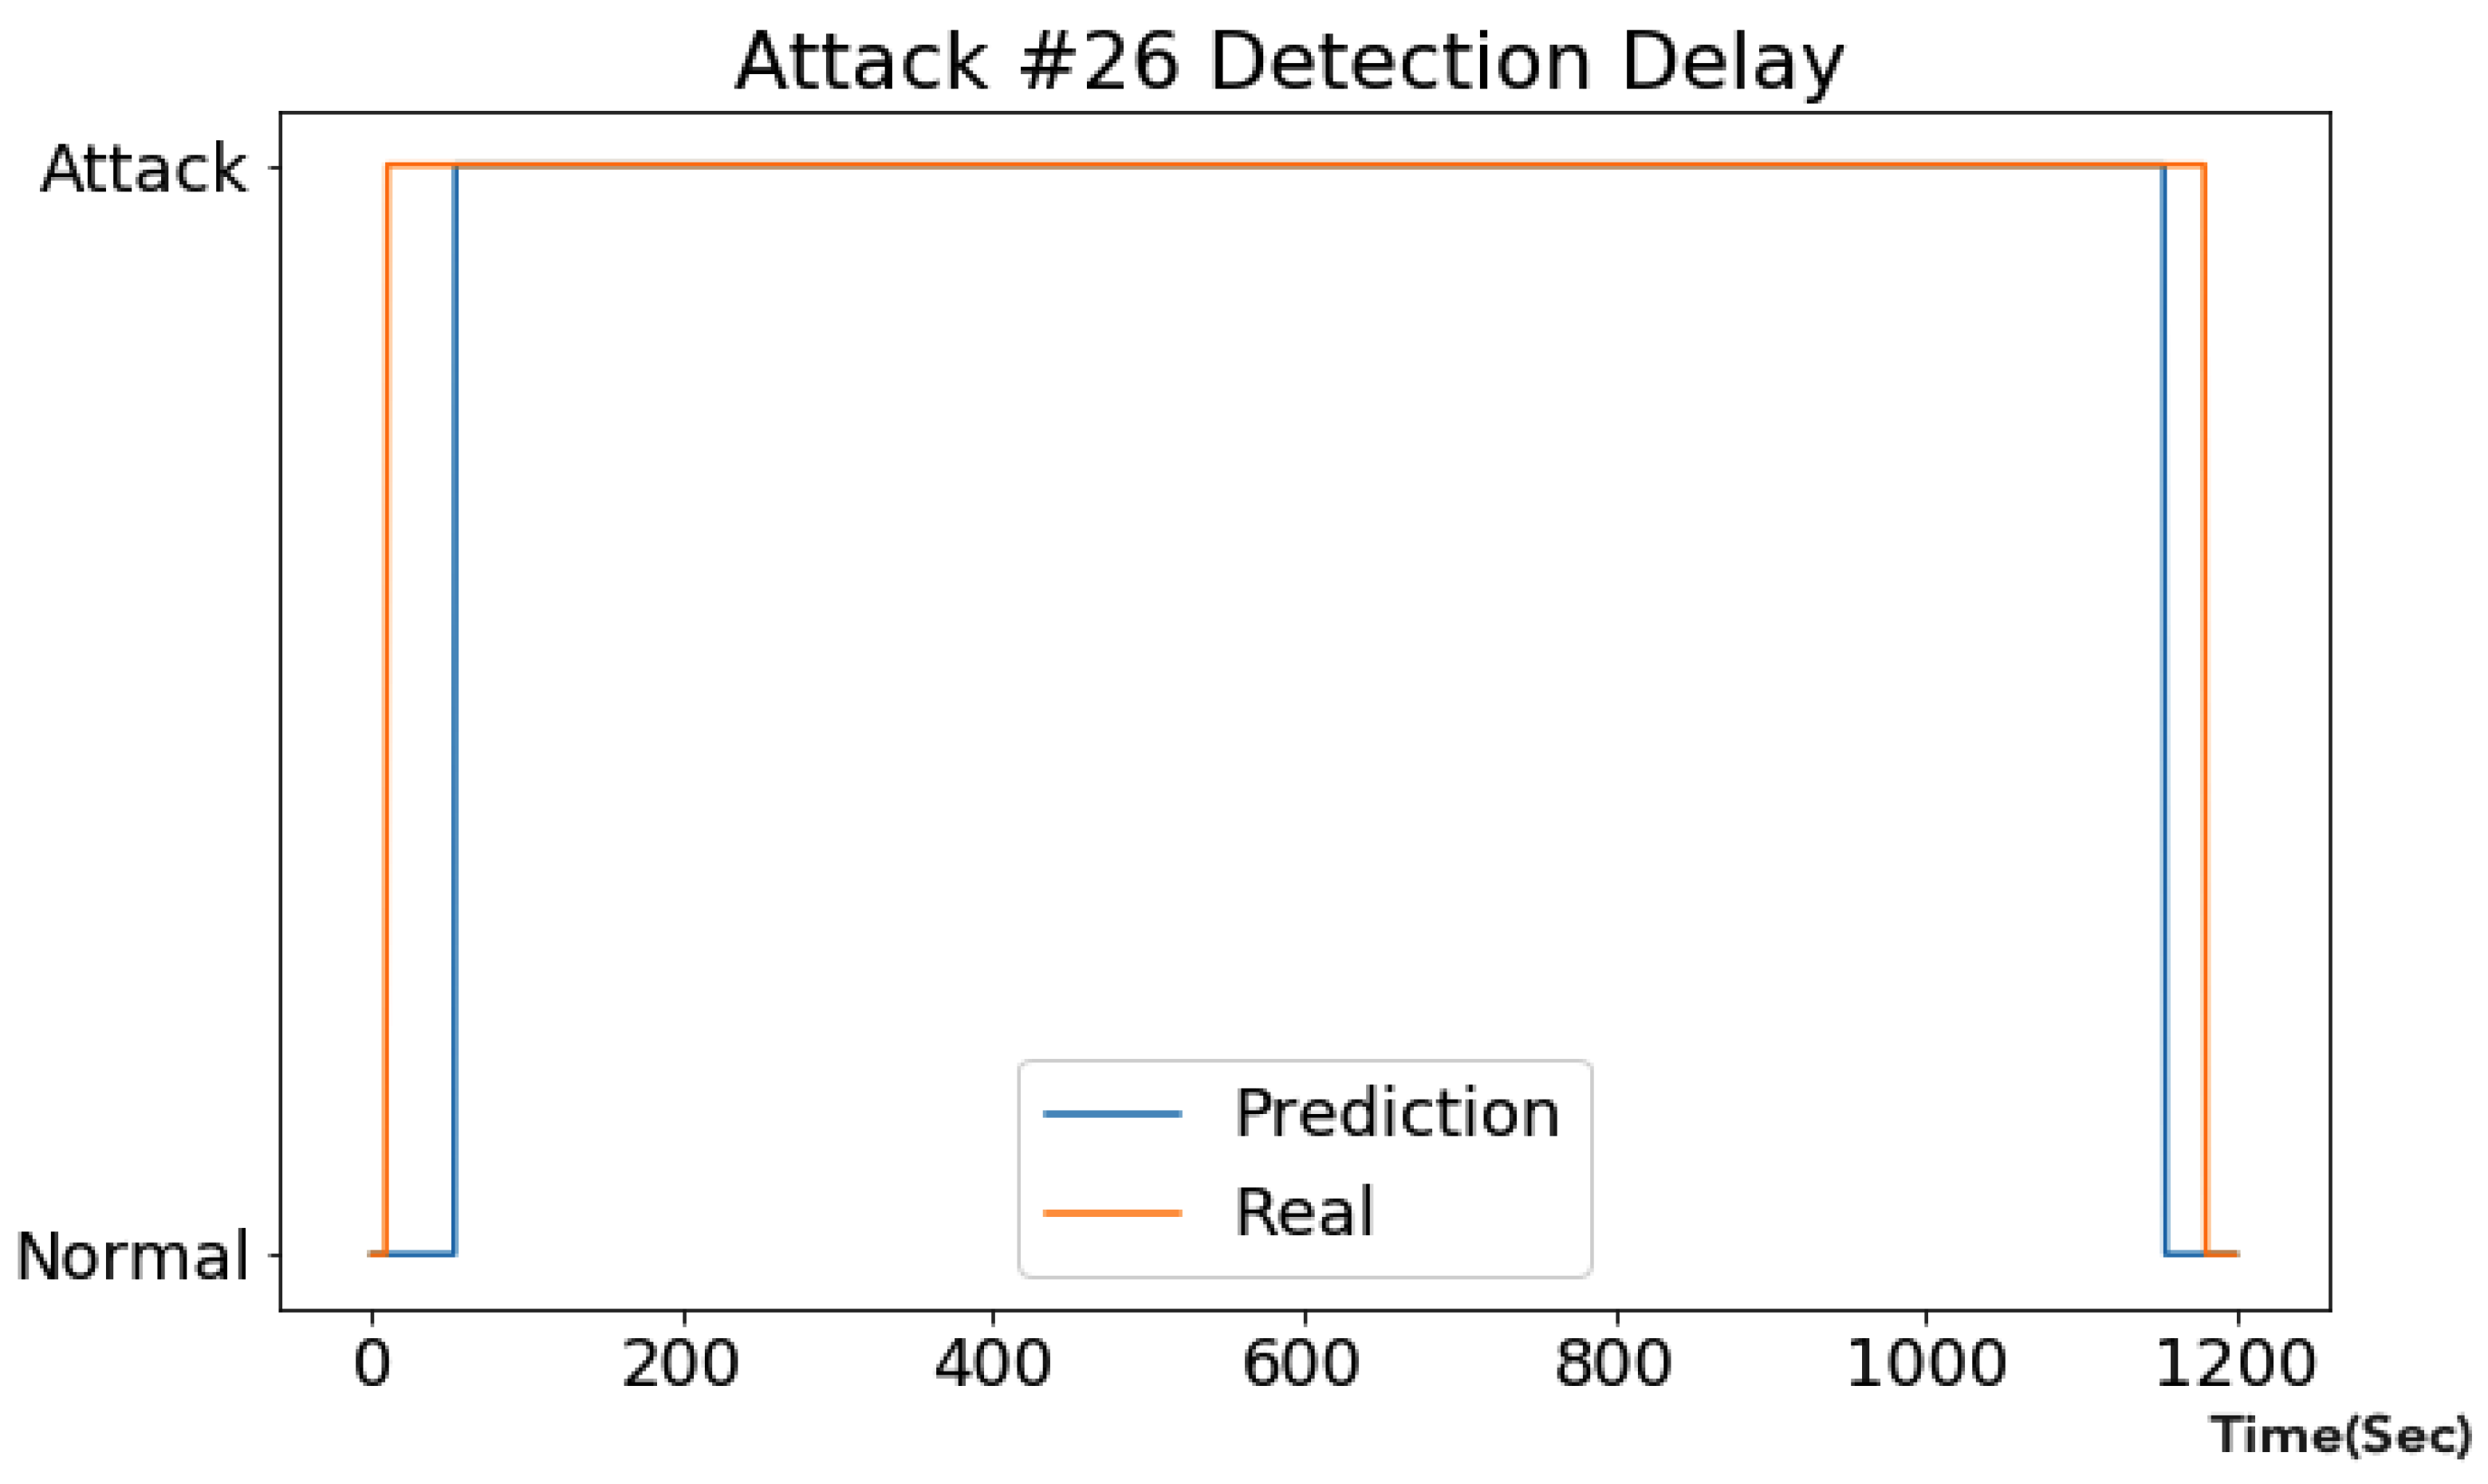
Detection latency is a key parameter in evaluating a model’s utility for real-world anomaly detection. In attack #26 (
Figure 8), an attacker sets LIT-401 to values lower than the lowest acceptable threshold in order to cause a tank to overflow. The CNN+LSTM model raises the initial alarm at 44 s after the attack begins, and
of the attack window is correctly labeled as an attack. The rapid, accurate response helps detect the attack before it causes physical harm to any process components. Similar detection patterns were observed for the other attacks detected by the CNN+LSTM model. Overall, this method detects attacks earlier than the Shalyga et al. [
16] model. In
Table 3, recall rates and detection delays for each attack in the SWaT data set are compared to a baseline formed by results from Inoue et al. [
15] and Shalyga et al. [
16].
5. Discussion
This paper proposes a CNN + LSTM supervised deep learning anomaly detection model for detecting stealthy and non-stealthy attacks targeting sensors and actuators in industrial control systems. As mentioned in
Section 2, previous criticisms of supervised anomaly detection methodology within this domain have focused on their inability to catch novel attacks that were not available during training of the model. Analysis of the final model derived in this paper shows that supervised models can perform empirically better than semi-supervised models in catching known and unknown attacks (
Table 3). Furthermore, it is shown that supervised methodologies can offer performance similar to unsupervised methodologies in the context of ICS anomaly detection.
Along with criticism of supervised methodologies, deep learning methodologies have been criticized for their inability to expand to cover an entire process or system [
14] and maintain an inexpensive training cost [
15]. In this paper, we provide a training architecture with feature engineering that can train on the entire data set of a water treatment plant, while maintaining low cost) and a high detection rate (
Table 3). With the availability of high power computing at low hourly costs, industrial sectors can add a layer of security to their processes by leveraging deep learning methodologies and creating an anomaly detection system with low cost and time penalty.
While this paper provides improvements in supervised deep learning architectures that can be used for creating anomaly detection models for ICS, it works under the assumption that attack labels can be added to the sensor/actuator data. There are various ways of obtaining the necessary labeling. One approach is to label faults in the data set as attacks. At the process level, faults are going to have the same characteristics as an attack as both are violating the normal procedure of the process. Labeled data can also be collected by simulating attacks using methods such as honeypots [
39], simulations [
40,
41], or deep learning attack generation techniques [
42]. While these are simulations of working ICS, they offer data that can be used to build an extra layer of protection for these systems.
6. Conclusions
This paper provides a novel approach to overcome challenges that are unique to operational technologies and industrial control systems, namely the variety of data types and ranges that are obtained from various components. Data collected for physical processes in ICS are discrete in nature for actuators and continuous for sensors; therefore, new tools and algorithms are required to interpret time-series observations of these values and provide precise and quick detection of intrusions.
In this paper, we explore an LSTM + CNN-based supervised anomaly detection methodology for ICS that catches 27 out of 36 attacks in SWaT testbed data while maintaining a low cost training time. We use a wavelet transformation feature engineering pipeline for data preprocessing to encode information for training our model. Various deep learning, as well as unsupervised methodologies were explored for a comprehensive comparison. Through this work, we observe higher performance for a supervised methodology compared to previous unsupervised and semi-supervised deep learning methodologies when applied to the same data set.
Future work will focus on validating the proposed model on different data sets and adapting the methodology and knowledge base to better differentiate between component failure and attack.


