You are currently viewing a new version of our website. To view the old version click .
Electronics
  • Article
  • Open Access

17 July 2020

Combining K-Means and XGBoost Models for Anomaly Detection Using Log Datasets

,
,
and
1
Department of Informatics Engineering, University of Coimbra, 3030-290 Coimbra, Portugal
2
Informatics Department, Polytechnic of Viseu, 3504-510 Viseu, Portugal
3
CISeD—Research Centre in Digital Services, Polytechnic of Viseu, 3504-510 Viseu, Portugal
*
Author to whom correspondence should be addressed.
This article belongs to the Special Issue Advanced Cybersecurity Services Design

Abstract

Computing and networking systems traditionally record their activity in log files, which have been used for multiple purposes, such as troubleshooting, accounting, post-incident analysis of security breaches, capacity planning and anomaly detection. In earlier systems those log files were processed manually by system administrators, or with the support of basic applications for filtering, compiling and pre-processing the logs for specific purposes. However, as the volume of these log files continues to grow (more logs per system, more systems per domain), it is becoming increasingly difficult to process those logs using traditional tools, especially for less straightforward purposes such as anomaly detection. On the other hand, as systems continue to become more complex, the potential of using large datasets built of logs from heterogeneous sources for detecting anomalies without prior domain knowledge becomes higher. Anomaly detection tools for such scenarios face two challenges. First, devising appropriate data analysis solutions for effectively detecting anomalies from large data sources, possibly without prior domain knowledge. Second, adopting data processing platforms able to cope with the large datasets and complex data analysis algorithms required for such purposes. In this paper we address those challenges by proposing an integrated scalable framework that aims at efficiently detecting anomalous events on large amounts of unlabeled data logs. Detection is supported by clustering and classification methods that take advantage of parallel computing environments. We validate our approach using the the well known NASA Hypertext Transfer Protocol (HTTP) logs datasets. Fourteen features were extracted in order to train a k-means model for separating anomalous and normal events in highly coherent clusters. A second model, making use of the XGBoost system implementing a gradient tree boosting algorithm, uses the previous binary clustered data for producing a set of simple interpretable rules. These rules represent the rationale for generalizing its application over a massive number of unseen events in a distributed computing environment. The classified anomaly events produced by our framework can be used, for instance, as candidates for further forensic and compliance auditing analysis in security management.

1. Introduction

Hosts and network systems typically record their detailed activity in log files with specific formats, which are valuable sources for anomaly detection systems. The growing number of hosts per organization and the growing complexity of infrastructures result in an increasingly massive amount of recorded logs available—requiring simpler and cheaper anomaly detection methods. While classic log management applications based on manual or preset rule-based analysis still hold value, they do not scale well with the large volumes of data that are currently available. Moreover, they are limited in terms of exploratory analysis: they fail to detect anomalies not predefined in the rules (i.e., based on prior knowledge) and/or require considerable operator expertise to reach their full potential. This opens the way for the introduction of new approaches, which are less dependent on prior knowledge and human-guided workflows and are able to extract knowledge from large volumes of log data in a scalable and (semi)automated way. Moreover, taking advantage of the available computational resources may also contribute to achieving performance and accuracy for identifying anomalies and retrieving forensic and compliance auditing evidence.
Over the past years, several automated log analysis methods for anomaly detection have been proposed. However, most of those proposals are not suitable to the scale needed for identifying unknown anomalies from the growing high-rate amount of logs being produced and their inherent complexity. In the scope of the ATENA H2020 Project [1,2], we faced this challenge while building a Forensics and Compliance Auditing (FCA) tool able to handle all the logs produced by a typical energy utility infrastructure.
To address such challenges, we researched novel integrated anomaly detection methods employing parallel processing capabilities for improving detection accuracy and efficiency over massive amounts of log records. These methods combine the k-means clustering algorithm [3] and the gradient tree boosting classification algorithm [4] to leverage the filtering capabilities over normal events, in order to concentrate the efforts on the remaining anomaly candidates. Such an approach may greatly contribute to reducing the involved computational complexity.
The characteristics of abnormal system behaviors were obtained by extracting 14 statistical features containing numerical and categorical attributes from the logs. Then, the k-means clustering algorithm was employed to separate anomalous from normal events into two highly coherent clusters. The previous binary clustered data serve as labeled input to produce a gradient tree boosting algorithm implemented by the XGBoost system [5]. Its role is to produce a set of simple rules with the rationale for generalizing the classification of anomalies of a large number of unseen events in a distributed computing environment. K-means, XGBoost and Dask [6] provide the tools for building scalable clustering and classification solutions to find out the candidate events for forensic and compliance auditing analysis.
The rest of this paper is organized as follows. Section 2 discusses background concepts and related work. Section 3 describes the proposed framework. Section 4 presents the validation work and discusses the achieved results, and Section 5 concludes the paper.

3. Proposed Framework

Motivated by the related work, we propose an integrated method with filtering mechanisms to improve detection accuracy and efficiency in scenarios involving large amounts of logs. This method is supported by the k-means clustering and the gradient tree boosting classification algorithms, as implemented by the XGBoost system. To overcome the limitations of existing anomaly detection methods that spend a significant amount of time building the models for the whole dataset, we built three different tools for improving detection accuracy and efficiency.
This section starts with a formal presentation of the algorithm of the model, followed by a discussion of the three compounding tools used for implementing the proposed approach.

3.1. Description of the Algorithm

The proposed approach is formalized in Algorithm 1, which describes how to combine k-means and XGBoost. The algorithm is implemented as a function that takes as input a set of events E and returns the identification of the anomaly a n o m a l y c l u s t e r , the classified events y p r e d 1 , total classified events t o t a l e v e n t s and the total of those events classified as anomalies t o t a l a n o m a l i e s .
Algorithm 1 Proposed Algorithm
INPUT:E, Event Set
  • S C LUSTER ( )
  • C C LIENT ( S )
  • G D ISTRIBUTED A RRAY ( E )
  • k 2
  • k m KM EANS ( C , k )
  • k m . T RAIN ( G )
  • Y k m . P REDICT ( G )
  • X XGB OOST ( X )
  • X . TRAIN ( Y , Y )
  • y p r e d X . PREDICT ( G )
  • for all i y p r e d do
  •     if y p r e d i > 0.5 then
  •           y p r e d i 1 1
  •           k 2 k 2 + 1
  •     else
  •           y p r e d i 1 0
  •           k 1 k 1 + 1
  •     end if
  • end for
  • if k 1 > k 2 then
  •       a n o m a l y c l u s t e r 1
  •       t o t a l a n o m a l i e s k 2
  • else
  •       a n o m a l y c l u s t e r 0
  •       t o t a l a n o m a l i e s k 1
  • end if
  • t o t a l e v e n t s k 1 + k 2
OUTPUT: y p r e d 1 , Cluster Predictions
OUTPUT: a n o m a l y c l u s t e r , Identification of the anomaly cluster
OUTPUT: t o t a l e v e n t s , Total number of events
OUTPUT: t o t a l a n o m a l i e s , Total number o anomalies
It starts by initializing the cluster S and activating the client connection C to the cluster S. Then the distributed array G is prepared from the received events in E. The next step is to initialize the k-means model K m for binary classification in the cluster ( k = 2 ) from the distributed array G to separate events into two distinct clusters in Y. Then, the XGBoost model X is initialized with the previously predicted events Y being provided as an input for training in the cluster through the use of the client connection C. The final prediction y p r e d is achieved from the XGBoost model X. In the next stage, each of those predictions ( i y p r e d ) is classified according to the cluster they belong to in y p r e d 1 . Such a classification will be determined by evaluating the total number of events in clusters k 1 and k 2 , so as to decide which corresponds to the anomaly cluster. To that aim, 0.5 was considered as the threshold to classify events as belonging to clusters 1 or 2 ( y p r e d i > 0.5 ).
After all events have been classified, the cluster including the fewer number of events ( k 1 > k 2 ) will correspond to the anomaly cluster, and such decision will stored in a n o m a l y c l u s t e r .

3.2. Tools

The framework encompasses three tools that may be independently combined in a cooperative way for normalizing raw data and for producing a model able to achieve evidence for forensic and compliance auditing analysis. The “fca_normalization” tool is used to normalize the raw data, “fca_model” produces the model and “fca_analysis” provides the pieces of evidence for forensic and compliance auditing analysis.
The normalization tool takes as input HTTP raw data logs and normalizes data into a new file. Optionally, the encoded features may also be specified. In case encoding is not provided or in the case of missing feature values, the tool automatically applies an encoding label. The tool can be invoked, for example, by using the following command:
  • python fca_normalization
  •       -in NASA_access_log_Jul95
  •       -in_encoding in_encoding.data
  •       -out logs_NASA.csv
  •       -out_encoding out_encoding.data
In this example, “fca_normalization” receives the raw HTTP log data file “NASA_access_log_Jul95” along with the optional encoding file “encoding.data”. The output normalized file is saved as “logs_NASA.csv”. Finally, the tool optionally defines the encoding table in the "out_encoding.data" file.
The modeling tool takes as input the previously normalized data and builds the XGBoost classification model by making use of the gradient tree boosting algorithm after applying the k-means clustering algorithm. In the example invocation provided next, the input file “logs_NASA.csv” contains the HTTP raw log data and the output model is saved as “fca_xgboost.pkl”.
  • python fca_model
  •   -in logs_NASA.csv
  •   -out fca_xgboost.pkl
The forensic and compliance auditing analysis tool takes as input the model and the normalized events in order to identify the anomalies. In the invocation example provided next, the input model in read from ‘fca_xgboost.pkl’, and the normalized data is read from ‘logs_NASA.csv’. The final output containing the anomaly events is saved on ‘outlier_events.csv’.
  • python fca_analysis
  •      -in_model fca_xgboost.pkl
  •      -in_data logs_NASA.csv
  •      -out outlier_events.csv
Table 1 summarizes the inputs and outputs for each tool.
Table 1. Tools’ inputs and outputs.

4. Discussion and Evaluation

This section addresses the validation of the proposed framework. First, we discuss feature extraction. Next, based on the extracted features, we describe the initial application of the k-means clustering algorithm for dividing the dataset into two different clusters. Finally, we discuss how to use the previous clustered data for training a scalable gradient tree boosting implemented by the XGBoost system.
For the sake of readability, throughout this section we extensively use as reference a set of well-known, publicly available datasets [40]. These datasets consist of traces containing two months’ worth of all HTTP requests to the NASA Kennedy Space Center WWW server, involving 1,871,988 logged events. This dataset was selected because it is probably the largest log-based dataset publicly available, allowing us to assess our scalability claims.

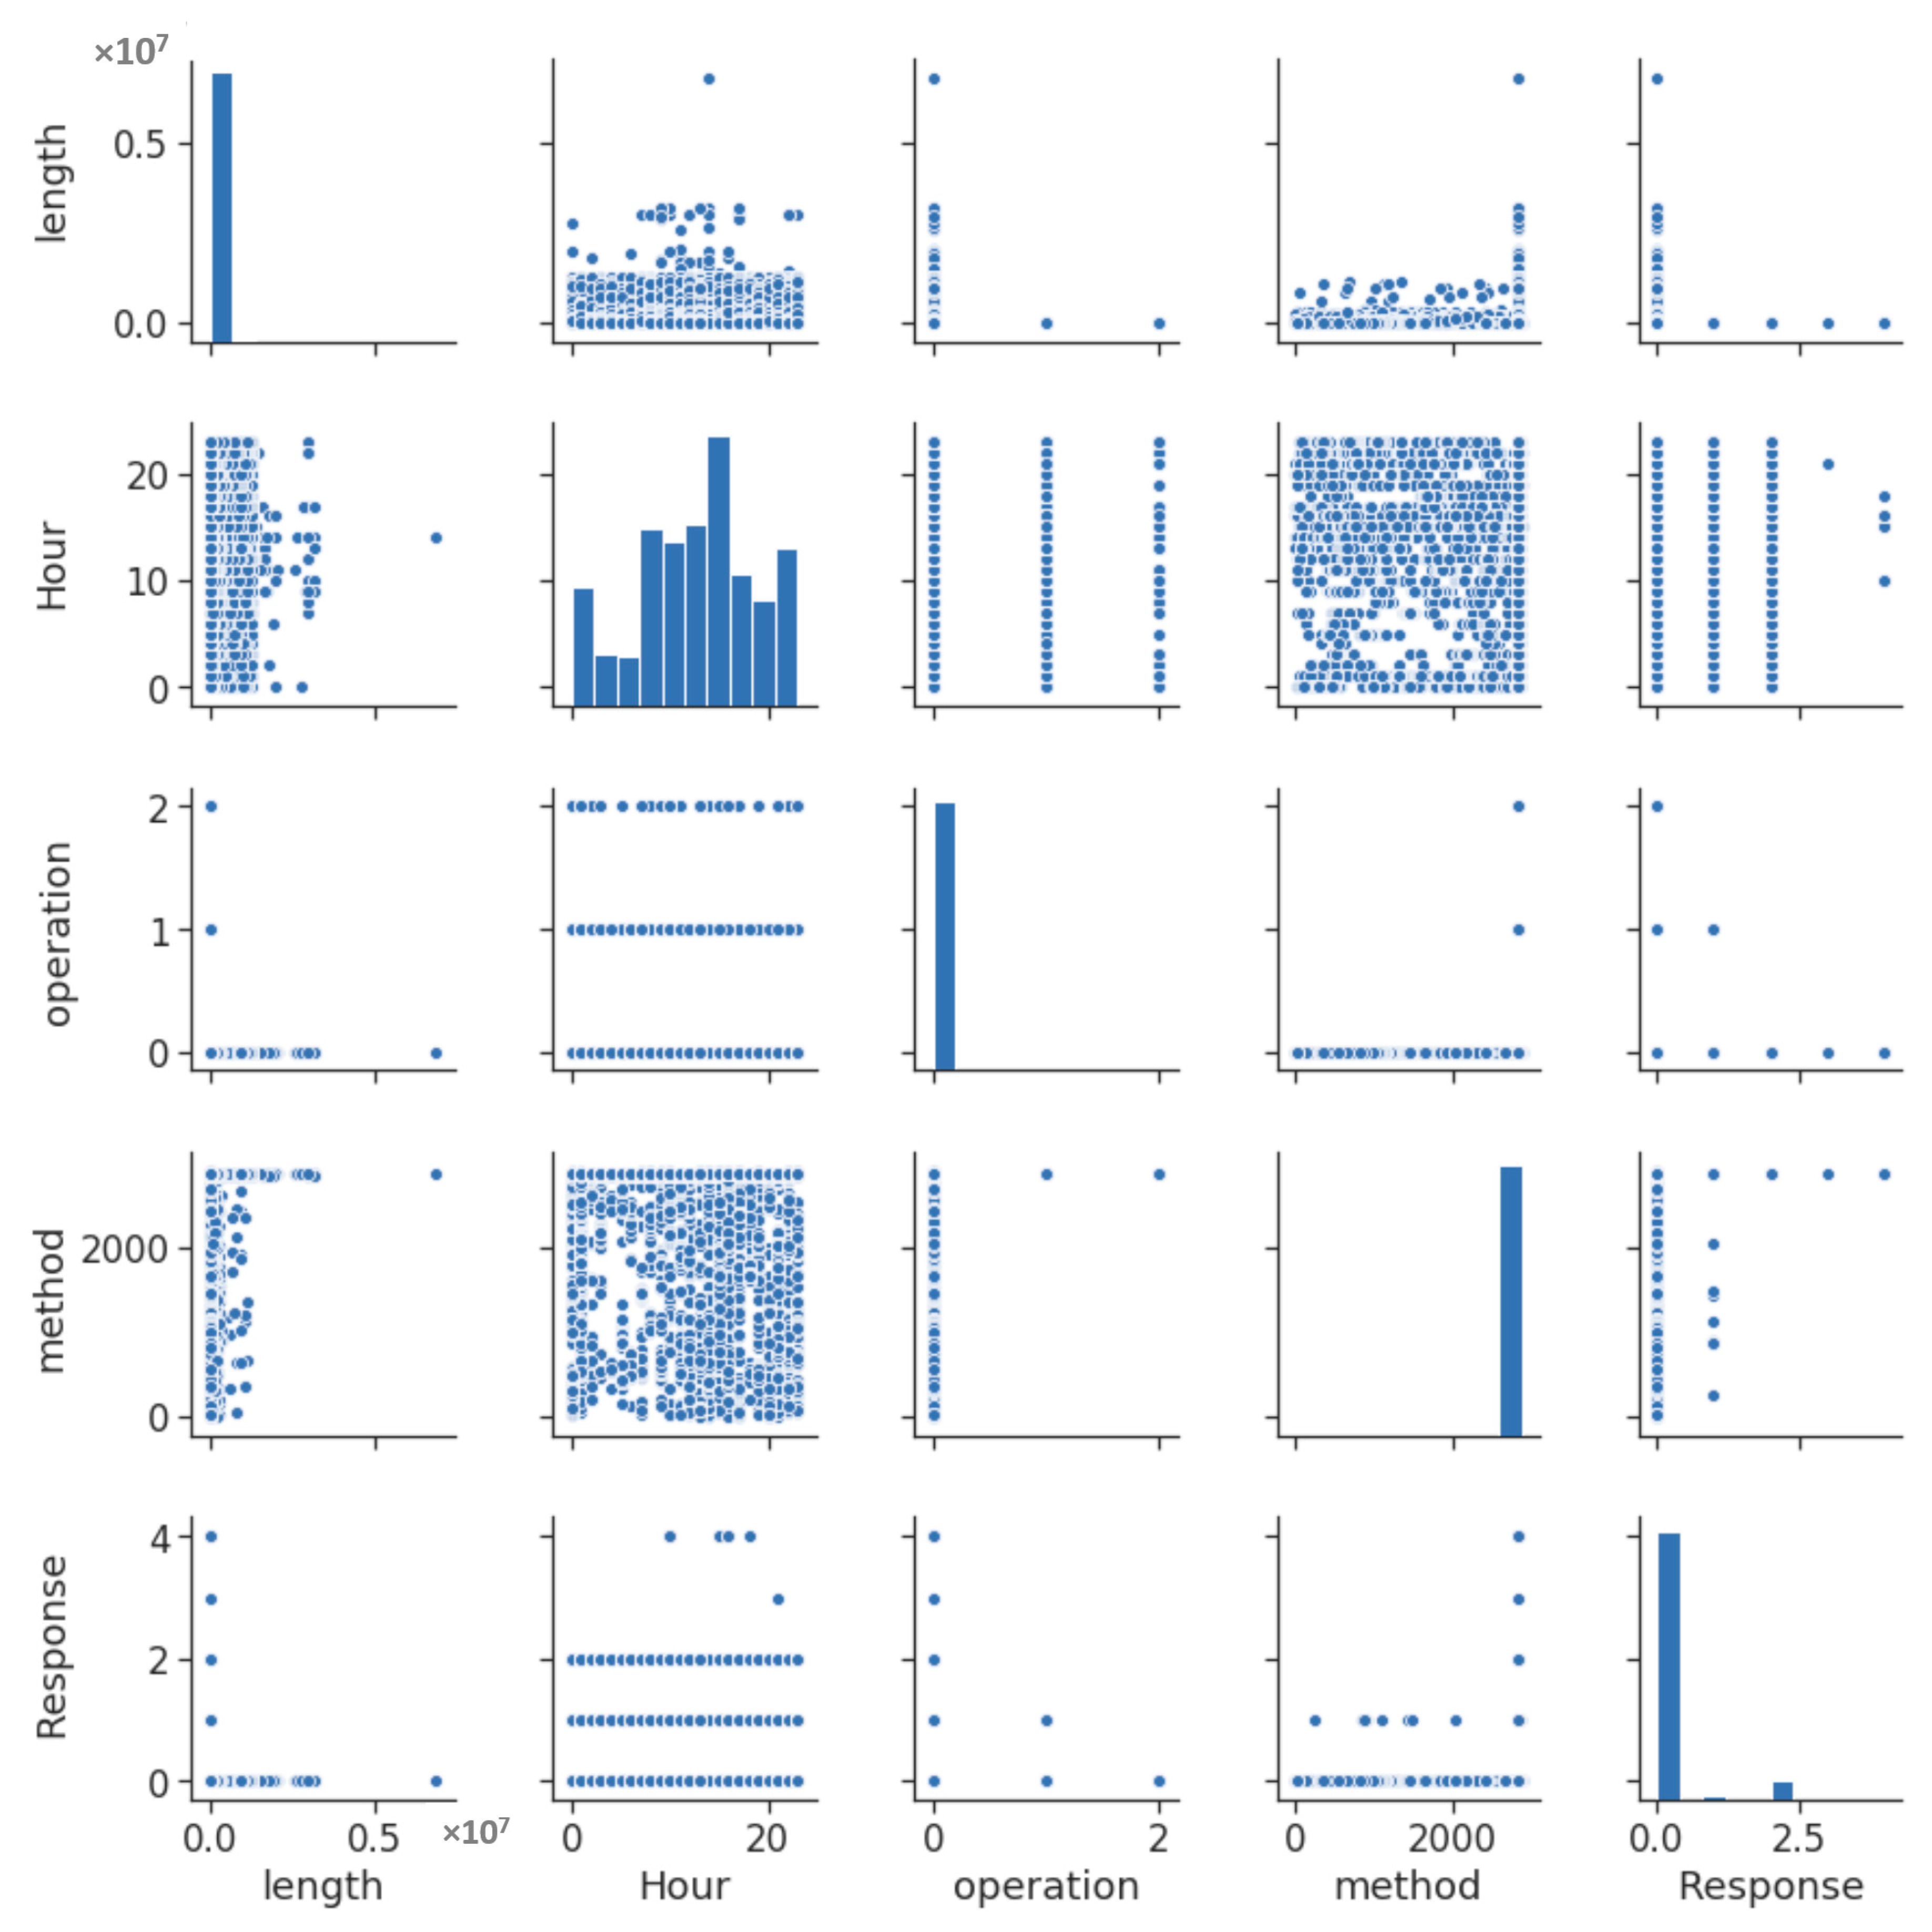
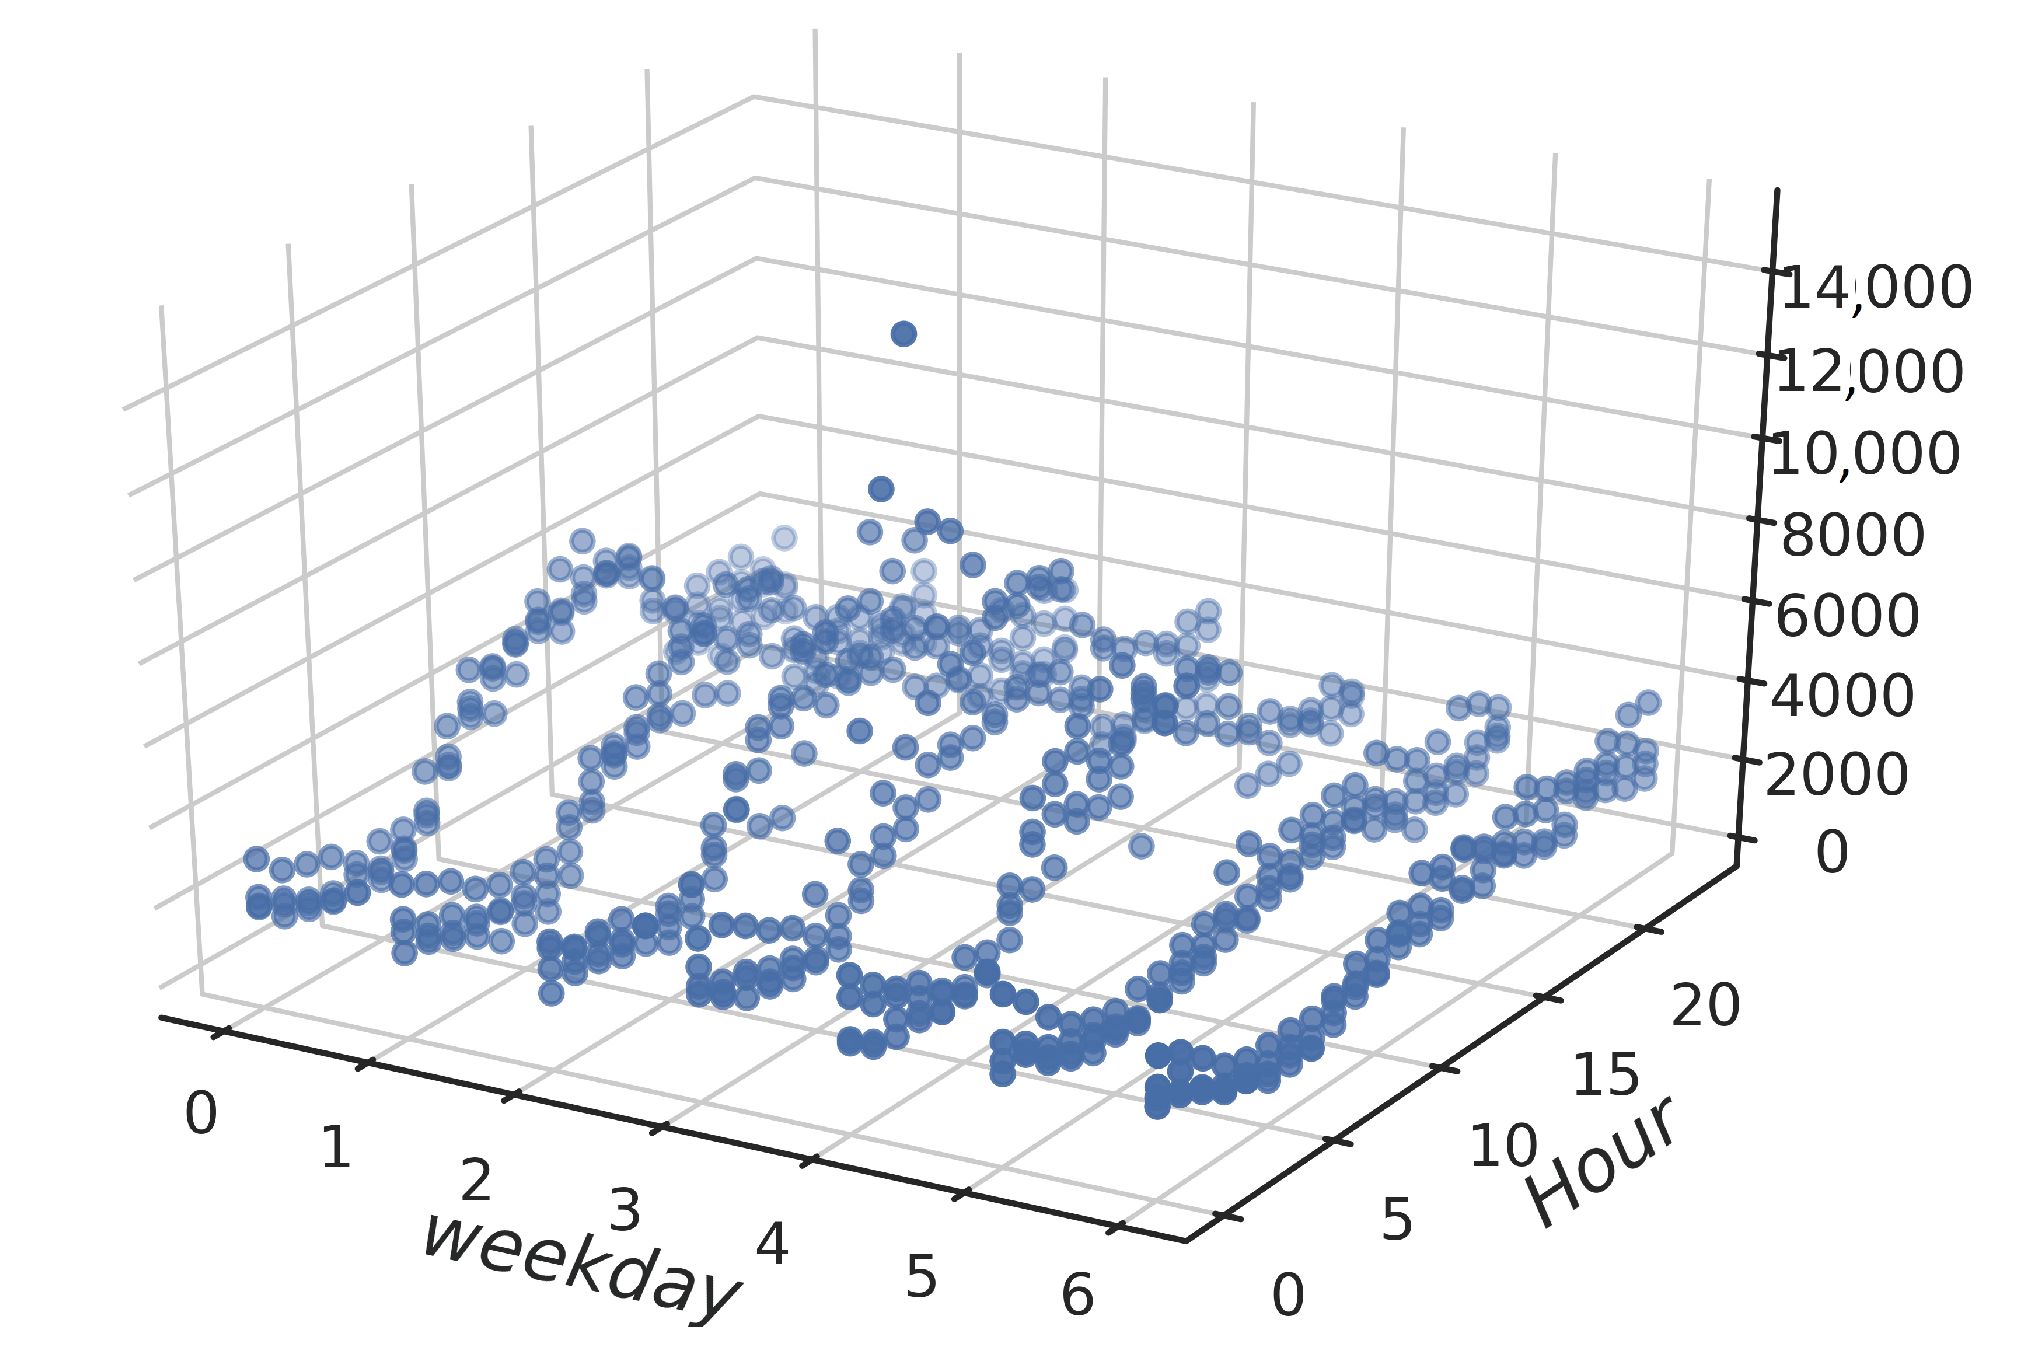
4.1. Feature Extraction and Data Exploration
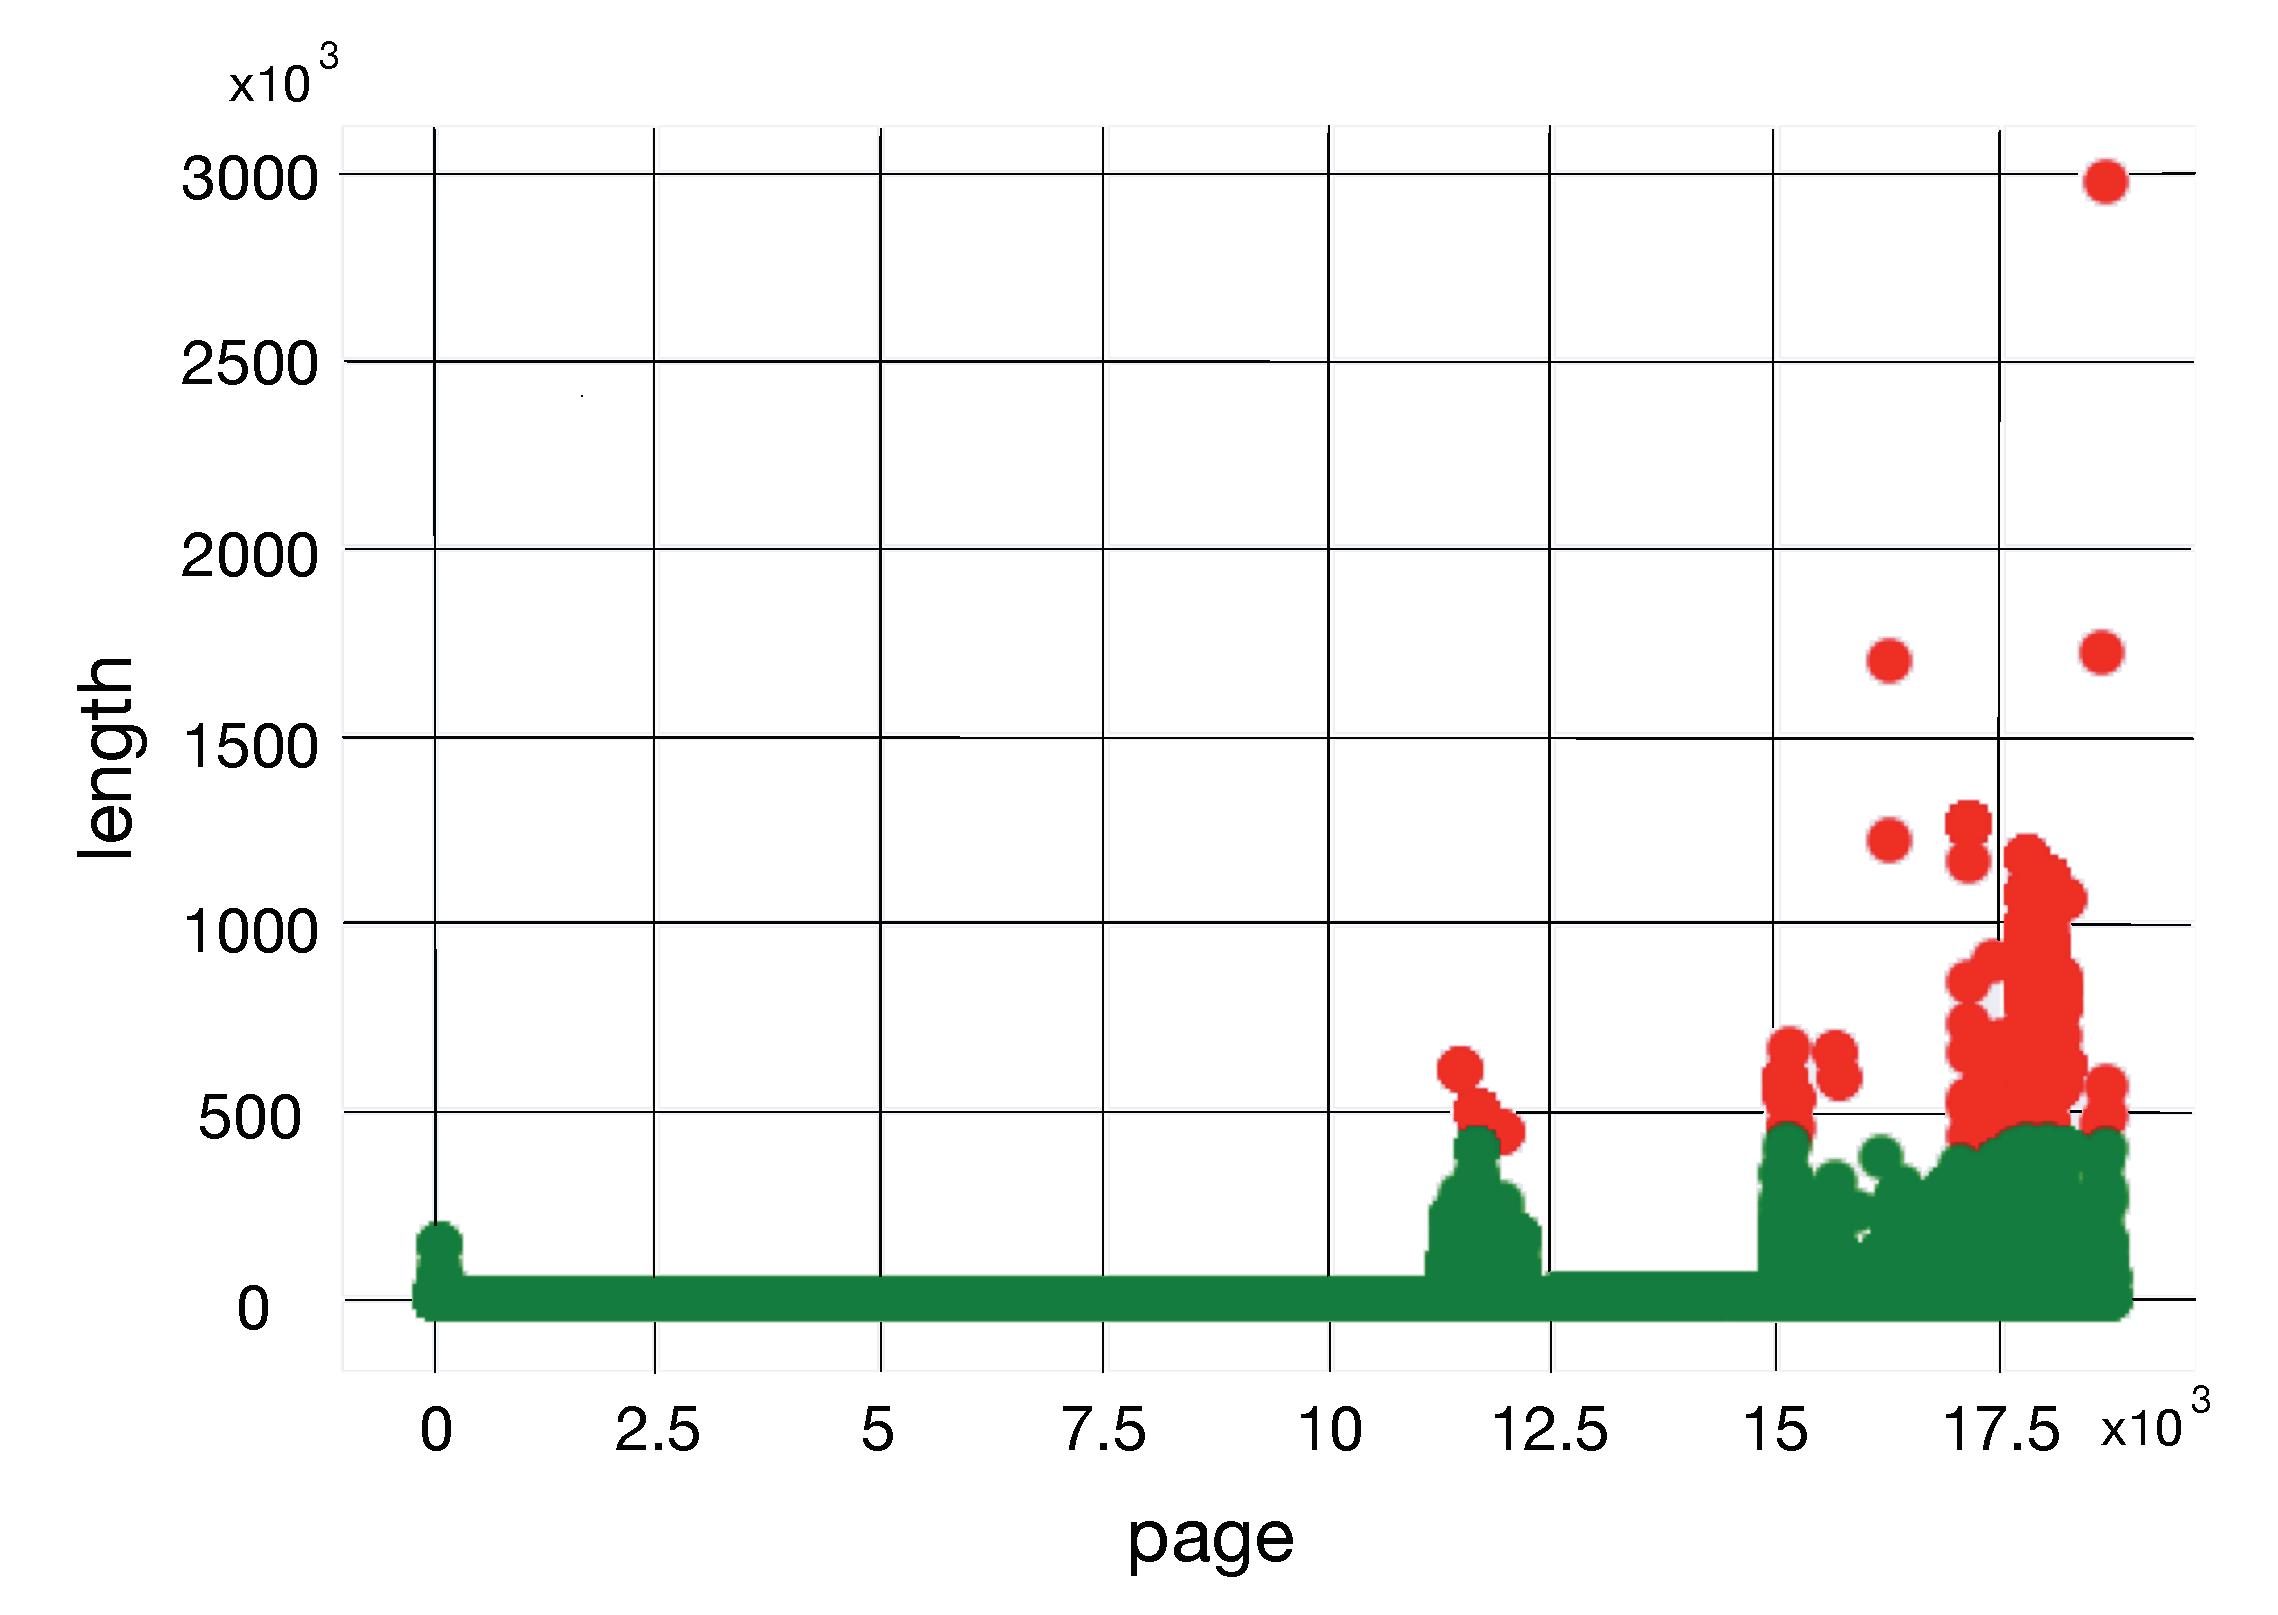
To capture the characteristics of the system behaviors, 14 features were extracted, containing both numeric and categorical attributes from the raw log records. The original features in the raw HTTP log records are “IP”, “Date”, “Request”, “Response” and “length”. By making use of regular expressions, the most relevant time-related components were extracted from the "date" feature, including “Day”, “Month”, “Year”, “Hour”, “Minute” and “Second”. From the “Request” field, the “operation”, “page” and “method” features were extracted. Then, “Month” names were encoded. Therefore “Year”, “Month” and “Day” were composed in the temporary “date” feature in order to retrieve the day of the week (“weekday”) and “weekend” features. Next, “Request” and other temporary features were removed from the dataset. Finally, categorical features such as “IP”, “page”, “operation”, “method” and “Response” were encoded, and the dataset was saved in a file.
By exploring the dataset we can achieve the first insights. Figure 1 depicts the covariance of the most representative features, including “length”, “Hour”, “operation”, “method” and “Response”. This figure shows an interesting covariance between length and other features.
Figure 1. Feature covariance.
Figure 2 provides a three-dimensional analysis of the number of events that occurred along the day (from 0 to 24 h) and along each weekday (0 to 6), where days 5 and 6 correspond to Saturday and Sunday, respectively.
Figure 2. HTTP (Hypertext Transfer Protocol) events over time.

4.2. Clustering

Based on the extracted features, we employed the k-means clustering algorithm for grouping log events into two different clusters. The larger cluster gathers the normal events, while the smaller holds the deviations from normal behavior. Therefore, the latter cluster should correspond to the set grouping the anomaly events. In addition, sparse clusters are possibly caused by anomalous activities, which can be labeled as anomaly candidates for further analysis.
Our framework model takes advantage of the initialization k-means | | algorithm (largely inspired by k-means + + ) to obtain a nearly optimal solution after a logarithmic number of steps. In practice, a constant number of passes suffices [28].
After training this model with 90% of the total number of records and using just the remaining 10% for testing, the model produces a normal cluster containing 185,897 events while the anomaly cluster includes 1301 events, corresponding to 0.06% of the total number of events in the normal cluster.
The computed centroids for the two clusters, separating the normal and anomaly events, are the following:
  • [[4.41534608e+04, 0.00000000e+00, 8.12115012e+05, 1.14495884e+01,
  • 0.00000000e+00, 0.00000000e+00, 1.26692042e+01, 2.96762857e+01,
  • 2.94179871e+01, 0.00000000e+00, 1.75010380e+04, 2.84859910e+03,
  • 2.82322741e+00, 2.23245109e-01]
  • [4.27877328e+04, 1.63161125e-01, 1.53047043e+04, 1.24323538e+01,
  • 0.00000000e+00, 0.00000000e+00, 1.26856431e+01, 2.95910303e+01,
  • 2.94991093e+01, 2.22648078e-03, 1.47567972e+04, 2.84883391e+03,
  • 2.68136168e+00, 1.93607622e-01]]
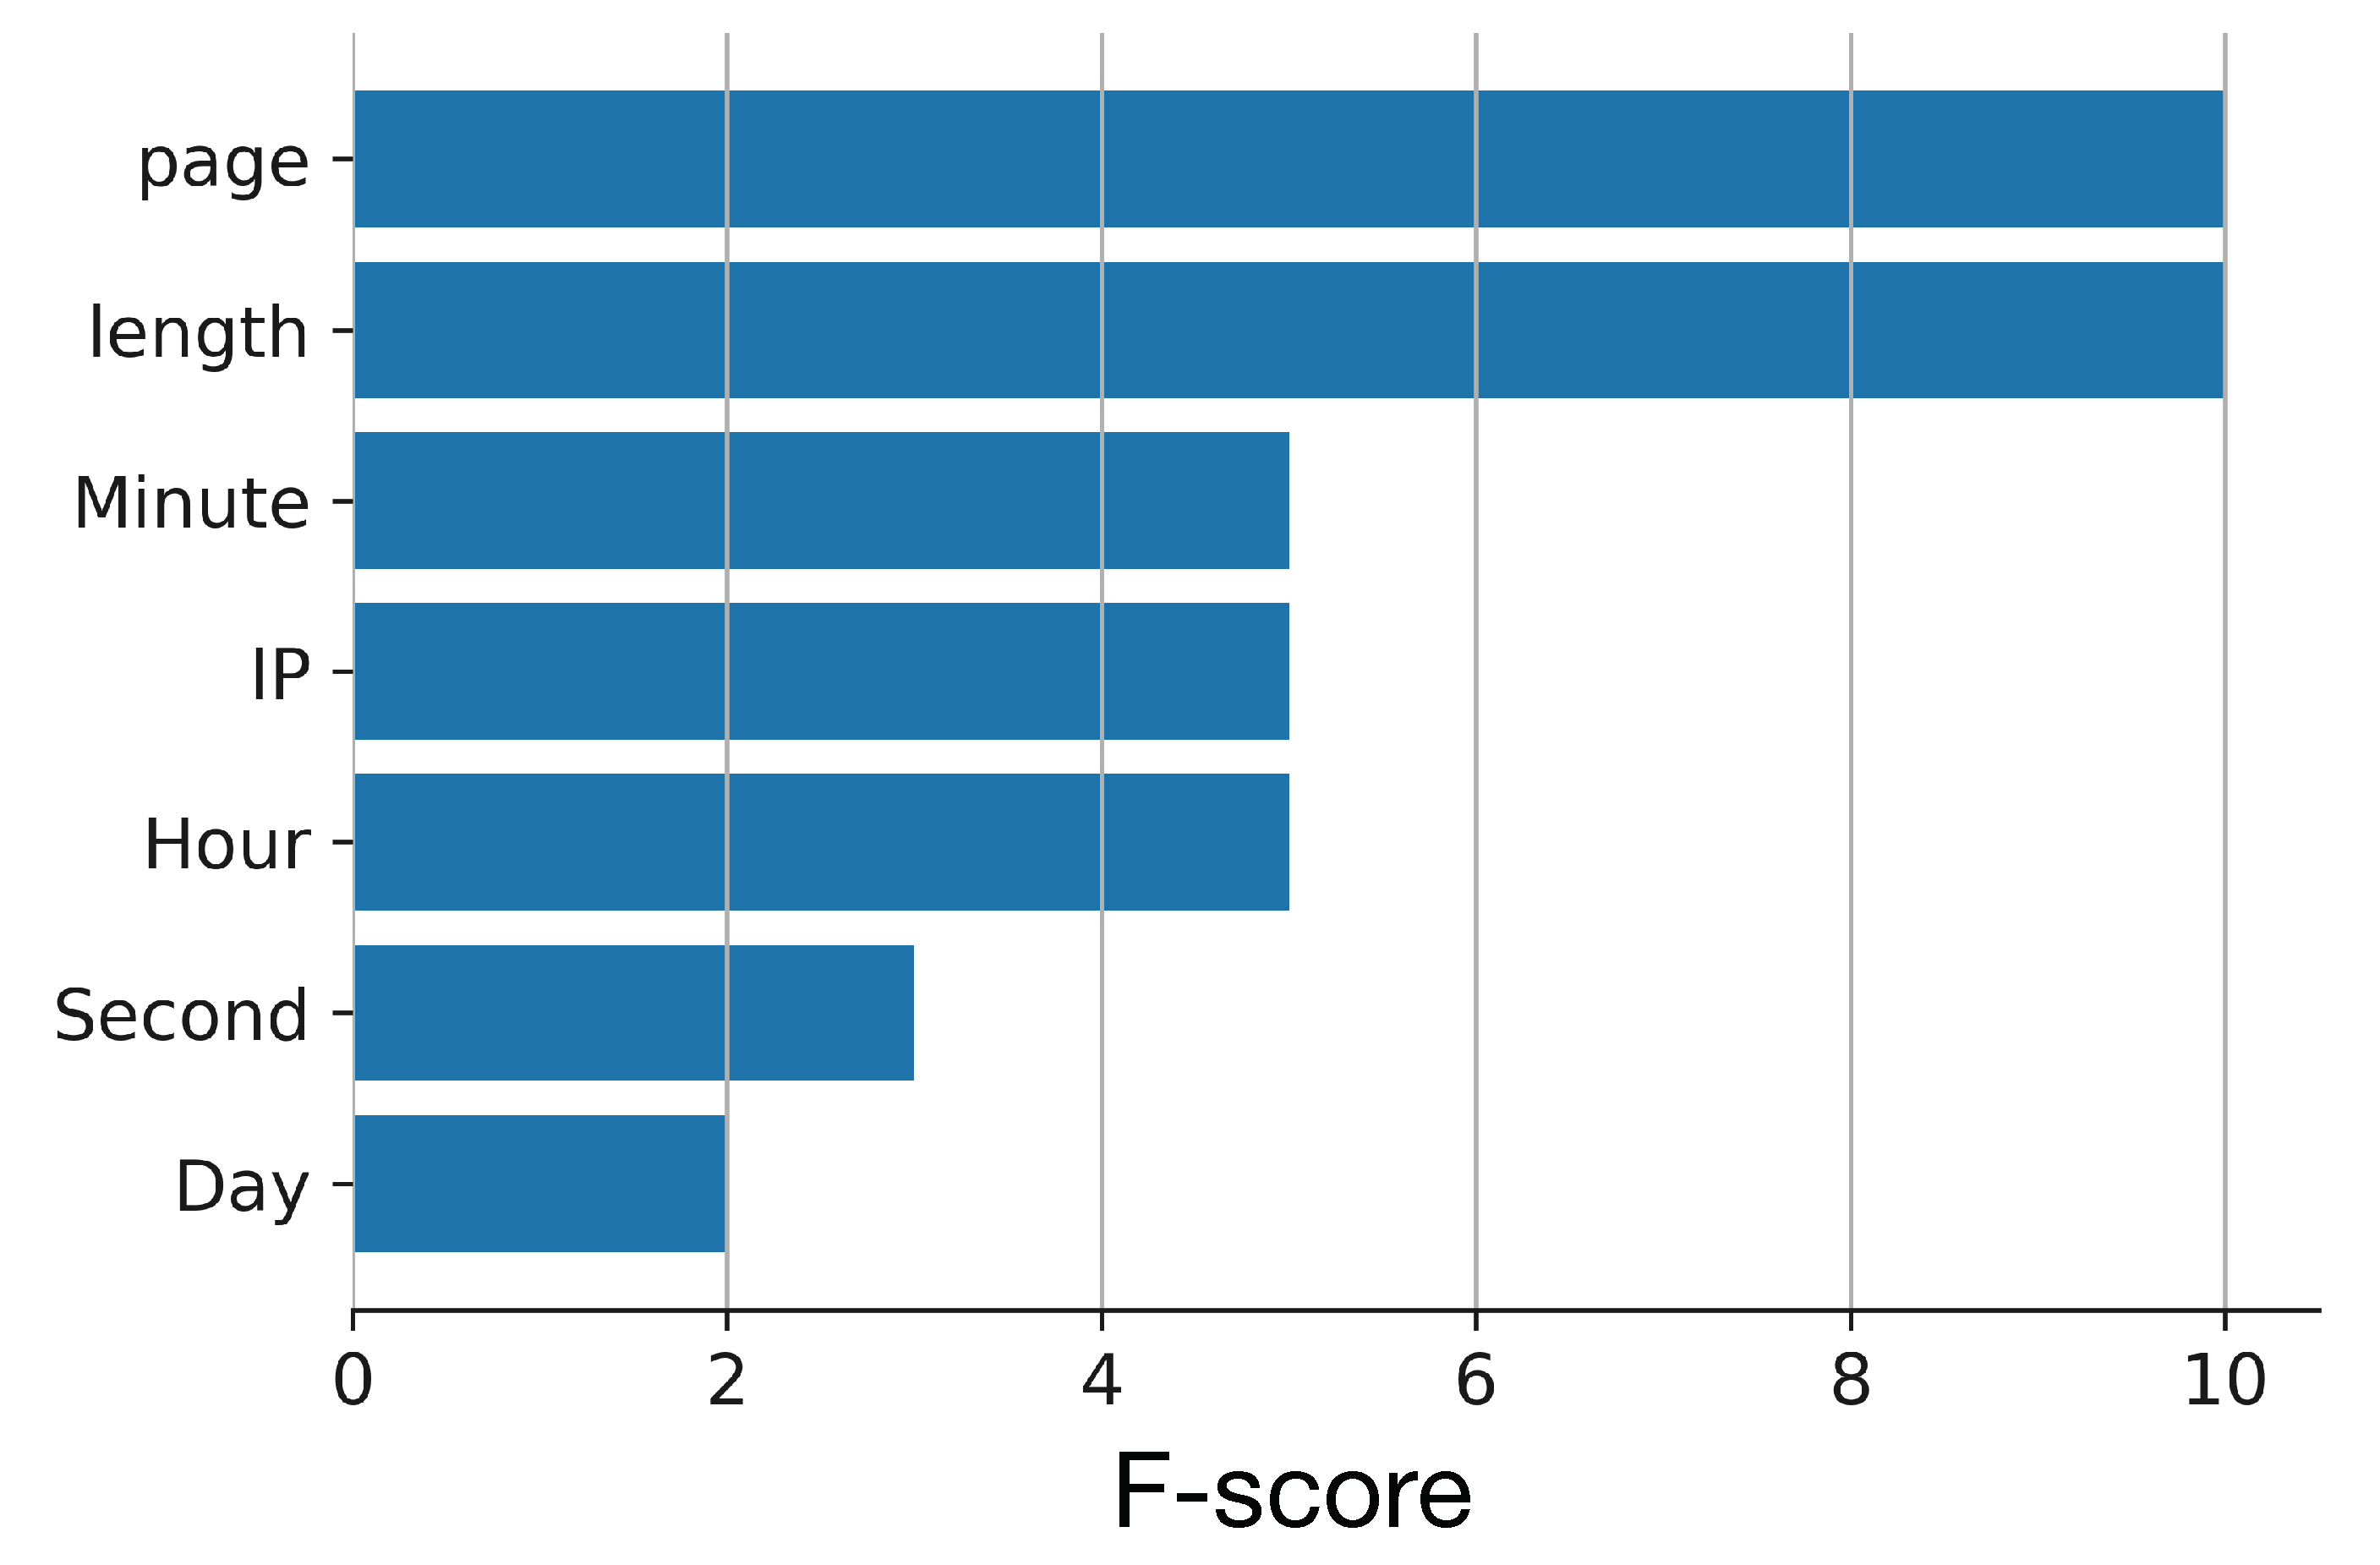
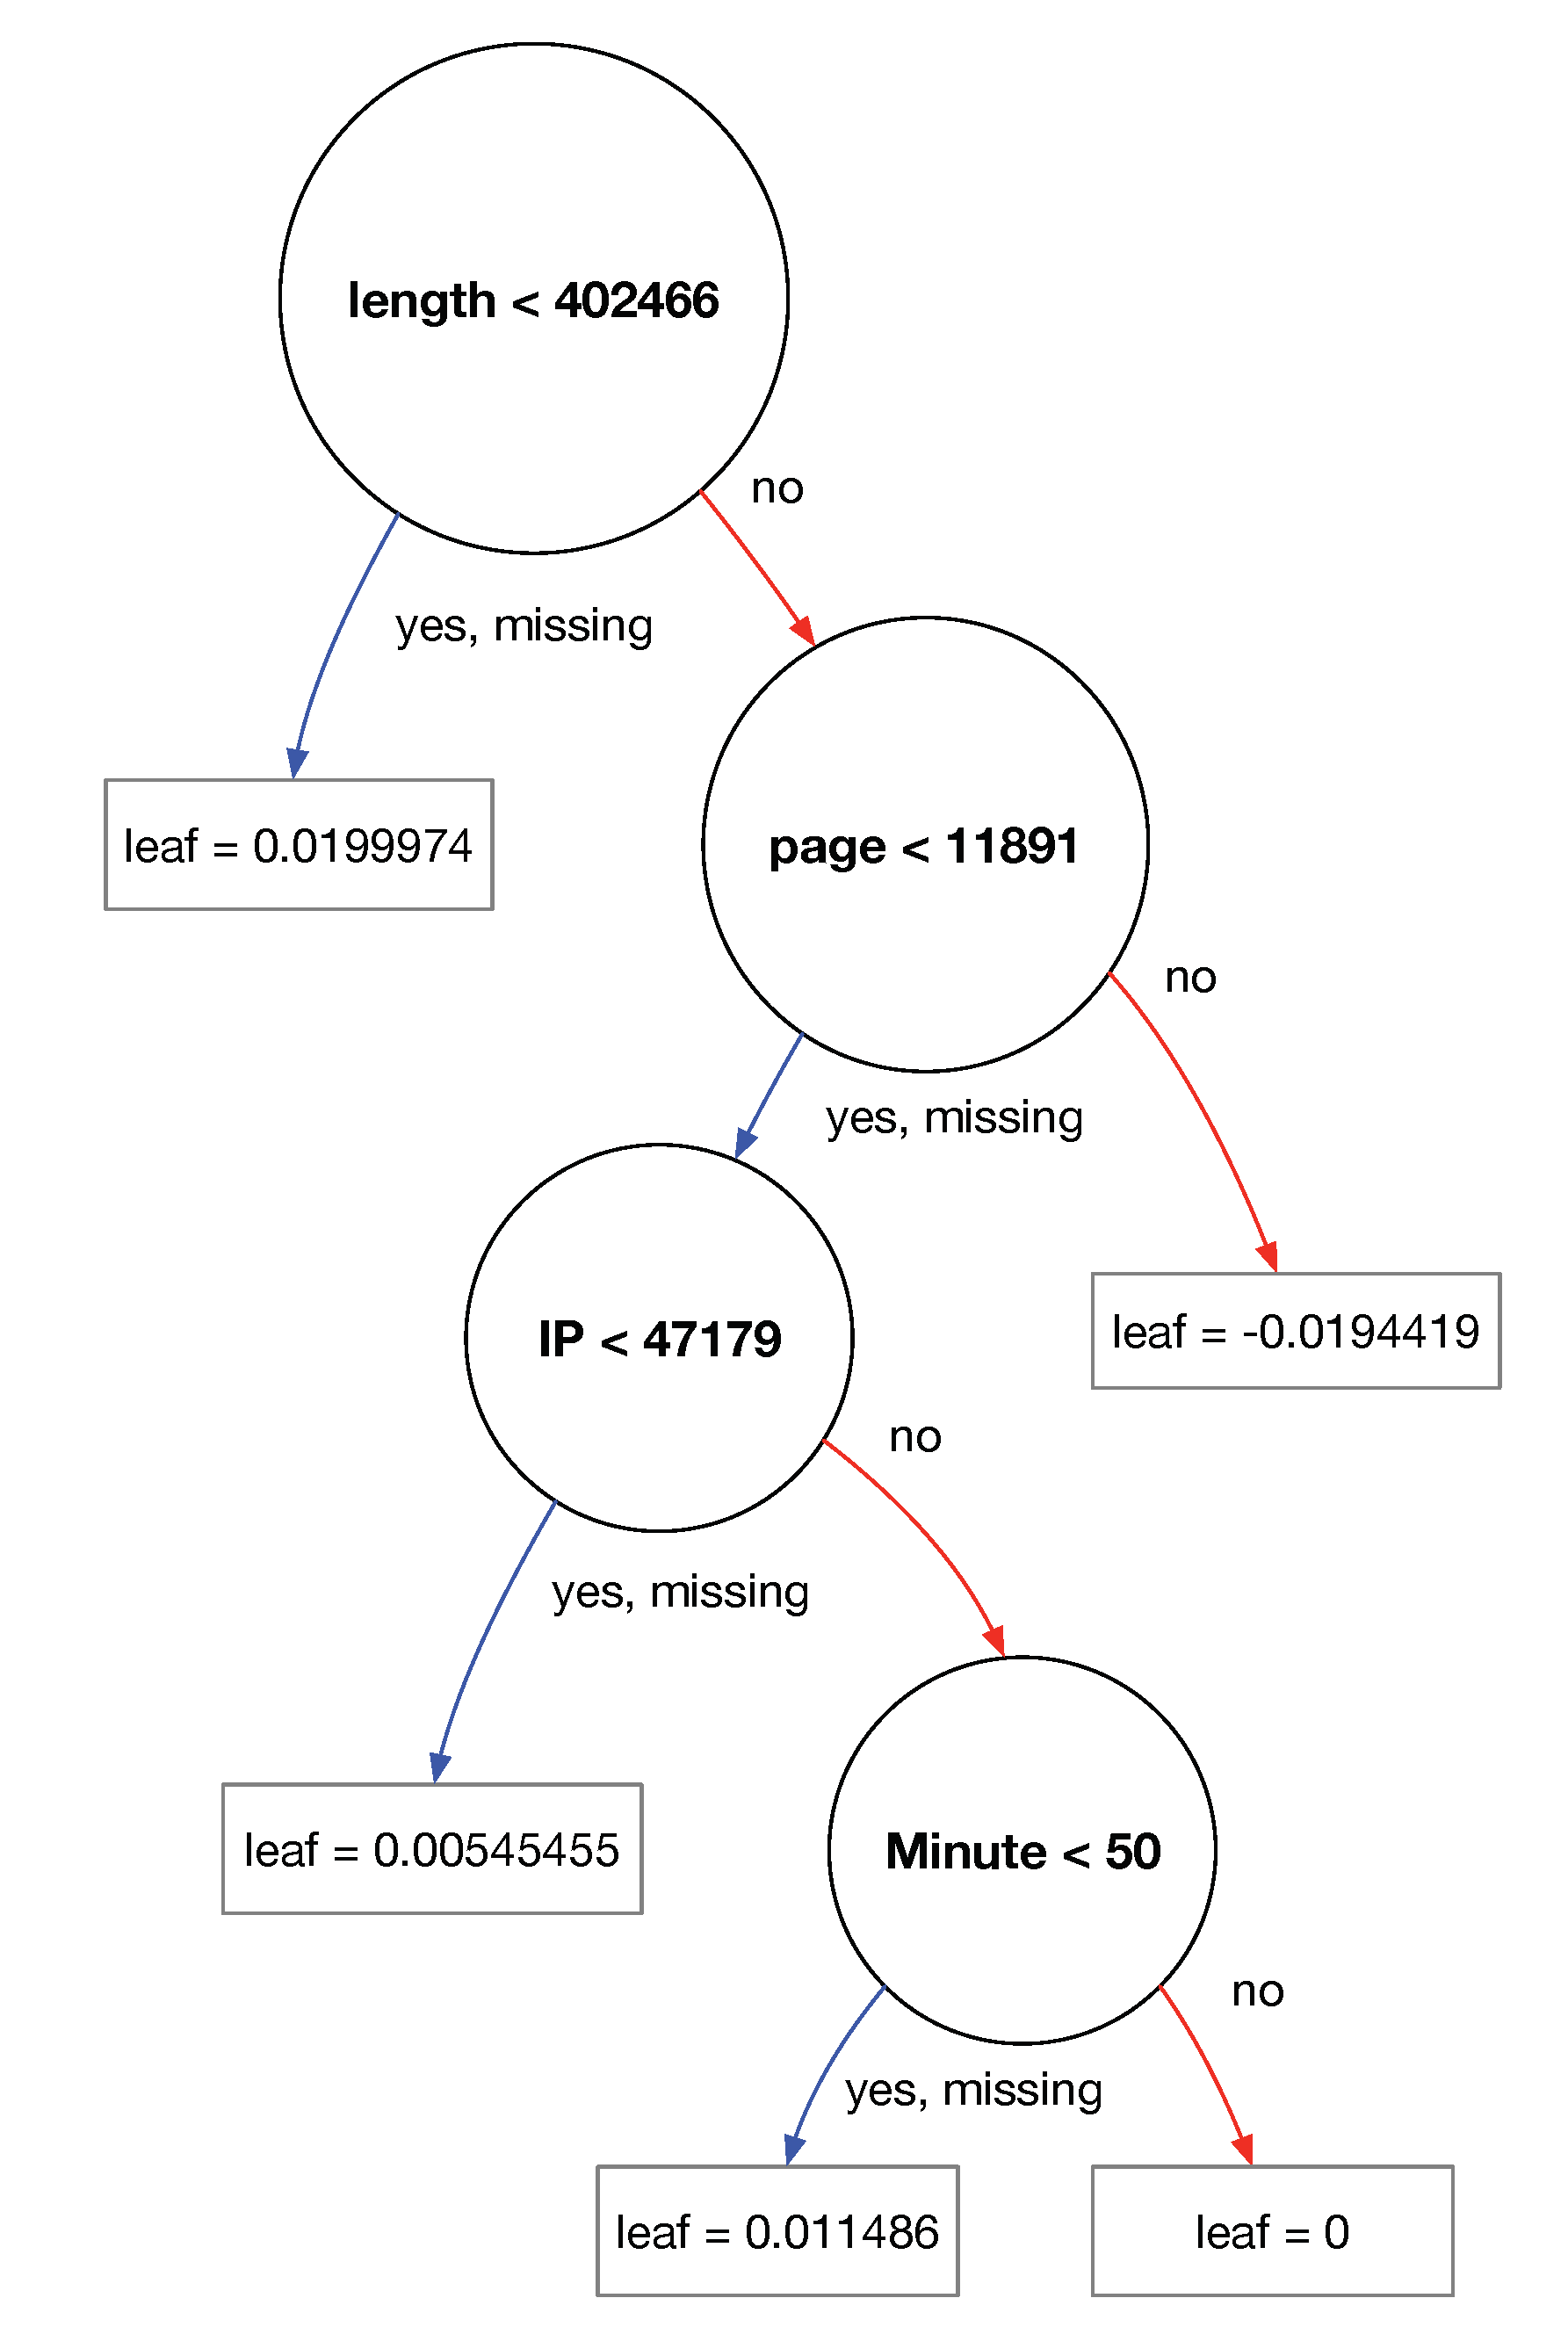
4.3. Classification

Classification results from the application of the gradient tree boosting algorithm implemented by the XGBoost system, which is the second and final stage of our model. The resulting tree can be linearized into decision rules, where the outcome is the content of the leaf node, and the conditions along the path form a conjunction in the if clause.
The results of this stage were validated by comparing if the number of events classified as anomalies is equal to the number of events belonging to the anomaly cluster. This condition was verified for 1301 events. The predict function for XGBoost outputs probabilities by default and not actual class labels. To calculate accuracy we converted them to 0 and 1 labels, where a 0.5 probability corresponds to the threshold. XGBoost is able to correctly classify all the test data according to the k-means clustering algorithm. Figure 3 depicts the importance of the XGBoost features, according to the F-score metric.
Figure 3. Features importance.
This classification model produces a set of rules providing the rationale for generalizing to unseen events, as shown in Figure 4. The leaf values depicted in the figure are converted into probabilities by applying the logistic function.
Figure 4. Decision tree.
Figure 5 depicts the covariance of “length” and “page”, which are the two most important features computed by the final model. The events tagged as anomalous are highlighted in red color.
Figure 5. Page and length covariance.

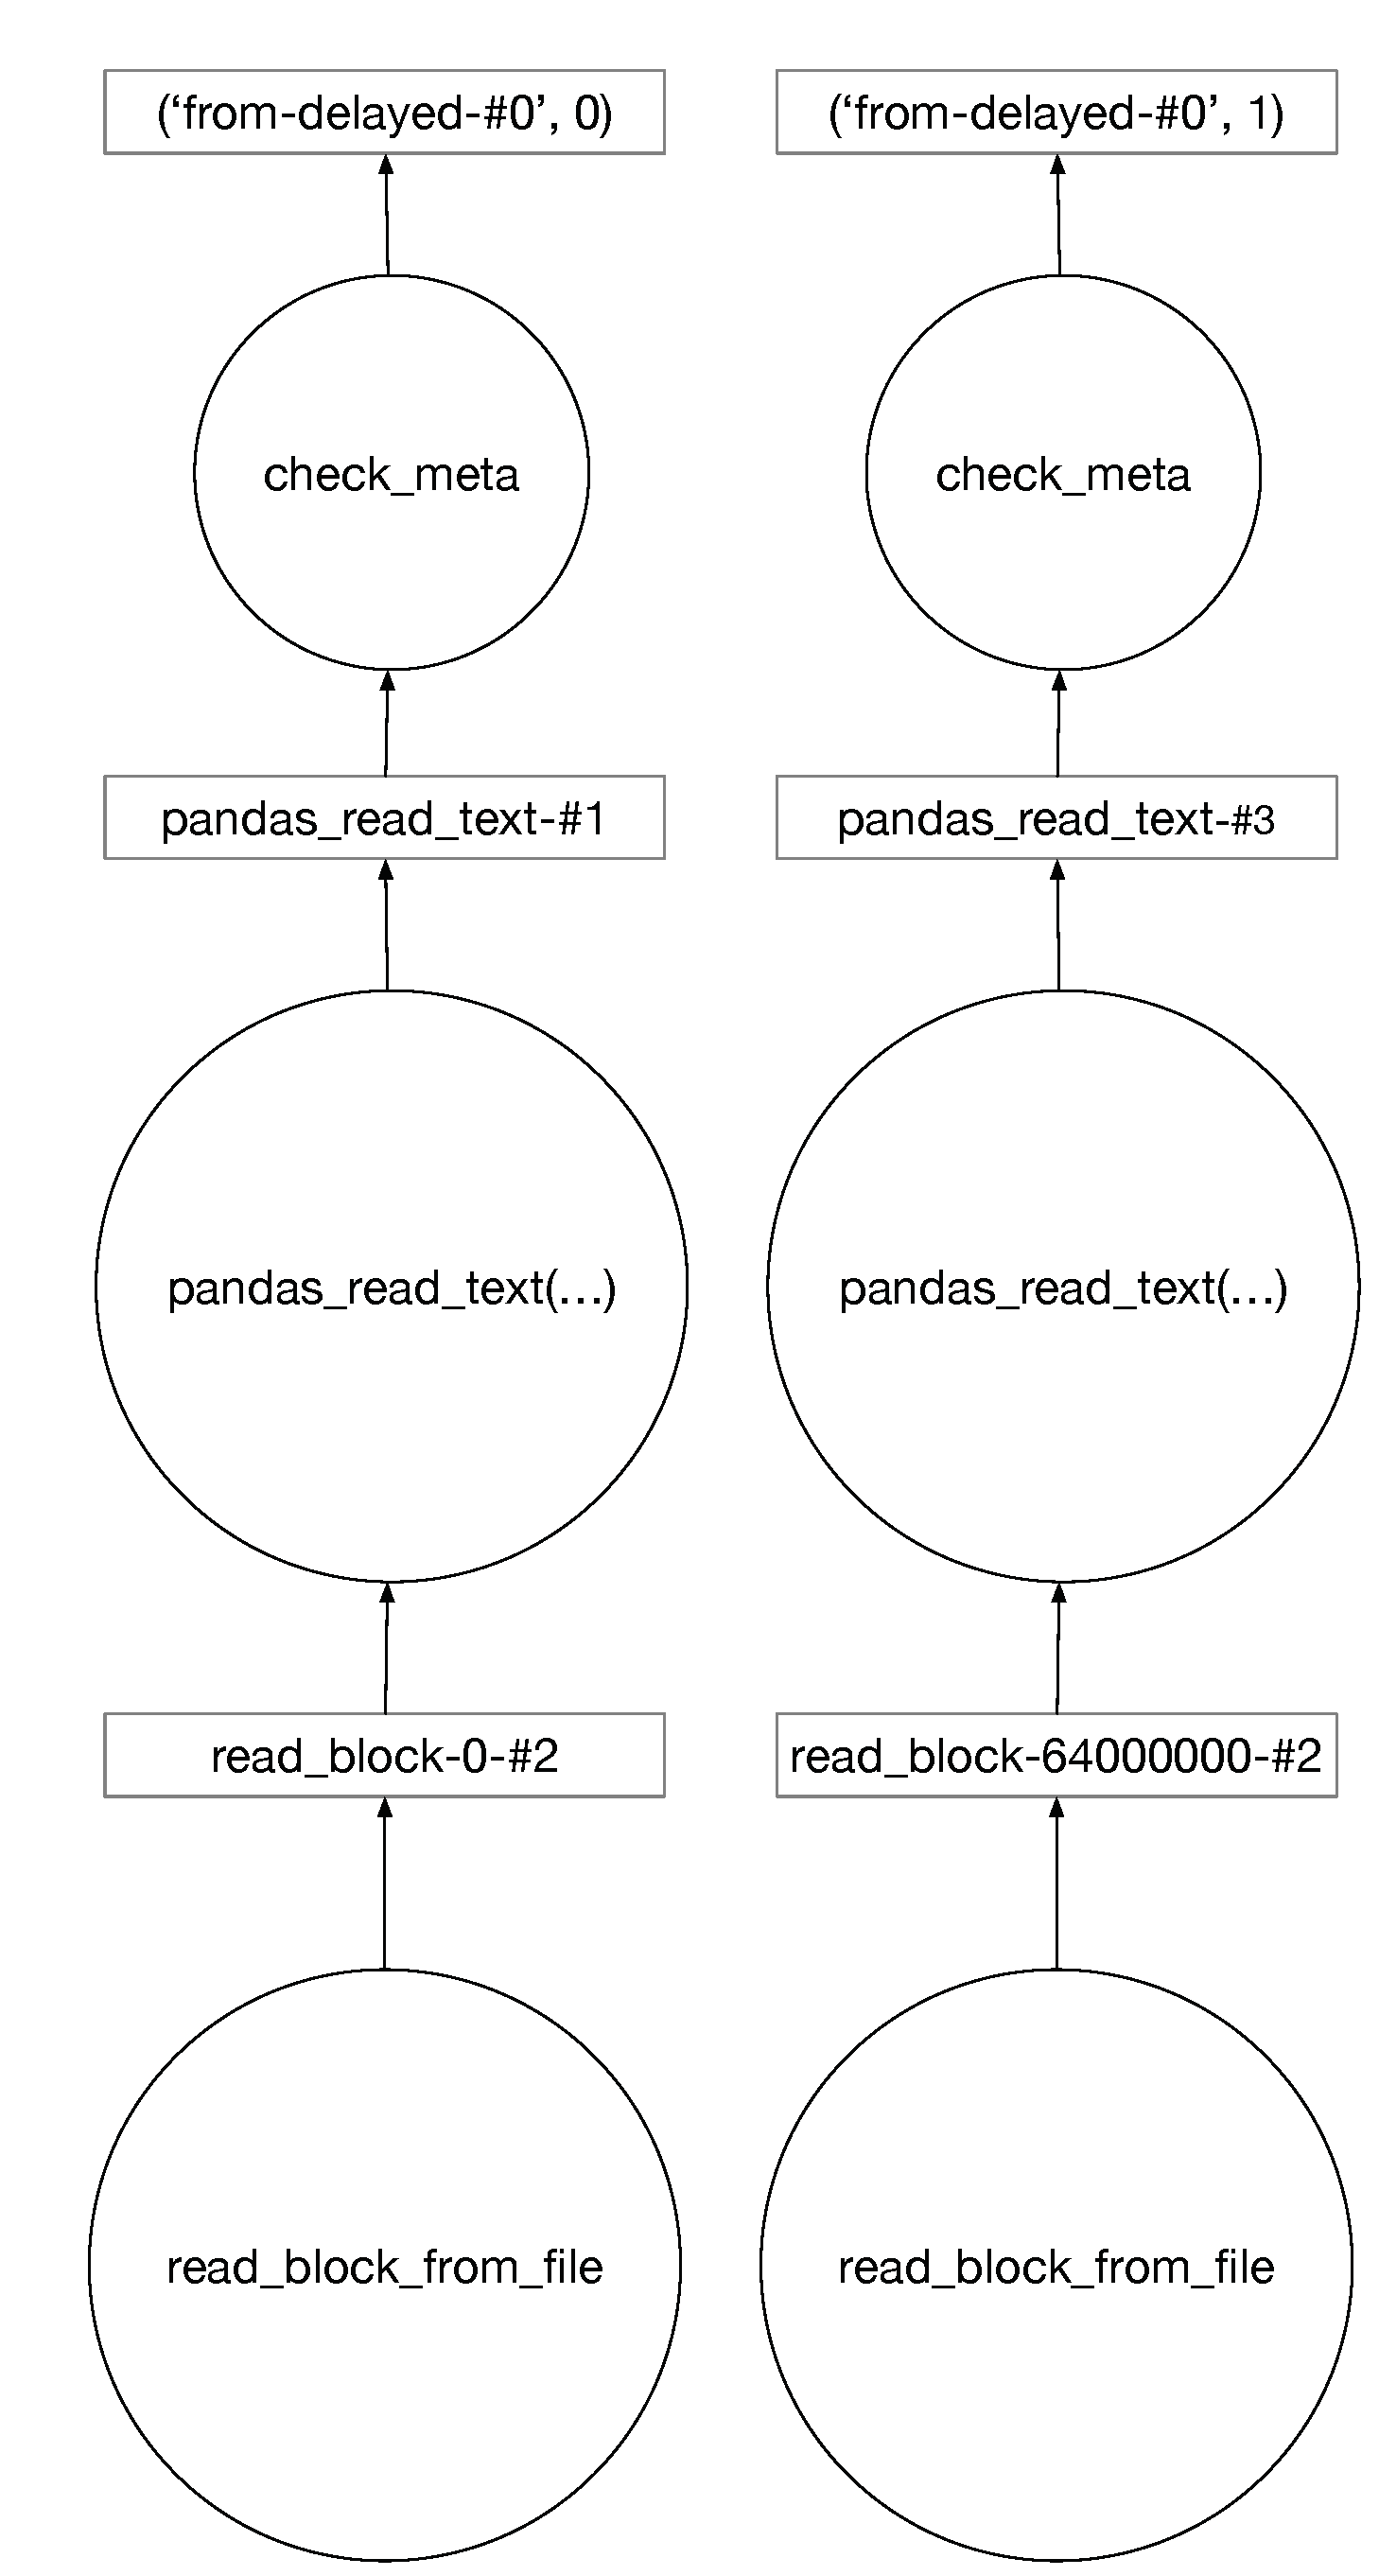
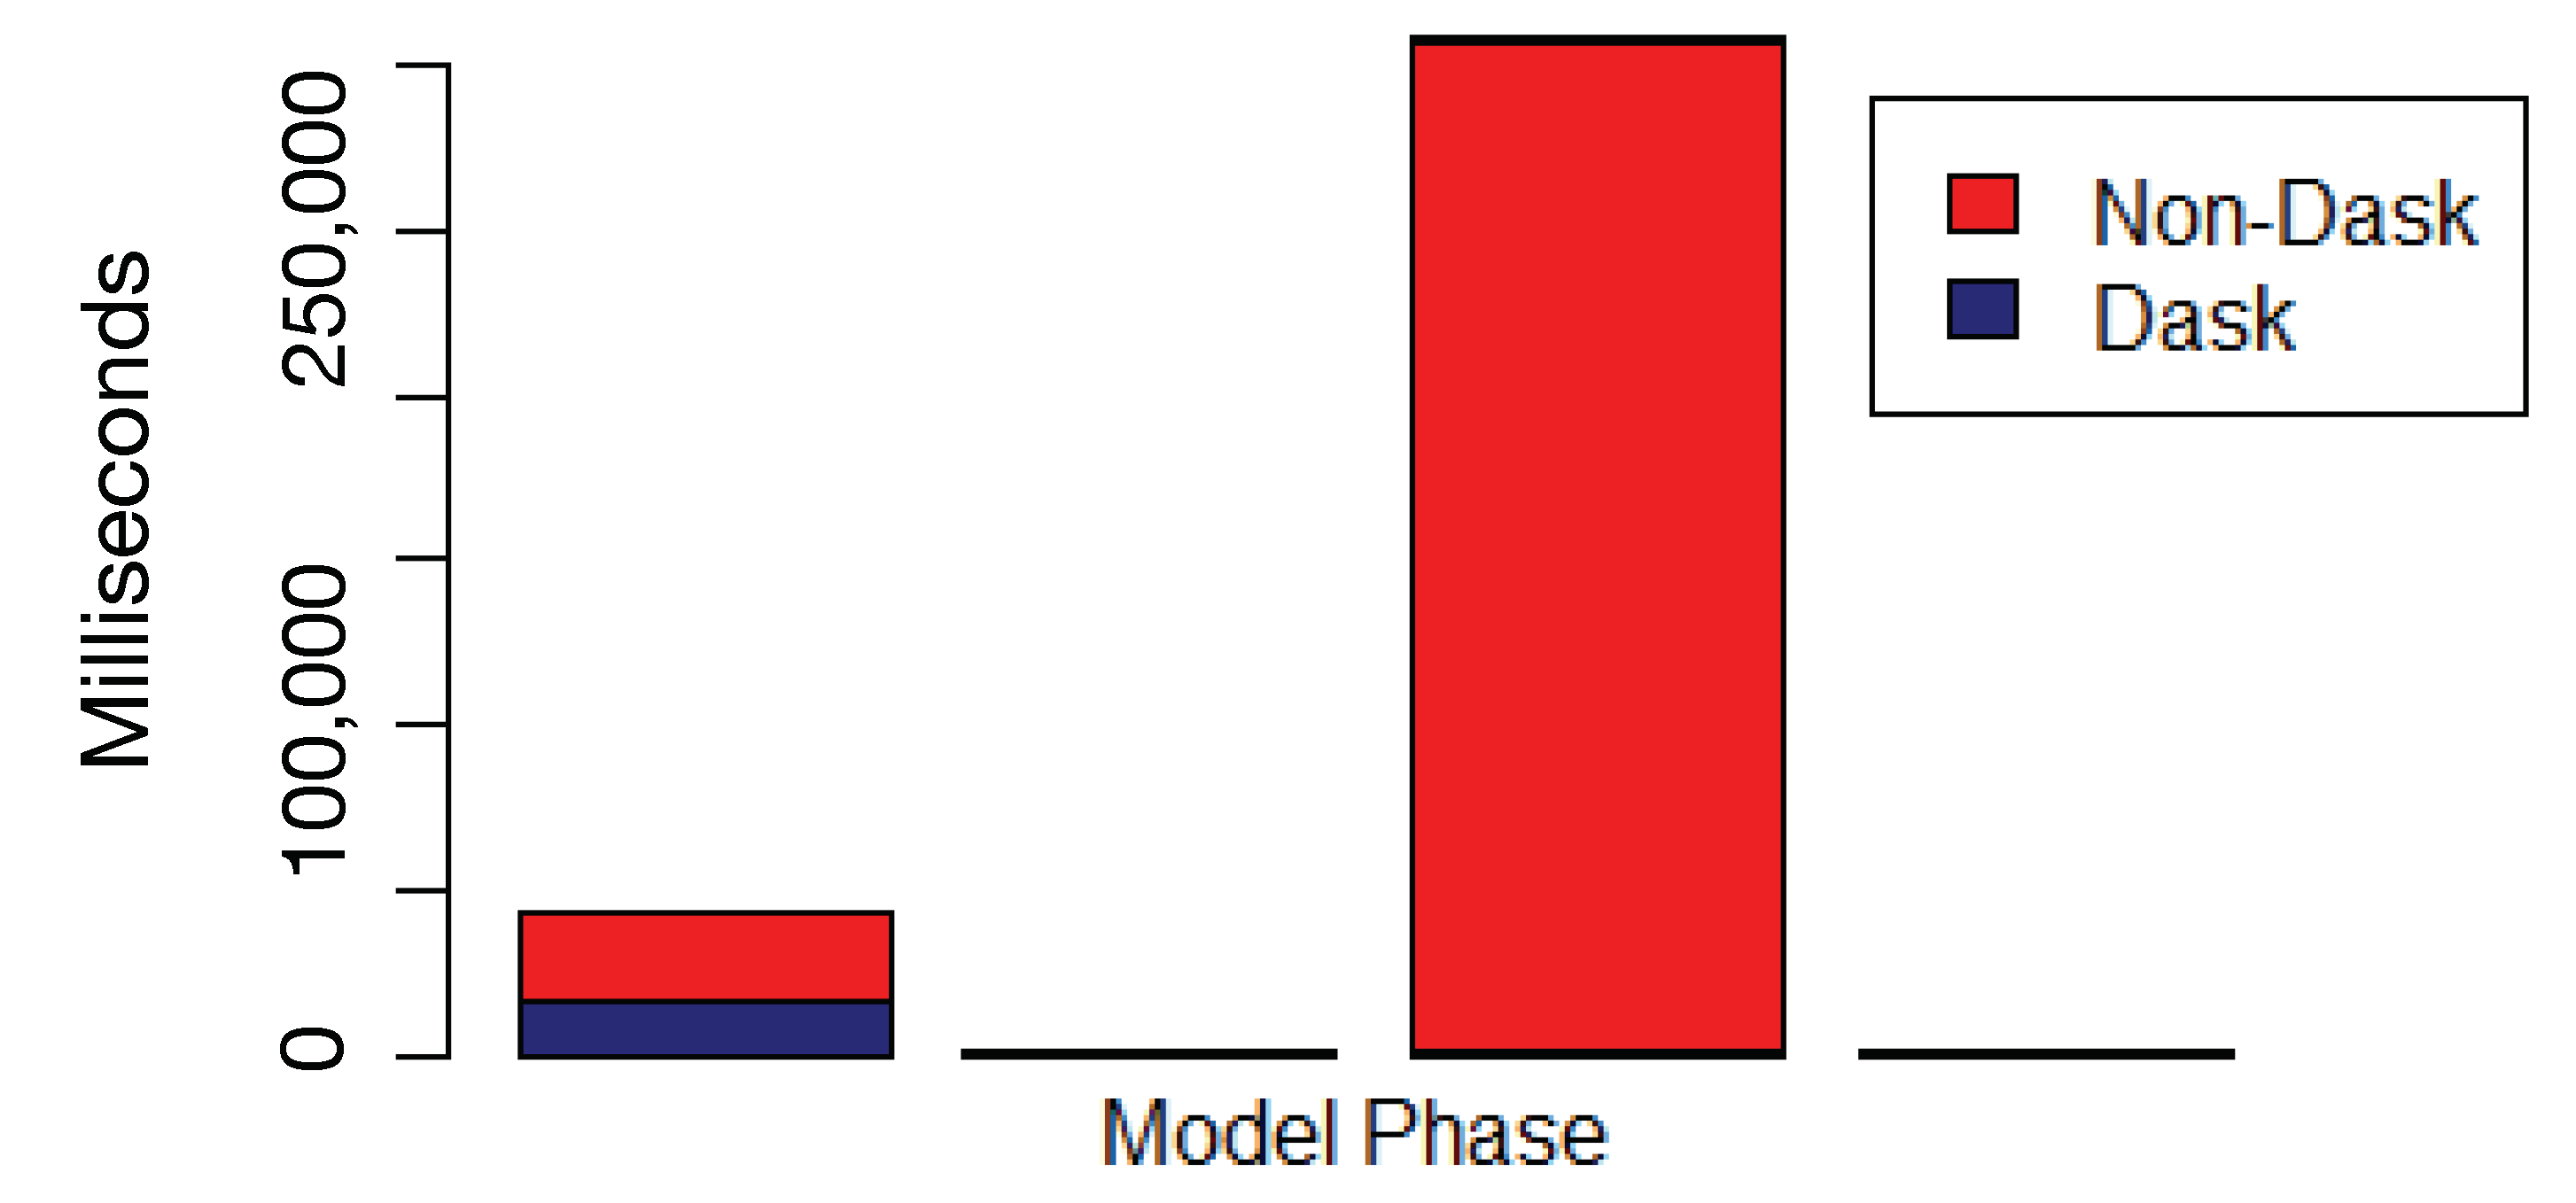
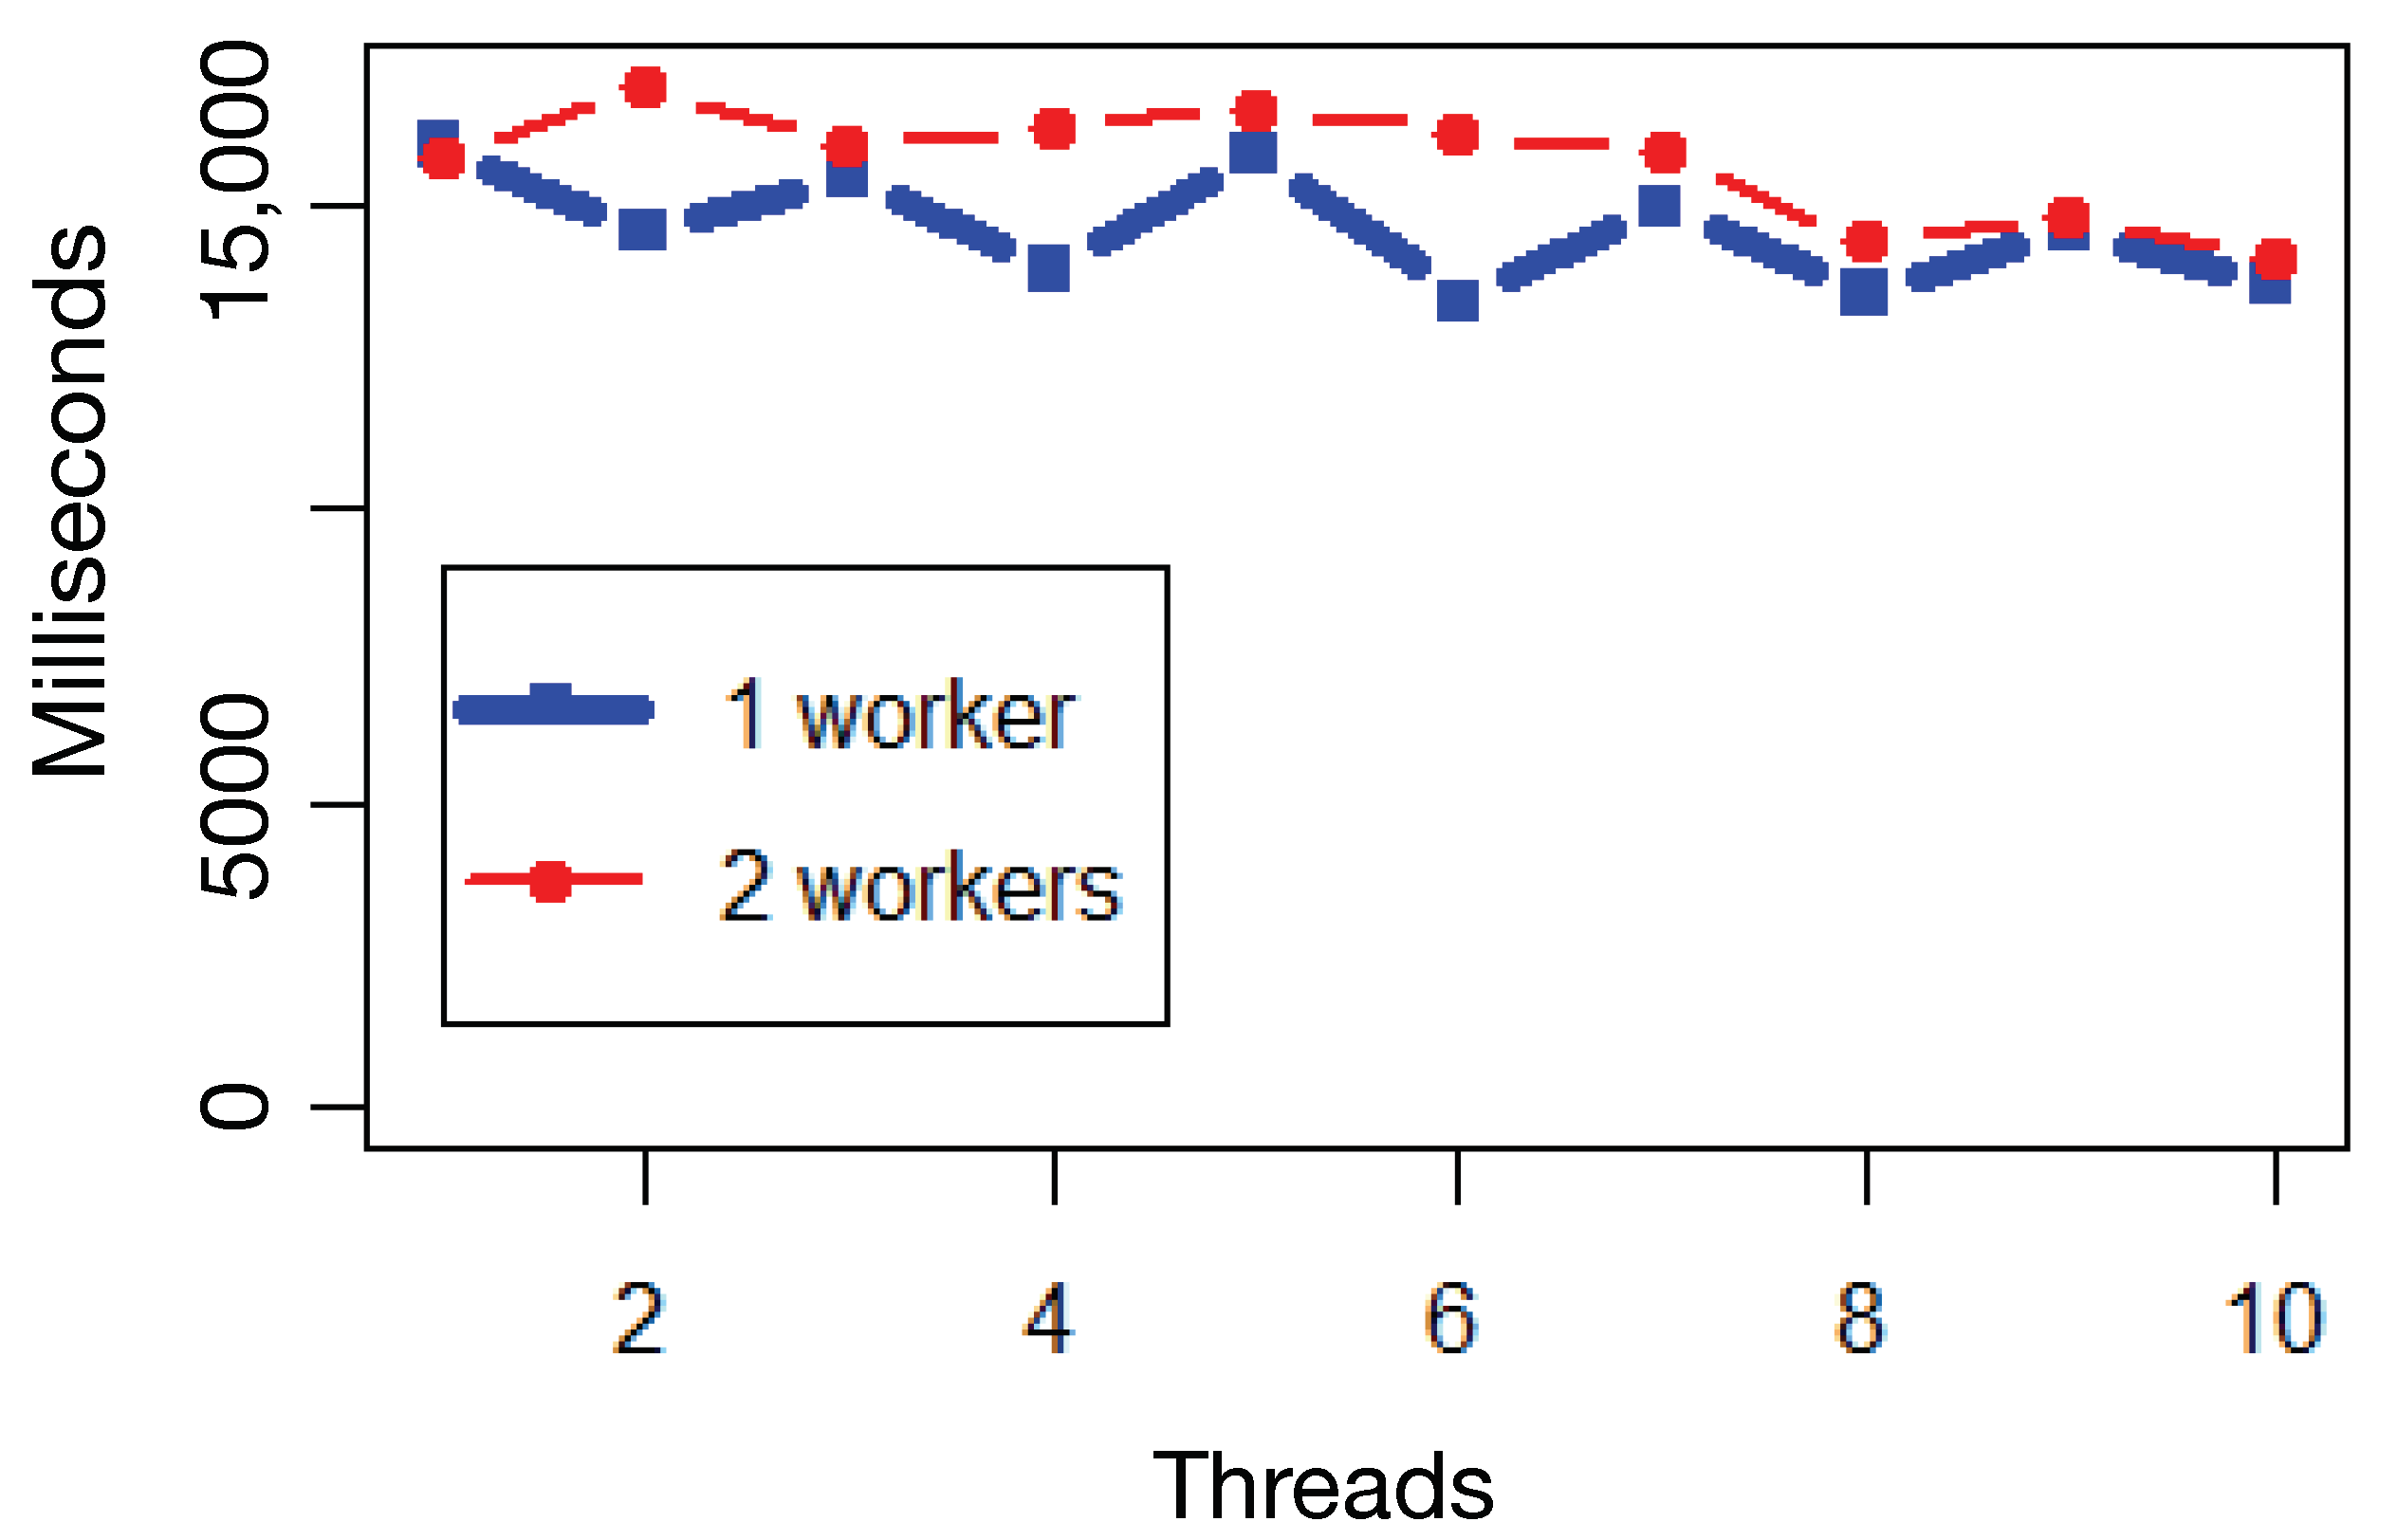
4.4. Parallelization

The proposed framework makes use of the k-means algorithm and the XGBoost system, which are designed to scale in a distributed environment supported by available parallel computing capabilities. Such an approach comes in line with a Big Data scenario.
Our approach is supported by the use of parallel computing capabilities available in the Python “Dask” library. More specifically, the “dataframe” component is able to manage out-of-core datasets along the execution pipeline, since the features are extracted until the clustering and classification models are implemented. Figure 6 provides an example of the kind of graphs Dask is able to produce when reading and splitting a dataset. The Dask libraries “dask_ml” and “dask_xgboost” provide the implementation of popular machine learning algorithms, such as k-means and XGBoost, which support the framework models.
Figure 6. Paralellized Dask graphs.
Our experiment involved a simple cluster formed by just two workers in a single node with two cores while the total available memory was 13.66 GB.
To study the framework model’s ability to scale in order to cope with large datasets in a reasonable time, two experiments were performed using the parsed NASA HTTP logs dataset. Due to constrained laboratory resources, those experiments were limited to the use of two cores in a single node. As a setup configuration, the Dask chunk size was set to 50,000 events. The model’s ability to scale was assessed by comparing its performance under different configurations. To determine the model performance, running time (in milliseconds) was considered throughout the training and predict steps for both k-means and XGBoost stages in accordance with the model topology.
The first experiment aimed at determining the parallel approach performance, compared with the sequential approach—considering non-Dask sklearn as the sequential approach and Dask as the parallel approach. As a setup configuration, the Dask framework included a single worker and two threads. The running time was measured along the four steps previously defined for the two stages. Those sequential steps include the train (1) and predict (2) steps for the k-means stage, followed by the train (3) and predict (4) steps for XGBoost stage. The running time for each framework, along those running steps, is provided in Figure 7. The achieved results show that the Dask framework outperforms the non-Dask sklearn framework, especially in the case of the training steps.
Figure 7. Sequential (non-Dask) vs. parallel (Dask) comparison.
The second experiment evaluated the parallelization capability of the Dask framework under different configurations, such as the number of workers and threads per worker, by measuring the aggregated running time along the topological steps. Figure 8 compares the performance for one and two running workers, while increasing the number of threads per worker from one to ten. Measurements showed that one worker outperforms two workers. Increasing the number of workers did not improve performance, while increasing the number of threads contributes to improved performance until a given threshold is reached. Finally, it was also possible to depict higher performance running over an even number of threads in comparison to the odd ones—due to the less optimal parallelization gains that occur when splitting an odd number of threads into two cores.
Figure 8. Dask parallel comparison.

4.5. Discussion

The presented framework method relies on two stages. The clustering model is the output of the first stage and serves as the input for the classification stage. Therefore, this approach allows starting from initial unlabelled data for obtaining the interpretable meaningful rules with the rationale for classifying unseen events. Those rules are simple to understand, interpret and visualize, requiring relatively little data preparation effort. Additionally, the described algorithms can easily handle heterogeneous data containing different features produced by different sources. Although the initial nature of our problem is not a classification problem, this approach may be adapted to different scenarios where labeled data are not available. This way, it becomes possible to convert an unsupervised into a supervised learning scenario and take advantage of the use of classification algorithms.
The decision to select the k-means algorithm and XGBoost system, both supported by the Dask library for parallel processing, was driven by requirements in terms of scaling and interpretability when working with limited resources. This decision enabled the application of this framework to larger datasets in order to highlight the anomalous events. Given the inherent nature of the problem being addressed through the use of the unsupervised learning approach, it is not trivial to evaluate the framework model’s accuracy in the scope of this paper. An alternative option would be to compare the achieved results with those provided in the existing literature. However, to the best of our knowledge, there are no anomaly detection research works addressing the NASA HTTP logs.
The obtained results highlight the obviously normal events in highly coherent clusters, with a minor subset of events being classified as anomalies for further forensic and compliance auditing analysis. The model interpretability is indirectly validated by the produced decision rule set already provided in Figure 4, which implicitly shows how the model identifies classes. Figure 7 also shows the performance of the parallel approach compared with the sequential approach, and Figure 8 highlights the parallelization capabilities of the Dask library in processing out-of-core datasets.
Designing the framework with independent tools makes it possible to reuse them over different scenarios. For example, the same modeling tool can be combined with a different normalization tool for processing a different data source. Additionally, these framework tools can be applied to the context of the aforementioned ATENA project in order to identify anomaly events from massive logs. This approach can be independently applied to different datasets in a first stage, allowing to correlate them as heterogeneous sources in a second stage.
The achieved results demonstrate the capability of the proposed method in terms of finding a set of interpretable rules that can parallelized and applied in scale.

5. Conclusions and Future Work

In this paper we proposed a framework that takes a parallel computing approach for identifying anomaly events in massive log files. In its first stage, our method uses the k-means algorithm to separate anomalies from normal events. In the second stage, a gradient tree boosting classification model, implemented using the XGBoost system, produces the interpretable meaningful rationale rule set for generalizing its application to a massive number of unseen events. This approach is suitable for application in the context of out-of-core datasets in cases where log sources are so massive that it becomes impossible to use more traditional approaches.
The proposed method was presented, and the achieved results demonstrated its applicability to producing simple and interpretable rules for highlighting anomalies in application log data to scale and in a distributed environment. Such an approach makes it suitable to be applied in the fields of forensics and audit compliance.
Regarding future work, we plan to explore the application of collective anomaly detection over time series summarized data logs and the application of Bayesian networks as the classification model component, and evaluate the method’s capability of producing scalable and interpretable models. We also plan to explore the map-reduce model as a way to achieve higher parallelism performance on data preparation.

Author Contributions

Conceptualization, J.H., F.C., T.C. and P.S.; Funding acquisition, P.S.; Software and Experiments, J.H.; Supervision, F.C., T.C. and P.S.; Writing—original draft, J.H., F.C., T.C. and P.S.; Writing—review editing, F.C., T.C. and P.S. All authors have read and agreed to the published version of the manuscript.

Funding

This work was partially funded by the National Funds through the FCT—Foundation for Science and Technology, I.P., and the European Social Fund, through the Regional Operational Program Centro 2020, within the scope of the projects UIDB/05583/2020 and CISUC UID/CEC/00326/2020. Furthermore, we would like to thank the Research Center in Digital Services (CISeD) and the Polytechnic of Viseu for their support.

Conflicts of Interest

The authors declare no conflicts of interest.

References

  1. Adamsky, F.; Aubigny, M.; Battisti, F.; Carli, M.; Cimorelli, F.; Cruz, T.; Giorgio, A.D.; Foglietta, C.; Galli, A.; Giuseppi, A.; et al. Integrated protection of industrial control systems from cyber-attacks: The ATENA approach. Int. J. Crit. Infrastruct. Prot. 2018, 21, 72–82. [Google Scholar] [CrossRef]
  2. Rosa, L.; Proença, J.; Henriques, J.; Graveto, V.; Cruz, T.; Simões, P.; Caldeira, F.; Monteiro, E. An Evolved Security Architecture for Distributed Industrial Automation and Control Systems. In Proceedings of the 16th European Conference on Cyber Warfare and Security (ECCWS 2017), Dublin, Ireland, 29–30 June 2017; pp. 380–390. [Google Scholar]
  3. Wu, X.; Kumar, V.; Quinlan, J.R.; Ghosh, J.; Yang, Q.; Motoda, H.; McLachlan, G.J.; Ng, A.; Liu, B.; Philip, S.Y.; et al. Top 10 algorithms in data mining. Knowl. Inf. Syst. 2008, 14, 1–37. [Google Scholar] [CrossRef]
  4. Friedman, J.H. Greedy function approximation: A gradient boosting machine. Ann. Stat. 2001, 29, 1189–1232. [Google Scholar] [CrossRef]
  5. Chen, T.; Guestrin, C. Xgboost: A scalable tree boosting system. In Proceedings of the 22nd ACM Sigkdd International Conference on Knowledge Discovery and Data Mining, San Francisco, CA, USA, 13–17 August 2016; pp. 785–794. [Google Scholar]
  6. Rocklin, M. Dask: Parallel computation with blocked algorithms and task scheduling. In Proceedings of the 14th Python in Science Conference, Austin, TX, USA, 6–12 July 2015; pp. 130–136. [Google Scholar]
  7. Grubbs, F.E. Procedures for detecting outlying observations in samples. Technometrics 1969, 11, 1–21. [Google Scholar] [CrossRef]
  8. Gogoi, P.; Bhattacharyya, D.; Borah, B.; Kalita, J.K. A survey of outlier detection methods in network anomaly identification. Comput. J. 2011, 54, 570–588. [Google Scholar] [CrossRef]
  9. Zheng, Y.; Zhang, H.; Yu, Y. Detecting collective anomalies from multiple spatio-temporal datasets across different domains. In Proceedings of the 23rd SIGSPATIAL international conference on advances in geographic information systems, Seattle, WA, USA, 3–6 November 2015; pp. 1–10. [Google Scholar]
  10. Yang, Q.; Wu, X. 10 challenging problems in data mining research. Int. J. Inf. Technol. Decis. Making 2006, 5, 597–604. [Google Scholar] [CrossRef]
  11. Chen, Z.; Li, Y.F. Anomaly detection based on enhanced DBScan algorithm. Procedia Eng. 2011, 15, 178–182. [Google Scholar] [CrossRef]
  12. Syarif, I.; Prugel-Bennett, A.; Wills, G. Unsupervised clustering approach for network anomaly detection. In Proceedings of the International Conference on Networked Digital Technologies, Dubai, UAE, 24–26 April 2012; pp. 135–145. [Google Scholar]
  13. Hoglund, A.J.; Hatonen, K.; Sorvari, A.S. A computer host-based user anomaly detection system using the self-organizing map. In Proceedings of the IEEE-INNS-ENNS International Joint Conference on Neural Networks (IJCNN 2000), Como, Italy, 27 July 2000; pp. 411–416. [Google Scholar]
  14. Lichodzijewski, P.; Zincir-Heywood, A.N.; Heywood, M.I. Host-based intrusion detection using self-organizing maps. In Proceedings of the 2002 International Joint Conference on Neural Networks (IJCNN’02), Honolulu, HI, USA, 12–17 May 2002; pp. 1714–1719. [Google Scholar]
  15. Münz, G.; Li, S.; Carle, G. Traffic Anomaly Detection Using K-Means Clustering. GI/ITG Workshop MMBnet, 2007; pp. 13–14. Available online: https://pdfs.semanticscholar.org/634e/2f1a20755e7ab18e8e8094f48e140a32dacd.pdf (accessed on 15 June 2017).
  16. Tian, L.; Jianwen, W. Research on network intrusion detection system based on improved k-means clustering algorithm. In Proceedings of the 2009 International Forum on Computer Science-Technology and Applications, Chongqing, China, 25–27 December 2009; pp. 76–79. [Google Scholar]
  17. Eslamnezhad, M.; Varjani, A.Y. Intrusion detection based on MinMax K-means clustering. In Proceedings of the 7’th International Symposium on Telecommunications (IST’2014), Tehran, Iran, 9–11 September 2014; pp. 804–808. [Google Scholar]
  18. Ranjan, R.; Sahoo, G. A new clustering approach for anomaly intrusion detection. Int. J. Data Min. Knowl. Manage. Process 2014, 4, 29–38. [Google Scholar] [CrossRef]
  19. Makanju, A.; Zincir-Heywood, A.N.; Milios, E.E. Investigating event log analysis with minimum apriori information. In Proceedings of the 2013 IFIP/IEEE International Symposium on Integrated Network Management (IM 2013), Ghent, Belgium, 27–31 May 2013; pp. 962–968. [Google Scholar]
  20. Asif-Iqbal, H.; Udzir, N.I.; Mahmod, R.; Ghani, A.A.A. Filtering events using clustering in heterogeneous security logs. Inf. Technol. J. 2011, 10, 798–806. [Google Scholar] [CrossRef]
  21. Hajamydeen, A.I.; Udzir, N.I.; Mahmod, R.; GHANI, A.A.A. An unsupervised heterogeneous log-based framework for anomaly detection. Turkish J. Electr. Eng. Comput. Sci. 2016, 24, 1117–1134. [Google Scholar] [CrossRef]
  22. Varuna, S.; Natesan, P. An integration of k-means clustering and naïve bayes classifier for Intrusion Detection. In Proceedings of the 2015 3rd International Conference on Signal Processing, Communication and Networking, ICSCN 2015, Tamil Nadu, India, 26–28 March 2015; pp. 1–5. [Google Scholar]
  23. Muda, Z.; Yassin, W.; Sulaiman, M.; Udzir, N. K-means clustering and naive bayes classification for intrusion detection. J. IT Asia 2016, 4, 13–25. [Google Scholar] [CrossRef]
  24. Elbasiony, R.M.; Sallam, E.A.; Eltobely, T.E.; Fahmy, M.M. A hybrid network intrusion detection framework based on random forests and weighted k-means. Ain Shams Eng. J. 2013, 4, 753–762. [Google Scholar] [CrossRef]
  25. Sequeira, K.; Zaki, M. ADMIT: Anomaly-based data mining for intrusions. In Proceedings of the Eighth ACM SIGKDD International Conference on Knowledge Discovery and Data Mining, Edmonton, AB, Canada, 23–26 July 2002; pp. 386–395. [Google Scholar]
  26. Liao, Y.; Vemuri, V.R. Use of k-nearest neighbor classifier for intrusion detection. Comput. Secur. 2002, 21, 439–448. [Google Scholar] [CrossRef]
  27. Breunig, M.M.; Kriegel, H.P.; Ng, R.T.; Sander, J. LOF: Identifying density-based local outliers. In Proceedings of the 2000 ACM SIGMOD International Conference on Management of Data, Dallas, TX, USA, 16–18 May 2000; pp. 93–104. [Google Scholar]
  28. Bahmani, B.; Moseley, B.; Vattani, A.; Kumar, R.; Vassilvitskii, S. Scalable k-means++. Proc. VLDB Endowment 2012, 5, 622–633. [Google Scholar] [CrossRef]
  29. Vattani, A. K-means requires exponentially many iterations even in the plane. Discrete Comput. Geom. 2011, 45, 596–616. [Google Scholar] [CrossRef]
  30. Arthur, D.; Vassilvitskii, S. How slow is the k-means method? In Proceedings of the twenty-second annual symposium on Computational geometry, Sedona, AZ, USA, 5–7 June 2006; pp. 144–153. [Google Scholar]
  31. Breiman, L. Bagging predictors. Mach. Learn. 1996, 24, 123–140. [Google Scholar] [CrossRef]
  32. Breiman, L. Random forests. Mach. Learn. 2001, 45, 5–32. [Google Scholar] [CrossRef]
  33. Friedman, J.; Hastie, T.; Tibshirani, R. Additive logistic regression: A statistical view of boosting (with discussion and a rejoinder by the authors). Ann. Statist. 2000, 28, 337–407. [Google Scholar] [CrossRef]
  34. Johnson, R.; Zhang, T. Learning nonlinear functions using regularized greedy forest. IEEE Trans. Pattern Anal. Mach. Intell. 2014, 36, 942–954. [Google Scholar] [CrossRef]
  35. He, X.; Pan, J.; Jin, O.; Xu, T.; Liu, B.; Xu, T.; Shi, Y.; Atallah, A.; Herbrich, R.; Bowers, S.; et al. Practical lessons from predicting clicks on ads at facebook. In Proceedings of the Eighth International Workshop on Data Mining for Online Advertising, New York, NY, USA, 24 August 2014; pp. 1–9. [Google Scholar]
  36. Kaggle. Available online: www.Kaggle.com (accessed on 16 July 2018).
  37. Friedman, J.H. Stochastic gradient boosting. Comput. Stat. Data Anal. 2002, 38, 367–378. [Google Scholar] [CrossRef]
  38. H2O.ai. H2O Framework for Machine Learning. Available online: http://docs.h2o.ai/h2o/latest-stable/h2o-docs/index.html (accessed on 15 February 2020).
  39. Meng, X.; Bradley, J.; Yavuz, B.; Sparks, E.; Venkataraman, S.; Liu, D.; Freeman, J.; Tsai, D.; Amde, M.; Owen, S.; et al. MLlib: Machine Learning in Apache Spark. J. Mach. Learn. Res. 2016, 17, 1235–1241. [Google Scholar]
  40. NASA. NASA HTTP. Available online: http://ita.ee.lbl.gov/html/contrib/NASA-HTTP.html (accessed on 1 July 2018).

Article Metrics

Citations

Article Access Statistics

Multiple requests from the same IP address are counted as one view.