Article

A Low-Cost Method of Improving the GNSS/SINS Integrated Navigation System Using Multiple Receivers

1
School of Automation, Nanjing Institute of Technology, Nanjing 211167, China
2
Department of Development and Planning, Jiangsu Automation Research Institute of CSIC, Lianyungang 222061, China
3
School of Computer Science and Engineering, Nanjing University of Science and Technology, Nanjing 210094, China
4
School of Automation, Nanjing University of Science and Technology, Nanjing 210094, China
*
Authors to whom correspondence should be addressed.
Electronics 2020, 9(7), 1079; https://doi.org/10.3390/electronics9071079
Submission received: 3 June 2020 / Revised: 27 June 2020 / Accepted: 30 June 2020 / Published: 1 July 2020
(This article belongs to the Special Issue Autonomous Navigation Systems for Unmanned Aerial Vehicles)

Abstract

:
GNSS (global navigation satellite system) and SINS (strap-down inertial navigation system) integrated navigation systems have been the apparatus for providing reliable and stable position and velocity information (PV). Commonly, there are two solutions to improve the GNSS/SINS integration navigation system accuracy, i.e., employing GNSS with higher position accuracy in the integration system or utilizing the high-grade inertial measurement unit (IMU) to construct the integration system. However, technologies such as RTK (real-time kinematic) and PPP (precise point positioning) that improve GNSS positioning accuracy have higher costs and they cannot work under high dynamic environments. Also, an IMU with high accuracy will lead to a higher cost and larger volume, therefore, a low-cost method to enhance the GNSS/SINS integration accuracy is of great significance. In this paper, multiple receivers based on the GNSS/SINS integrated navigation system are proposed with the aim of providing more precise PV information. Since the chip-scale receivers are cheap, the deployment of multiple receivers in the GNSS/SINS integration will not significantly increase the cost. In addition, two different filtering methods with central and cascaded structure are employed to process the multiple receivers and SINS integration. In the centralized integration filter method, measurements from multiple receivers are directly processed to estimate the SINS errors state vectors. However, the computation load increases heavily due to the rising dimension of the measurement vector. Therefore, a cascaded integration filter structure is also employed to distribute the processing of the multiple receiver and SINS integration. In the cascaded processing method, each receiver is regarded as an individual “sensor”, and a standard federated Kalman filter (FKF) is implemented to obtain an optimal estimation of the navigation solutions. In this paper, a simulation and a field tests are carried out to assess the influence of the number of receivers on the PV accuracy. A detailed analysis of these position and velocity results is presented and the improvements in the PV accuracy demonstrate the effectiveness of the proposed method.

1. Introduction

Represented the global positioning system (GPS), the global positioning navigation system (GNSS) has been widely used to generate position, velocity, and time (PVT) information [1,2]. Signals from the vehicle satellites are broadcast to the earth, and the receivers generate the PVT information by processing the satellites signals. However, due to the long range of the signal transmitting, the signal power is comparatively weak when it reaches the earth [3,4]. The limitation of the signal power leads to the receiver failing to work well under some challenging environments, e.g., in urban canyons, indoors, tunnels, etc. Basically, two major factors obstruct the GNSS positioning accuracy. Firstly, due to the signals reflected by surrounding objects, none-line-of-sight (NLOS) and multipath (MP) will induce additional errors in the pseudo-range measurements [5,6,7,8]. Secondly, a momentary partial or total signal blockage attenuates the position accuracy by changing the satellite distribution. Especially while the satellites are totally blocked, the receiver cannot output PVT information [9,10]. Therefore, in order to construct a seamless navigation system, GNSS is usually integrated with a strap-down inertial navigation system (SINS).
SINS is a completely self-contained navigation system without receiving or broadcasting any signals. SINS processes the angular rates and acceleration measurements from the gyroscopes and accelerometers, and then provides continuous positioning, velocity and attitude (PVA) information [11,12,13]. Compared with GNSS, the SINS works in almost all environments. The accuracy of the SINS depends on the accuracy of the employed gyroscope and accelerometer sensors [14,15,16]. Complicated noises contained in the raw measurements of the angular rates and acceleration lead to the SINS positioning errors diverging over time [16,17,18]. GNSS and SINS are recognized as highly complementary, i.e., while GNSS work well, accurate navigation solutions from the GNSS receiver can calibrate the errors of the SINS, and the on the contrary, SINS can provide accurate navigation solutions during the GNSS signal outage.
According to the measurements utilized in the integration, GNSS/SINS integration can be divided into three different architectures: loose, tight, and ultra-tight integration (LI, TI, and UTI, respectively). In the loose integration model, the difference between GNSS and SINS position and velocity information is employed as the measurements of the integration filter for estimating the SINS errors states [19,20,21,22]. In the tight and ultra-tight models, the pseudo-range and pseudo-range rates or baseband signal processing results are usually employed as the measurements of the integration filter [23,24,25]. Compared with TI and UTI, the LI model directly utilizes the position and velocity information to construct the measurement vector, which has the advantage of easy implementation. LI architecture is widely used in various applications for generating stable and precise PV information.
With careful analysis of the GNSS/SINS LI mechanism, there are three solutions to improve the LI accuracy. Firstly, since the GNSS receiver included in the integration is always with meter level accuracy, technologies such as RTK (real-time kinematic) and PPP (precise point positioning) capable of decimeter or centimeter level accuracy can improve the accuracy of the GNSS/SINS integration system. GNSS with RTK or PPP/SINS integration at different measurement levels has been implemented and evaluated [26,27,28]. Gao evaluated the impact of the IMU grades on the PPP/SINS TI system [26]; Watson characterized the performance of the GNSS-PPP/SINS TI system in a simulated environment [27]; and Li investigated high-accuracy positioning in urban areas using single-frequency GPS/BDS/GLONASS RTK/SINS integration [28]. However, the GNSS receivers with PPP or RKT are more expensive than those with the single point positioning (SPP) method. The prices of some typical products are listed in Table 1; a receiver with RTK usually costs hundreds of dollars, while the SPP-based receiver usually costs less than 20 dollars. Moreover, RTK or PPP cannot work under high dynamics, e.g., missiles or rockets.
Secondly, in the GNSS/SINS LI architecture, a low-cost IMU is usually employed to construct SINS for budgetary reasons. A low-cost IMU will also affect the positioning accuracy of the whole system, especially in the condition that GNSS ceases to be effective. Gao implemented the GNSS/SINS integration with different grades of the IMU, and their respective performance levels were characterized [26]. Niu presented the quantitative analysis of the IMU quality impact on the GNSS/SINS integration [29]. Table 2 lists the prices of some typical IMU products including MEMS IMUs and fiber optic gyroscope (FOG)-based IMUs. With bias stability decreasing, the price increases dramatically.
Thirdly, the LI integration model is highly nonlinear; linearization of the model will affect the performance of the integration. In order to alleviate the negative influence of the model’s nonlinearity on the integration, some nonlinear Kalman filters, such as UKF (unscented Kalman filter) or CKF (cubature Kalman filter), are utilized [30,31,32]. Fernández proposed a nonlinear Kalman filter for the GNSS/SINS UTI system [30]; Nourmohammadi employed a QR-factorized CKF in the decentralized GNSS/MEMS-SINS integration system [31]; Benzerrouk investigated adaptive CKF and sigma points KF based MEMS-IMU/GNSS data fusion for reducing the influence of the measurement outlier [32].
Motivated by the aim of enhancing the SPP-based GNSS/SINS LI positioning accuracy without raising costs, this paper investigated the use of multiple GNSS receivers (SPP) in the GNSS/SINS LI method. Since a chip-scale GNSS receiver (SPP) is cheap, i.e., the price of the U-blox NEO-M8N (U-blox, Thalwil, Switzerland) receiver was about 10 dollars. Compared with utilizing an IMU with higher accuracy, the cost of including more receivers in the GNSS/SINS LI system could be within the budget. The different receivers were regarded as individual “sensors” providing measurements for the integration filter. Two different processing methods with central and cascaded structures were investigated and compared. The central processing method directly utilized the measurements in the LI integration filter. However, in this centralized processing method, the dimension of the measurement vector increased with the number of receivers, which increased the computation load. The cascaded processing method divided the filter into several sub-filters with lower dimensions of the measurement vector. Moreover, the sub-filter could run parallel, which helped to reduce the computation load. Finally, both a simulation and a field test were carried out to evaluate the performance of the proposed method.
The remainder of this paper is organized as follows: Section 2 examines the integration model in detail including the state and measurement model, the central processing method, and the cascaded processing method. Section 3 presents the simulation and the results analysis; the discussion and conclusion are presented in Section 4 and Section 5, respectively.
2. Methods

2.1. Integration Model with One Receiver

2.1.1. The Integration Filter Error State Model

The LI integration scheme includes 15 states composed of position errors, velocity errors, attitude errors, gyroscope bias, and the accelerometer bias. The state vector X is defined as:
X = [ δ ϕ , δ v , δ p , δ ε , δ ] T
where the vector δ ϕ = [ α , β , γ ] is the error of pitch, roll, and yaw attitude angle, respectively; the vector δ v = [ δ v e , δ v n , δ v u ] is the error of east, north, and up velocity in east-north-up (ENU) navigation frame, respectively; the vector δ p = [ δ L , δ λ , δ h ] is the latitude, longitude, and height (LLH) errors, respectively; the vector δ ε = [ ε x , ε y , ε z ] is the three-axis gyroscope bias; and the vector δ = [ x , y , z ] is the three-axis accelerometers bias.
The integration filter is commonly a Kalman filter, thus, the state equation can be written as:
X k + 1 = F k + 1 , k × X k + G × W
where F k + 1 , k is the state transformation matrix, which is constructed based on the SINS error model; W is the system error noise matrix, which is usually model as zero-mean white Gaussian noises; and G is the matrix of the process noise distribution [18,19,20,21].

2.1.2. The Integration Filter Measurement Model

As aforementioned, position and velocity differences between GNSS and SINS are employed to construct the measurement vector, and the model is expressed as:
Z k + 1 = H k + 1 X k + 1 + μ k + 1
where Z k + 1 is the measurement vector at k + 1 epoch; H k + 1 is the observation matrix; and μ k + 1 is the measurement noise. Normally, the measurement noise is assumed to be subject to Gaussian distribution. The detailed form of the measurement vector is as follows [18,19,20,21]:
Z k + 1 = [ ( L k + 1 I N S L k + 1 G N S S ) ( R M + h ) ( λ k + 1 I N S λ k + 1 G N S S ) ( R N + h ) c o s ( L ) h k + 1 I N S h k + 1 G N S S v e , k + 1 I N S v e , k + 1 G N S S v n , k + 1 I N S v n , k + 1 G N S S v u , k + 1 I N S v u , k + 1 G N S S ]
The observation matrix H k + 1 is:
Z k + 1 = [ d i a g [ R M + h ( R N + h ) cos ( L )   1 ] 0 3 × 3 0 3 × 9 0 3 × 3 d i a g [ 1 1 1 ] 0 3 × 9 ] X k + 1 + μ k + 1

2.1.3. Kalman Filter

A standard Kalman filter works with the two-step process: prediction and updating. In the first step, the filter predicts the states at the next epoch with the state transformation matrix and error covariance matrix:
X ˜ k + 1 = F k . k + 1 X k
P ˜ k + 1 = F k . k + 1 P ^ k F k , k + 1 T + Q k
where the symbols, ‘~’ and ‘^’, denote prediction and updated parameters, respectively. Q k is the covariance matrix of the process noise. In the second step, the state is updated in a weighted average manner based on state propagation and the measurements:
X ^ k + 1 = X ˜ k + 1 + K k + 1 ( Z k + 1 H k + 1 X ˜ k + 1 )
K k + 1 = P ˜ k + 1 ( H k + 1 ) T [ H k + 1 P ˜ k + 1 ( H k + 1 ) T + R k + 1 ] 1
P ^ k + 1 = ( I K k + 1 H k + 1 ) P ˜ k + 1
where R k + 1 is the covariance matrix of the observation noise and K k + 1 is the Kalman gain matrix.

2.2. Intgeration Model with Multiple Receivers

2.2.1. Centralized Integration Filter Method (CIF)

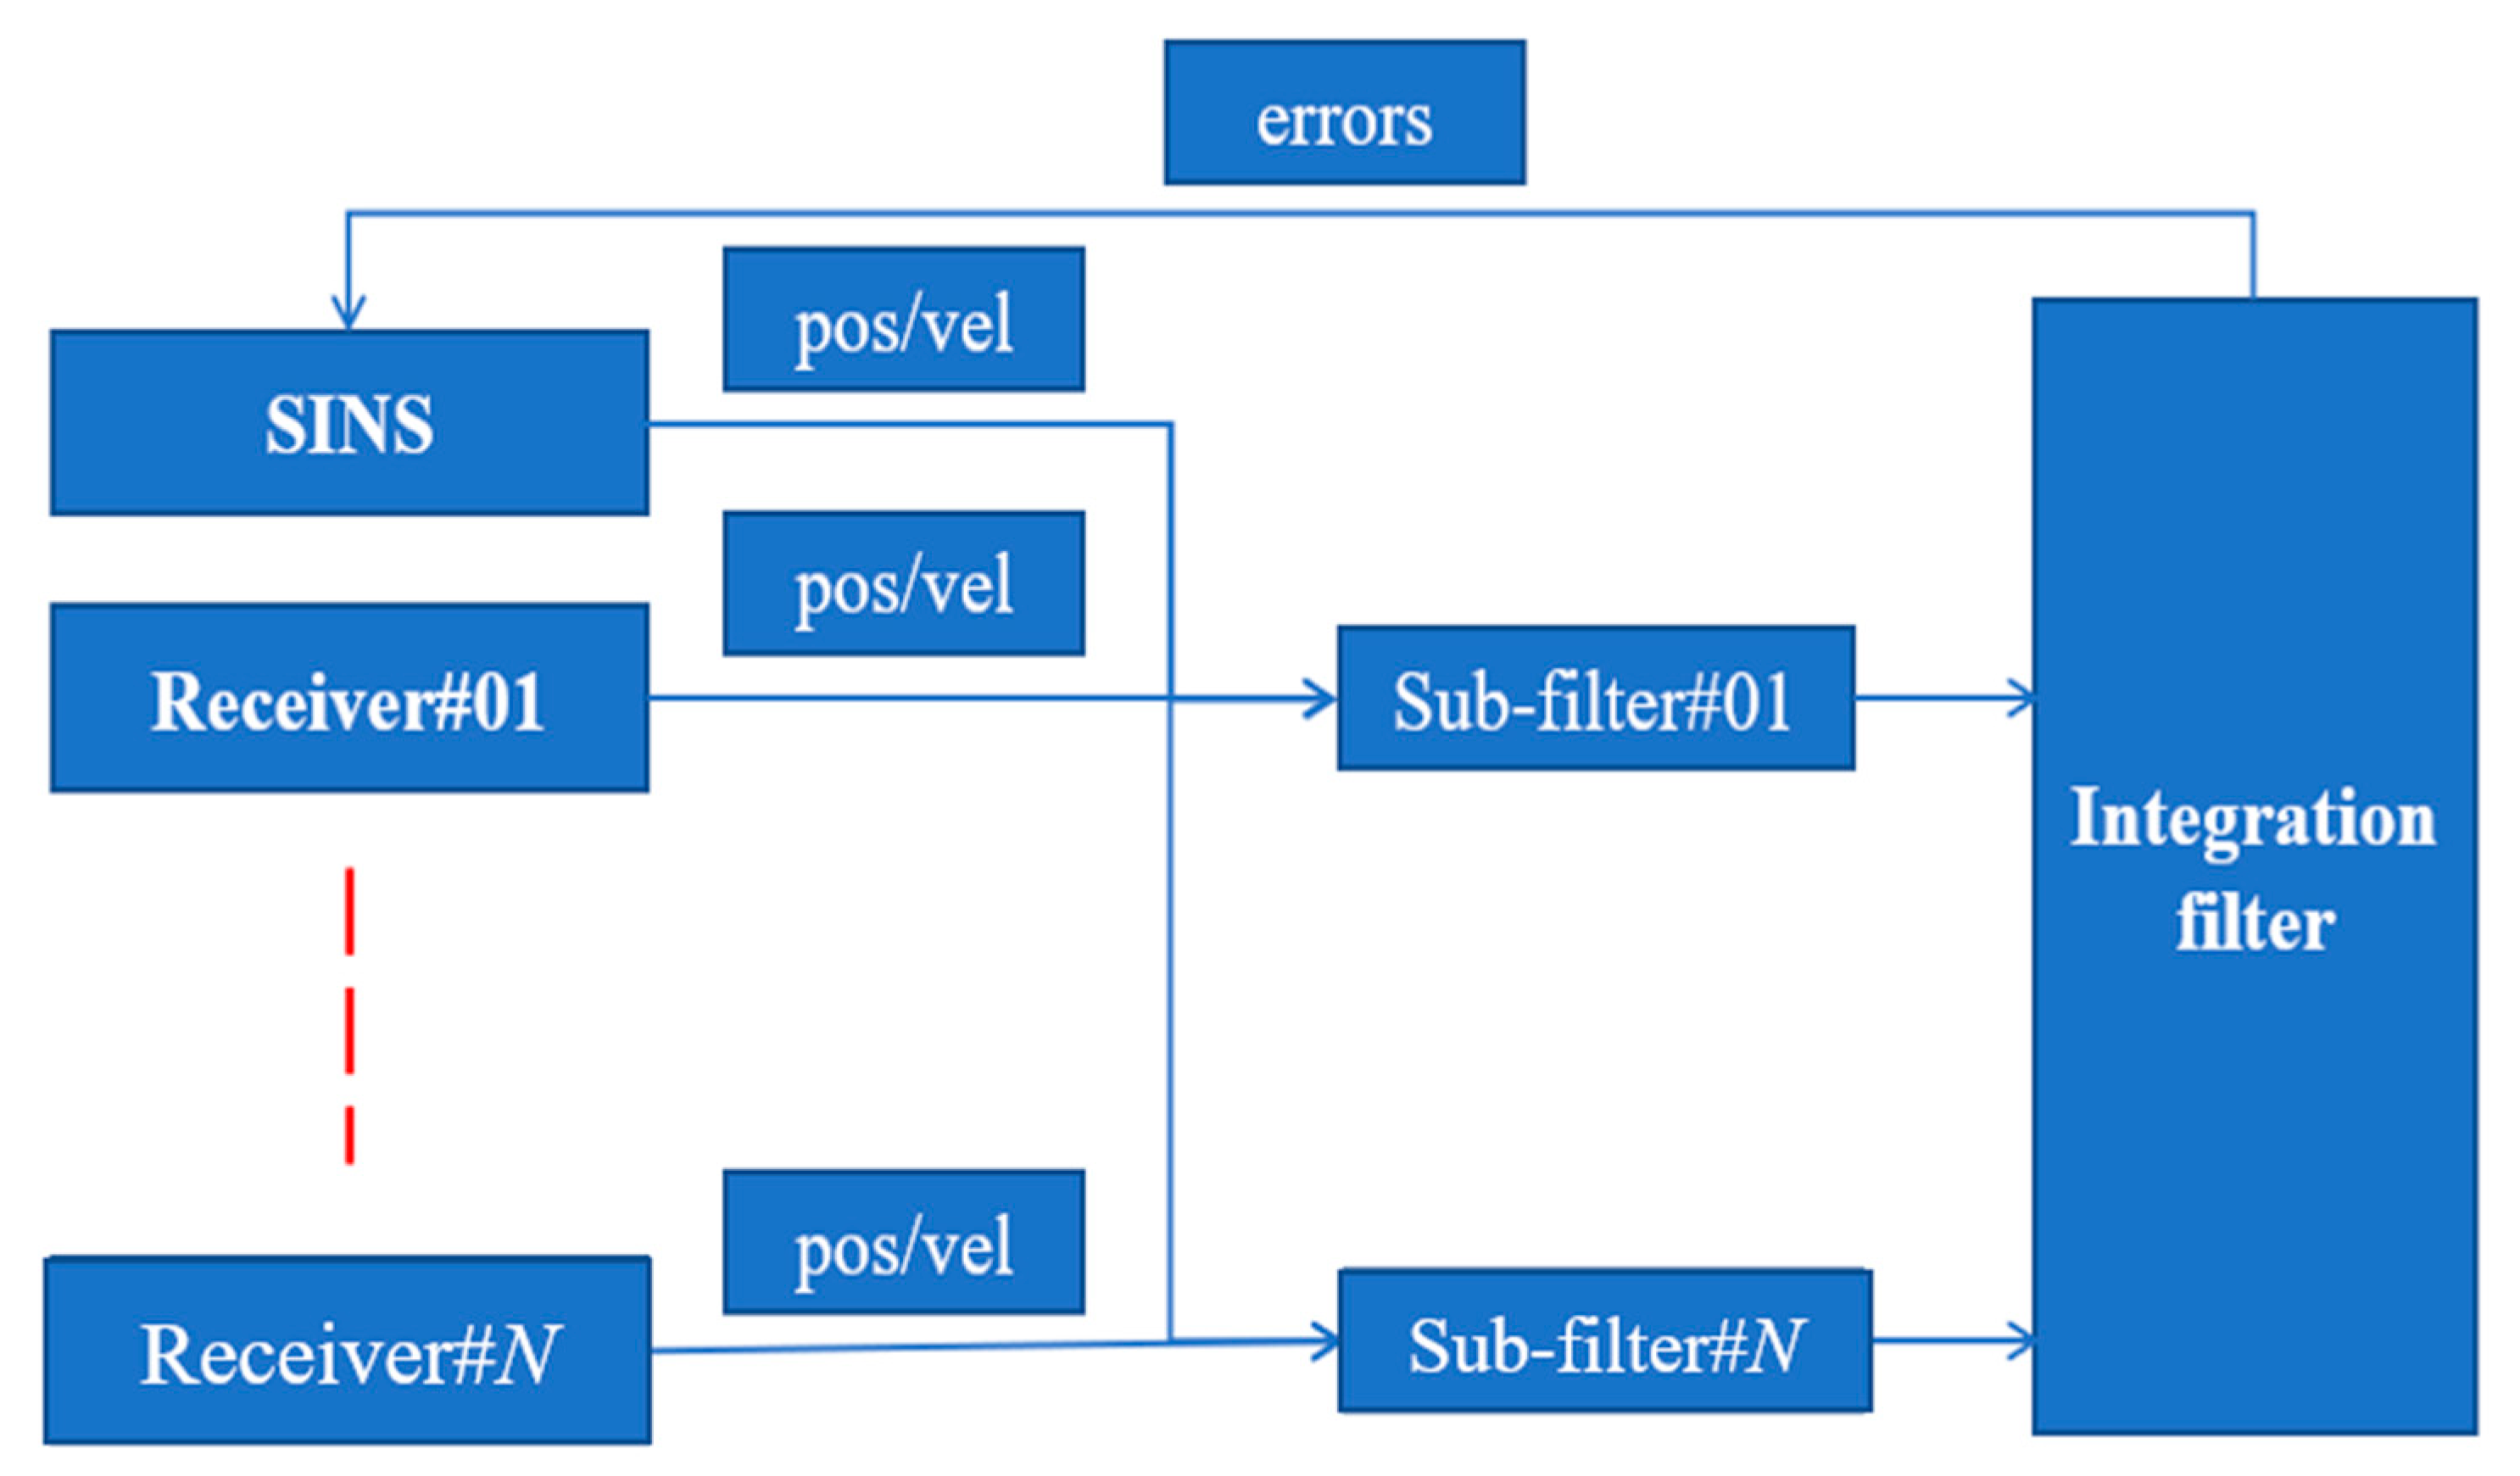
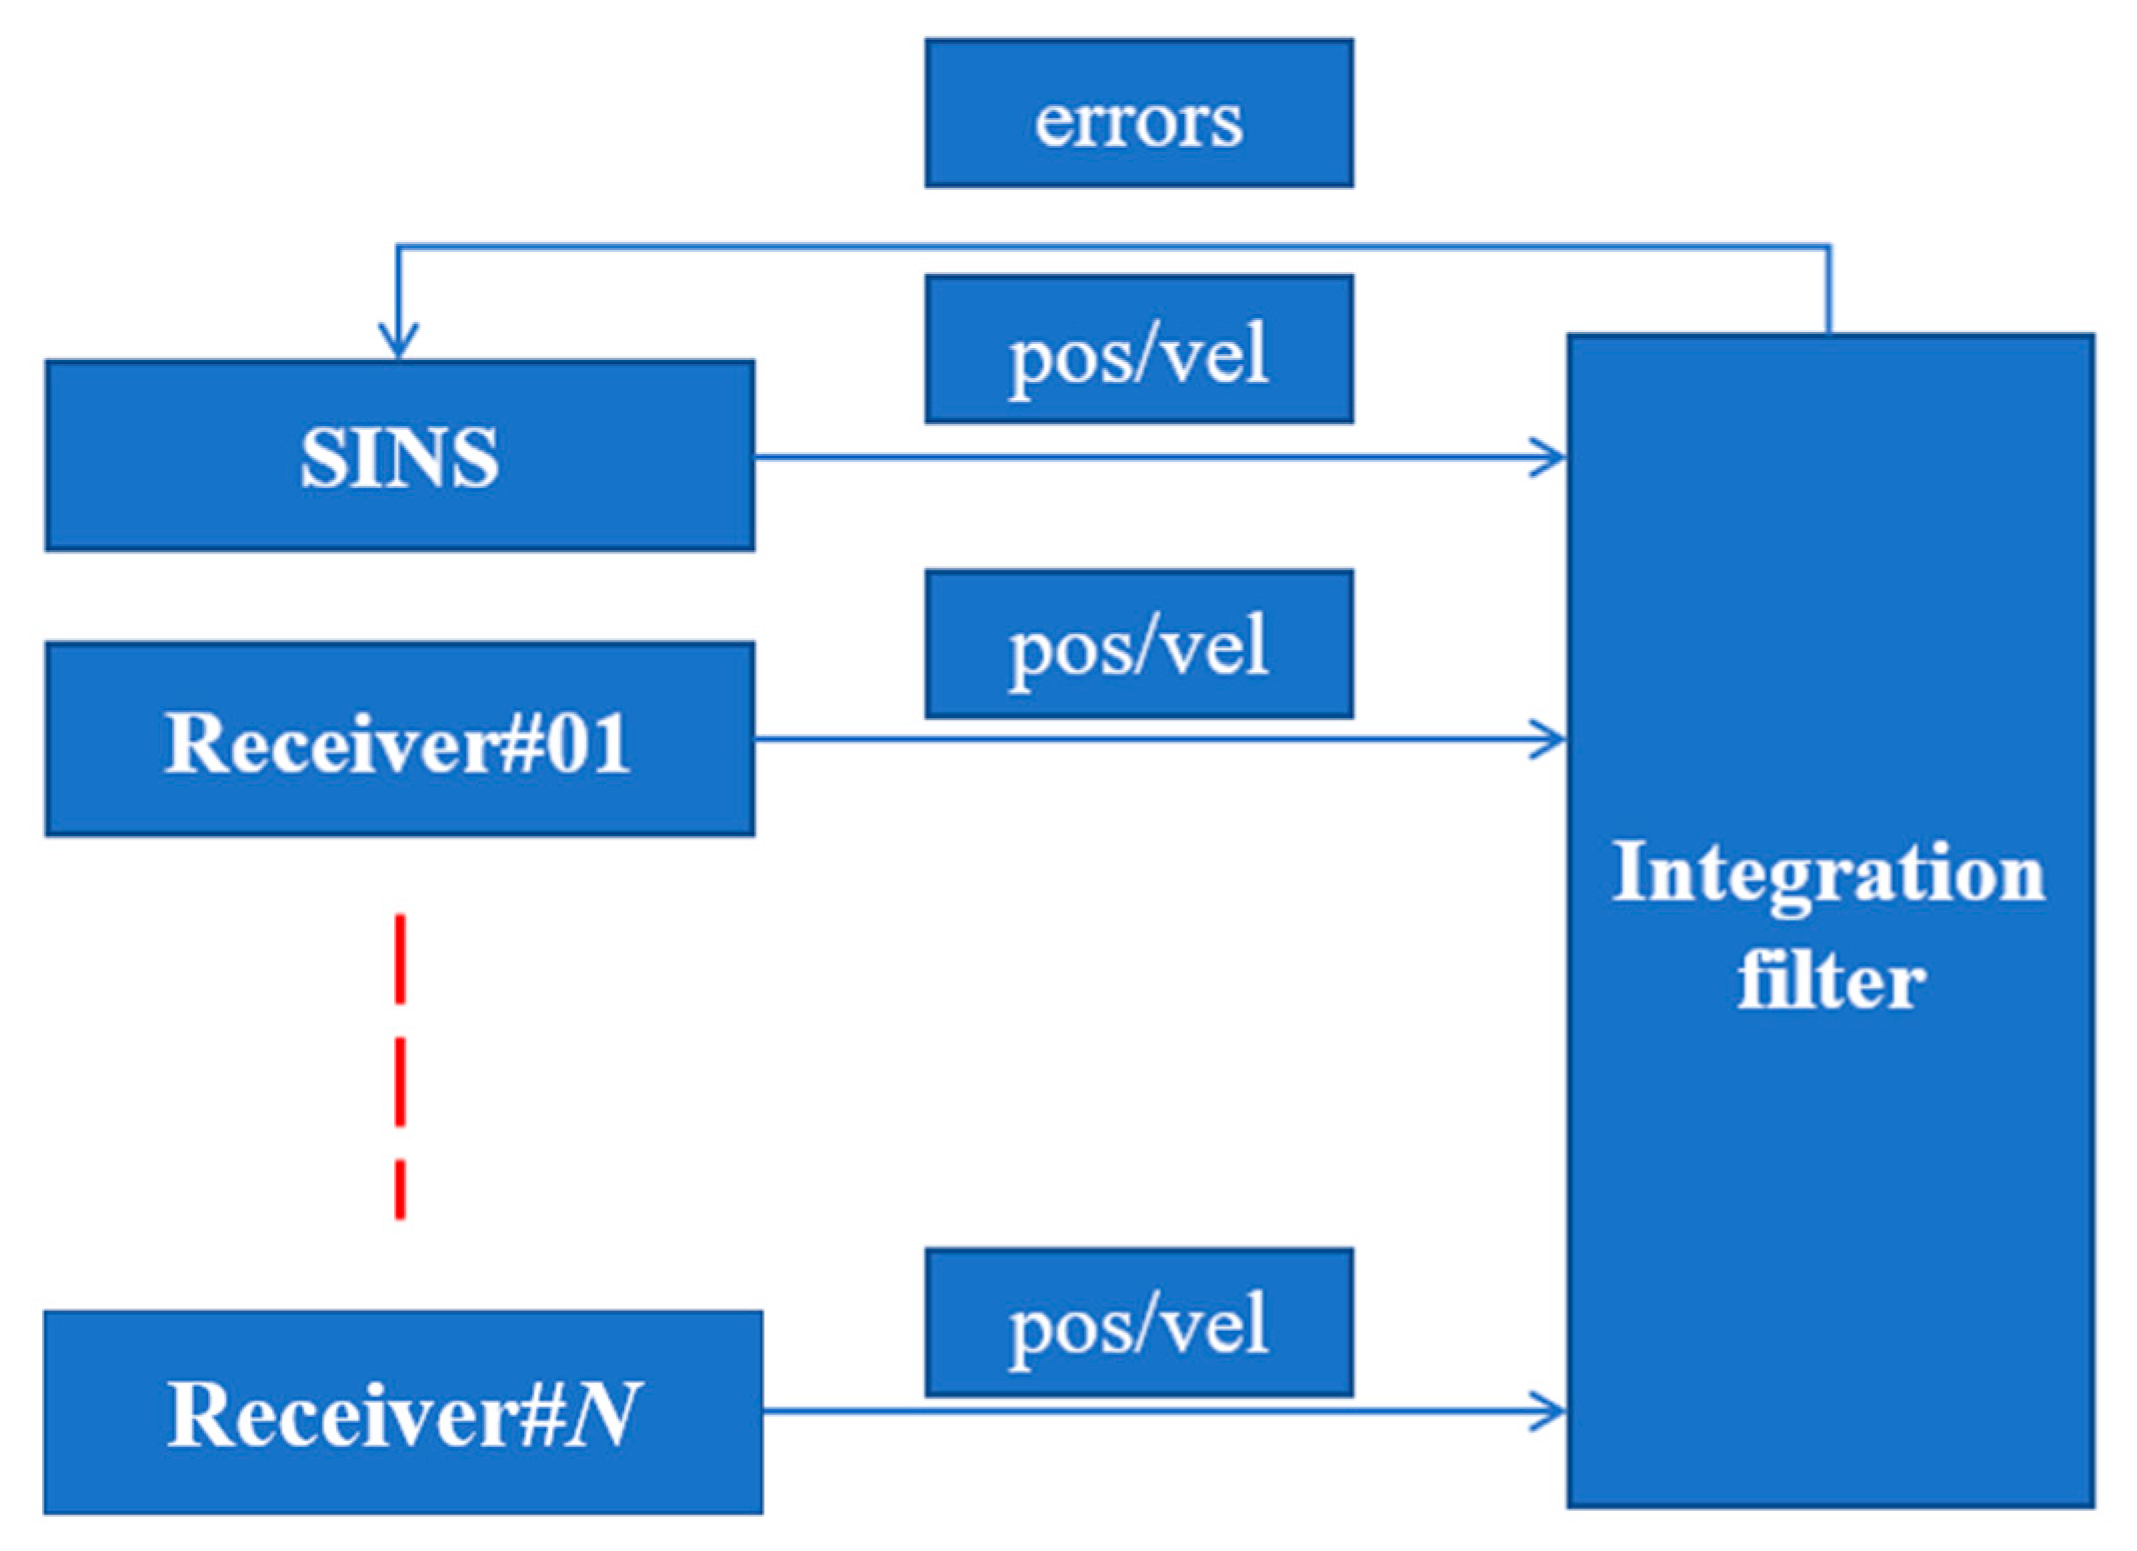
The centralized integration filter (CIF) architecture is presented in Figure 1; all the measurements are directly employed to construct the measurement vector. The following Equations (11) and (12) illustrate the measurement vector of the CIF. Notably, the error state model of the CIF method remains the same as in Equation (2):
Z k + 1 CIM = [ Z k + 1 r 1 Z k + 1 r i Z k + 1 r N ] = [ H k + 1 r 1 H k + 1 r i H k + 1 r N ] X k + 1 + [ μ k + 1 r 1 μ k + 1 r i μ k + 1 r N ] ,   i = 1 , , N
Z k + 1 r i = H k + 1 r i X k+1 + μ k + 1 r i = [ ( L k + 1 I N S L k + 1 r i ) ( R M + h ) ( λ k + 1 I N S λ k + 1 r i ) ( R N + h ) c o s ( L ) h k + 1 I N S h k + 1 r i v e , k + 1 I N S v e , k + 1 r i v n , k + 1 I N S v n , k + 1 r i v u , k + 1 I N S v u , k + 1 r i ] X k+1 + μ k + 1 r i
where the superscript r i refers to the ith receiver; the subscript k + 1 refers to the epoch; Z k + 1 r i is the measurement vector composed of the different information from the ith receiver and SINS; L k + 1 r i ,   λ k + 1 r i and h k + 1 r i are latitude, longitude, and height from the ith receiver; and v e , k + 1 r i , v n , k + 1 r i and v u , k + 1 r i are east, north, and up velocity from the ith receiver. The observation matrix H k + 1 r i is identical to Equation (5), and μ k + 1 r i is the measurement noise matrix of the ith receiver.
With more receivers employed in the LI, the Kalman filter processing is re-written as follows:
X ˜ k + 1 = F k . k + 1 X k
P ˜ k + 1 = F k . k + 1 P ^ k F k , k + 1 T + Q k
X ^ k + 1 = X ˜ k + 1 + K k + 1 C I M ( [ Z k + 1 r 1   Z k + 1 r i   Z k + 1 r N ] [ H k + 1 r 1 H k + 1 r i H k + 1 r N ] X ˜ k + 1 )
[ K k + 1 r 1   K k + 1 r i   K k + 1 r N ] = P ˜ k + 1 [ H k + 1 r 1 H k + 1 r i H k + 1 r N ] T [ [ H k + 1 r 1 H k + 1 r i H k + 1 r N ] P ˜ k + 1 [ H k + 1 r 1 H k + 1 r i H k + 1 r N ] T + [ R k + 1 r 1   R k + 1 r i   R k + 1 r N ] ] 1
P ^ k + 1 = ( I K k + 1 C I M [ H k + 1 r 1 H k + 1 r i H k + 1 r N ] ) P ˜ k + 1
K k + 1 C I M = [ K k + 1 r 1 K k + 1 r i K k + 1 r N ]
where K k + 1 C I M is the Kalman gain matrix of the CIF. Compared with the Kalman filter described in Equations (6)–(10), the Kalman filter of the CIF has different updating equations. Substituting Equation (18) into Equation (15), the X ^ k + 1 updating can be written as:
X ^ k + 1 = X ˜ k + 1 + [ K k + 1 r 1 ( Z k + 1 r 1 H k + 1 r 1 X ˜ k + 1 ) K k + 1 r i ( Z k + 1 r i H k + 1 r i X ˜ k + 1 ) K k + 1 r N ( Z k + 1 r N H k + 1 r N X ˜ k + 1 ) ] = X ˜ k + 1 + i = 1 N K k + 1 r i ( Z k + 1 r i H k + 1 r i X ˜ k + 1 )
where the state X ^ k + 1 is estimated by adaptively fusing the measurements from multiple receivers.

2.2.2. Distributed Integration Filter Method (DIF)

As illustrated in Equations (13)–(17), with multiple receivers employed in the LI, the dimension of the measurement vector, Kalman gain matrix, and measurement observation matrix increase with the number of included receivers. As a result, the computation load of the integration filter increases significantly. Federated Kalman filtering (FKF) has been demonstrated an effective distributing method to process multi-sensor integration [33]. Since the sub-filter can run parallel, the FKF can reduce the computation load by dividing the measurement vector into several vectors with lower dimensions. Therefore, a distributive integration filter method (DIF) based on the FKF is designed and presented in this section (the structure is presented in Figure 2). In the DIF, each receiver is regarded as an individual “sensor”.
(a) Sub-filter model
The sub-filter error state model is similar to Equations (1) and (2). The error vector is expressed as:
X r i = [ δ ϕ , δ v , δ p , δ ε , δ ] T
Similar to Equation (2), the state model is:
X ˙ k + 1 r i = F k + 1 , k r i X k r i + G r i W r i
where, F k + 1 , k r i is the state transfer matrix; W r i is the system error noise matrix; and G r i is the matrix of the process noise distribution. The measurement vector of the r i receiver is the same as in Equation (11).
(b) Federated Kalman filter (FKF)
With the state and measurement listed in Equations (20) and (21), the prediction and updating of the sub-filter are written as:
X ^ k , k + 1 r i = F k , k + 1 r i X k r i
P k , k + 1 r i = F k , k + 1 r i P k r i ( F k , k + 1 r i ) T + Q k r
K k + 1 r i = P k , k + 1 r i ( H k + 1 r i ) T ( H k + 1 r i P k , k + 1 r i ( H k + 1 r i ) T + R k + 1 r i ) 1
X ^ k + 1 r i = X ^ k + 1 , k r i + K k + 1 r i ( Z k + 1 r i H k + 1 r i X ^ k + 1 , k r i )
P k + 1 r i = ( Ι K k + 1 r i H k + 1 r i ) P k , k + 1 r i
where P k r i is the covariance matrix of the ith sub-filter; Q k r is the covariance of the processing noise; and R k + 1 r i is the covariance of the measurement noise.
The sharing processing of the federated filter is as follows:
P k + 1 M = [ i = 1 N ( P k r i ) 1 ] 1
X ^ k + 1 M = P k + 1 M [ i = 1 N ( P k r i ) 1 X ^ k r i ]
where the superscript “M” represents the matrix from the master filter in the FKF. The more specific sharing procedure is as follows:
Q k r i = β r i 1 Q k M
P k r i = β r i 1 P k M
i = 1 N β r i = 1
where β r i information sharing factor, and it should satisfy Equation (31); P k + 1 M is the covariance matrix of the master integration filter; Q k M is the processing noise matrix of the master integration filter; and X ^ k M is the error state vector of the master filter.
Assuming that there are N receivers deployed here, the dimensions of the matrixes of the KF are listed in Table 3. In the DIF, the dimensions of the measurement vector, observation, and KF gain matrix are all reduced compared with those of the CIF method.

3. Results

3.1. Simulation Test

3.1.1. The Integration Filter Error State Model

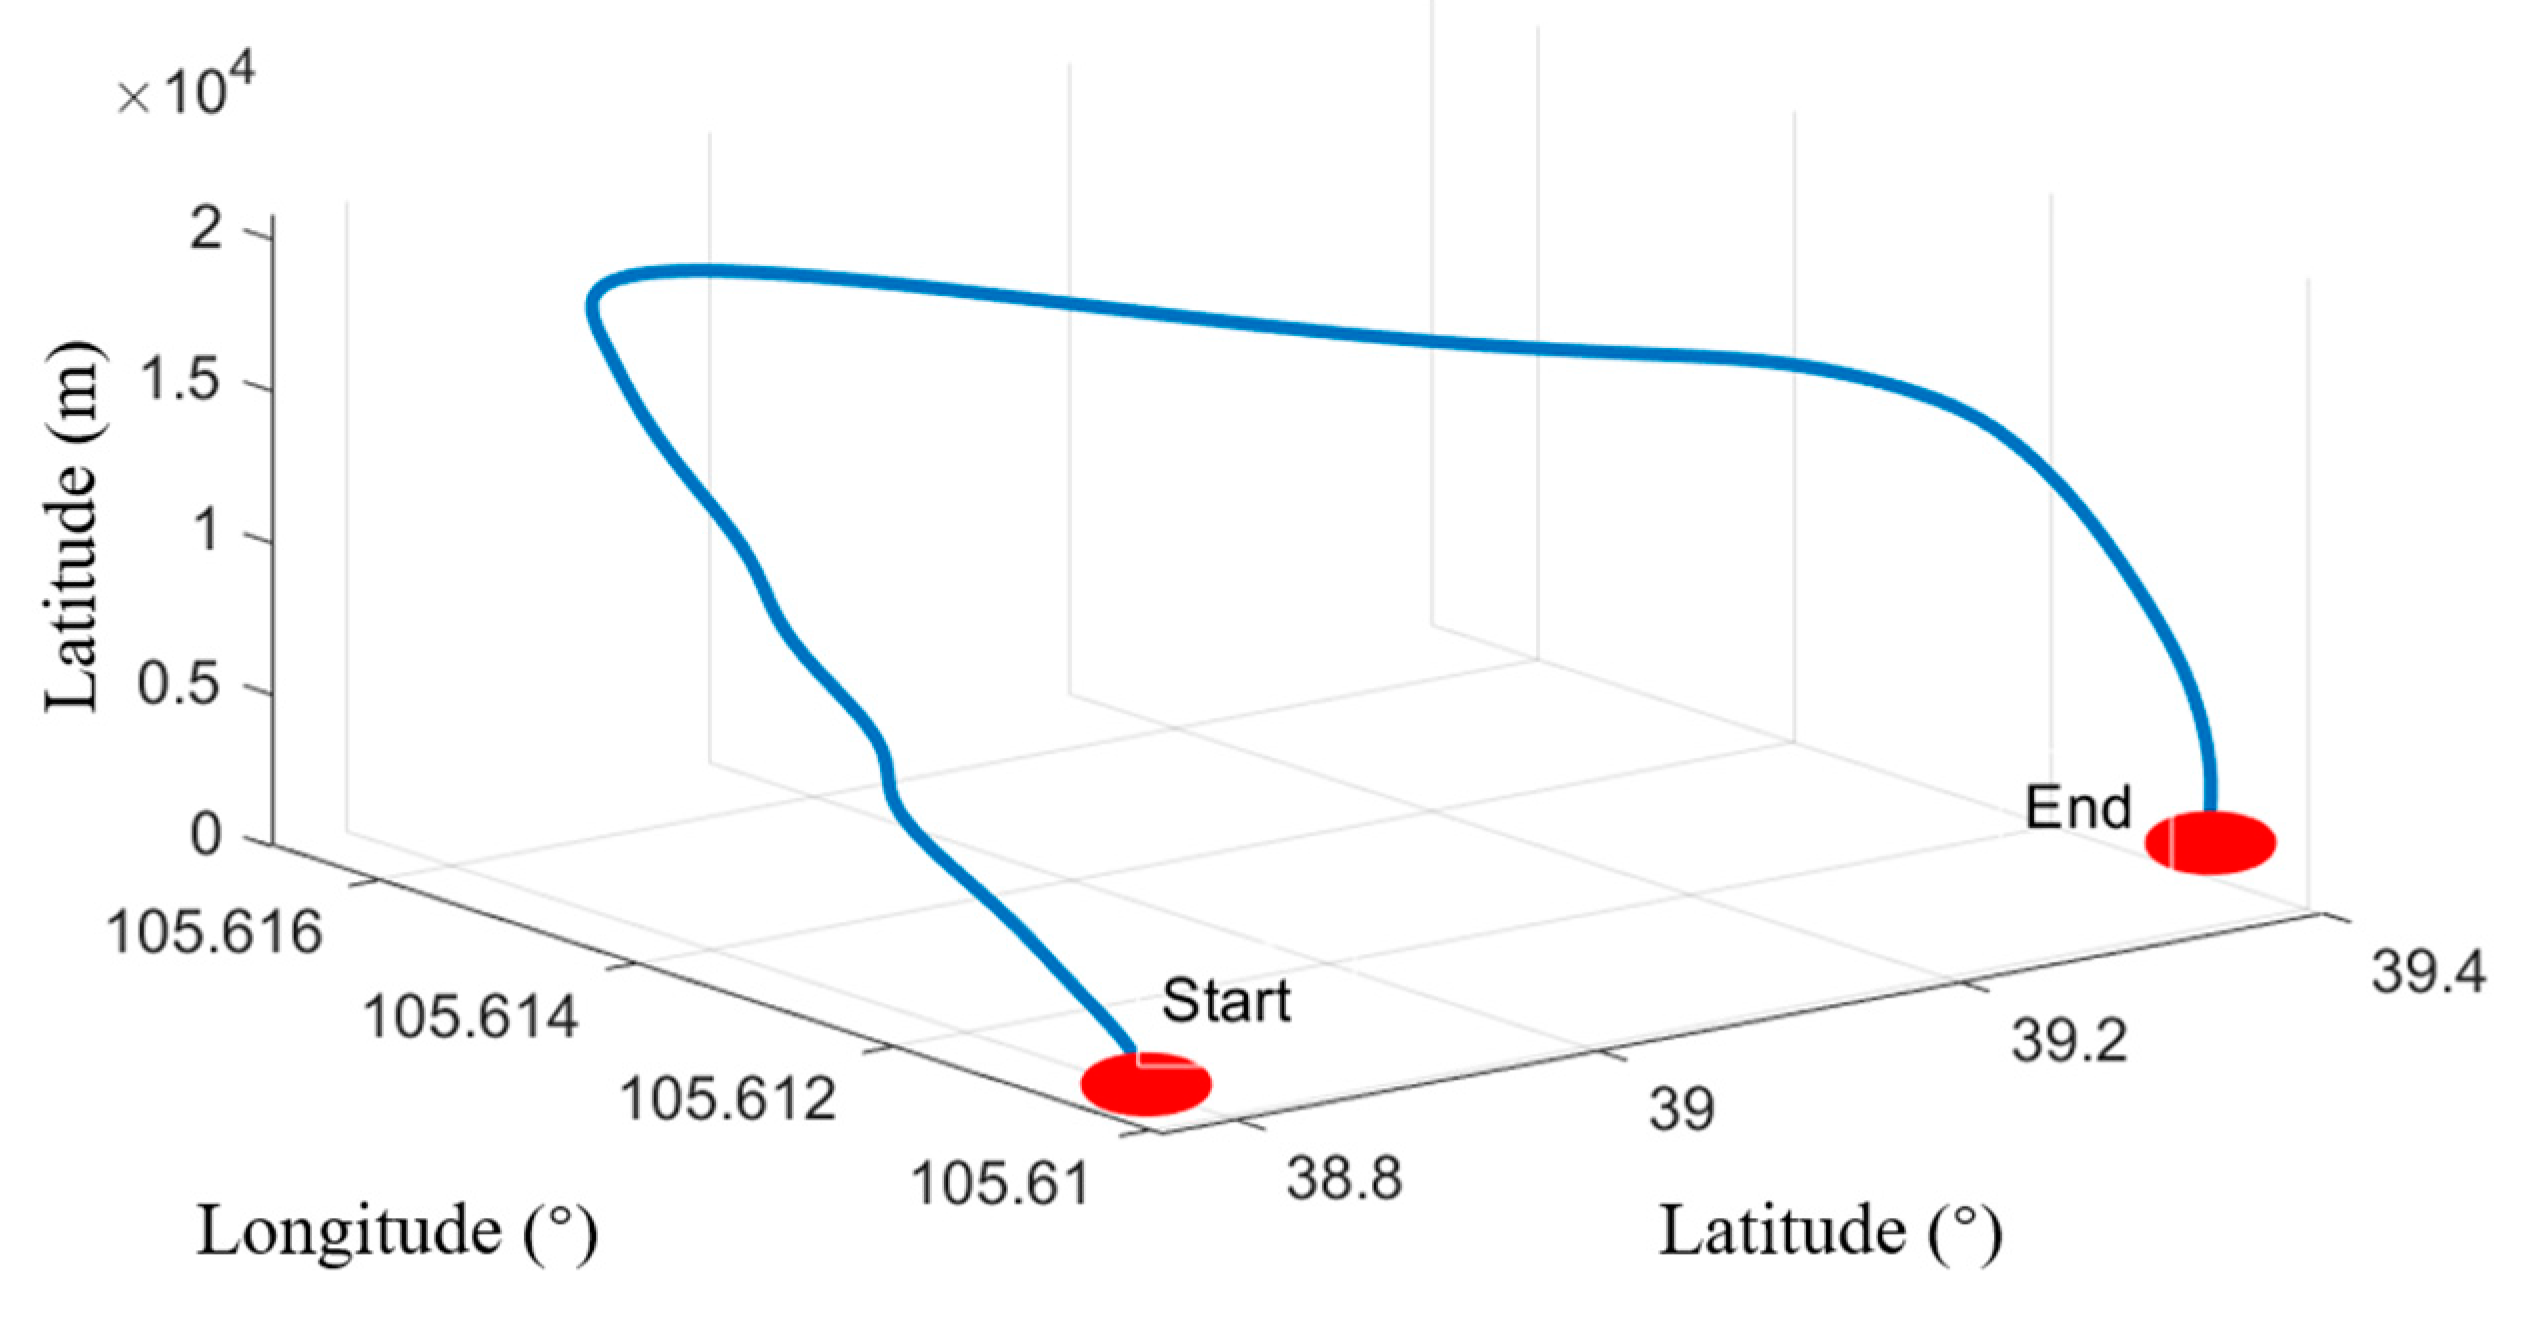
In order to validate and evaluate the performance of the proposed method, both a simulation and a field test were carried out. In the simulation, a dynamic trajectory was generated, which is plotted in Figure 3. The IMU and the GNSS settings are listed in Table 4. The accelerometer bias was 5 mg and the noise was 1 mg; the gyroscope bias was 10°/h, and the noise was 1°/h. In terms of the GNSS errors, the position errors were set to 10 m, and the velocity errors were set to 0.1 m/s. The multiple receiver positions and velocity were simulated through adding white noise to the real measurements.

3.1.2. Comparison of Position/Velocity Errors

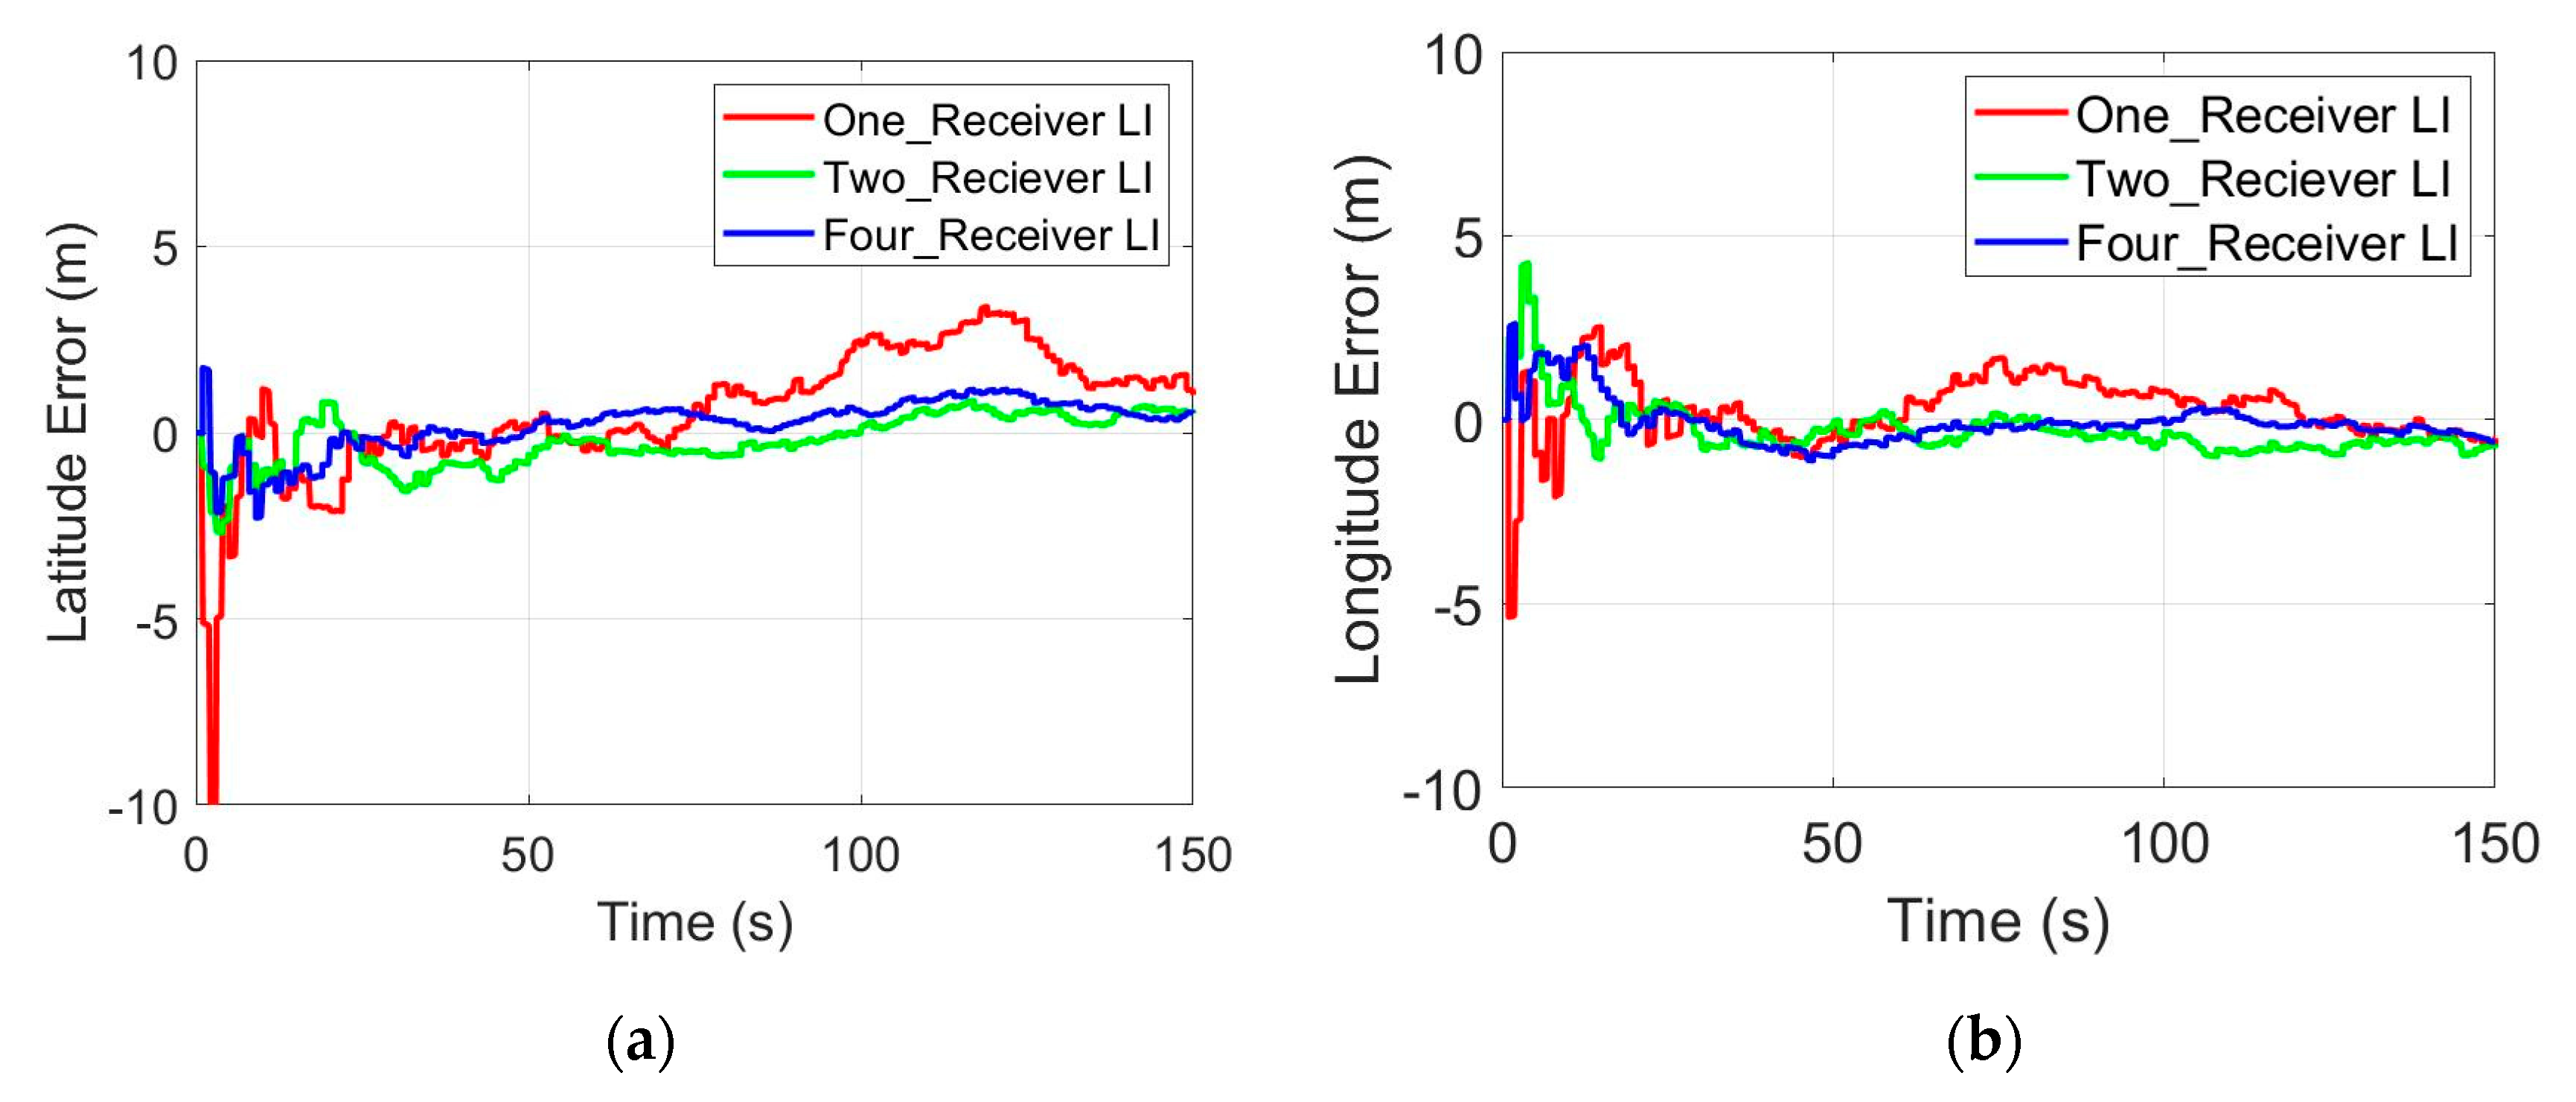
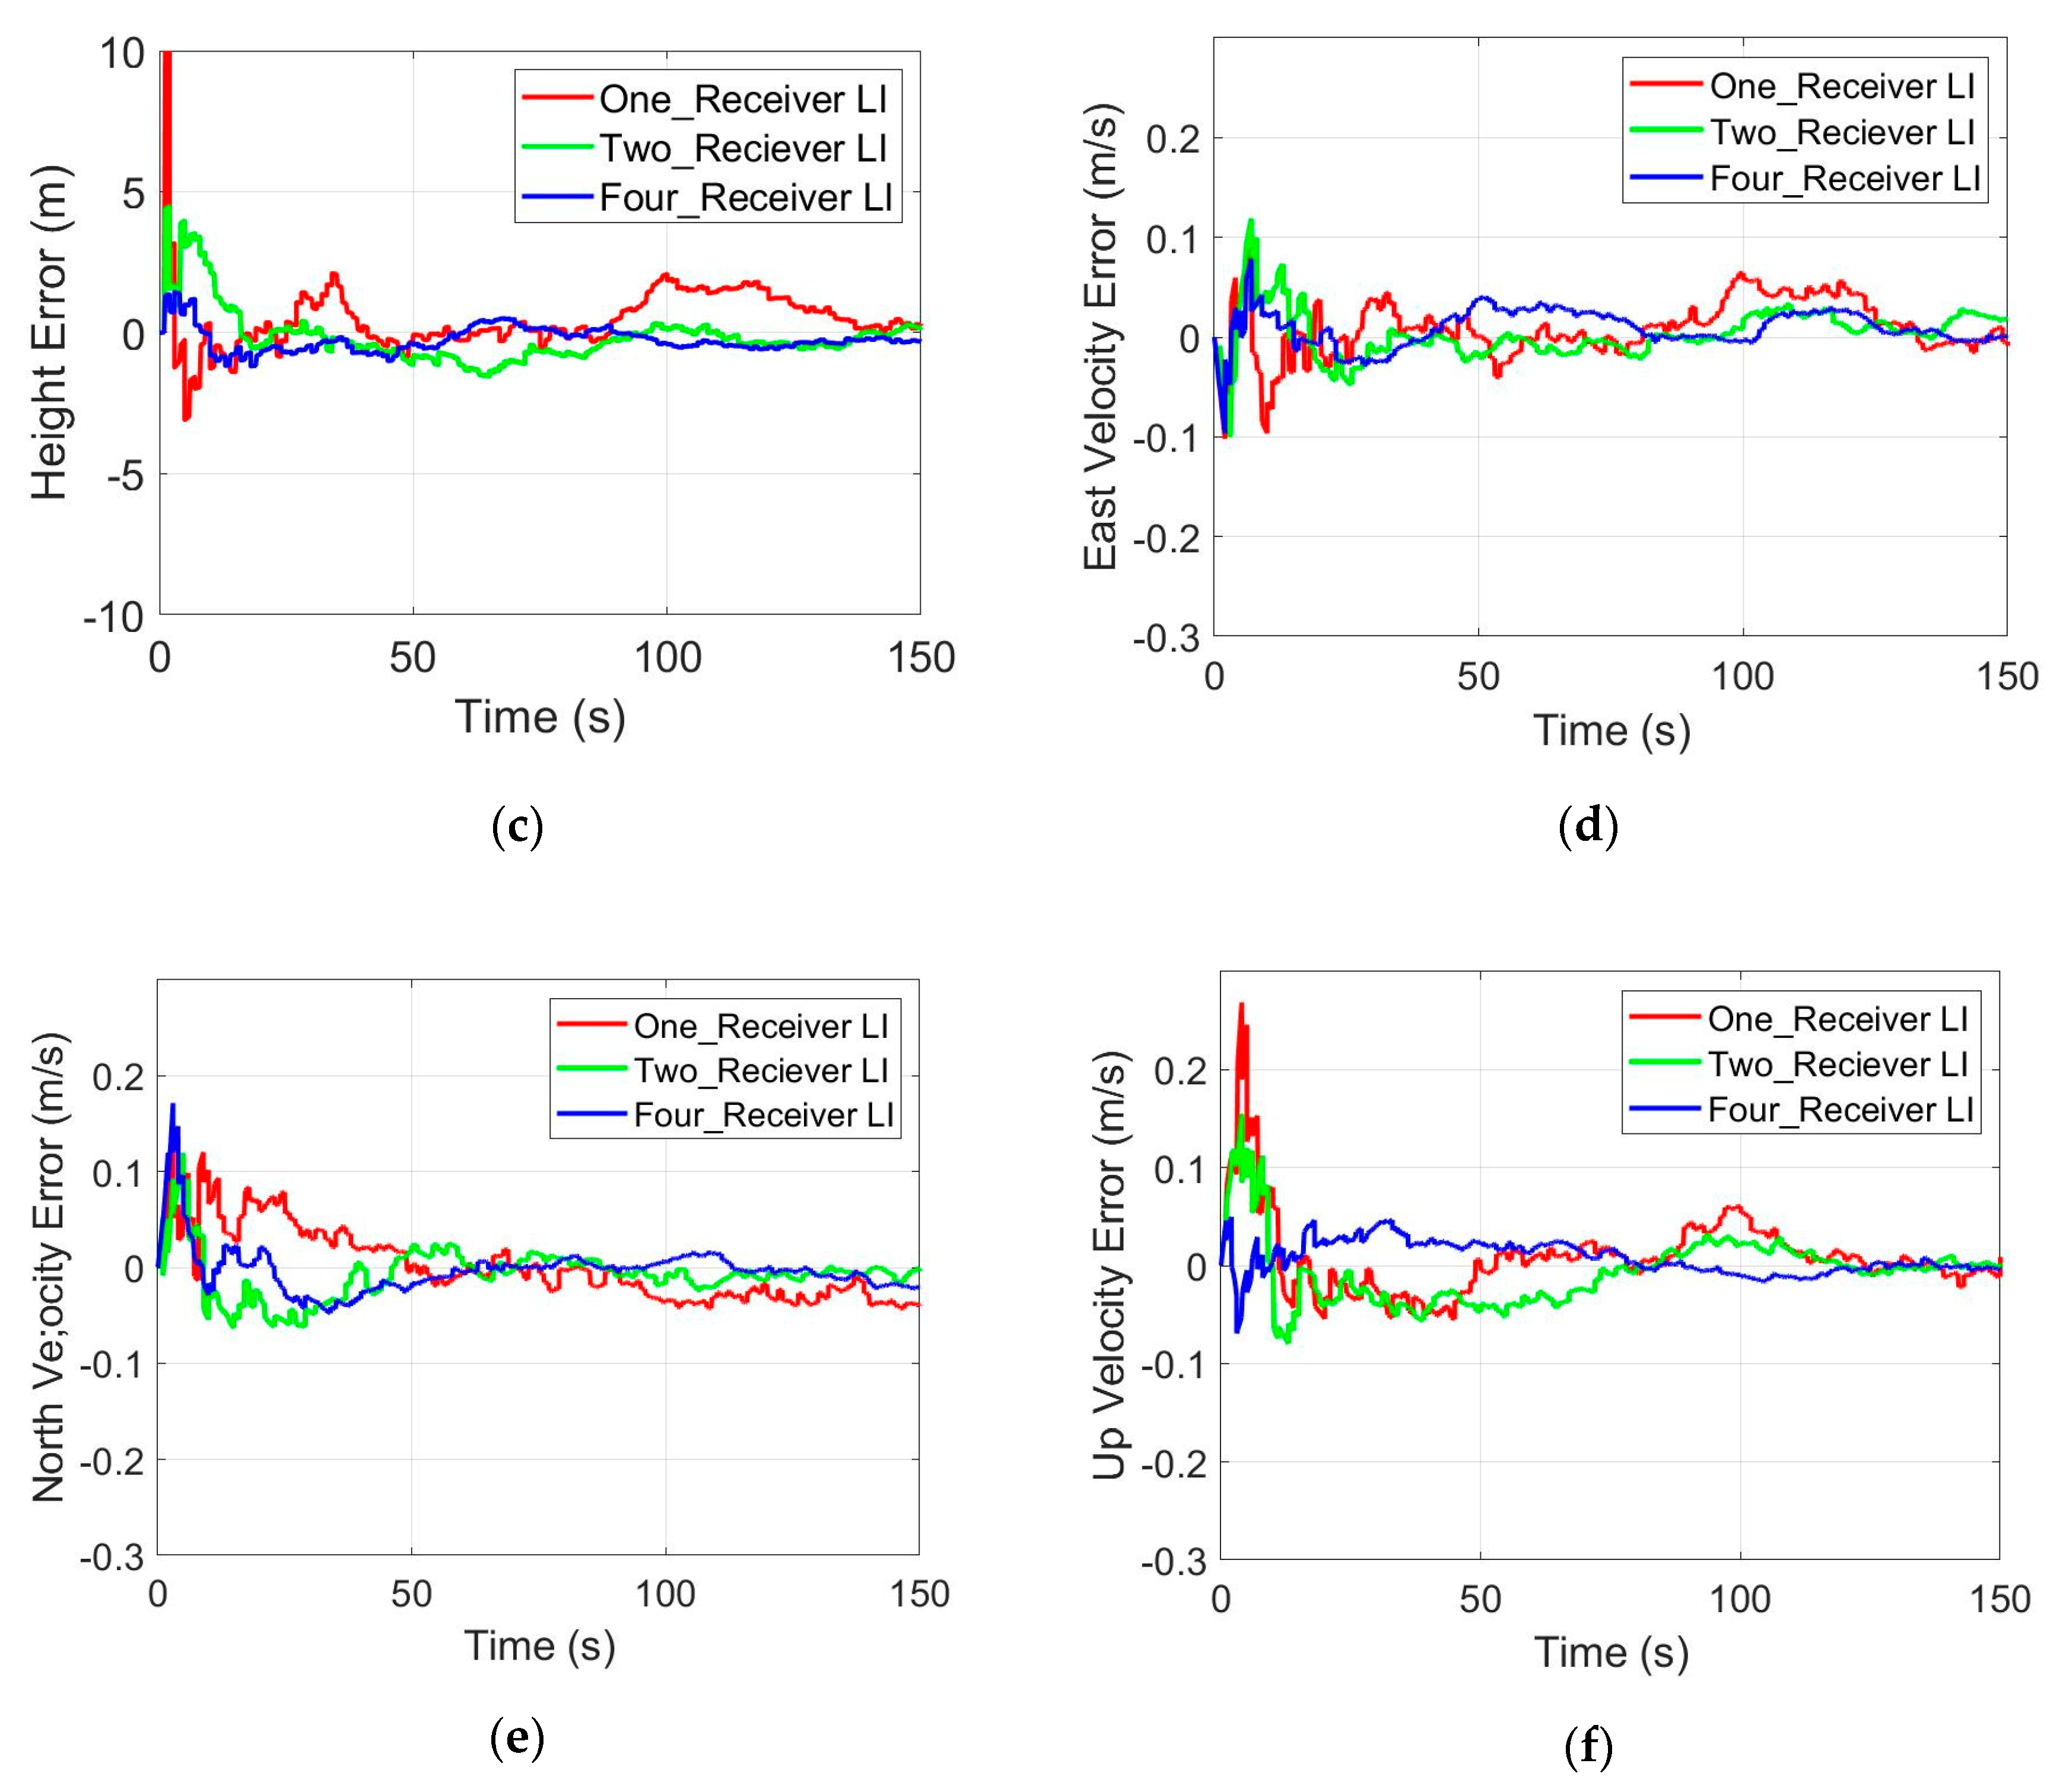
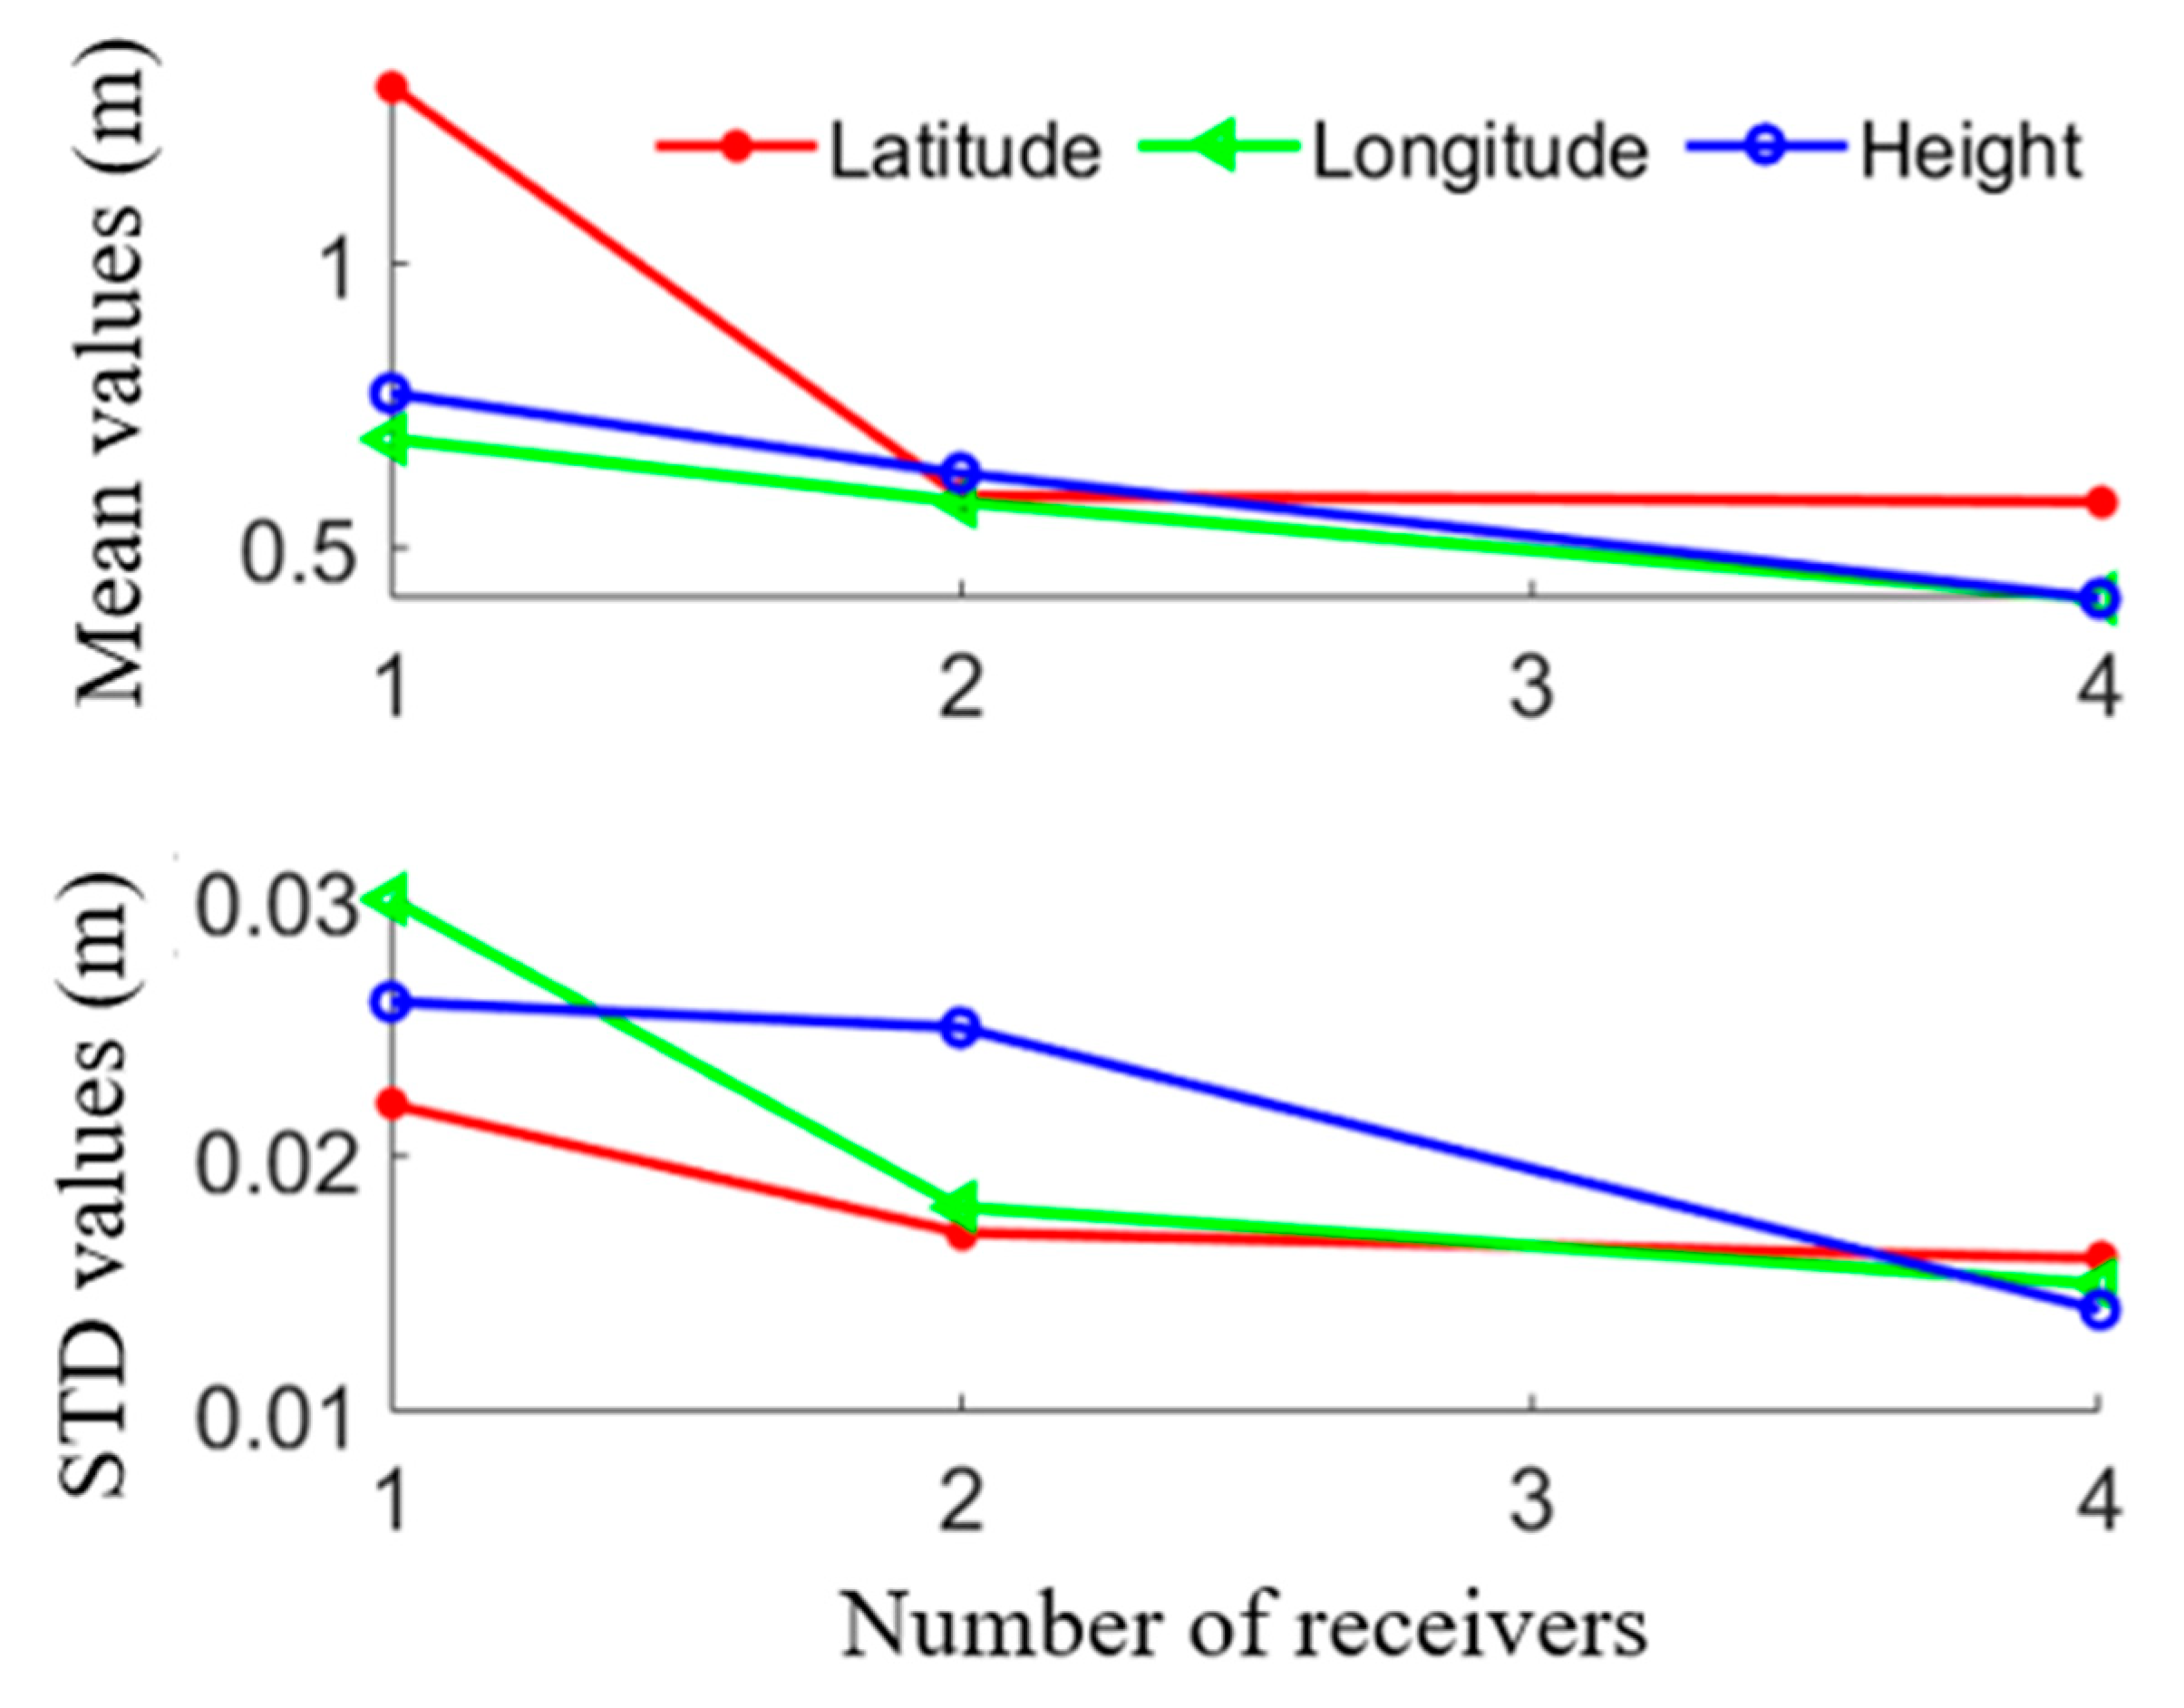
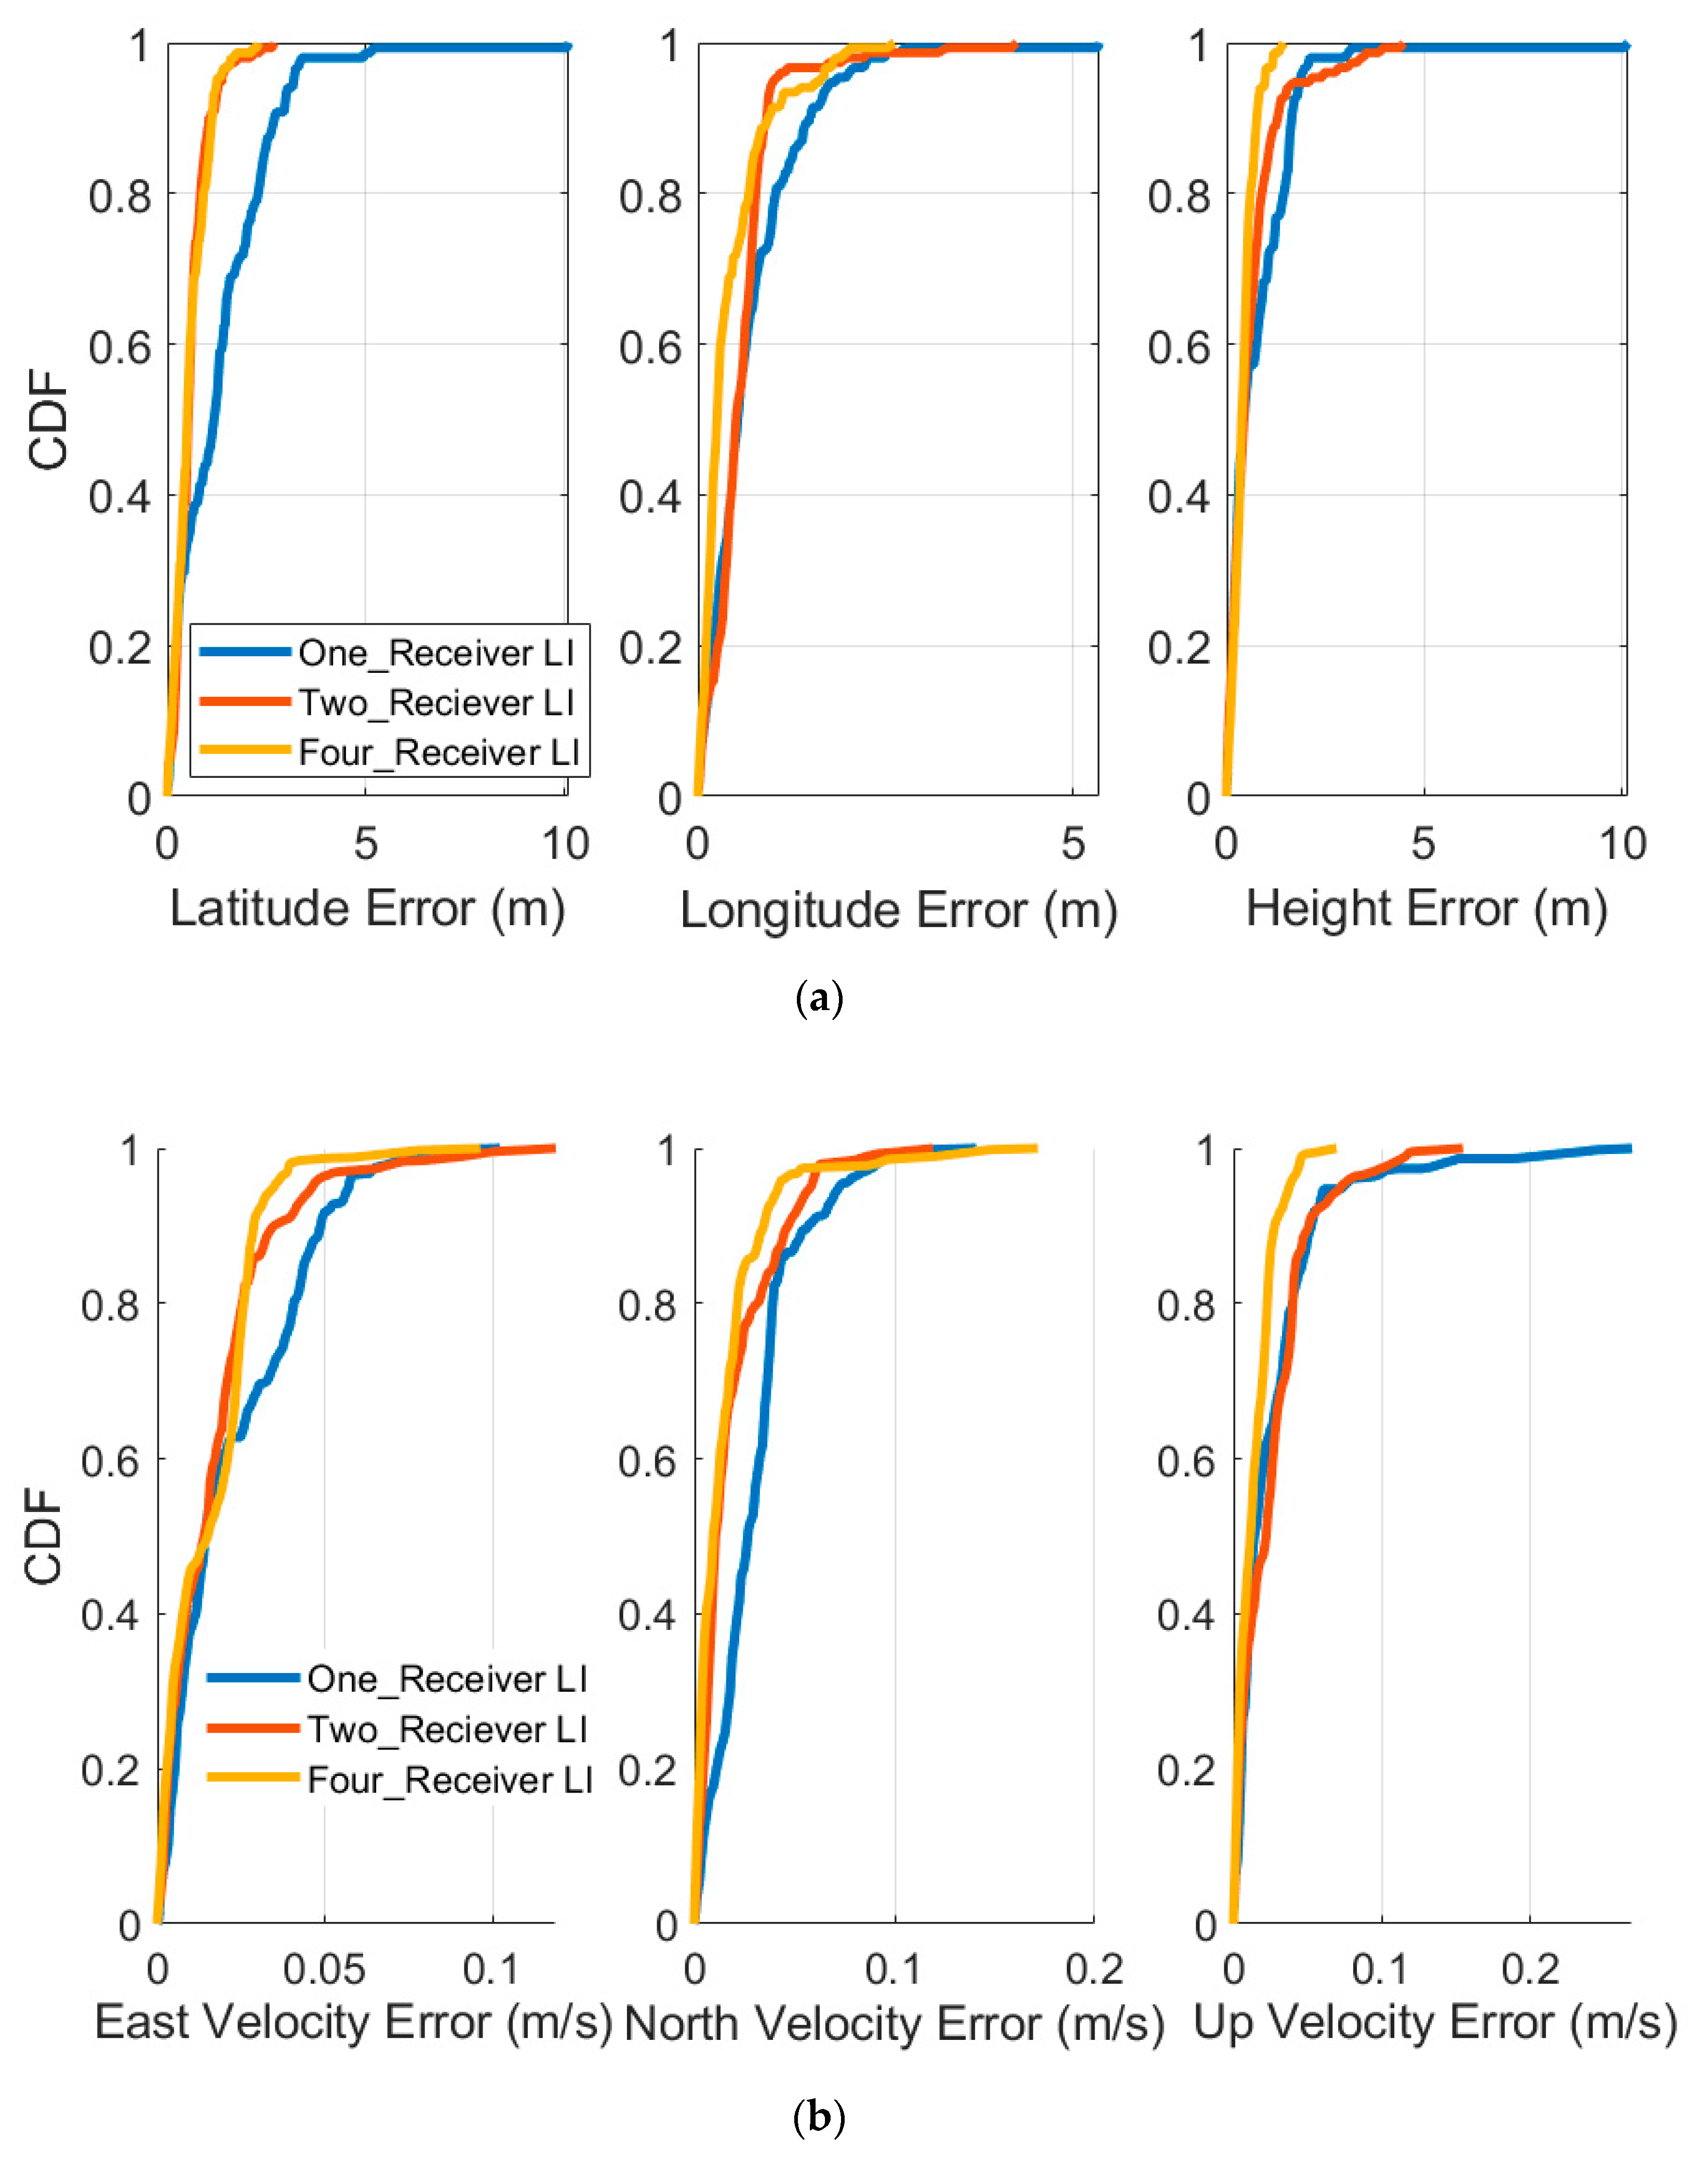
Figure 4 plots the comparison of the position and velocity errors among the single/two/four-receiver-based LI. Figure 4a–c presents the latitude, longitude, and height errors, and the east, north, and up velocity errors curves are shown in Figure 4d–f, respectively. In Figure 4, the red line refers to results from the single-receiver based LI, the blue line refers to the two-receiver based LI, and the green line represents the position and velocity errors of the three-receiver based LI. It can be seen that the position and velocity errors deceased with the increasing amount of receivers employed in the LI system. Table 3 lists the statistical analysis results of the positioning and velocity errors. Compared with the one-receiver based LI system, the mean values of the two-receiver LI errors decreased by 54.9%, 15.9%, 18.2%, respectively. Moreover, compared with that from two-receiver LI, the mean values of the four-receiver LI position errors decreased by 1.7%, 29.3%, and 34.9%, respectively. The velocity errors also improved according to the statistical analysis results listed in Table 5. Mean and STD (standard deviation) values are presented in Figure 5; it can be observed that the mean and STD values of the position both decreased with the number of receivers increasing. Figure 6 presents the CDF (cumulative distribution function) of these position and velocity errors. It is obvious that these errors were distributed within a smaller scope as the number of receivers increased.

3.1.3. DIF vs. CIF

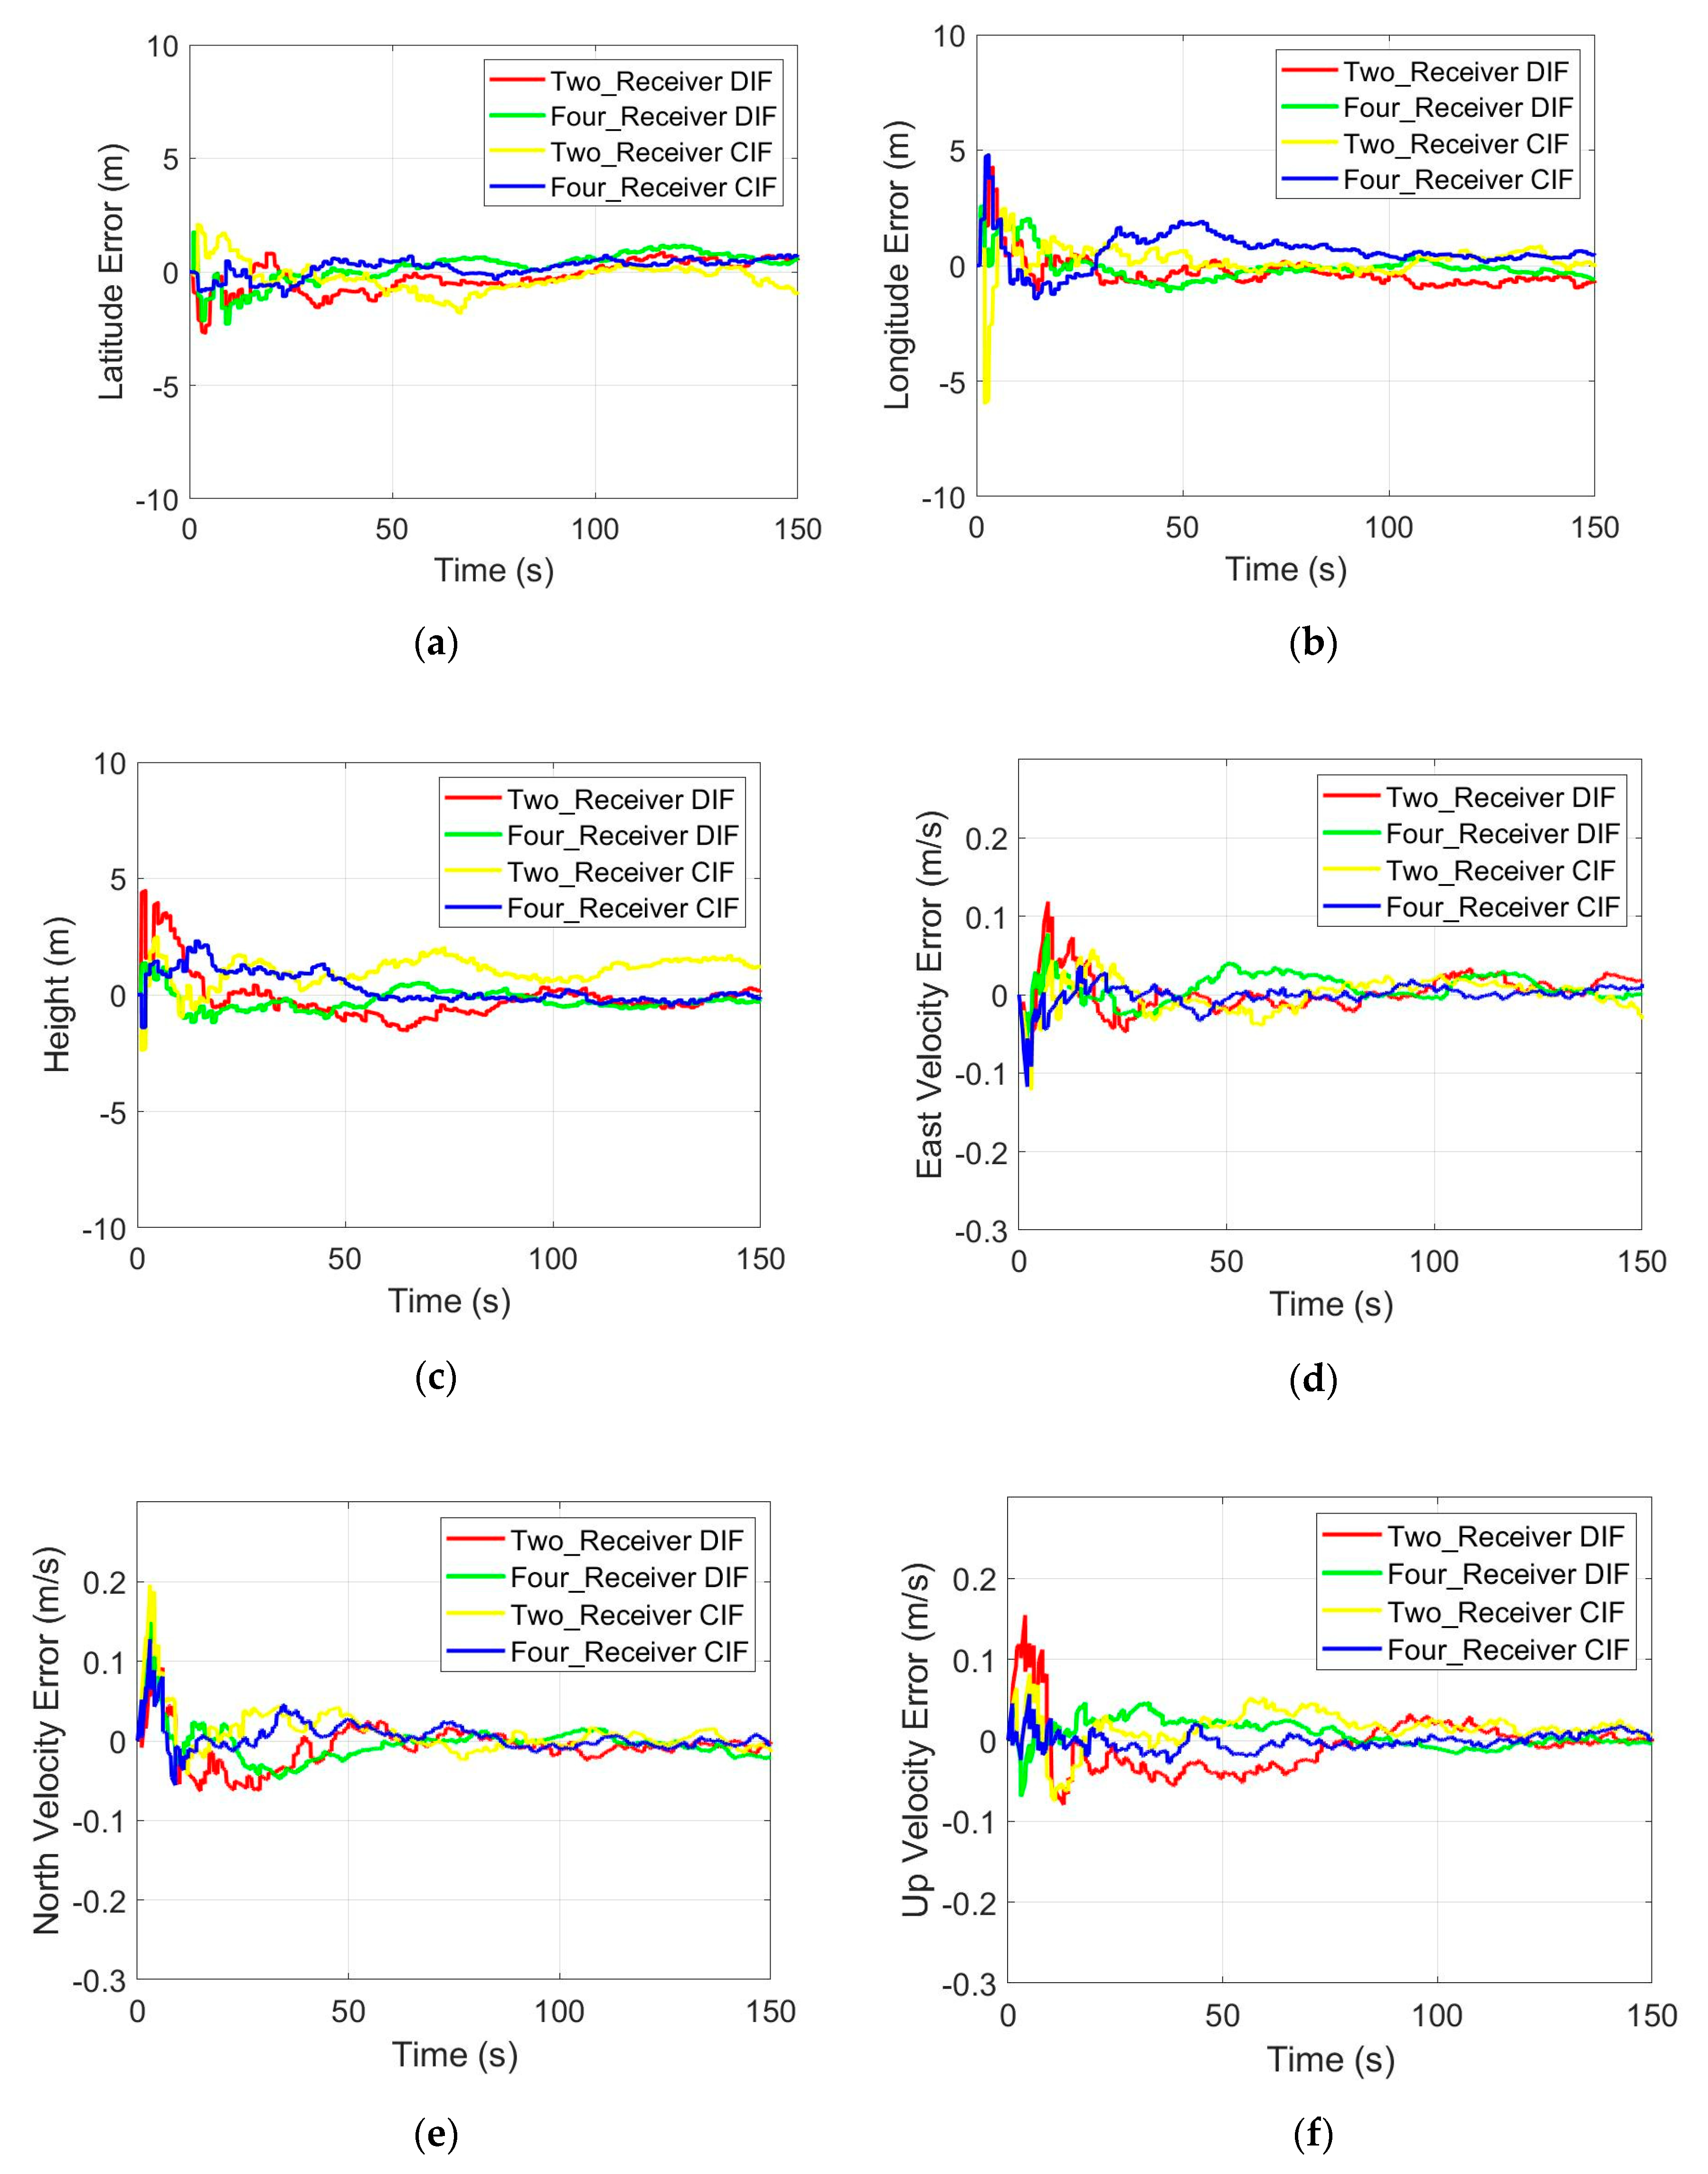
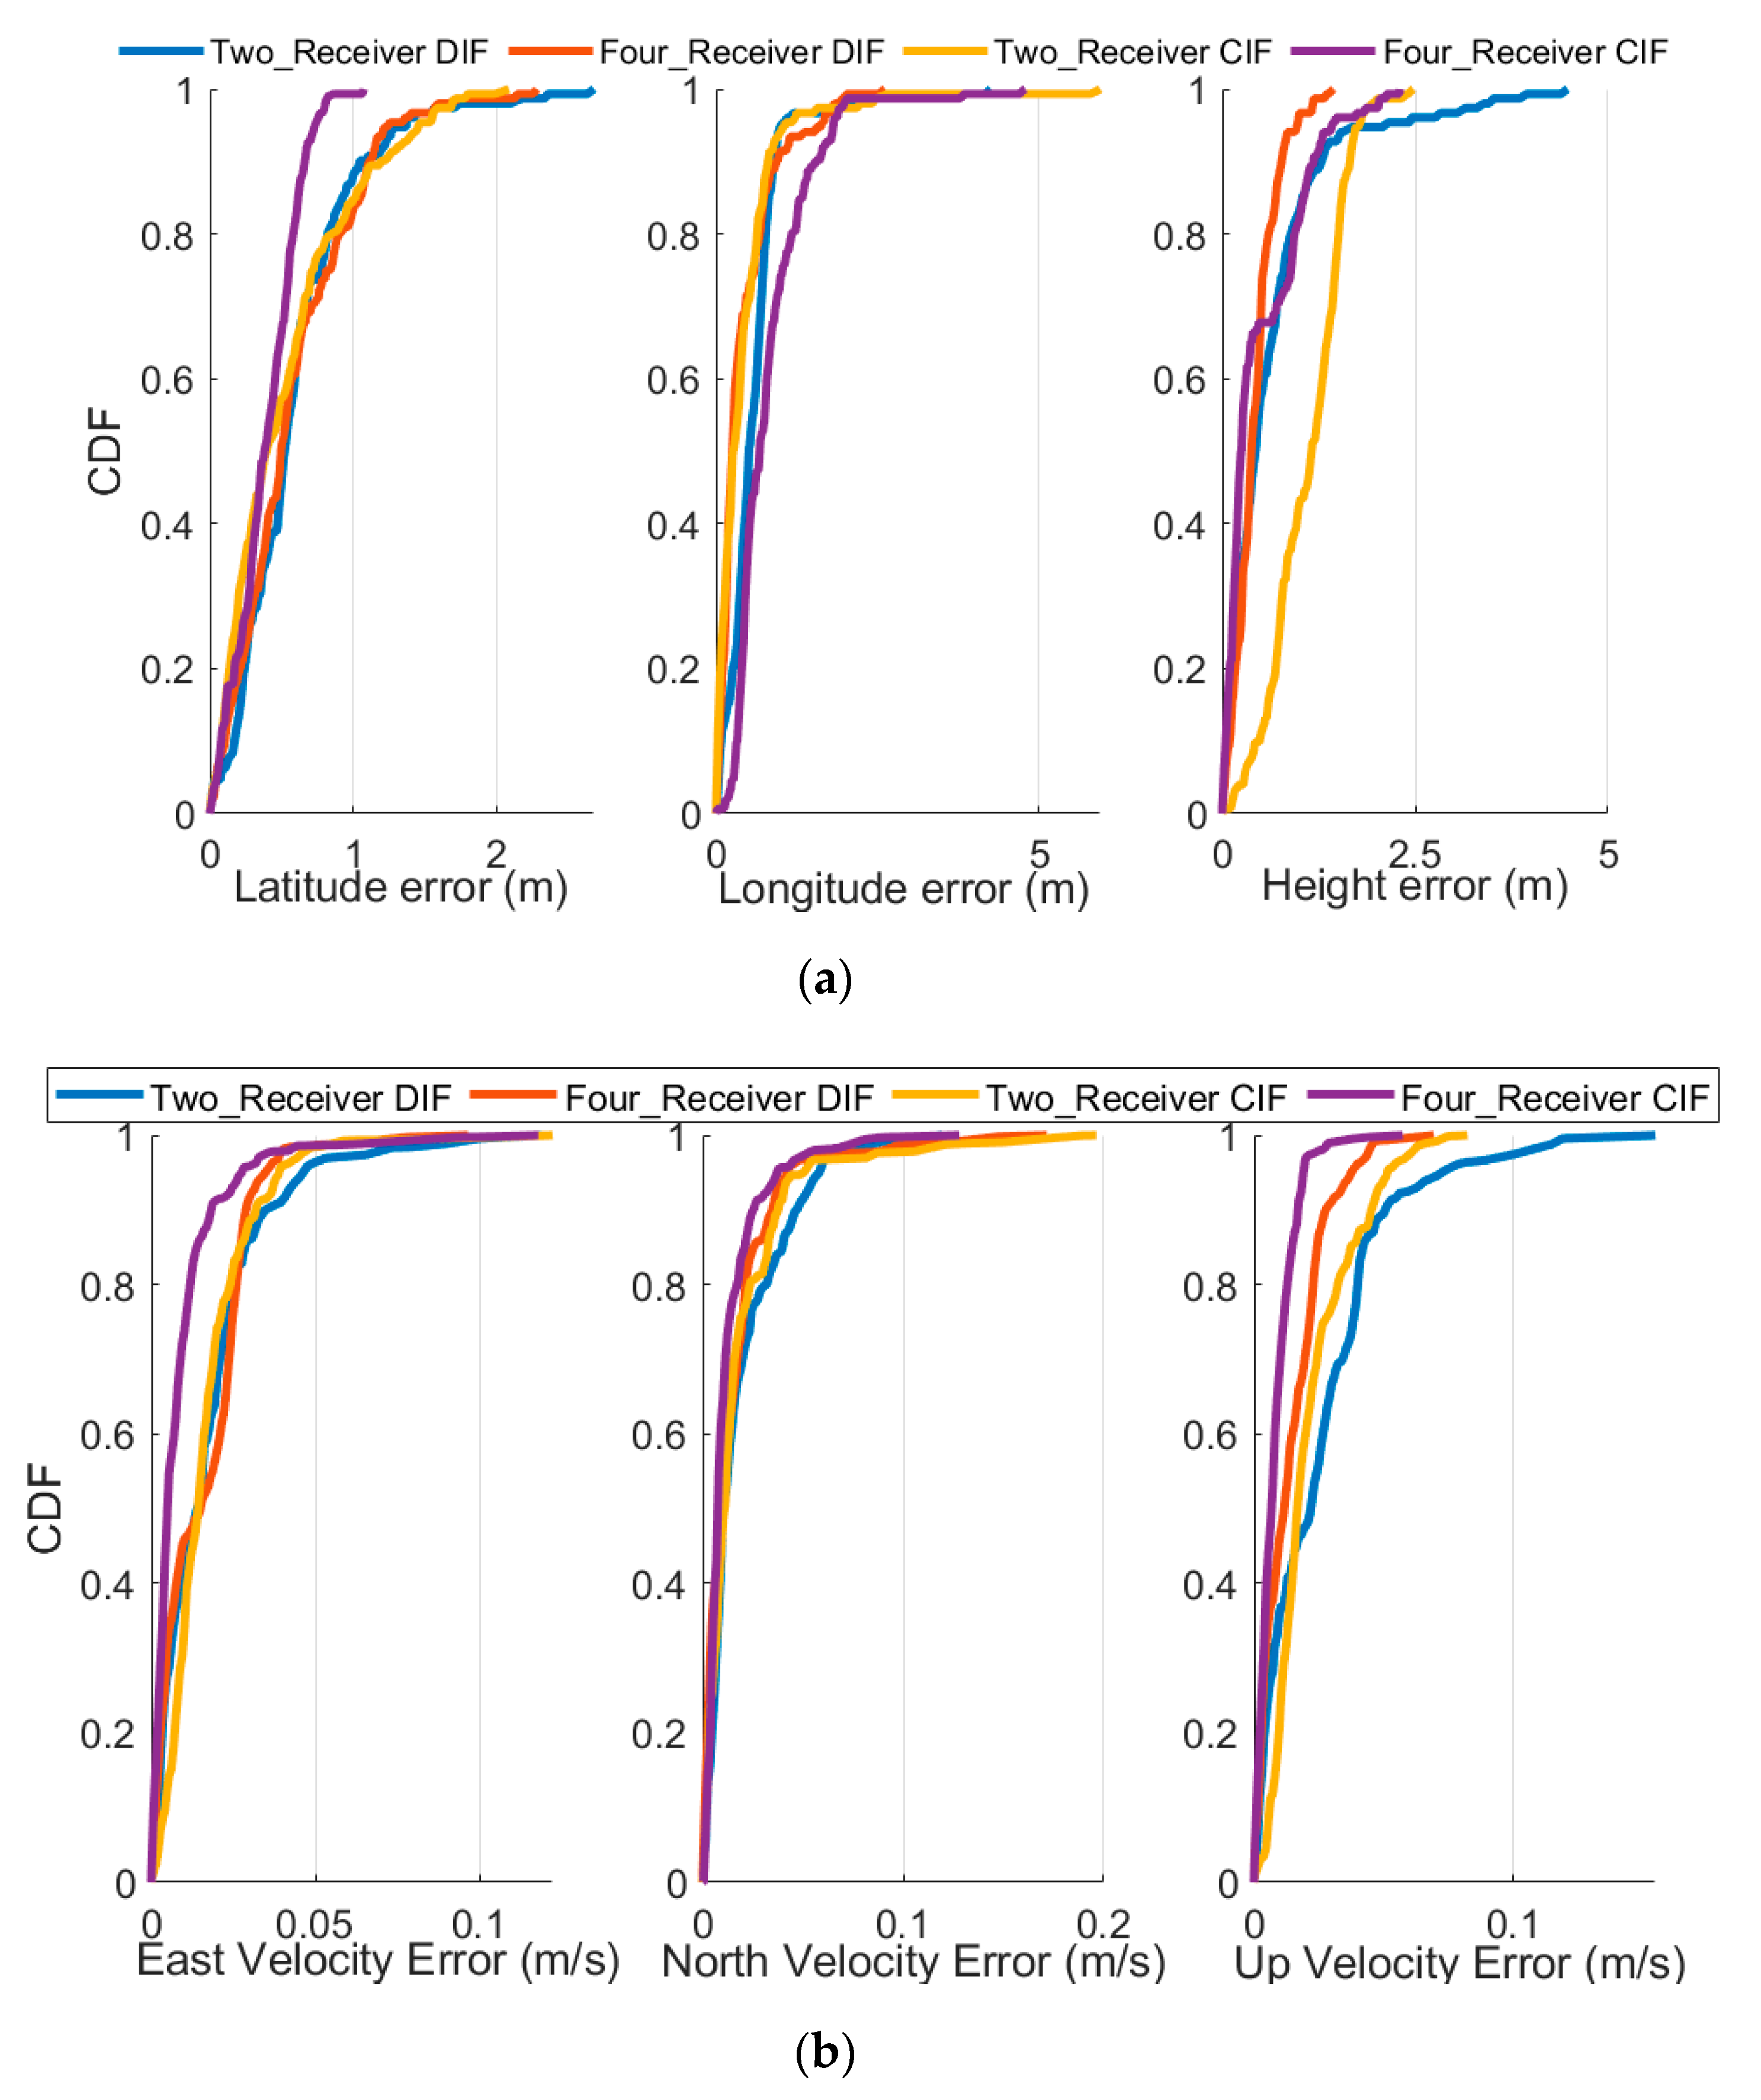
The comparison of DIF and CIF position and velocity errors are presented in Figure 7 and the statistical analysis results of the DIF are listed in Table 6. With the composition results, we can observe that:
(1)
In the DIF, the position and velocity errors also decreased with the amount of receivers increasing; compared with the two-receiver LI, the mean values of these position errors from the four-receiver LI decreased by 26.4%, 48.7%, and 55.5% respectively, and the corresponding velocity errors decreased by 43.8%, 29.4%, and 61.9%, respectively, in terms of the mean values. The STD values of the position and velocity errors also obtained different degrades of reduction with four receivers employed in the DIF method.
(2)
Statistical results (mean and the STD values) from the DIF and CIF were similar, with all the differences smaller than 20%; the CDF curves of these positions and the velocity errors presented in Figure 8 also support this point.

3.2. Field Test

3.2.1. Experiments Settings

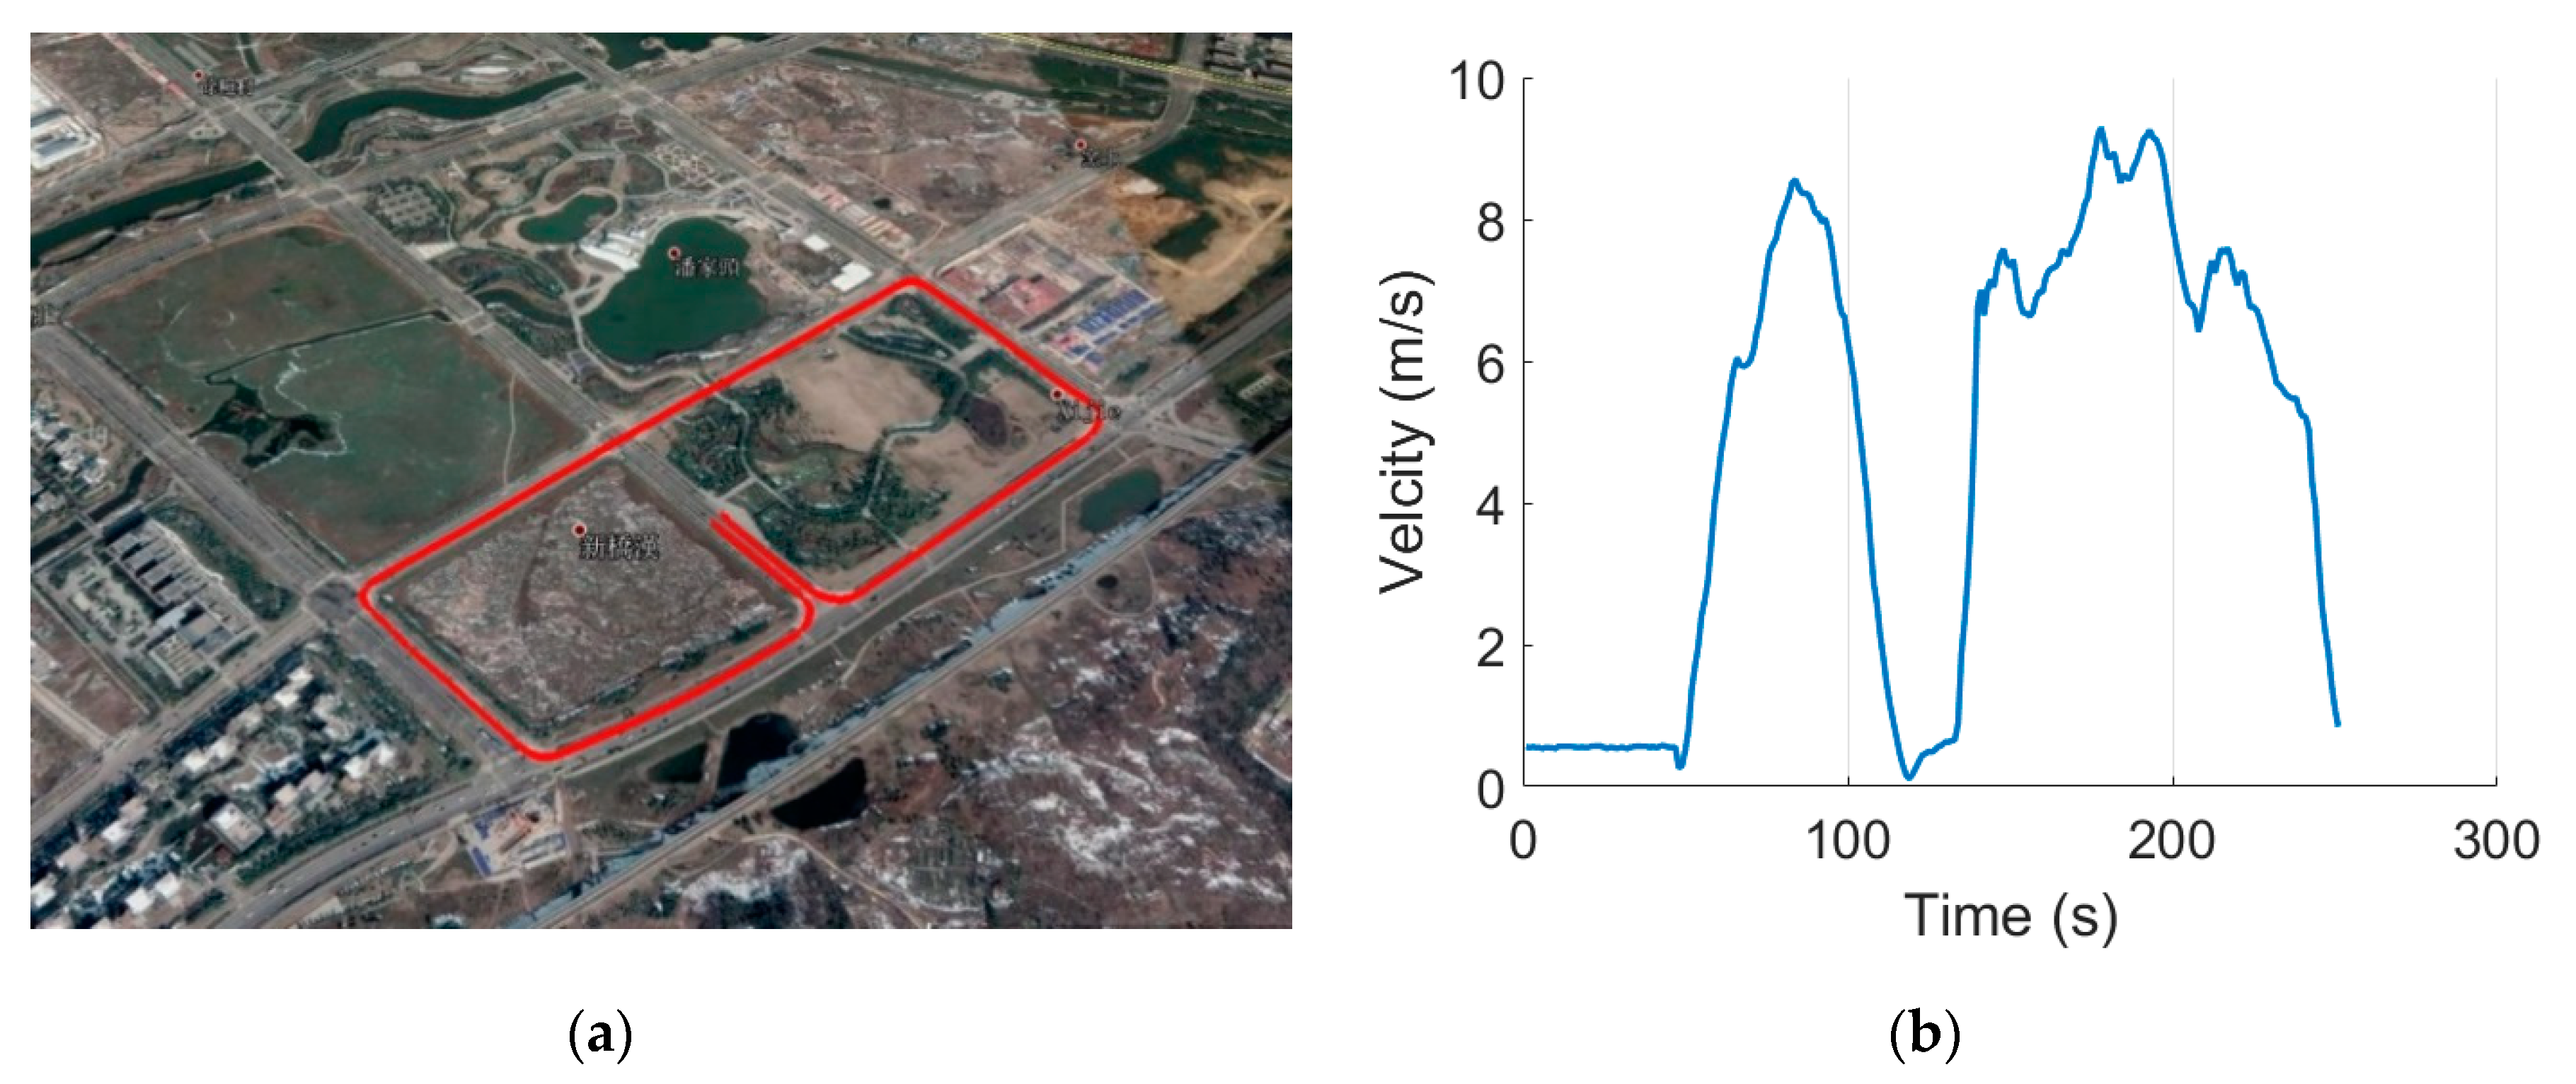
For further validating the effectiveness of the proposed method, a field test was conducted. A MEMS IMU (MSI3200, Micro-Star International, Zhonghe, New Taipei, Taiwan) and multiple UBLOX GNSS (NEO-M8N, U-blox, Thalwil, Switzerland) receivers were employed to construct the LI system. The antennas of these receivers were put together on the roof of a car. The GNSS measurements and IMU dataset were collected for post-processing with the software developed in Matlab. Table 7 lists the specifications of the IMU. The trajectory is presented in Figure 9a and the velocity curves are presented in Figure 9b. The time length of the testing was approximately 250 s.

3.2.2. Results and Analysis

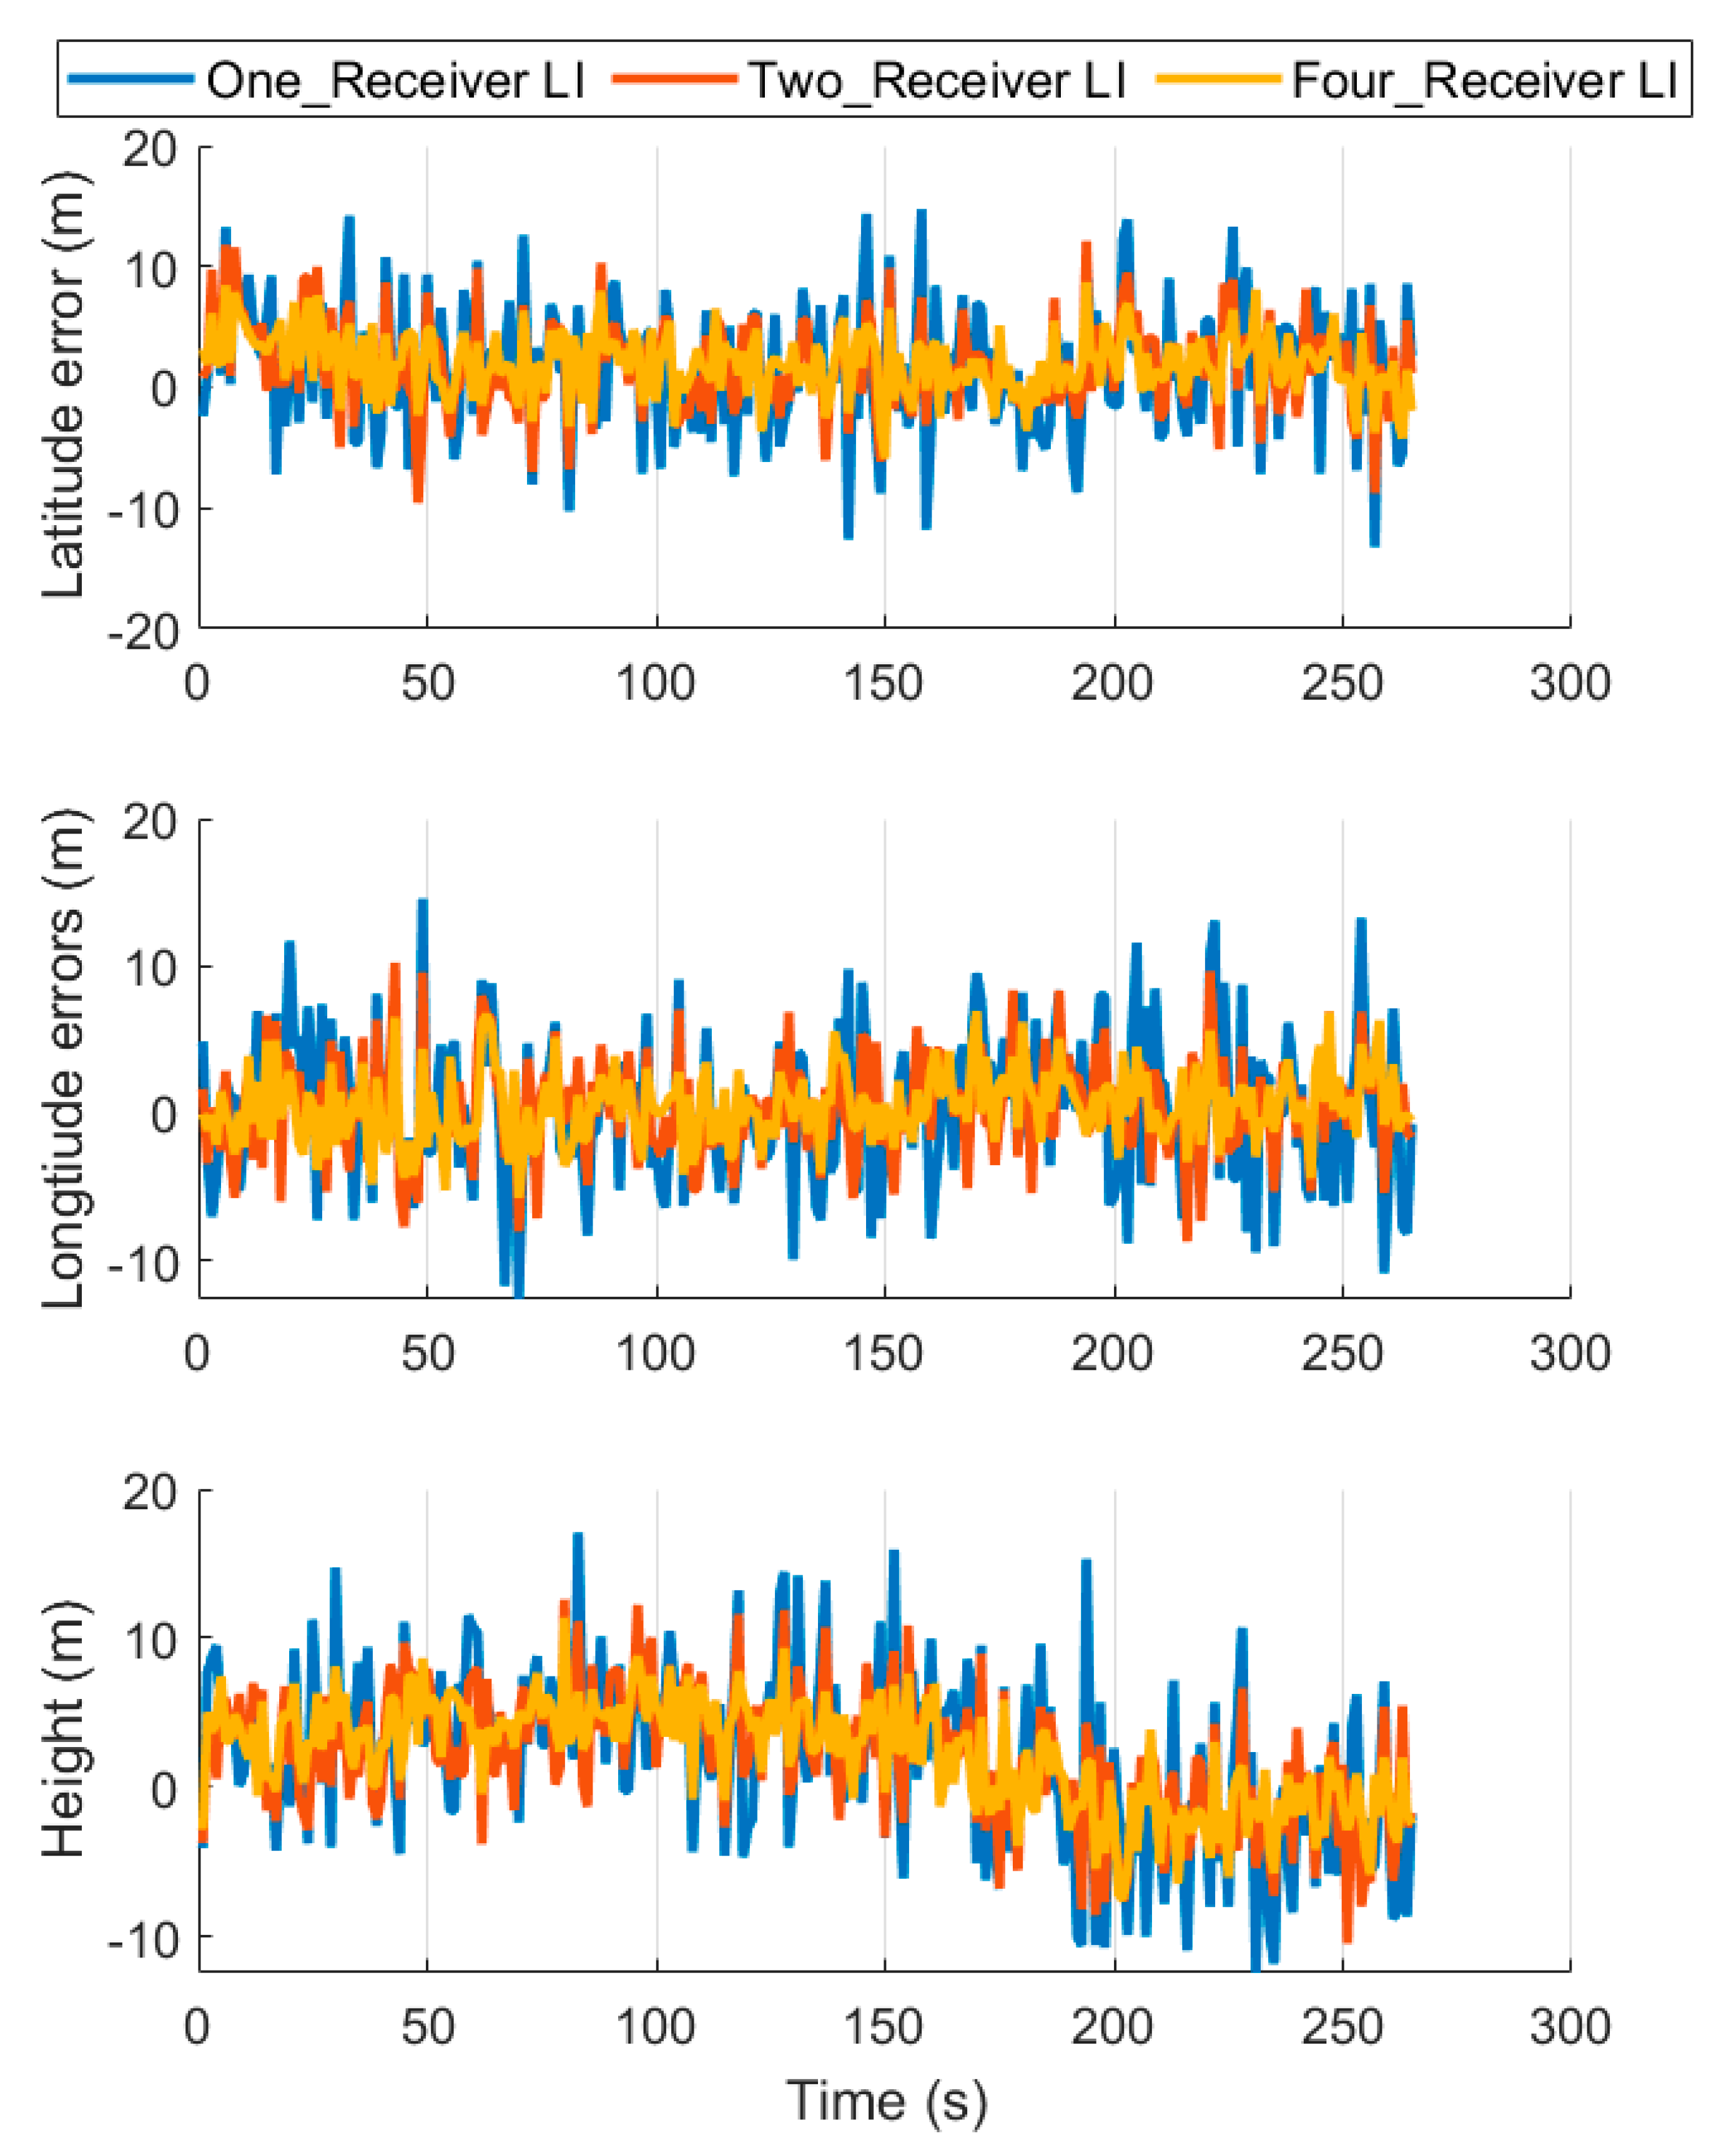
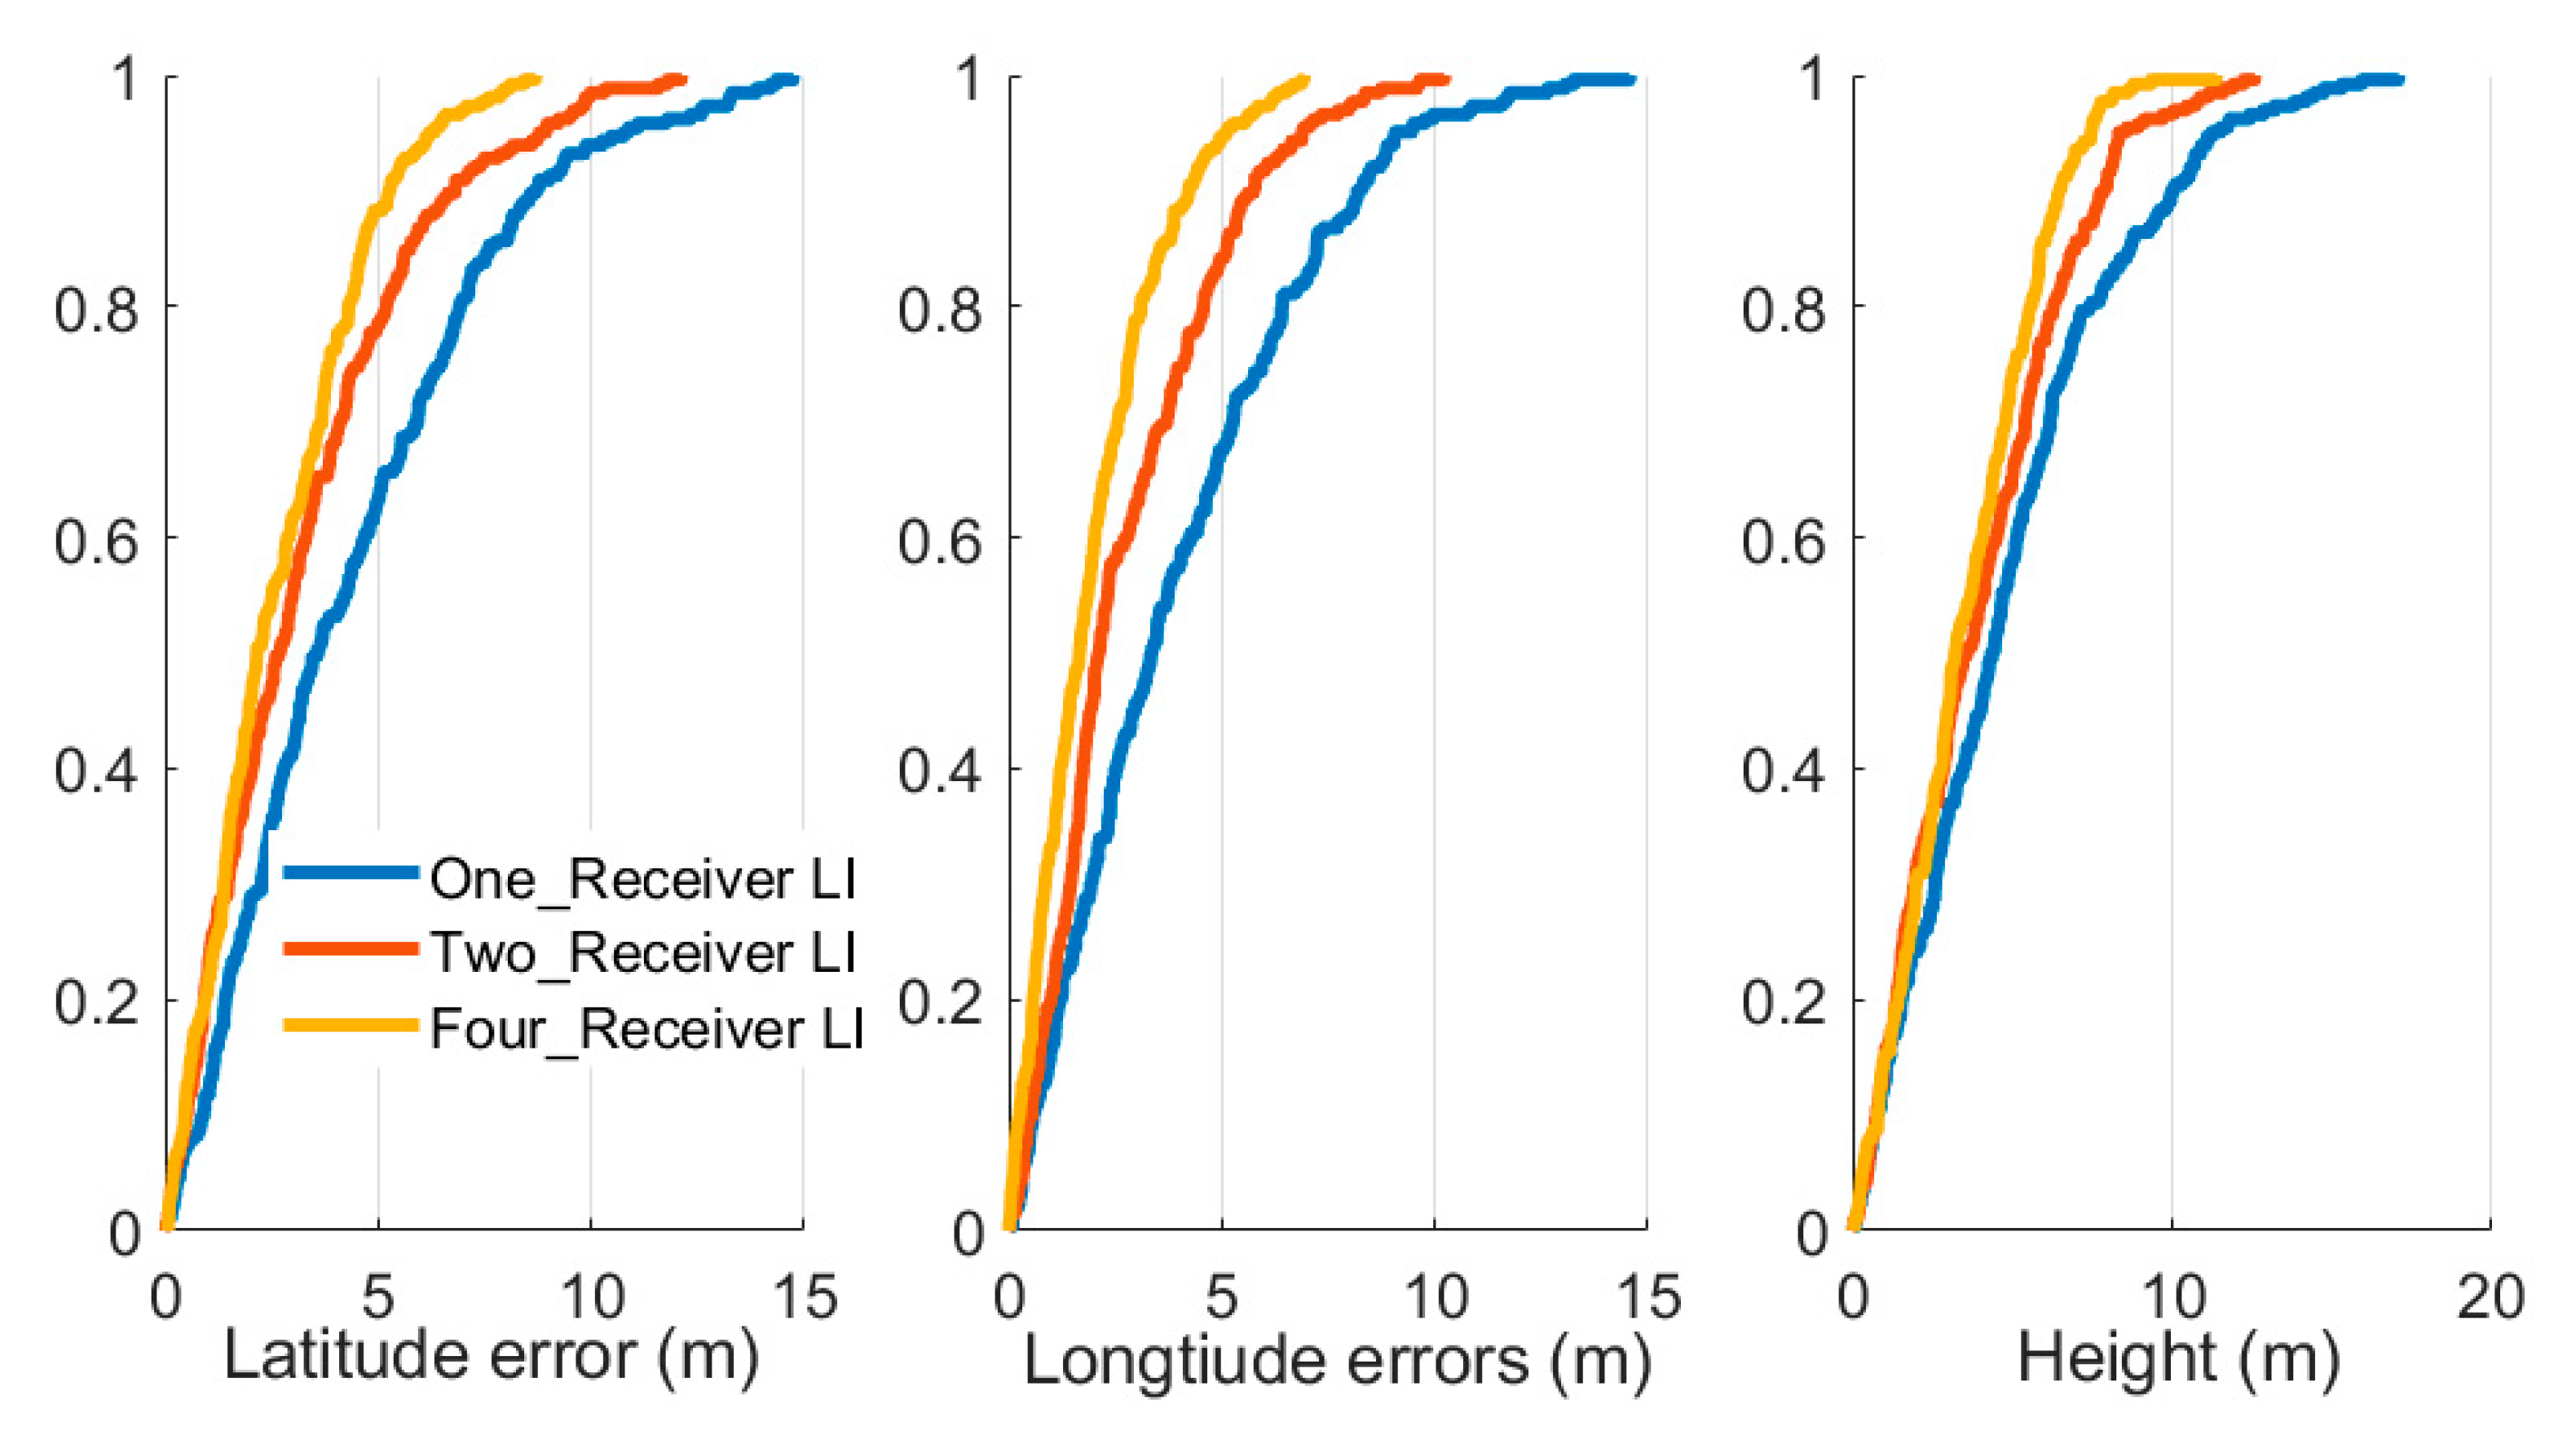
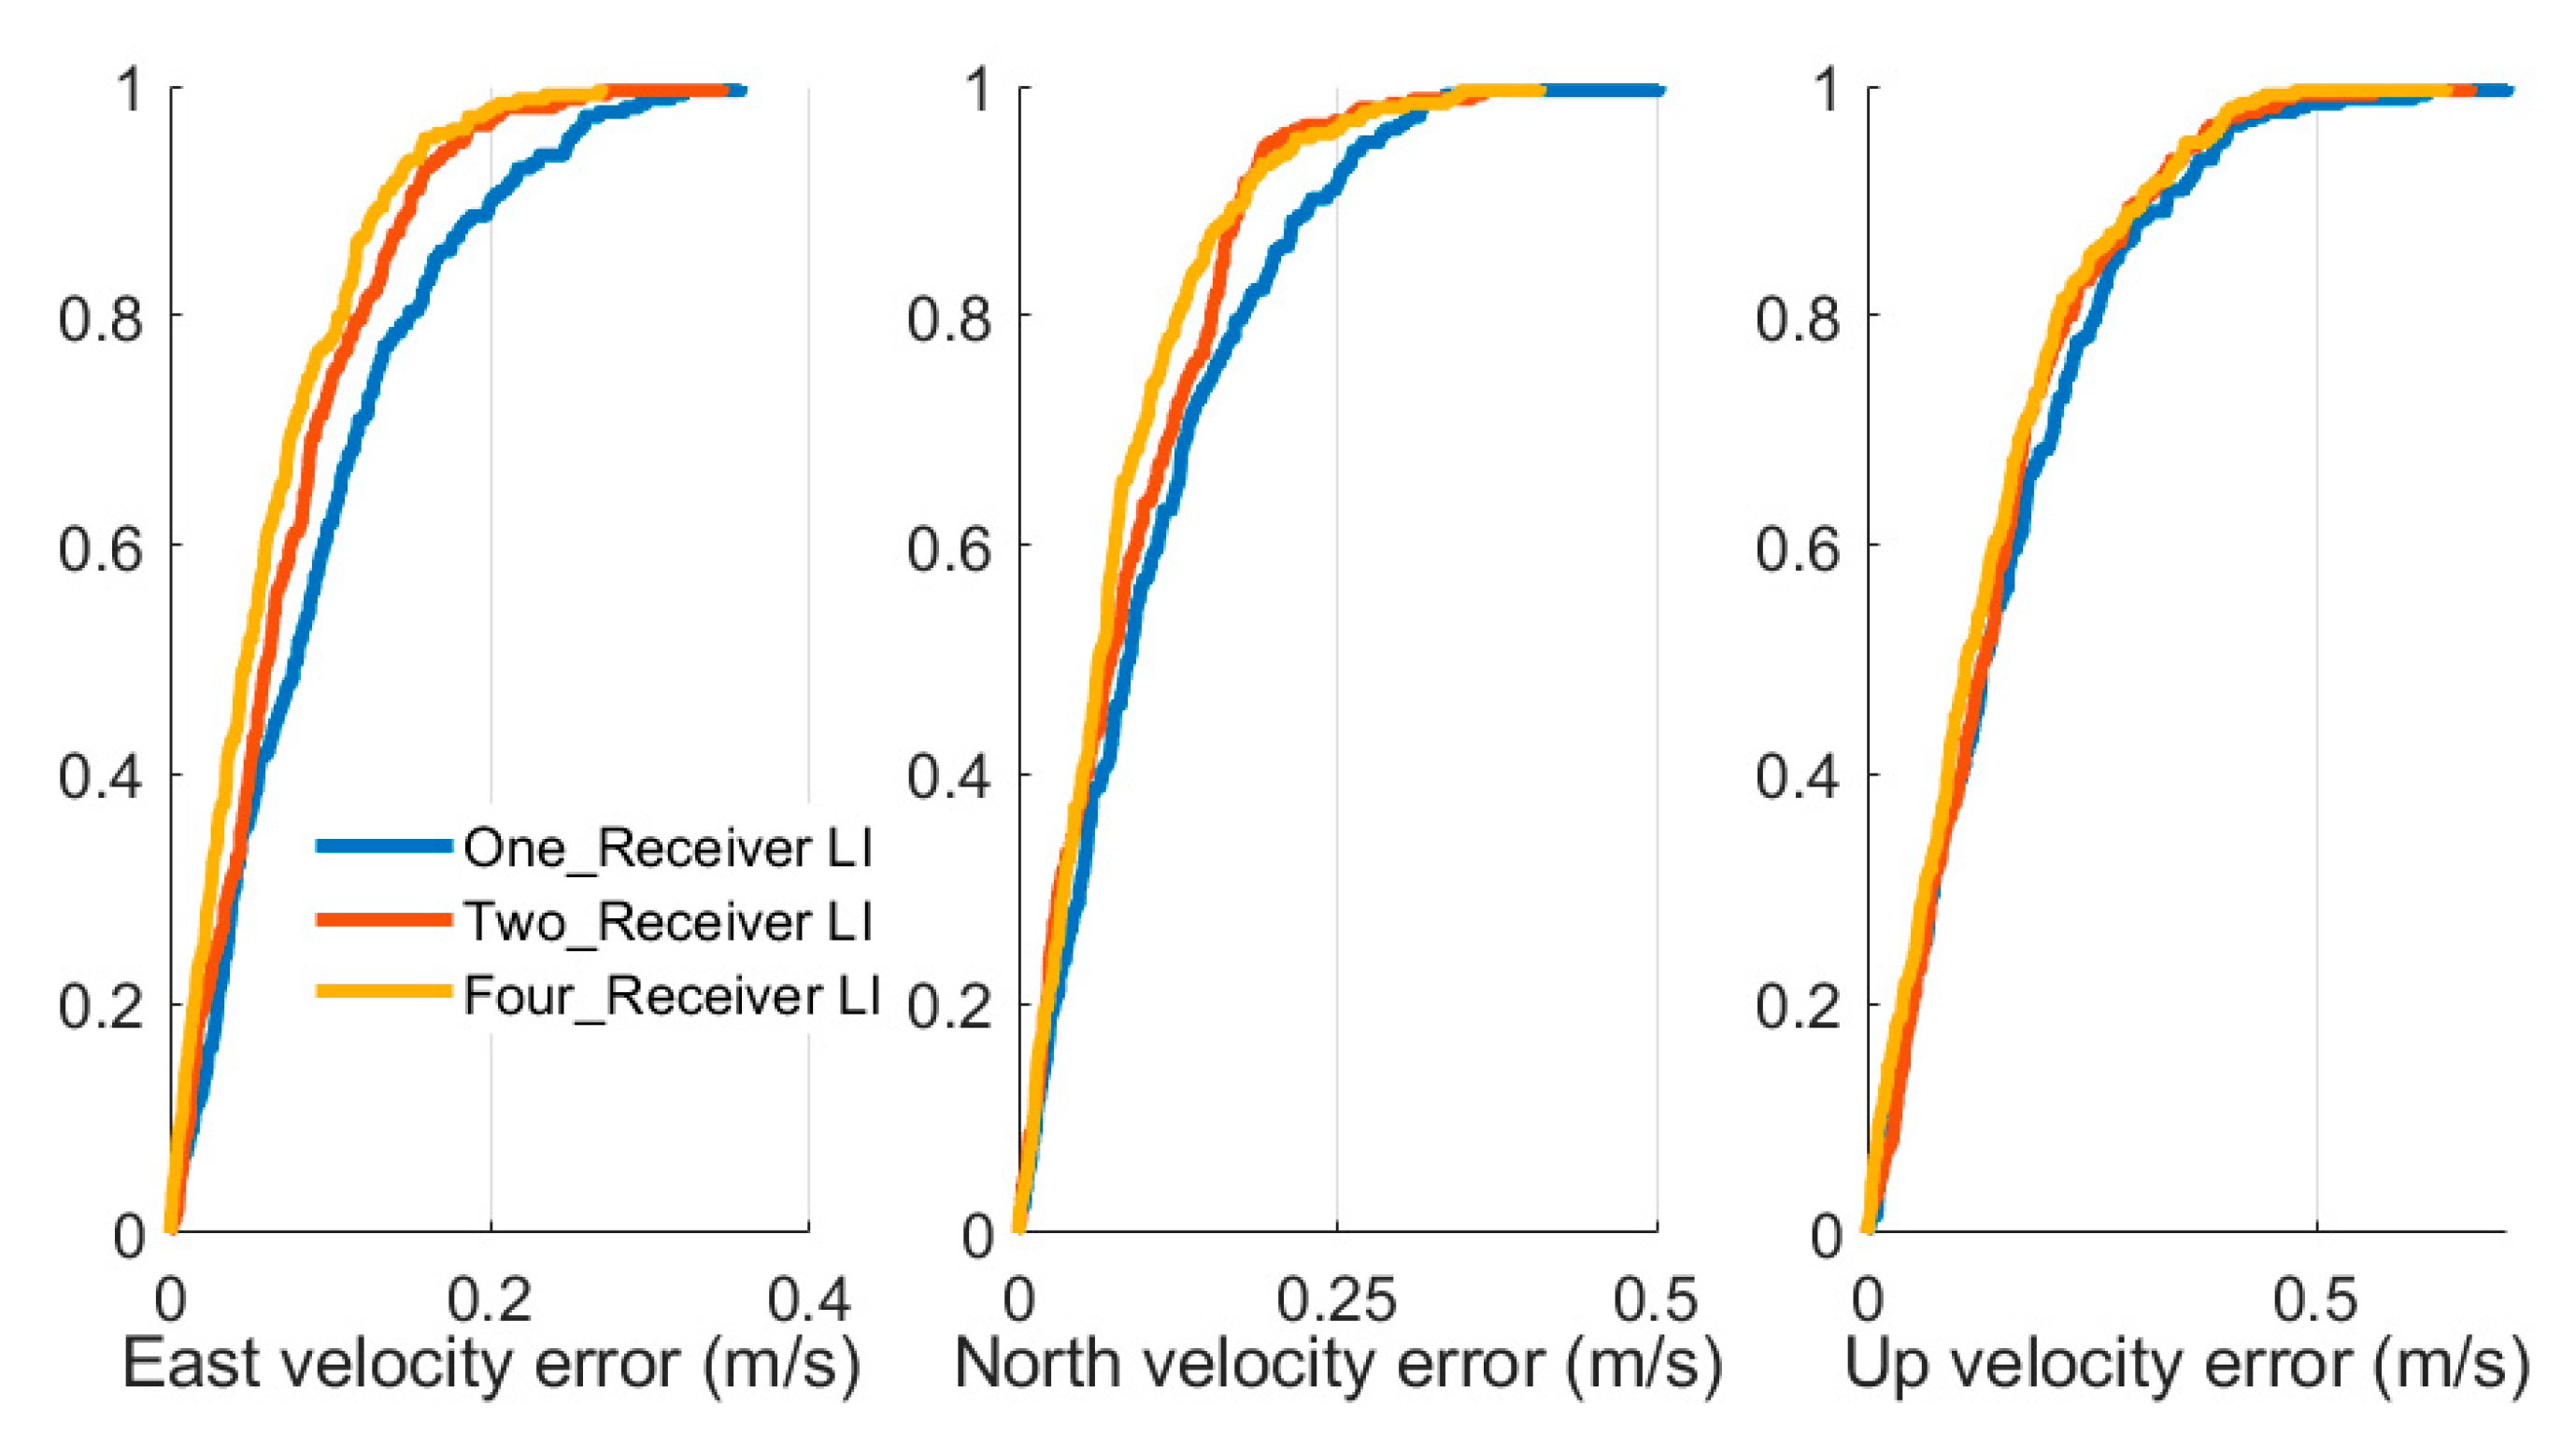
Figure 10 presents the position errors from one-receiver, two-receiver, and four-receiver LI, and the CDF curves of these position errors are presented in Figure 11. It can be observed that:
(1)
The position errors curves were smoother with the increasing number of the receivers, and the position errors were also reduced when more receivers were employed in the LI system.
(2)
With the CDF curves presented in Figure 11, not only were the maximum values of the position errors reduced, the distributions of these errors were also compressed to a smaller range. In other words, the uncertainties contained in the position and velocity errors were reduced.
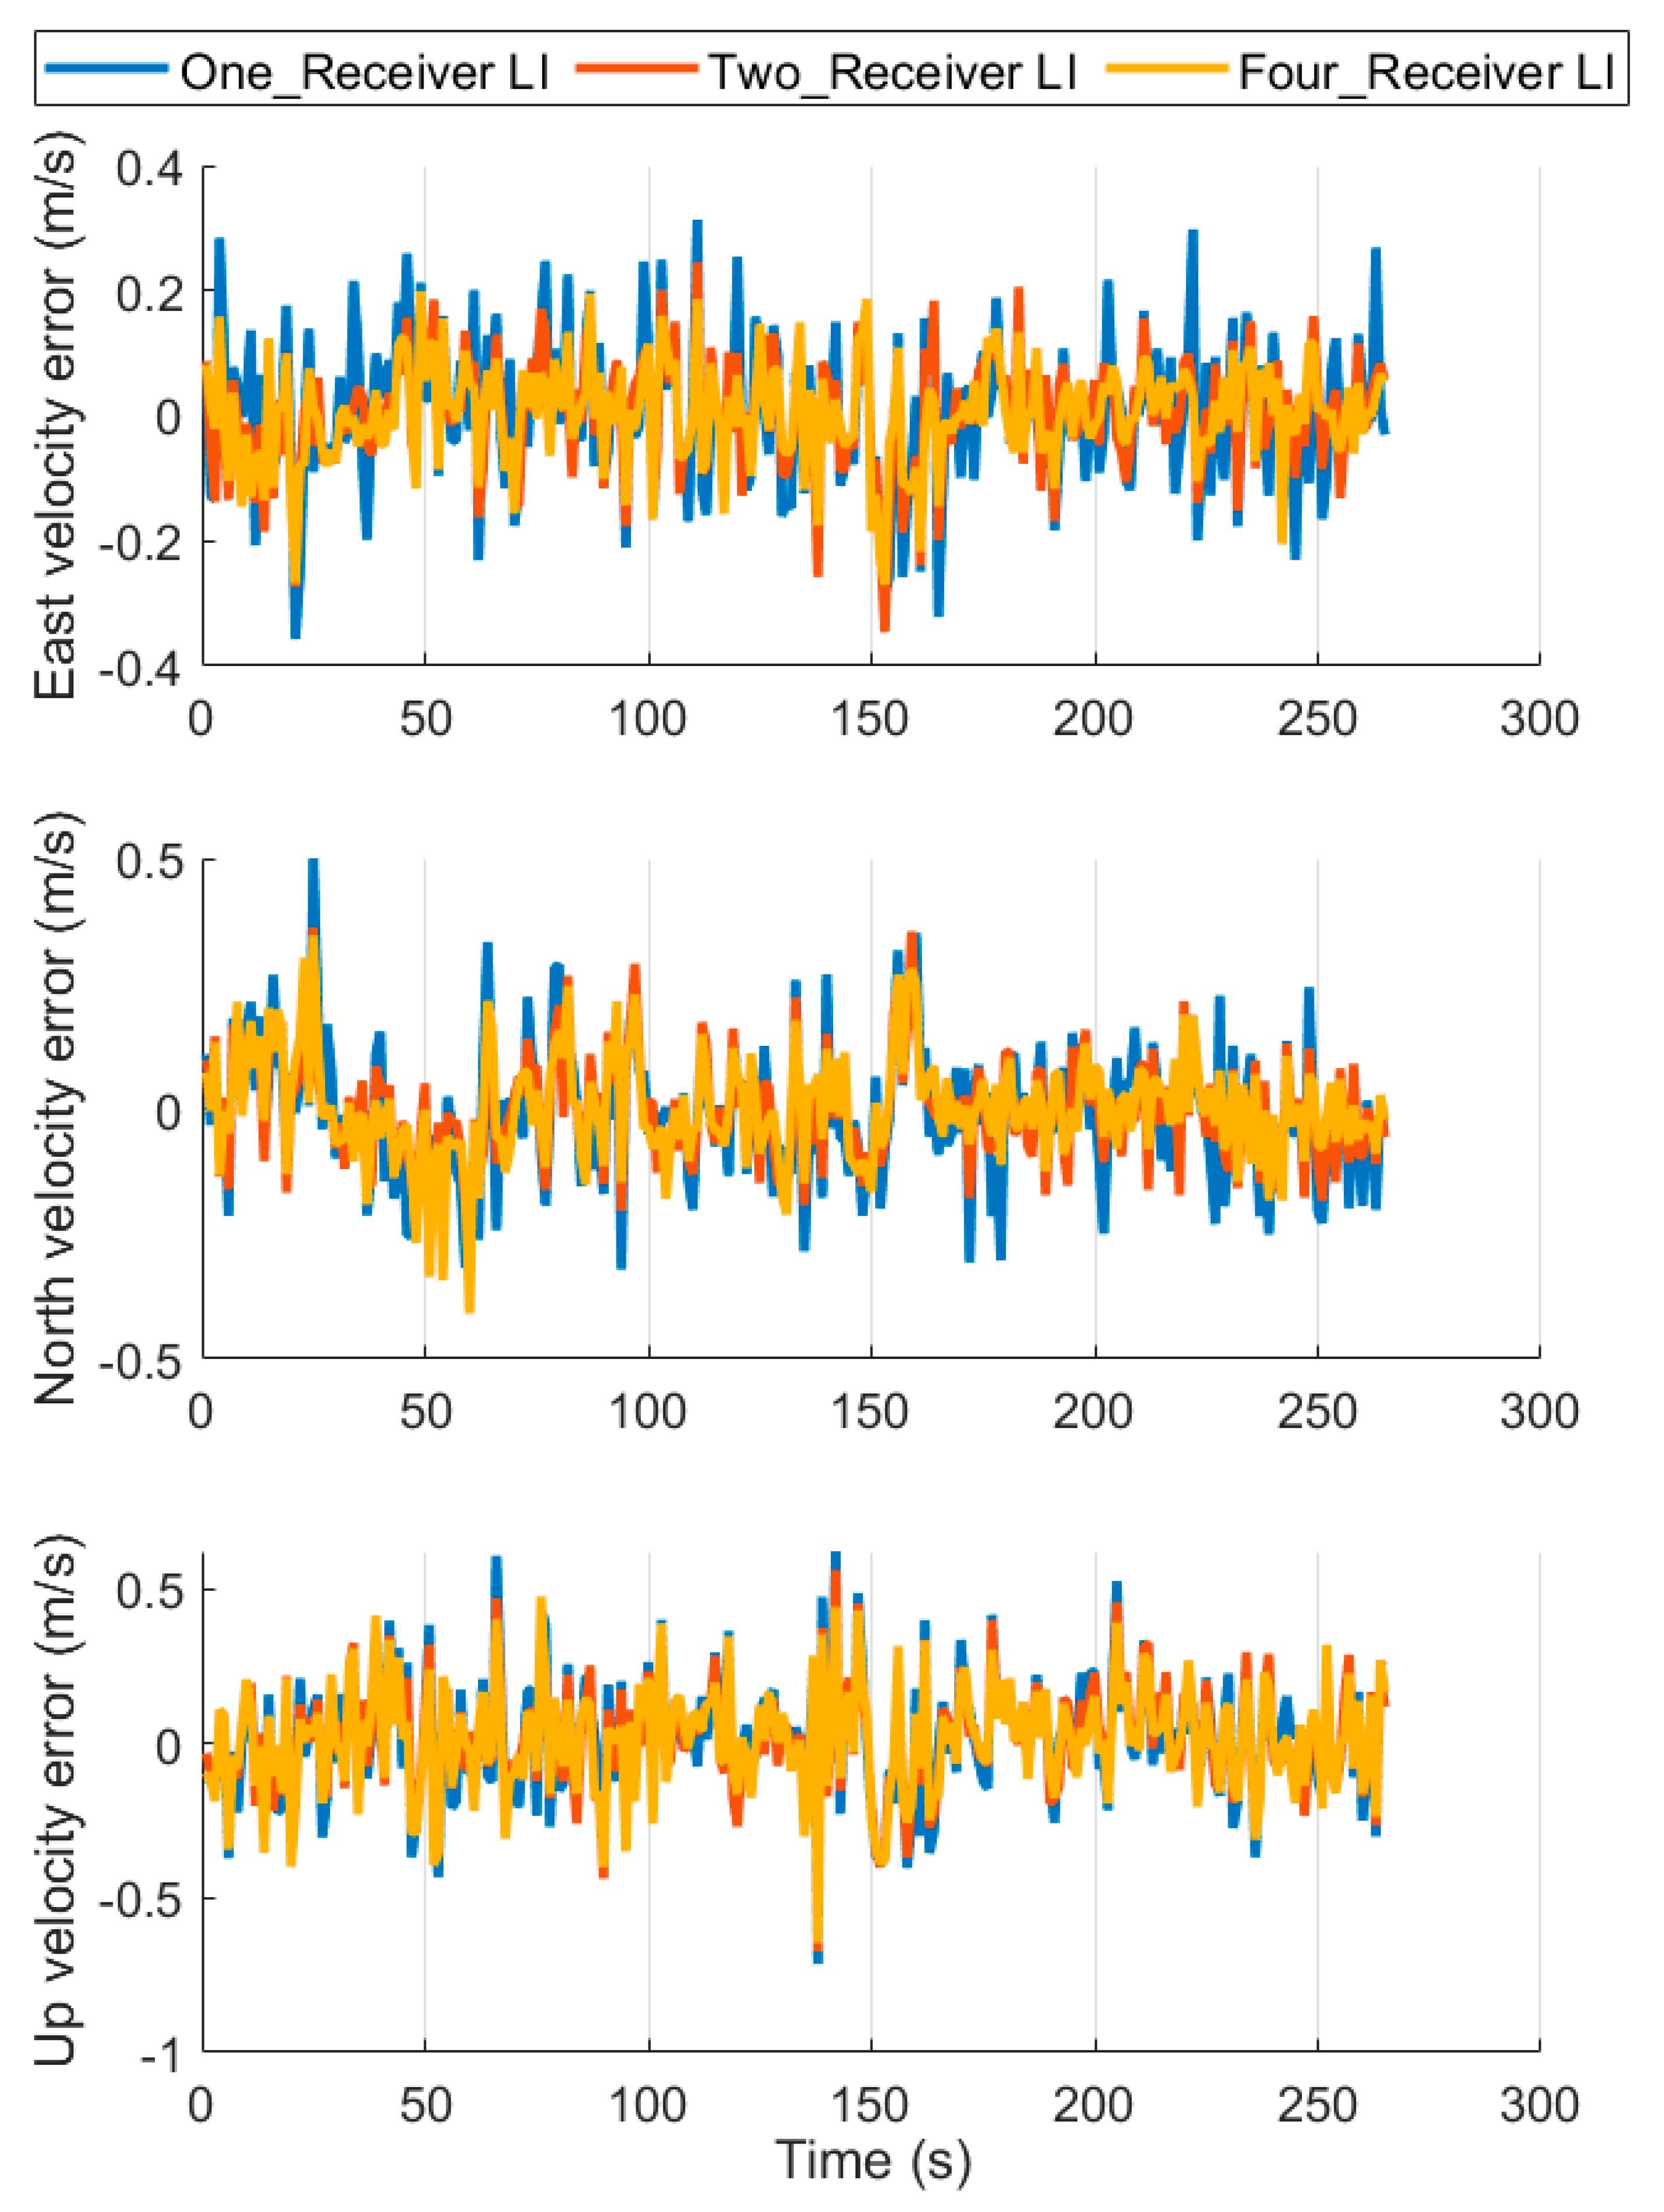
Furthermore, the mean values and STD values of these position errors are listed in Table 8. It can be observed that the mean values and STD values of these position errors decreased with the increasing number of the receivers. In addition, Figure 12 and Figure 13 present the velocity errors and the corresponding CDF curves. Similarly, the velocity errors also reduced with the increase in the number of receivers. The mean values and the STD values are also listed in Table 9.
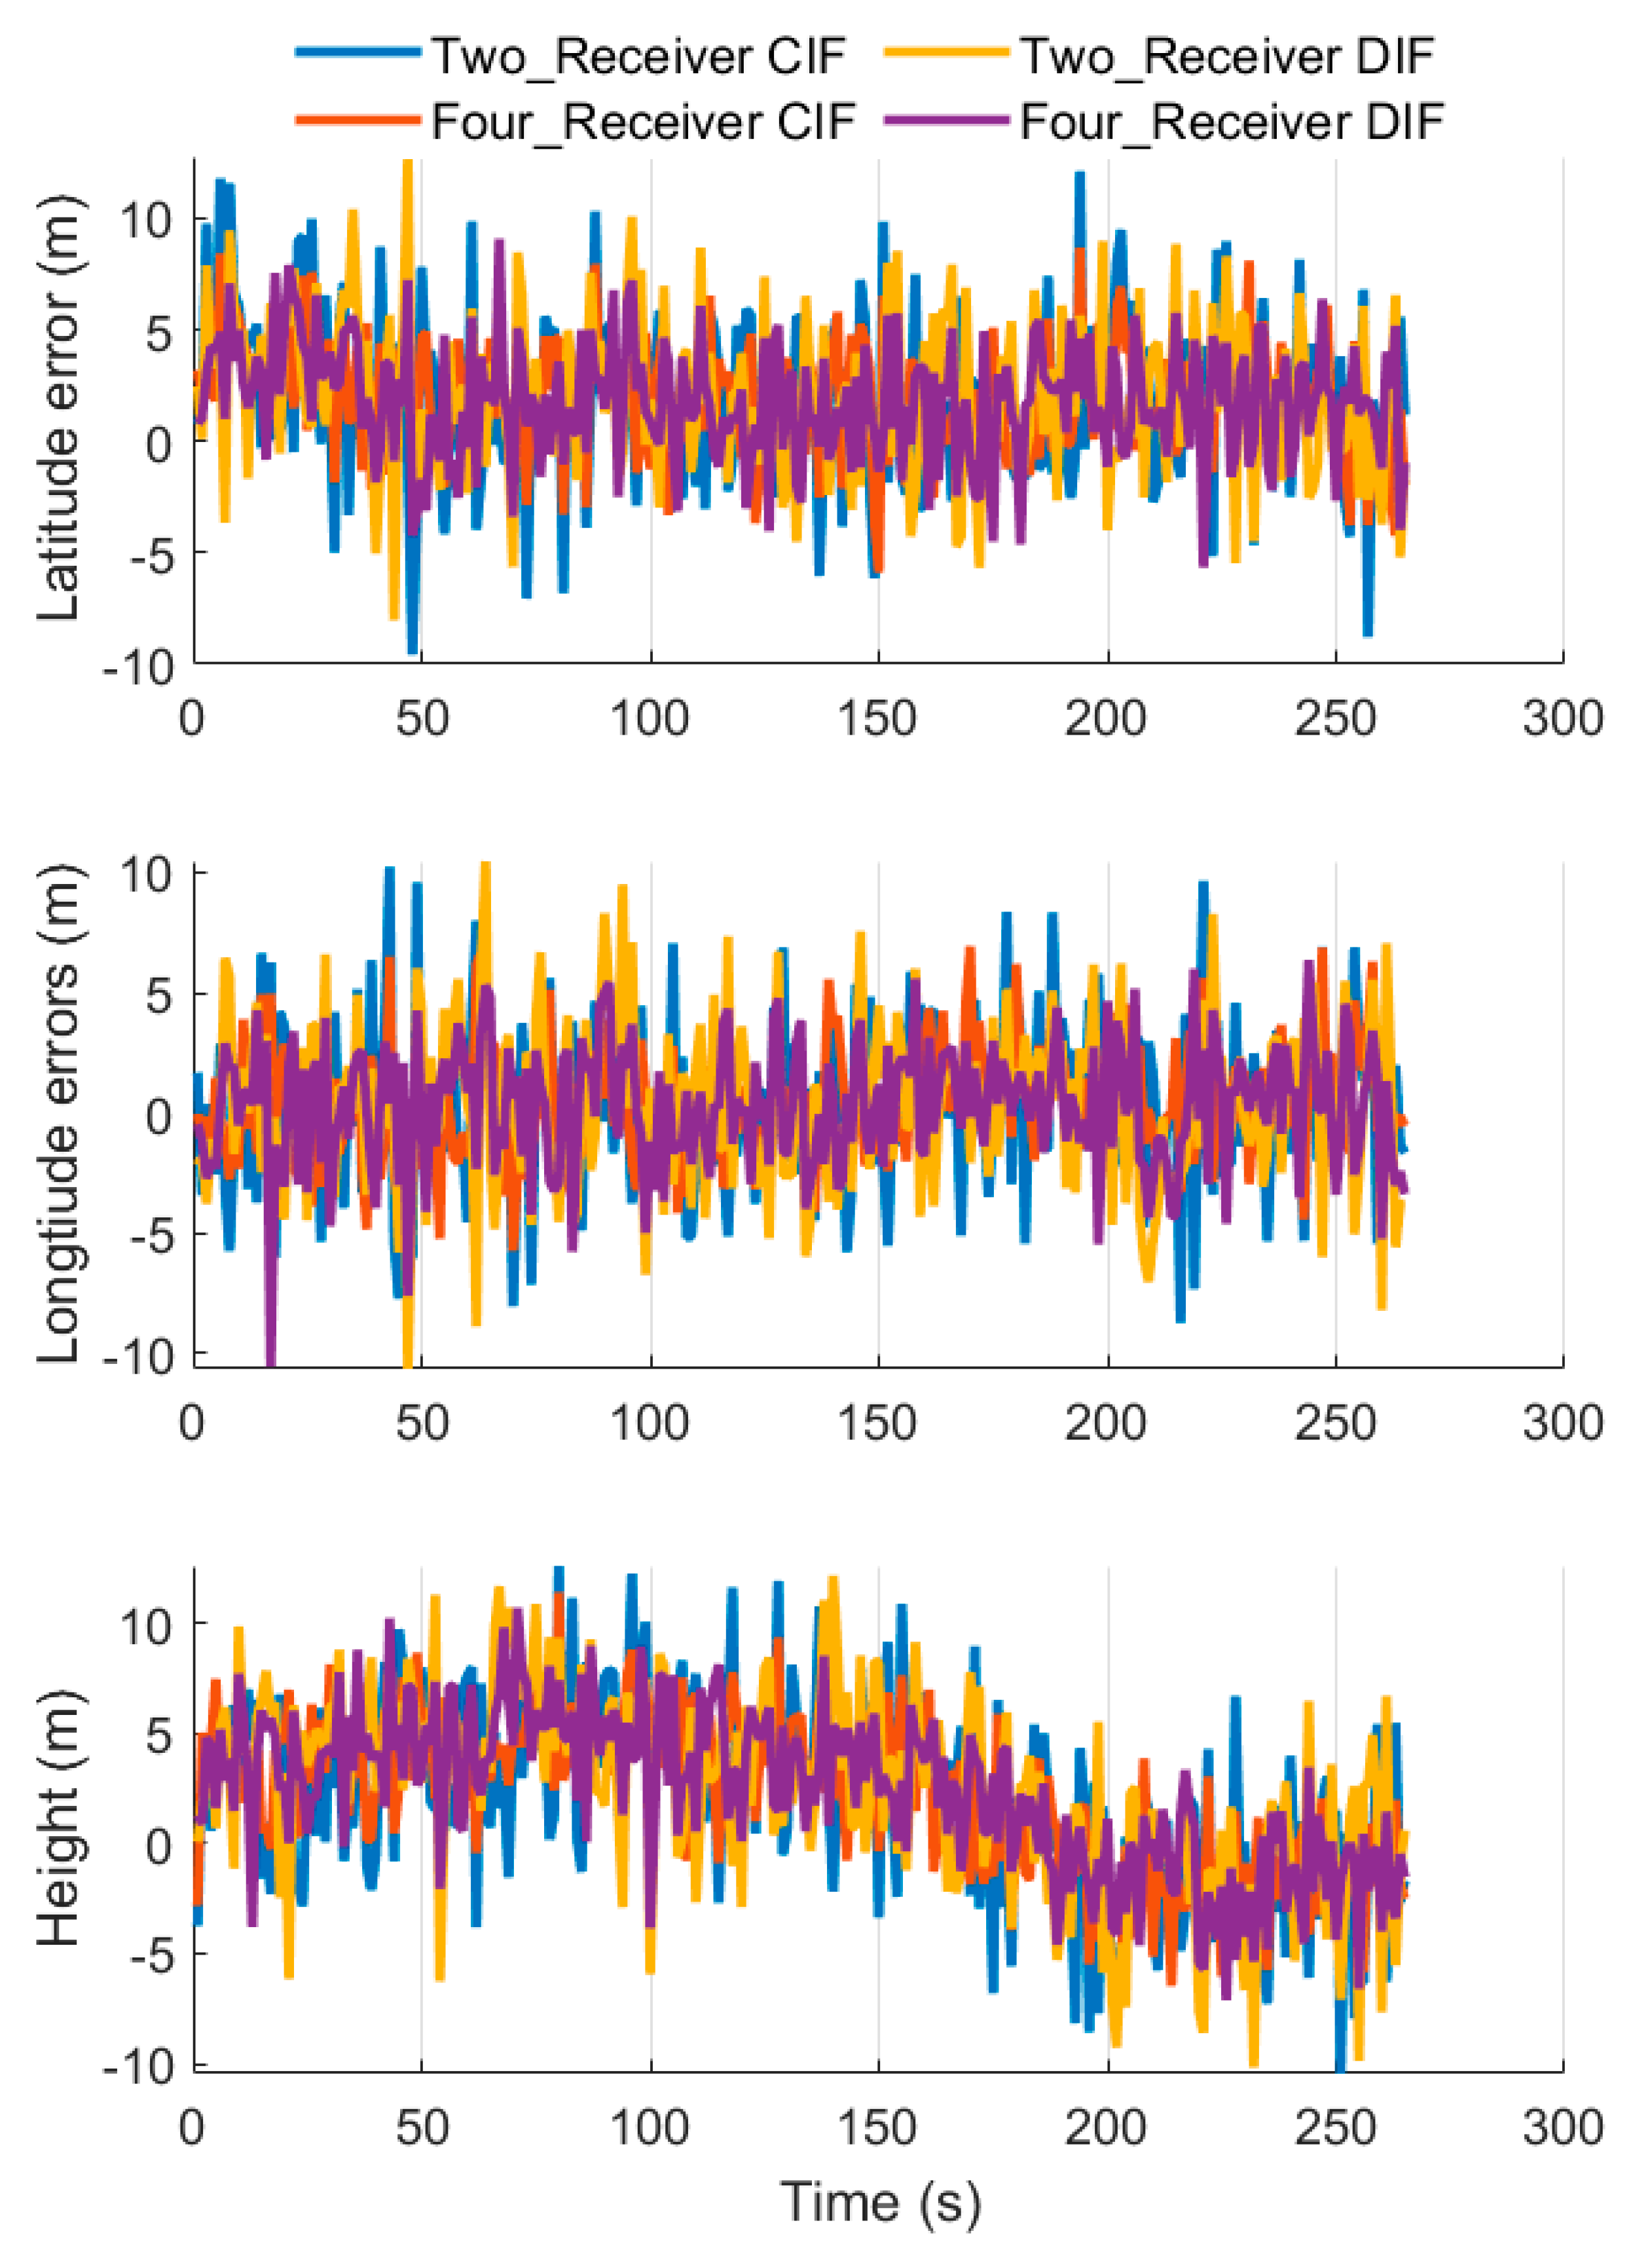
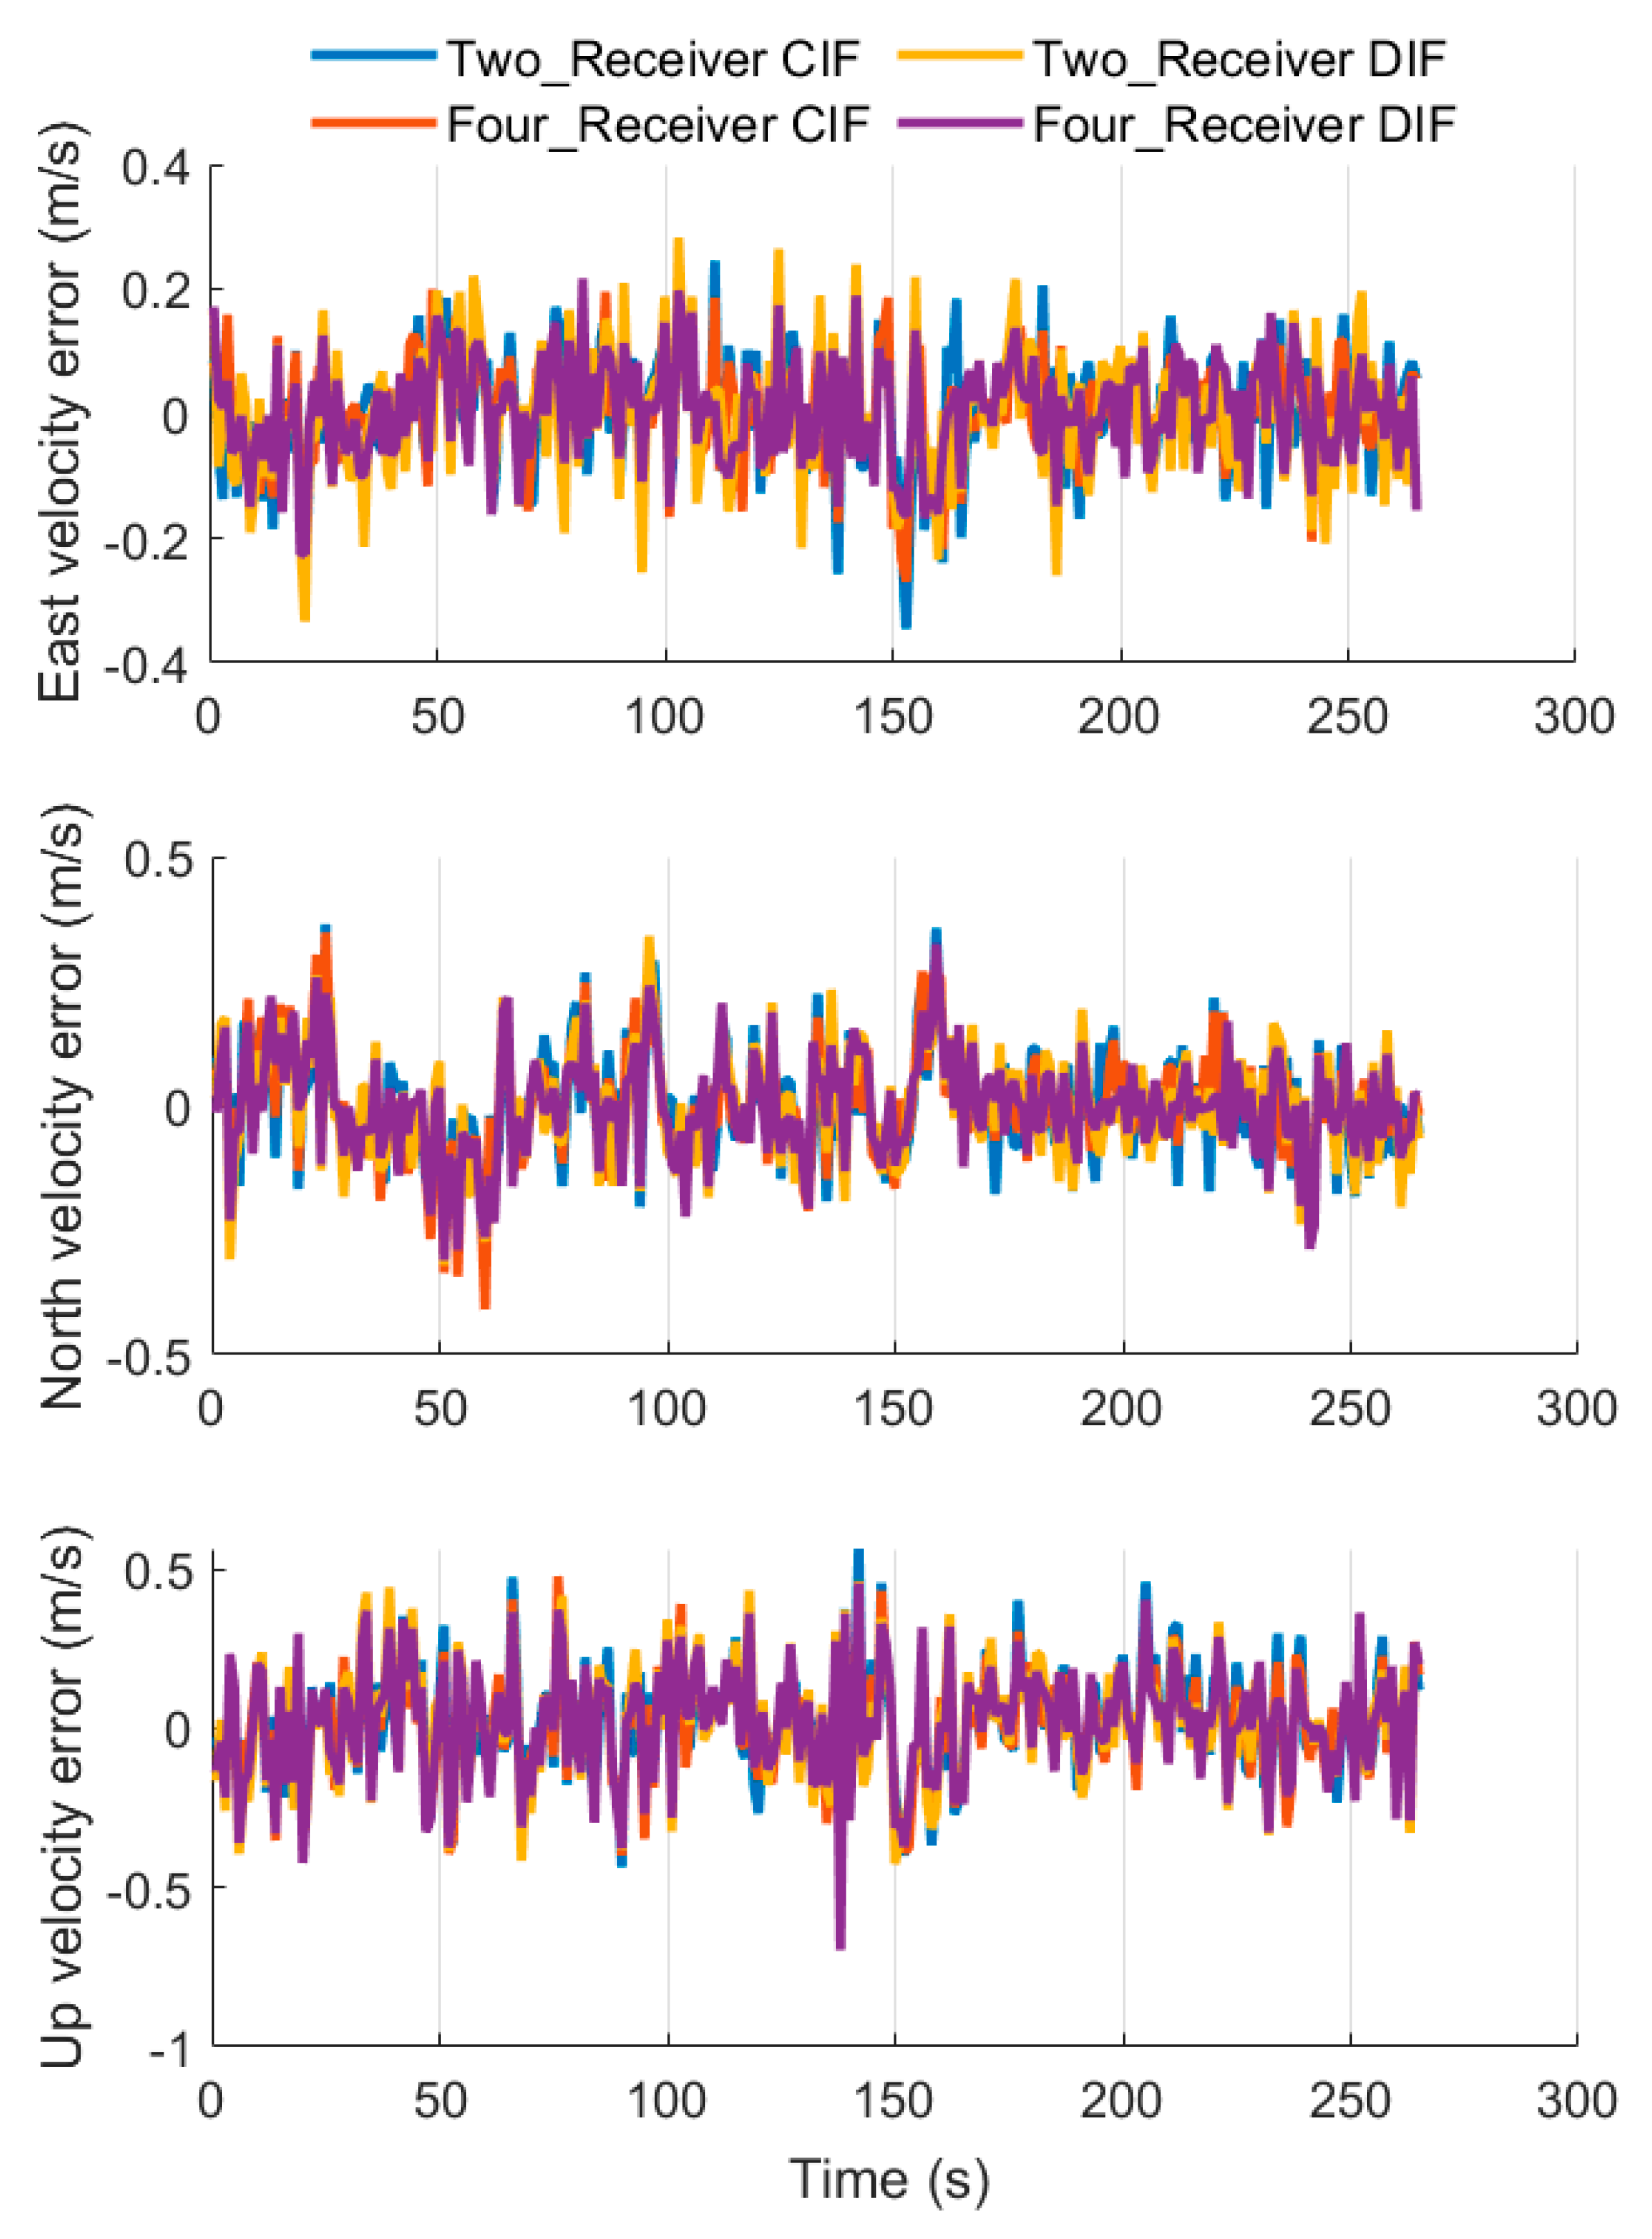
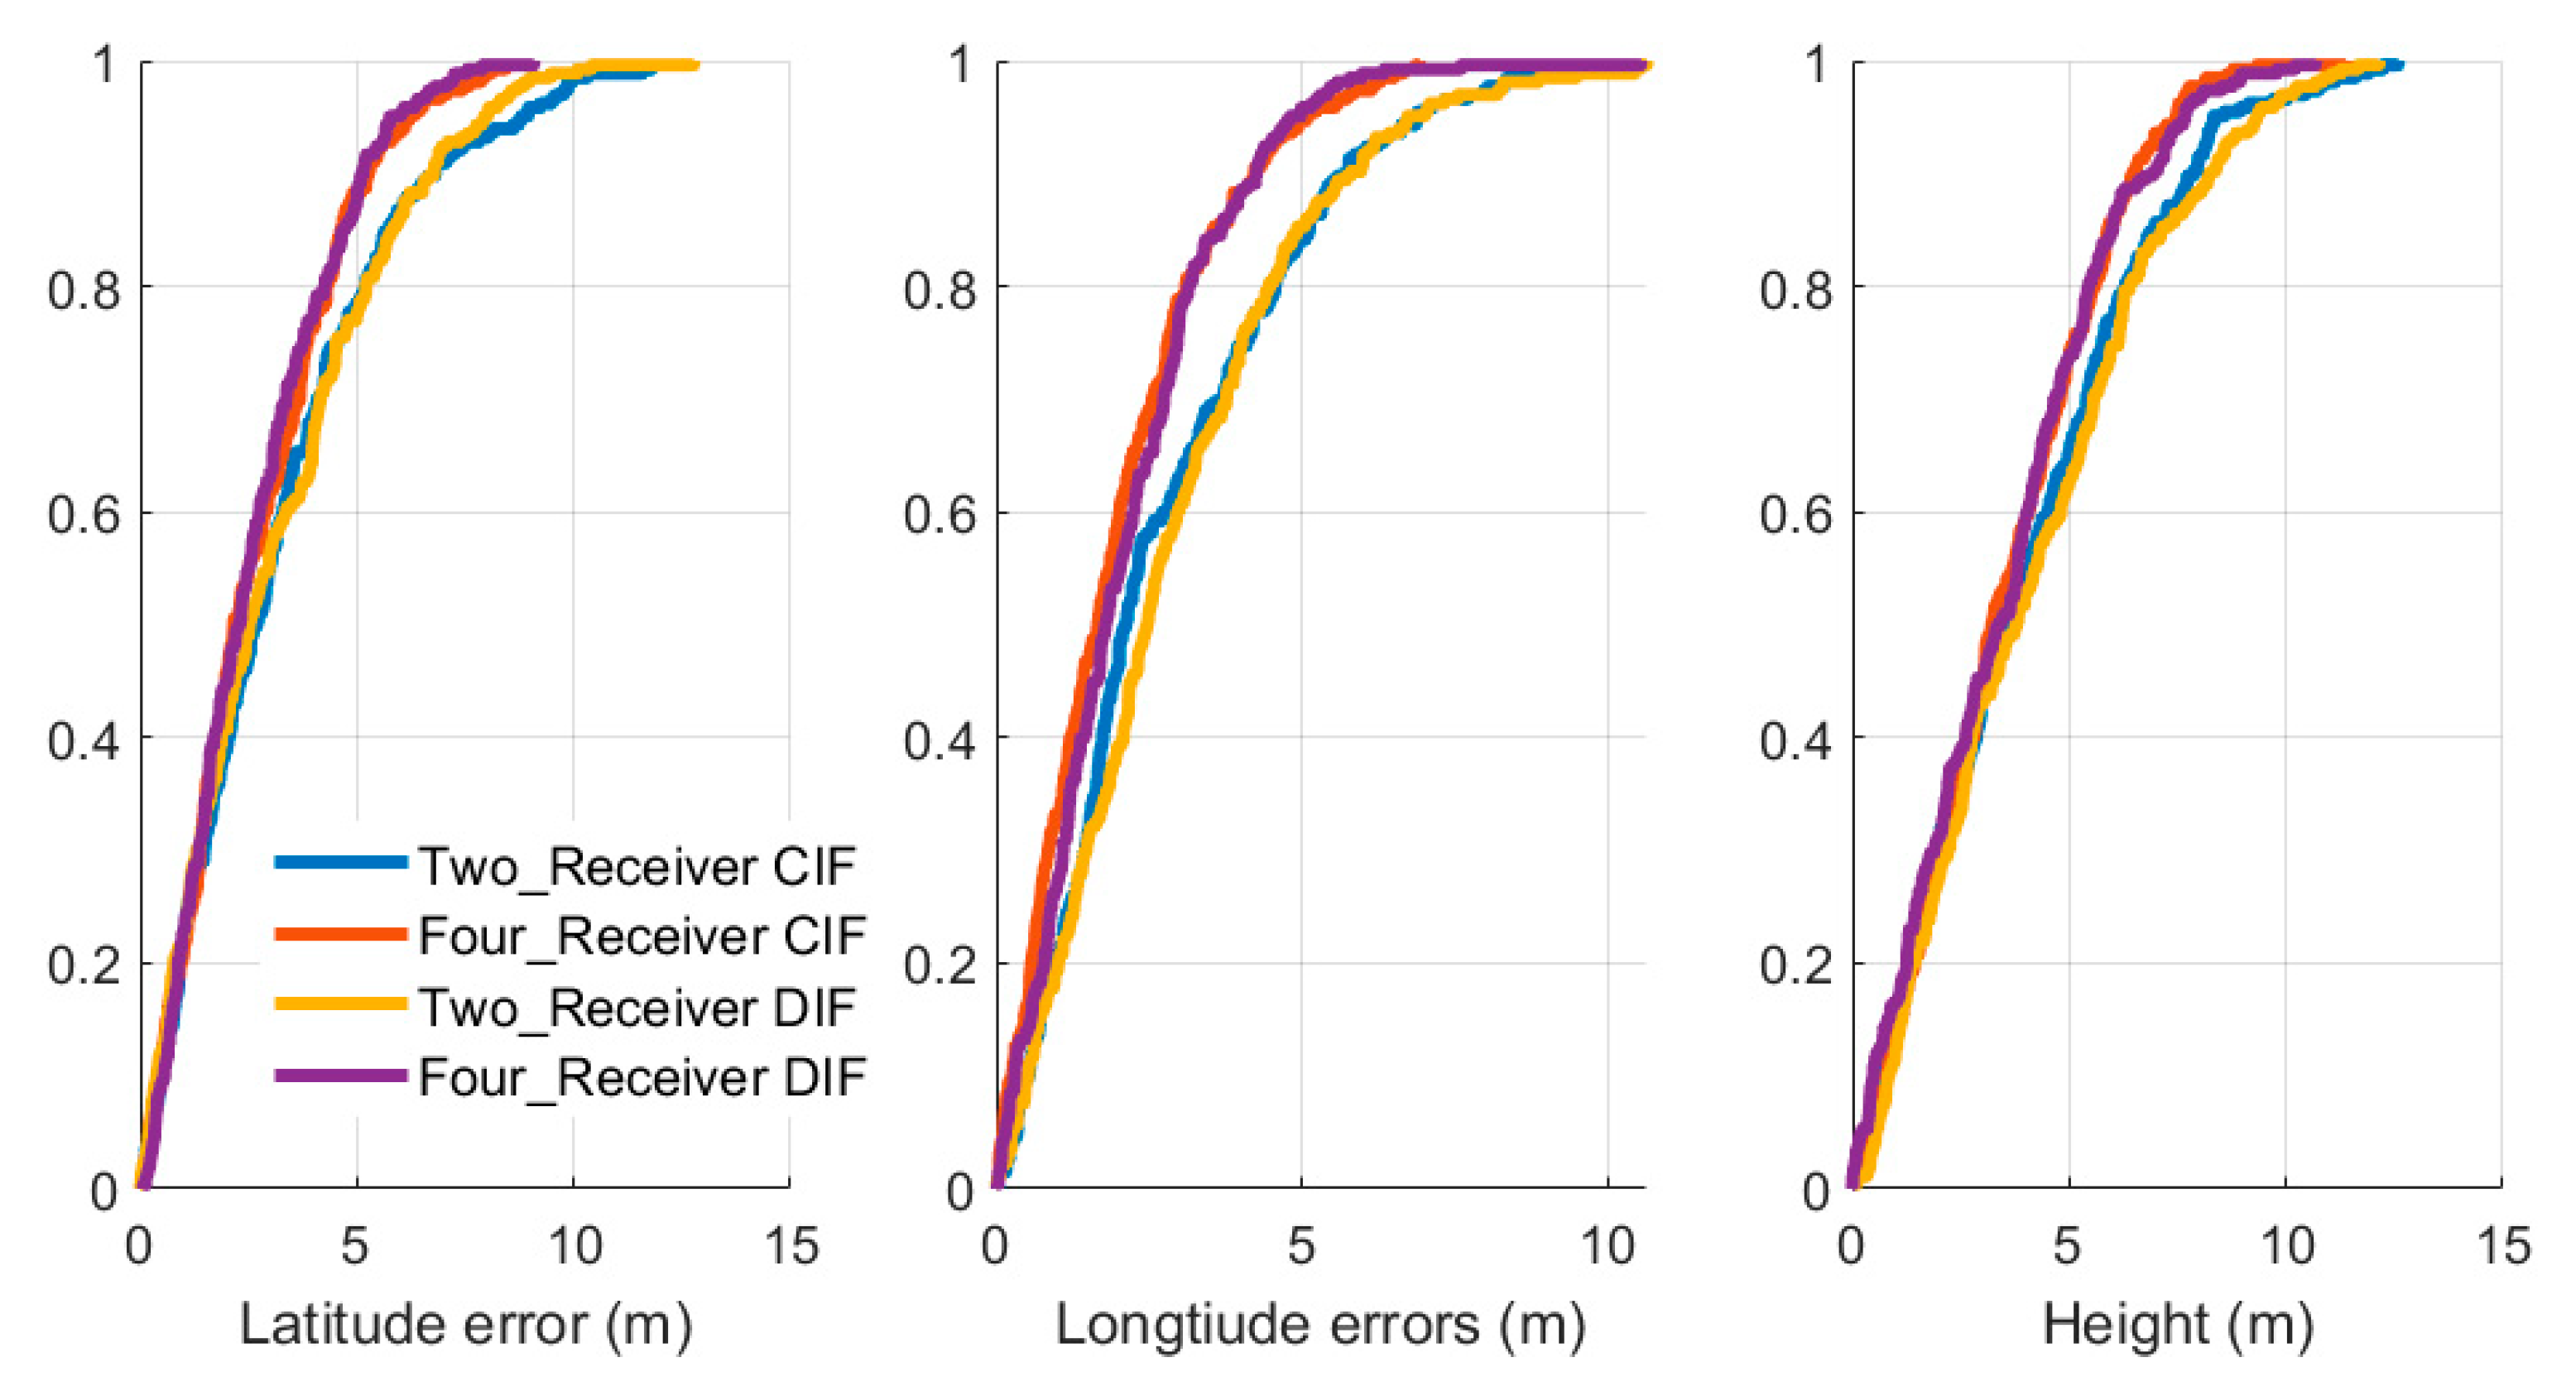
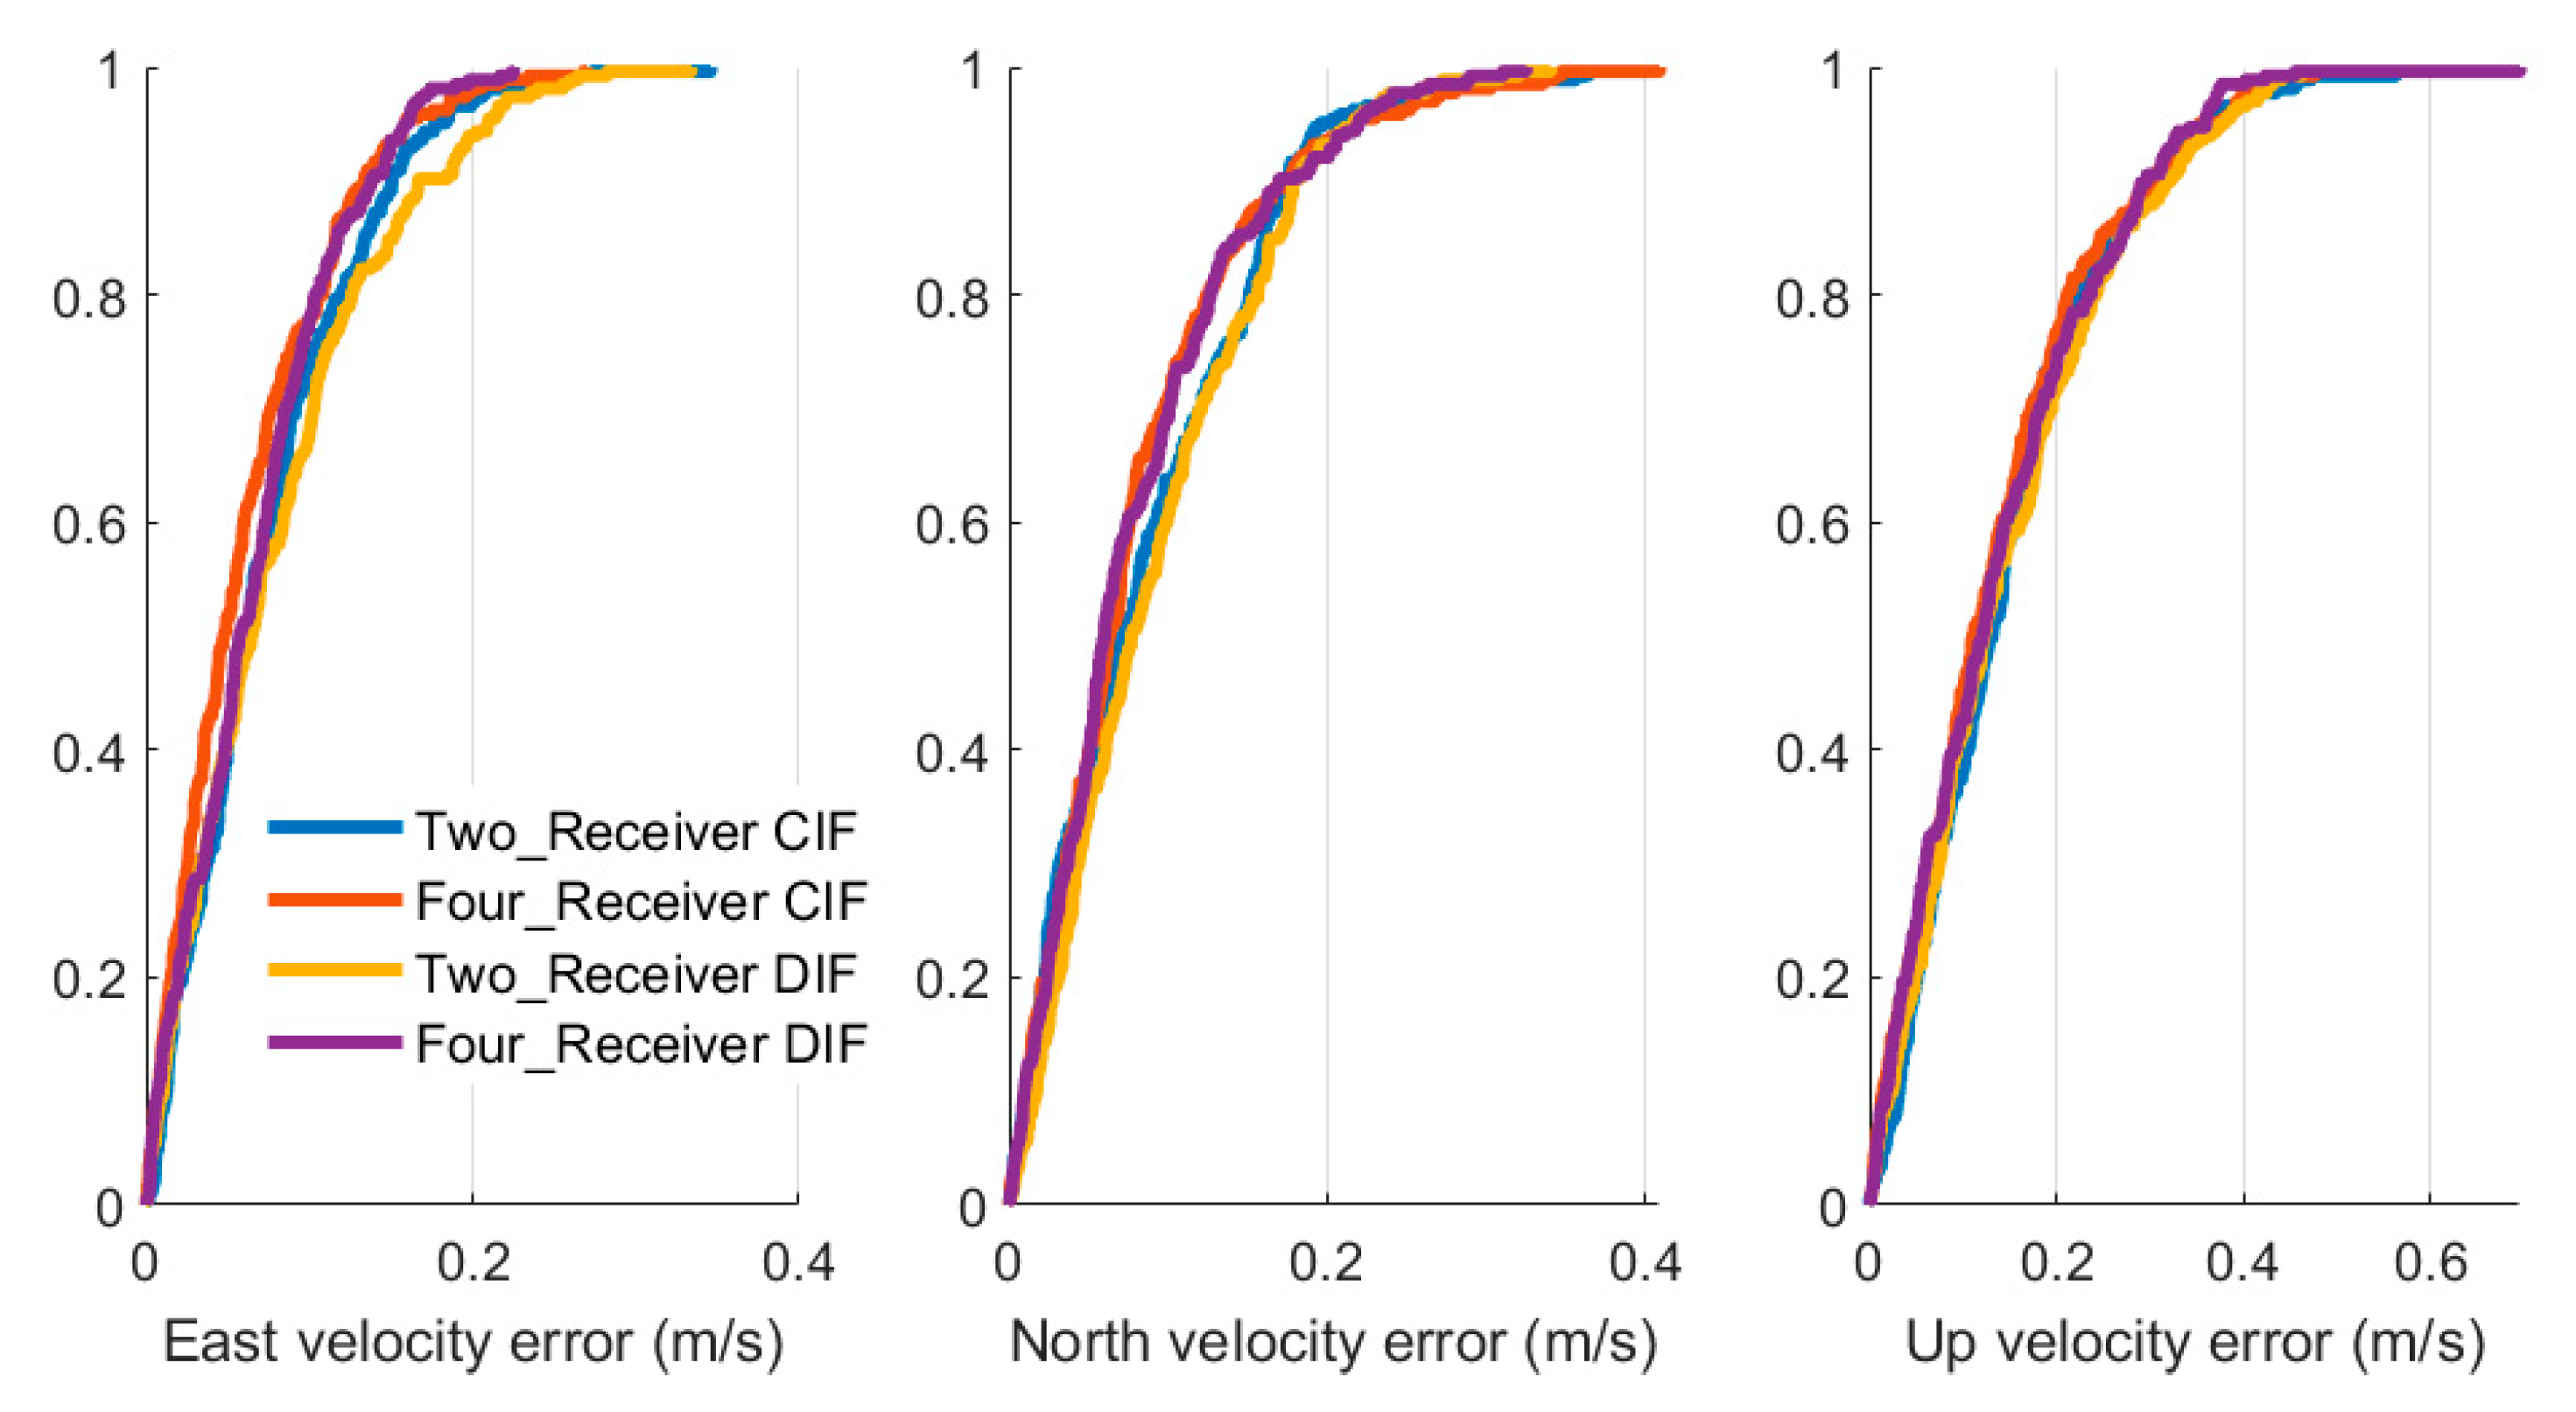
Moreover, the DIF and CIF results from the field test are presented in Figure 14 and Figure 15, and the corresponding CDF curves are presented in Figure 16 and Figure 17. The CIF and DIF methods performed with similar accuracy, which was consistent with the results obtained from the simulation test in Section 3.1.

4. Discussion

Although the simulation and field test results preliminarily demonstrated that more receivers could reduce the position and velocity errors, we though following problem were worth further discussion:
(1)
In the simulation, we assumed these position and velocity errors were all subject to Gaussian distribution. In fact, these receivers may not be subject to Gaussian distribution; even if they were subject to Gaussian distribution, they may have different statistical parameters, which could affect the fusion of the multiple receivers and the SINS. It could be seen from the velocity errors presented in Figure 13 (field test), that the up-velocity errors saw a minor increase, which could be caused by differences in the statistical parameters. As such, an adaptive tuning of the measurement noise might help to improve the fusion results.
(2)
In the field test, the antennas from the receivers were placed close together and the distance between the antennas’ center point was approximately 10 cm. Since the errors of the employed UBLOX receivers were several meters, we thought the distance had a minor impact on the position results of the multiple receiver-based GNSS/SINS LI.

5. Conclusions

A low-cost method to improve the GNSS/SINS LI system positioning accuracy was proposed and investigated in this paper. With the simulation and the field tests, the results supported the following conclusions. Including more receivers in the LI system was an effective way to reduce the position and velocity errors of the GNSS/SISN LI system. With the computation load caused by the inclusion of the multiple receivers, FKF was able to reduce the computation load without affecting the position and velocity accuracy.
Limited by the experimental settings, future work is worthwhile for further investigation. Tight integration had been compared and demonstrated to be more applicable than loose integration in urban areas; as such, multiple receiver-based tight integration methods will be implemented and investigated in the future. More GNSS constellations are available now, with GPS, BDS, GLONASS, and Galileo being the major navigation satellite systems. More navigation satellites will surely improve the performance of the integration system.

Author Contributions

Methodology, D.L. and Q.X.; software, D.L.; validation, H.W., Q.X. and D.L.; writing—original draft preparation, D.L.; writing—review and editing, C.J.; funding acquisition, Q.X. All authors have read and agreed to the published version of the manuscript.

Funding

This work was supported by National Natural Science Foundation (NNSF) of China under Grant 61503180, 61601225, Six Talent Peaks Project in Jiangsu Province of China under Grant 2016-JXQC-015, Science Foundation of Higher Education of Jiangsu Province under Grant 15KJA460007 and 18KJB510016, The Fund of Nanjing Institute of Technology under Grant CKJA201605, CKJB201702, and CKJA201804.

Conflicts of Interest

The authors declare no conflict of interest.

References

  1. Jiang, C.; Chen, S.; Chen, Y.; Bo, Y. Research on a chip scale atomic clock aided vector tracking loop. IET Radar Sonar Navig. 2019, 13, 1101–1106. [Google Scholar] [CrossRef]
  2. Godha, S.; Cannon, M.E. GPS/MEMS INS integrated system for navigation in urban areas. GPS Solut. 2007, 11, 193–203. [Google Scholar] [CrossRef]
  3. Chen, Y.; Tang, J.; Jiang, C.; Zhu, L.; Lehtomäki, M.; Kaartinen, H.; Kaijaluoto, R.; Wang, Y.; Hyyppä, J.; Hyyppä, H.; et al. The accuracy comparison of three simultaneous localization and mapping (SLAM)-based indoor mapping technologies. Sensors 2018, 18, 3228. [Google Scholar] [CrossRef] [Green Version]
  4. Wendel, J.; Trommer, G.F. Tightly coupled GPS/INS integration for missile applications. Aerosp. Sci. Technol. 2004, 8, 627–634. [Google Scholar] [CrossRef]
  5. Falco, G.; Pini, M.; Marucco, G. Loose and tight GNSS/INS integrations: Comparison of performance assessed in real urban scenarios. Sensors 2017, 17, 255. [Google Scholar] [CrossRef] [PubMed]
  6. Jiang, C.; Chen, S.; Chen, Y.; Bo, Y. Research on a chip scale atomic clock driven GNSS/SINS deeply coupled navigation system for augmented performance. IET Radar Sonar Navig. 2018, 13, 326–331. [Google Scholar] [CrossRef]
  7. Chen, Y.; Jiang, C.; Zhu, L.; Kaartinen, H.; Hyyppa, J.; Tan, J.; Hyyppa, H.; Zhou, H.; Chen, R.; Pei, L. SLAM based indoor mapping comparison: Mobile or terrestrial? In Proceedings of the 2018 Ubiquitous Positioning, Indoor Navigation and Location-Based Services (UPINLBS), Wuhan, China, 22–23 March 2018; pp. 1–7. [Google Scholar]
  8. Jiang, C.; Chen, S.; Chen, Y.; Zhang, B.; Feng, Z.; Zhou, H.; Bo, Y. A MEMS IMU de-noising method using long short term memory recurrent neural networks (LSTM-RNN). Sensors 2018, 18, 3470. [Google Scholar] [CrossRef] [PubMed] [Green Version]
  9. Wang, J.; Garratt, M.; Lambert, A.; Wang, J.J.; Han, S.; Sinclair, D. Integration of GPS/INS/vision sensors to navigate unmanned aerial vehicles. Int. Arch. Photogramm. Remote Sens. Spat. Inf. Sci. 2008, 37, 963–969. [Google Scholar]
  10. Nemra, A.; Aouf, N. Robust INS/GPS sensor fusion for UAV localization using SDRE nonlinear filtering. IEEE Sens. J. 2010, 10, 789–798. [Google Scholar] [CrossRef] [Green Version]
  11. Wendel, J.; Meister, O.; Schlaile, C.; Trommer, G.F. An integrated GPS/MEMS-IMU navigation system for an autonomous helicopter. Aerosp. Sci. Technol. 2006, 10, 527–533. [Google Scholar] [CrossRef]
  12. Jiang, C.; Chen, Y.; Chen, S.; Bo, Y.; Li, W.; Tian, W.; Guo, J. A mixed deep recurrent neural network for MEMS gyroscope noise suppressing. Electronics 2019, 8, 181. [Google Scholar] [CrossRef] [Green Version]
  13. Capezio, F.; Sgorbissa, A.; Zaccaria, R. GPS-based localization for a surveillance UGV in outdoor areas. In Proceedings of the Fifth International Workshop on Robot Motion and Control, 2005. RoMoCo’05, Dymaczewo, Poland, 23–25 June 2005; pp. 157–162. [Google Scholar]
  14. KhademSohi, H.; Sharifian, S.; Faez, K. Accuracy-energy optimized location estimation method for mobile smartphones by GPS/INS data fusion. In Proceedings of the 2016 2nd International Conference of Signal Processing and Intelligent Systems (ICSPIS), Tehran, Iran, 14–15 December 2016; pp. 1–5. [Google Scholar]
  15. Jiang, C.; Chen, S.; Bo, Y.; Lu, Q.; Sun, Z. An adaptive tuning method of GNSS carrier tracking loop for high dynamic application. J. Aeronaut. Astronaut. Aviat. 2016, 48, 271–277. [Google Scholar]
  16. Hsu, L.-T. Analysis and modeling GPS NLOS effect in highly urbanized area. GPS Solut. 2017, 22, 7. [Google Scholar] [CrossRef] [Green Version]
  17. Jiang, C.; Chen, S.; Bo, Y.; Sun, Z.; Lu, Q. Implementation and performance evaluation of a fast relocation method in a GPS/SINS/CSAC integrated navigation system hardware prototype. IEICE Electron. Express 2017, 14, 20170121. [Google Scholar] [CrossRef] [Green Version]
  18. Hsu, L.-T.; Gu, Y.; Kamijo, S. NLOS correction/exclusion for GNSS measurement using RAIM and city building models. Sensors 2015, 15, 17329–17349. [Google Scholar] [CrossRef] [Green Version]
  19. Jiang, C.; Chen, S.; Liu, Y.; Han, X. Implementation and performance evaluation of a distributed GNSS/SINS ultra-tightly integrated navigation system. In Proceedings of the 2016 IEEE International Instrumentation and Measurement Technology Conference, Taipei, Taiwan, 23–26 May 2016; pp. 1–4. [Google Scholar]
  20. Ding, W.; Wang, J.; Rizos, C.; Kinlyside, D. Improving adaptive kalman estimation in GPS/INS integration. J. Navig. 2007, 60, 517–529. [Google Scholar] [CrossRef] [Green Version]
  21. Hong, S.; Lee, M.; Chun, H.-H.; Kwon, S.-H.; Speyer, J. Observability of Error States in GPS/INS Integration. IEEE Trans. Veh. Technol. 2005, 54, 731–743. [Google Scholar] [CrossRef]
  22. Almagbile, A.; Wang, J.; Ding, W. Evaluating the Performances of Adaptive Kalman Filter Methods in GPS/INS Integration. J. Glob. Position Syst. 2010, 9, 33–40. [Google Scholar] [CrossRef] [Green Version]
  23. Jiang, C.; Chen, S.; Bo, Y.; Wang, Y.; Sun, Z. Performance improvement of GPS/SINS ultra-tightly integrated navigation system utilizing a robust cubature kalman filter. J. Aeronaut. Astronaut. Aviat. 2017, 49, 49–55. [Google Scholar]
  24. Grewal, M.S.; Weill, L.R.; Andrews, A.P. Global Positioning Systems, Inertial Navigation, and Integration; Wiley: New York, NY, USA, 2007. [Google Scholar]
  25. Schubert, R.; Mattern, N.; Wanielik, G. An evaluation of nonlinear filtering algorithms for integrating GNSS and inertial measurements. In Proceedings of the 2008 IEEE/ION Position, Location and Navigation Symposium, Monterey, CA, USA, 5–8 May 2008; pp. 25–29. [Google Scholar]
  26. Gao, Z.; Ge, M.; Shen, W.; Li, Y.; Chen, Q.; Zhang, H.; Niu, X. Evaluation on the impact of IMU grades on BDS + GPS PPP/INS tightly coupled integration. Adv. Space Res. 2017, 60, 1283–1299. [Google Scholar] [CrossRef] [Green Version]
  27. Watson, R.M.; Sivaneri, V.; Gross, J.N. Performance characterization of tightly coupled GNSS precise point positioning inertial navigation within a simulation environment. In Proceedings of the AIAA Guidance, Navigation, and Control Conference, Chicago, IL, USA, 10–13 August 2009; p. 1869. [Google Scholar]
  28. Li, T.; Zhang, H.; Gao, Z.; Chen, Q.; Niu, X. High-accuracy positioning in urban environments using single-frequency Multi-GNSS RTK/MEMS-IMU integration. Remote. Sens. 2018, 10, 205. [Google Scholar] [CrossRef] [Green Version]
  29. Niu, X.; Ban, Y.; Zhang, Q.; Zhang, T.; Zhang, H.; Liu, J. Quantitative Analysis to the Impacts of IMU Quality in GPS/INS Deep Integration. Micromachines 2015, 6, 1082–1099. [Google Scholar] [CrossRef] [Green Version]
  30. Fernández-Prades, C.; Closas, P.; Vilà-Valls, J. Nonlinear filtering for ultra-tight GNSS/INS integration. In Proceedings of the 2010 IEEE International Conference on Communications, Cape Town, South Africa, 23–27 May 2010; pp. 1–5. [Google Scholar]
  31. Nourmohammadi, H.; Keighobadi, J. Decentralized INS/GNSS system with MEMS-grade inertial sensors using QR-factorized CKF. IEEE Sens. J. 2017, 17, 3278–3287. [Google Scholar] [CrossRef]
  32. Benzerrouk, H.; Salhi, H.; Nebylov, A.V. Adaptive “Cubature and Sigma Points” kalman filtering applied to MEMS IMU/GNSS data fusion during measurement outlier. J. Sens. Technol. 2013, 3, 115–125. [Google Scholar] [CrossRef] [Green Version]
  33. Carlson, N.A.; Berarducci, M.P. Federated kalman filter simulation results. Navigation 1994, 41, 297–322. [Google Scholar] [CrossRef]
Figure 1. Central processing structure.
Electronics 09 01079 g001
Figure 2. Distributed processing method.
Electronics 09 01079 g002
Figure 3. 3D plot of the trajectory.
Electronics 09 01079 g003
Figure 4. Position and velocity errors. (a) Latitude position errors; (b) longitude position errors; (c) height errors; (d) east velocity errors; (e) up velocity errors; (f) north velocity errors.
Electronics 09 01079 g004aElectronics 09 01079 g004b
Figure 5. Comparison of the mean and standard deviation (STD) values.
Electronics 09 01079 g005
Figure 6. Comparison of the CDF (cumulative distribution function) results. (a) CDF of the position errors; (b) north velocity errors.
Electronics 09 01079 g006
Figure 7. Comparison of position and velocity errors. (a) Latitude position errors; (b) longitude position errors; (c) height errors; (d) east velocity errors; (e) up velocity errors; (f) north velocity errors.
Electronics 09 01079 g007
Figure 8. CDF (cumulative distribution function) curves of the position and velocity errors. (a) CDF curves of the position errors; (b) CDF curves of the velocity errors.
Electronics 09 01079 g008
Figure 9. Trajectory and the velocity of the field test. (a) Trajectory; (b) velocity.
Electronics 09 01079 g009
Figure 10. Position errors comparison.
Electronics 09 01079 g010
Figure 11. CDF curves for position errors.
Electronics 09 01079 g011
Figure 12. Velocity errors.
Electronics 09 01079 g012
Figure 13. CDF curves for velocity errors.
Electronics 09 01079 g013
Figure 14. Comparison of the centralized integration filter (CIF) and distributive integration filter (DIF) position errors.
Electronics 09 01079 g014
Figure 15. Comparison of the CIF and DIF velocity errors.
Electronics 09 01079 g015
Figure 16. CDF curves for CIF and DIF velocity errors.
Electronics 09 01079 g016
Figure 17. CDF curves for CIF and DIF velocity errors.
Electronics 09 01079 g017
Table 1. GNSS (global navigation satellite system) receiver prices.
ProductPrice (Dollars)Technology
UBLOXNEO-M8N10SPP
UBLOXZEDF9P RTK500RTK
NOVATELOEM719800RTK
TrimbleBD982700RTK
Table 2. IMU (inertial measurement unit) prices.
ProductPrice (Dollars)Gyroscope Bias Stability
MEMS IMUMPU92505-
MEMS IMUADIS16448100015°/h
MEMS IMUMTI-710200010°/h
FOG IMUKVH CG510020,0001°/h
Table 3. Vector dimension comparisons (N receivers).
CIFDIF
State vector 15 × 1 15 × 1
Measurement vector 6 × N 6 × 1
Observation matrix 6 N × 15 6 × 15
KF gain matrix 15 × 6 N 15 × 6
Table 4. SINS (trap-down inertial navigation system) and GNSS (global navigation satellite system) simulation parameters.
AccelerometerBias5 mg
White noise1 mg
GyroscopeBias10°/h
White noise1°/h
GNSSPosition10 m
Velocity0.1 m/s
Table 5. Position and velocity errors comparison (CIF).
Receiver AmountMeanSTD
Position ErrorsLatitude errors (m)Single1.311.73
Two0.590.70
Four0.580.42
Longitude errors (m)Single0.690.93
Two0.580.71
Four0.410.68
Height errors (m)Single0.771,17
Two0.630.96
Four0.410.43
Velocity ErrorsEast velocity errors (m/s)Single0.0220.028
Two0.0170.024
Four0.0160.018
North velocity errors (m/s)Single0.0300.036
Two0.0180.028
Four0.0150.025
Up velocity errors (m/s)Single0.0260.041
Two0.0250.034
Four0.0140.017
Table 6. Position and velocity errors (DIF).
Receiver AmountMeanSTD
Position ErrorsLatitude errors (m)Two0.530.63
Four0.390.41
Longitude errors (m)Two0.820.71
Four0.420.80
Height errors (m)Two1.100.60
Four0.490.65
Velocity ErrorsEast velocity errors (m/s)Two0.0160.021
Four0.0090.014
North velocity errors (m/s)Two0.0170.027
Four0.0120.018
Up velocity errors (m/s)Two0.0210.021
Four0.0080.010
Table 7. Inertial measurement unit (IMU) specifications.
GyroscopeBias stability (degree/h)≤3°/h
White noise (degree/h)0.1°/h
AccelerometerBias stability (mg)0.1 mg
White noise (mg)0.05 mg
Table 8. Comparison of position and velocity errors.
Receiver AmountMeanSTD
Position ErrorsLatitude errors (m)Single4.373.25
Two3.212.57
Four2.651.91
Longitude errors (m)Single3.982.98
Two2.772.10
Four1.961.56
Height errors (m)Single4.863.52
Two3.982.75
Four3.542.20
Velocity ErrorsEast velocity errors (m/s)Single0.0930.073
Two0.0740.057
Four0.0610.052
North velocity errors (m/s)Single0.1060.086
Two0.0870.071
Four0.0800.070
Up velocity errors (m/s)Single0.1590.124
Two0.1480.111
Four0.1380.111
Table 9. Position and velocity errors (DIF).
Receiver AmountMeanSTD
Position ErrorsLatitude errors (m)Two3.130.63
Four2.590.41
Longitude errors (m)Two2.880.71
Four2.080.80
Height errors (m)Two4.150.60
Four3.500.65
Velocity ErrorsEast velocity errors (m/s)Two0.0740.057
Four0.0610.053
North velocity errors (m/s)Two0.0870.071
Four0.0800.070
Up velocity errors (m/s)Two0.1480.111
Four0.1380.111