Article

An Effective Edge-Assisted Data Collection Approach for Critical Events in the SDWSN-Based Agricultural Internet of Things

1
College of Information Science and Technology, Zhongkai University of Agriculture and Engineering, Guangzhou 510225, China
2
College of Mechanical and Electrical Engineering, Zhongkai University of Agriculture and Engineering, Guangzhou 510225, China
3
Department of Electrical, Computer, Software, and Systems Engineering, Embry-Riddle Aeronautical University, Daytona Beach, FL 32114, USA
4
School of Mechanical and Automotive Engineering, South China University of Technology, Guangzhou 510641, China
*
Author to whom correspondence should be addressed.
Electronics 2020, 9(6), 907; https://doi.org/10.3390/electronics9060907
Submission received: 28 February 2020 / Revised: 25 May 2020 / Accepted: 26 May 2020 / Published: 29 May 2020
(This article belongs to the Special Issue Edge Computing in IoT)

Abstract

:
In the traditional agricultural wireless sensor networks (WSNs), there is a large amount of redundant data and high latency on critical events (CEs) for data collection systems, which increases the time and energy consumption. In order to overcome these problems, an effective edge computing (EC) enabled data collection approach for CE in smart agriculture is proposed. First, the key features data types (KFDTs) are extracted from the historical dataset to keep the main information on CEs. Next, the KFDTs are selected as the collection data type of the software-defined wireless sensor network (SDWSN). Then, the event types are decided by searching the minimum average variance between the sensing data of active nodes and the average value of the key feature data obtained by EC. Furthermore, the sensing nodes are driven to sense the event-related data with a consideration of latency constraints by the SDWSN servers. A real-world testbed was set up in a smart greenhouse for experimental verification of the proposed approach. The results showed that the proposed approach could reduce the number of needed sensors, sensing time, collection data volume, communication time, and provide the low latency agricultural data collection system. Thus, the proposed approach can improve the efficiency of CE sensing in smart agriculture.

1. Introduction

Due to the rapid urbanization and increasing population worldwide, smart agriculture has been needed to provide a necessary amount of food. The Internet of Things (IoT) driven smart agriculture has been seen as a key for solving the food problems caused by urbanization and increasing population [1,2,3]. Recently, the latest information technologies, such as cloud computing, artificial intelligence, and big data, have achieved great progress [4,5,6,7,8]. The new agricultural paradigm integrates new information technologies to improve agricultural output and quality [9,10]. However, smart agriculture mostly relies on a large effective data quantity; for instance, the environment data, crop growth data, and other data [11]. Therefore, data collection in smart agriculture is crucial, especially for agricultural big data, artificial intelligence, and so on.
With the constant infiltration of industrial elements into agriculture, the numbers of intelligent plant factories, unmanned farms, and other industrial agriculture paradigms have increased largely. Therefore, a low latency and effective data collection for critical events (CEs) (e.g., equipment failure, a sudden change in the greenhouse environment) in the agricultural IoT sensing system has become a hot topic in academia and industry, and it represents the foundation for realizing modern agriculture [12,13].
After several years of development, the data collection for CEs has achieved great progress [14]. In the agricultural CEs monitoring, the wireless sensor networks (WSNs) have been commonly used to sense the related data periodically. Generally, there are two classical data-collection methods, which are widely used in the agricultural IoT. In the first one, all sensor nodes are included in data collection (ASDT) [15], and in the second one, a part of nodes are used for data collection (PNDT) [16]. However, these methods seldom focus on effective event-based data collection to reduce data redundancy by exploiting the correlation between sensing data and CEs.
In smart agriculture, especially industrial agriculture, it is necessary to reduce the latency and increase the efficiency of data collection and the validity of data on CEs. However, the traditional WSNs are based on a static network and lack computing resources, which results in high latency of data collection. Therefore, new agricultural models, especially those related to industrial agriculture, pose huge challenges to the traditional agricultural IoT and sensing systems. The emerging challenges for monitoring events are two folds, and they refer to data redundancy and data collection latency. On the one hand, as the amount of collected data increases, WSNs encounter a heavy burden in data collection and delivery, which further increases the latency. On the other hand, an increase in the collected data amount leads to data redundancy. Hence, huge amounts of time and energy are wasted to clean and discover useful data, while the data collection latency is markedly increased. In summary, conventional data gathering methods used in the IoT field are high latency and inefficient in the event-driven smart agriculture field. Therefore, it is necessary to develop new methods to address the mentioned challenges.
In this paper, we propose an edge assisted data collection approach for critical events to decrease the data redundancy in the smart agriculture IoT. Edge computing is employed to reduce the redundant data amount, latency, and energy consumption. In this way, the balance between the main information on an event and the corresponding data volume is ensured.
The contributions of this paper can be summarized as follows:
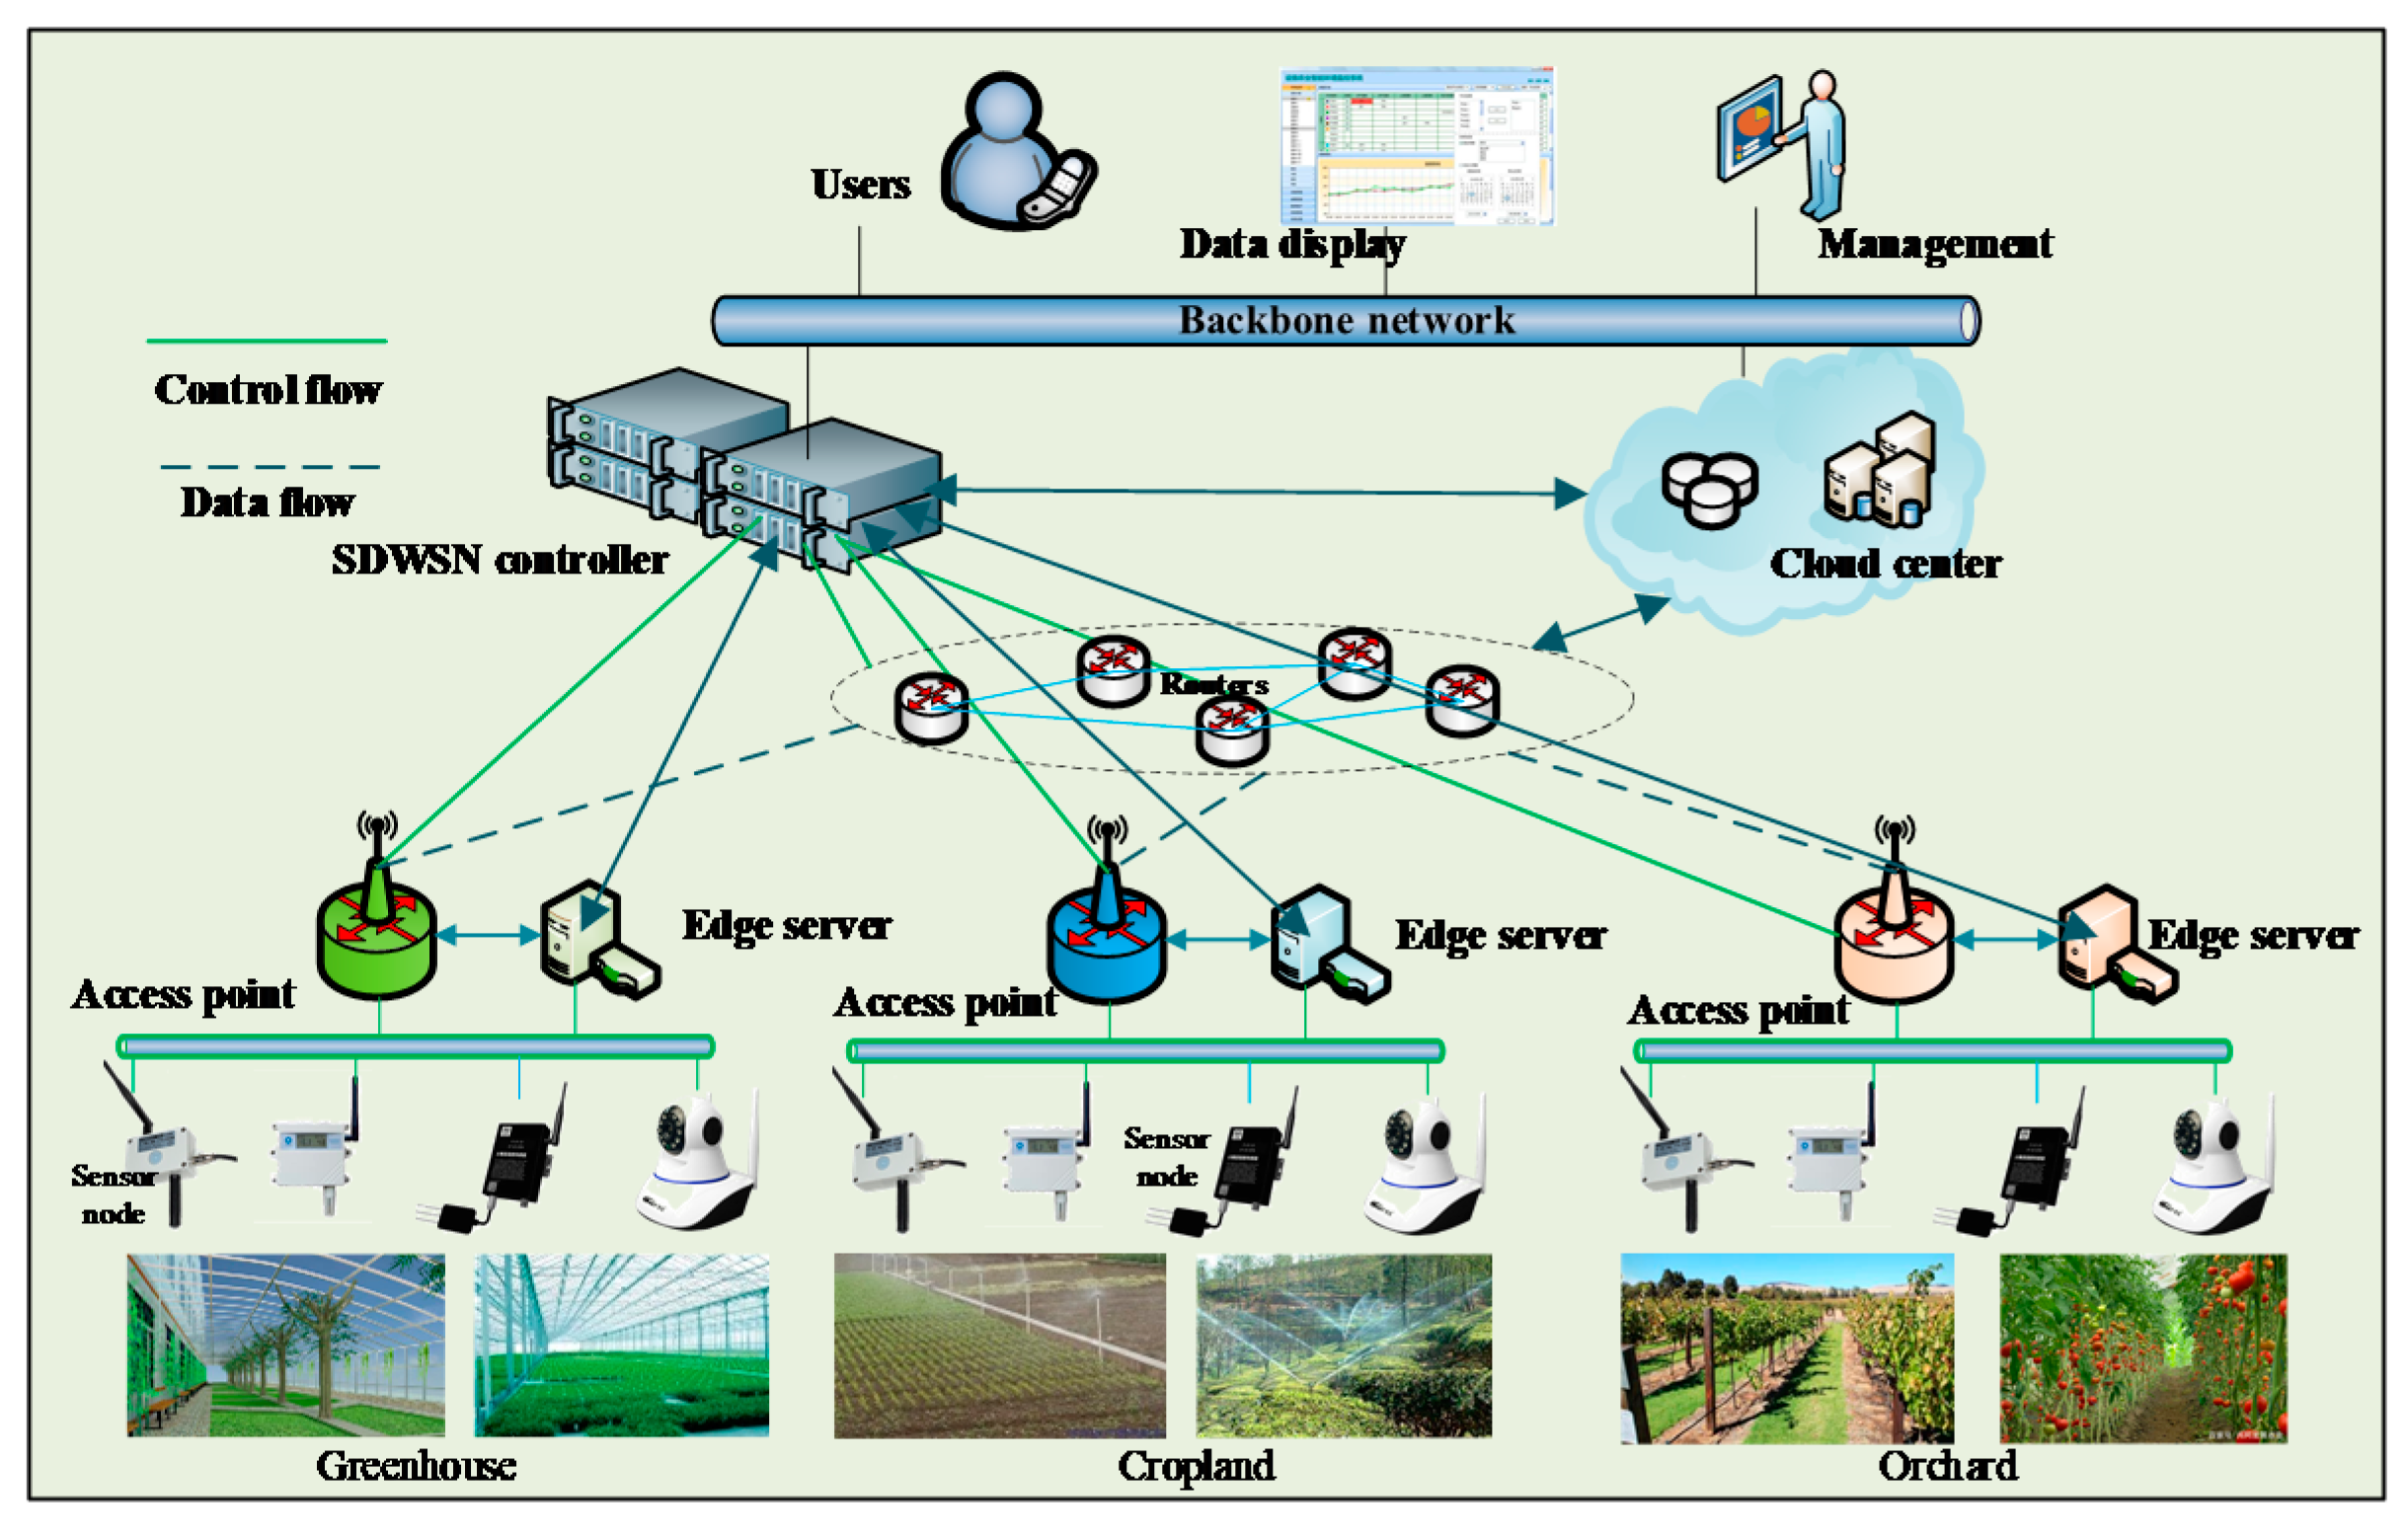
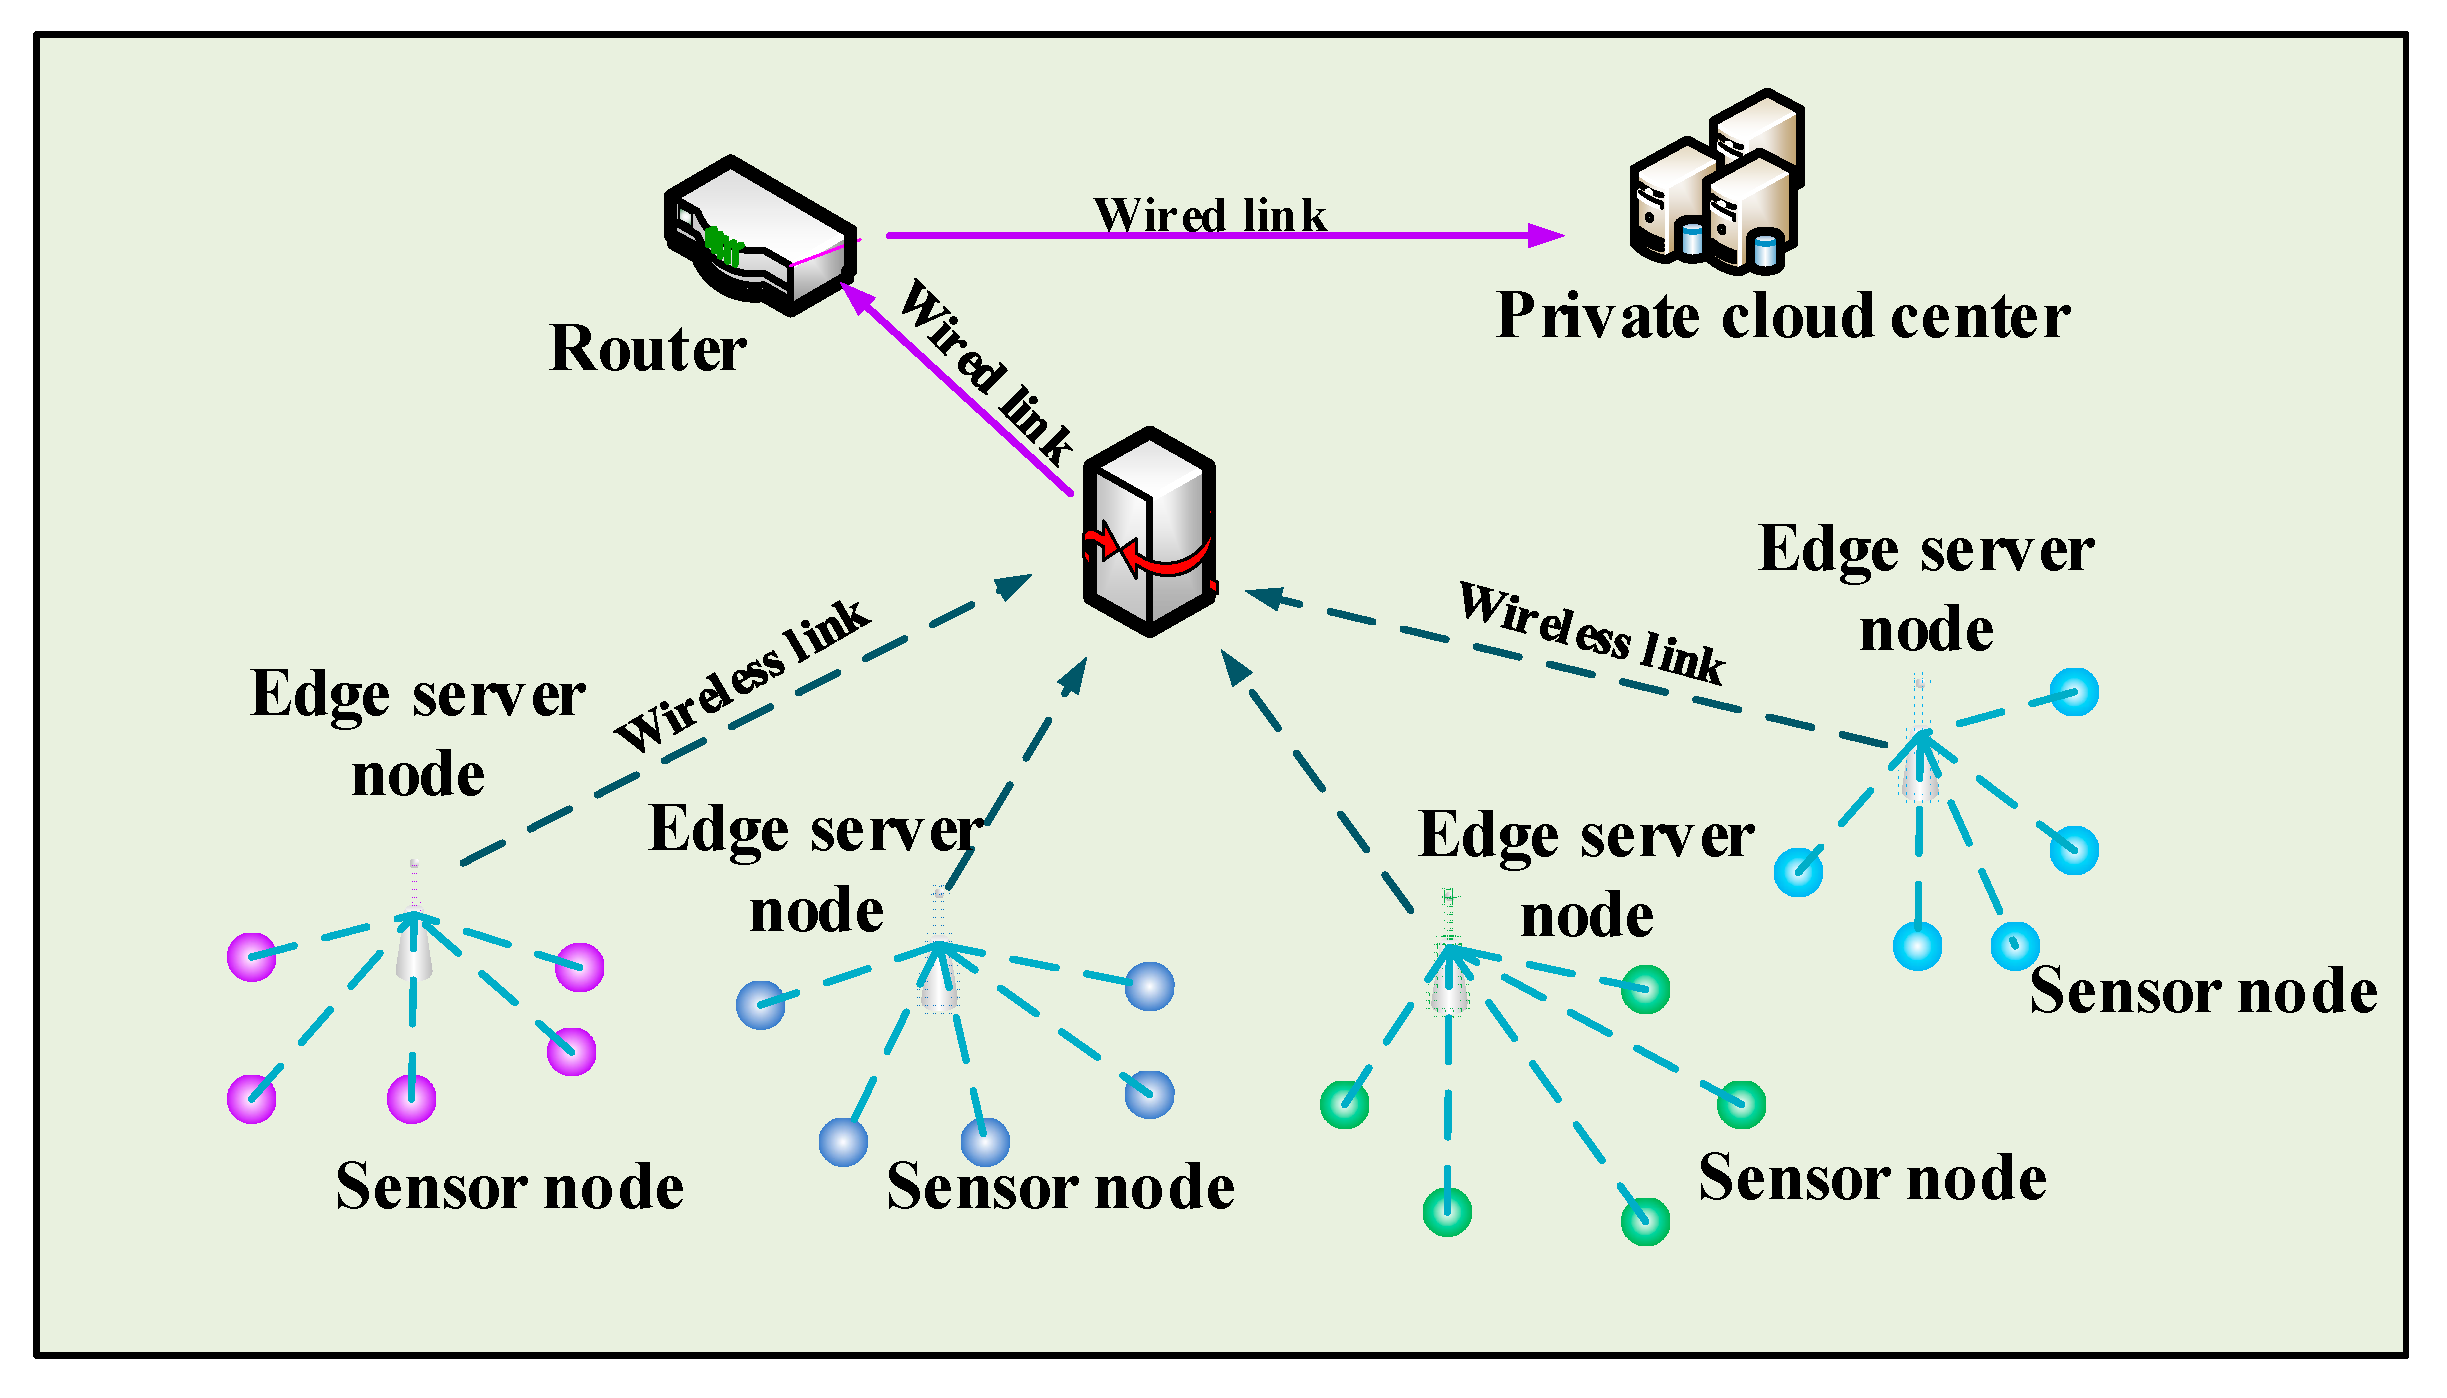
  • A software-defined WSN (SDWSN) enabled framework for monitoring event is designed by integrating a software-defined network (SDN) and edge computing into an agricultural IoT data sensing system.
  • Based on the proposed framework, an effective data sensing method, which conducts automatic data type selection using mutual information, events categorization, and related data sensing is proposed to realize essential event sensing and reduce the cost of data collection.
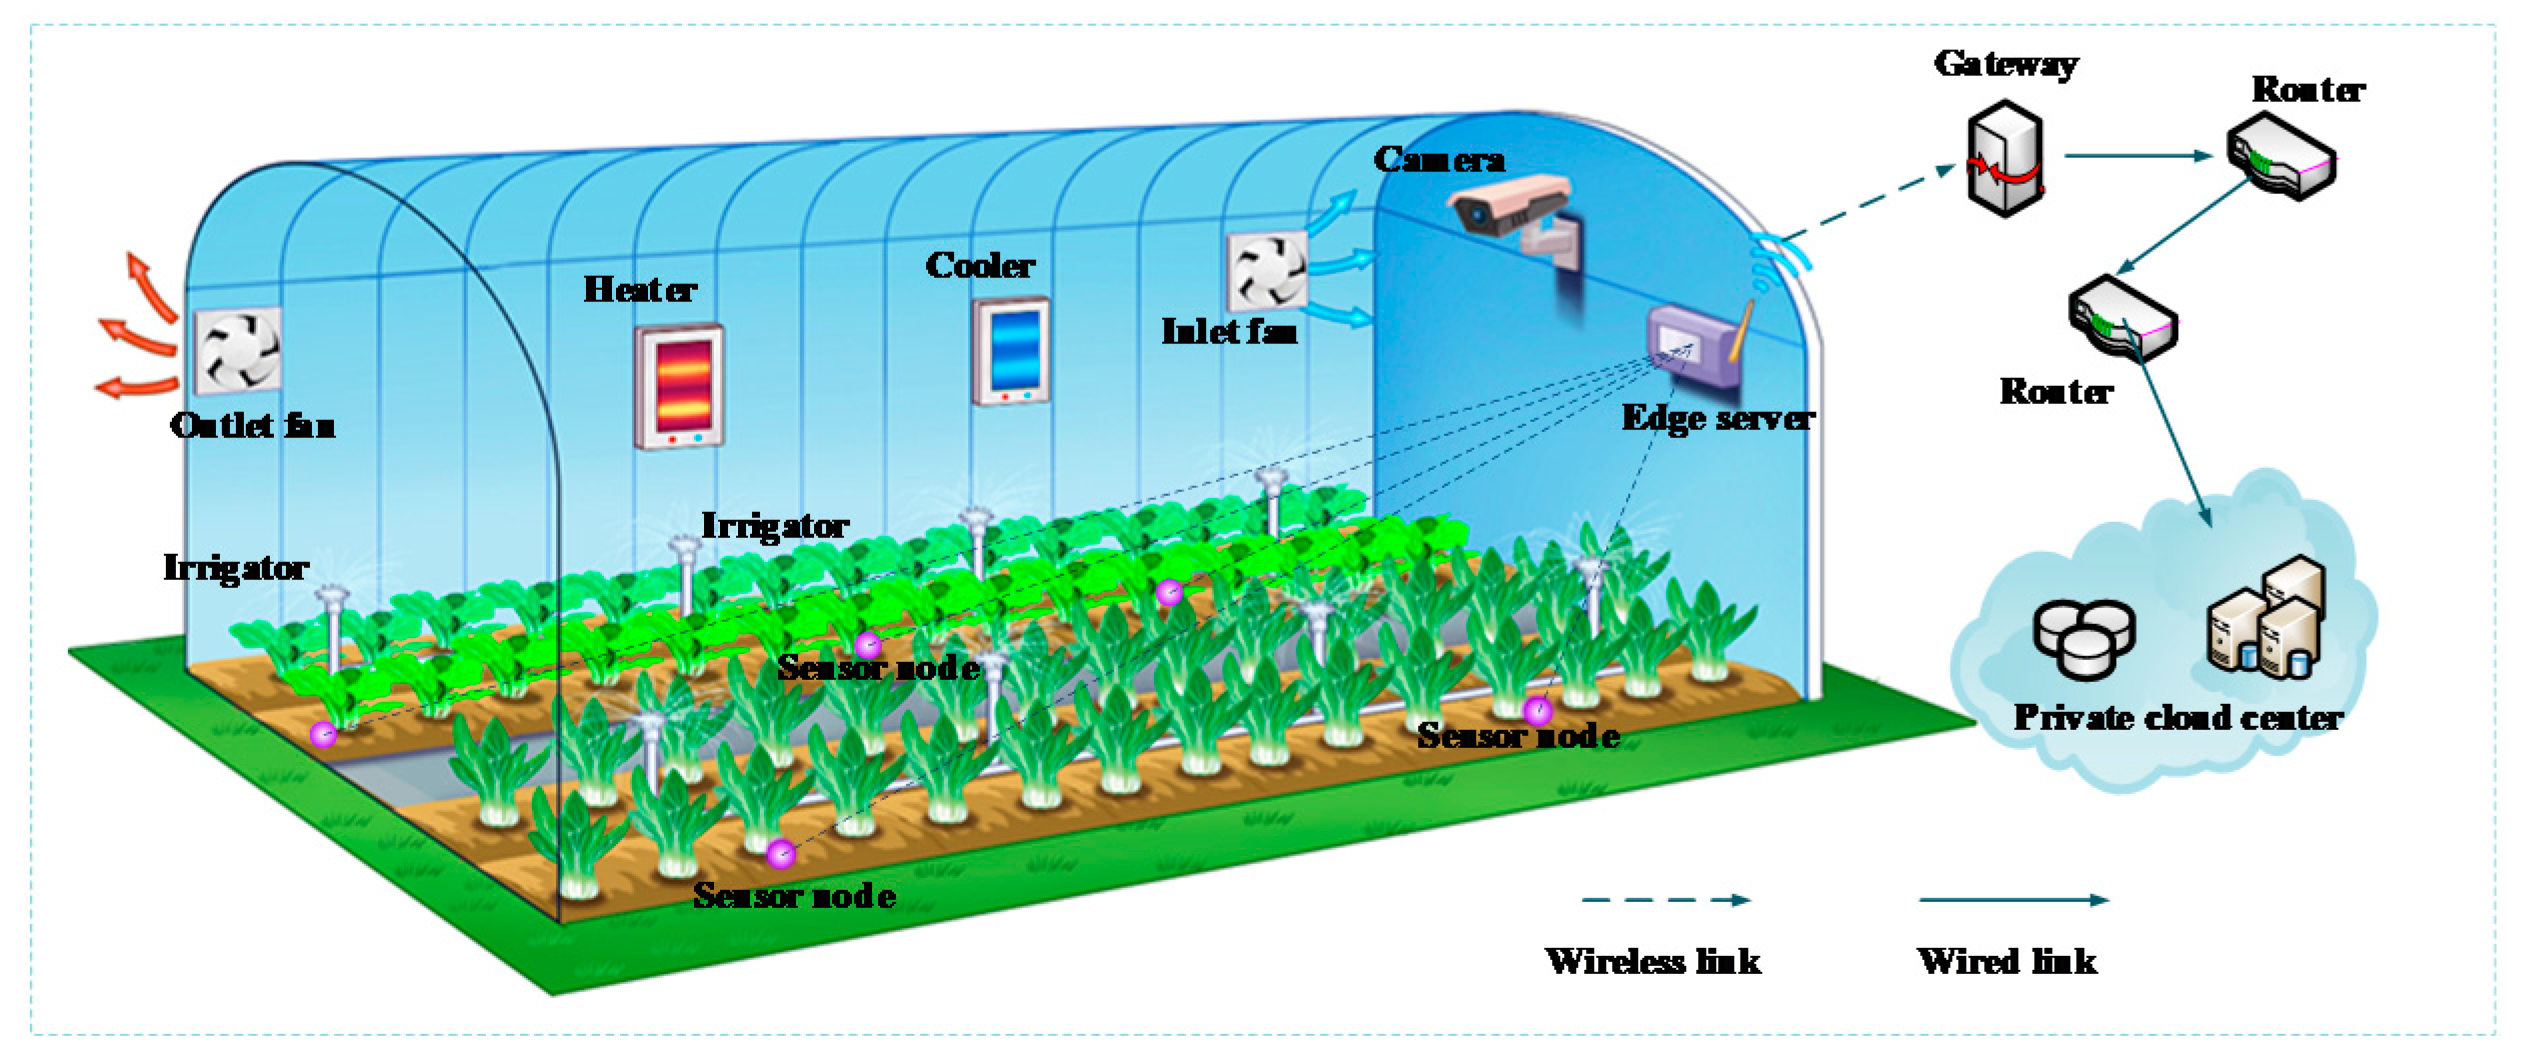
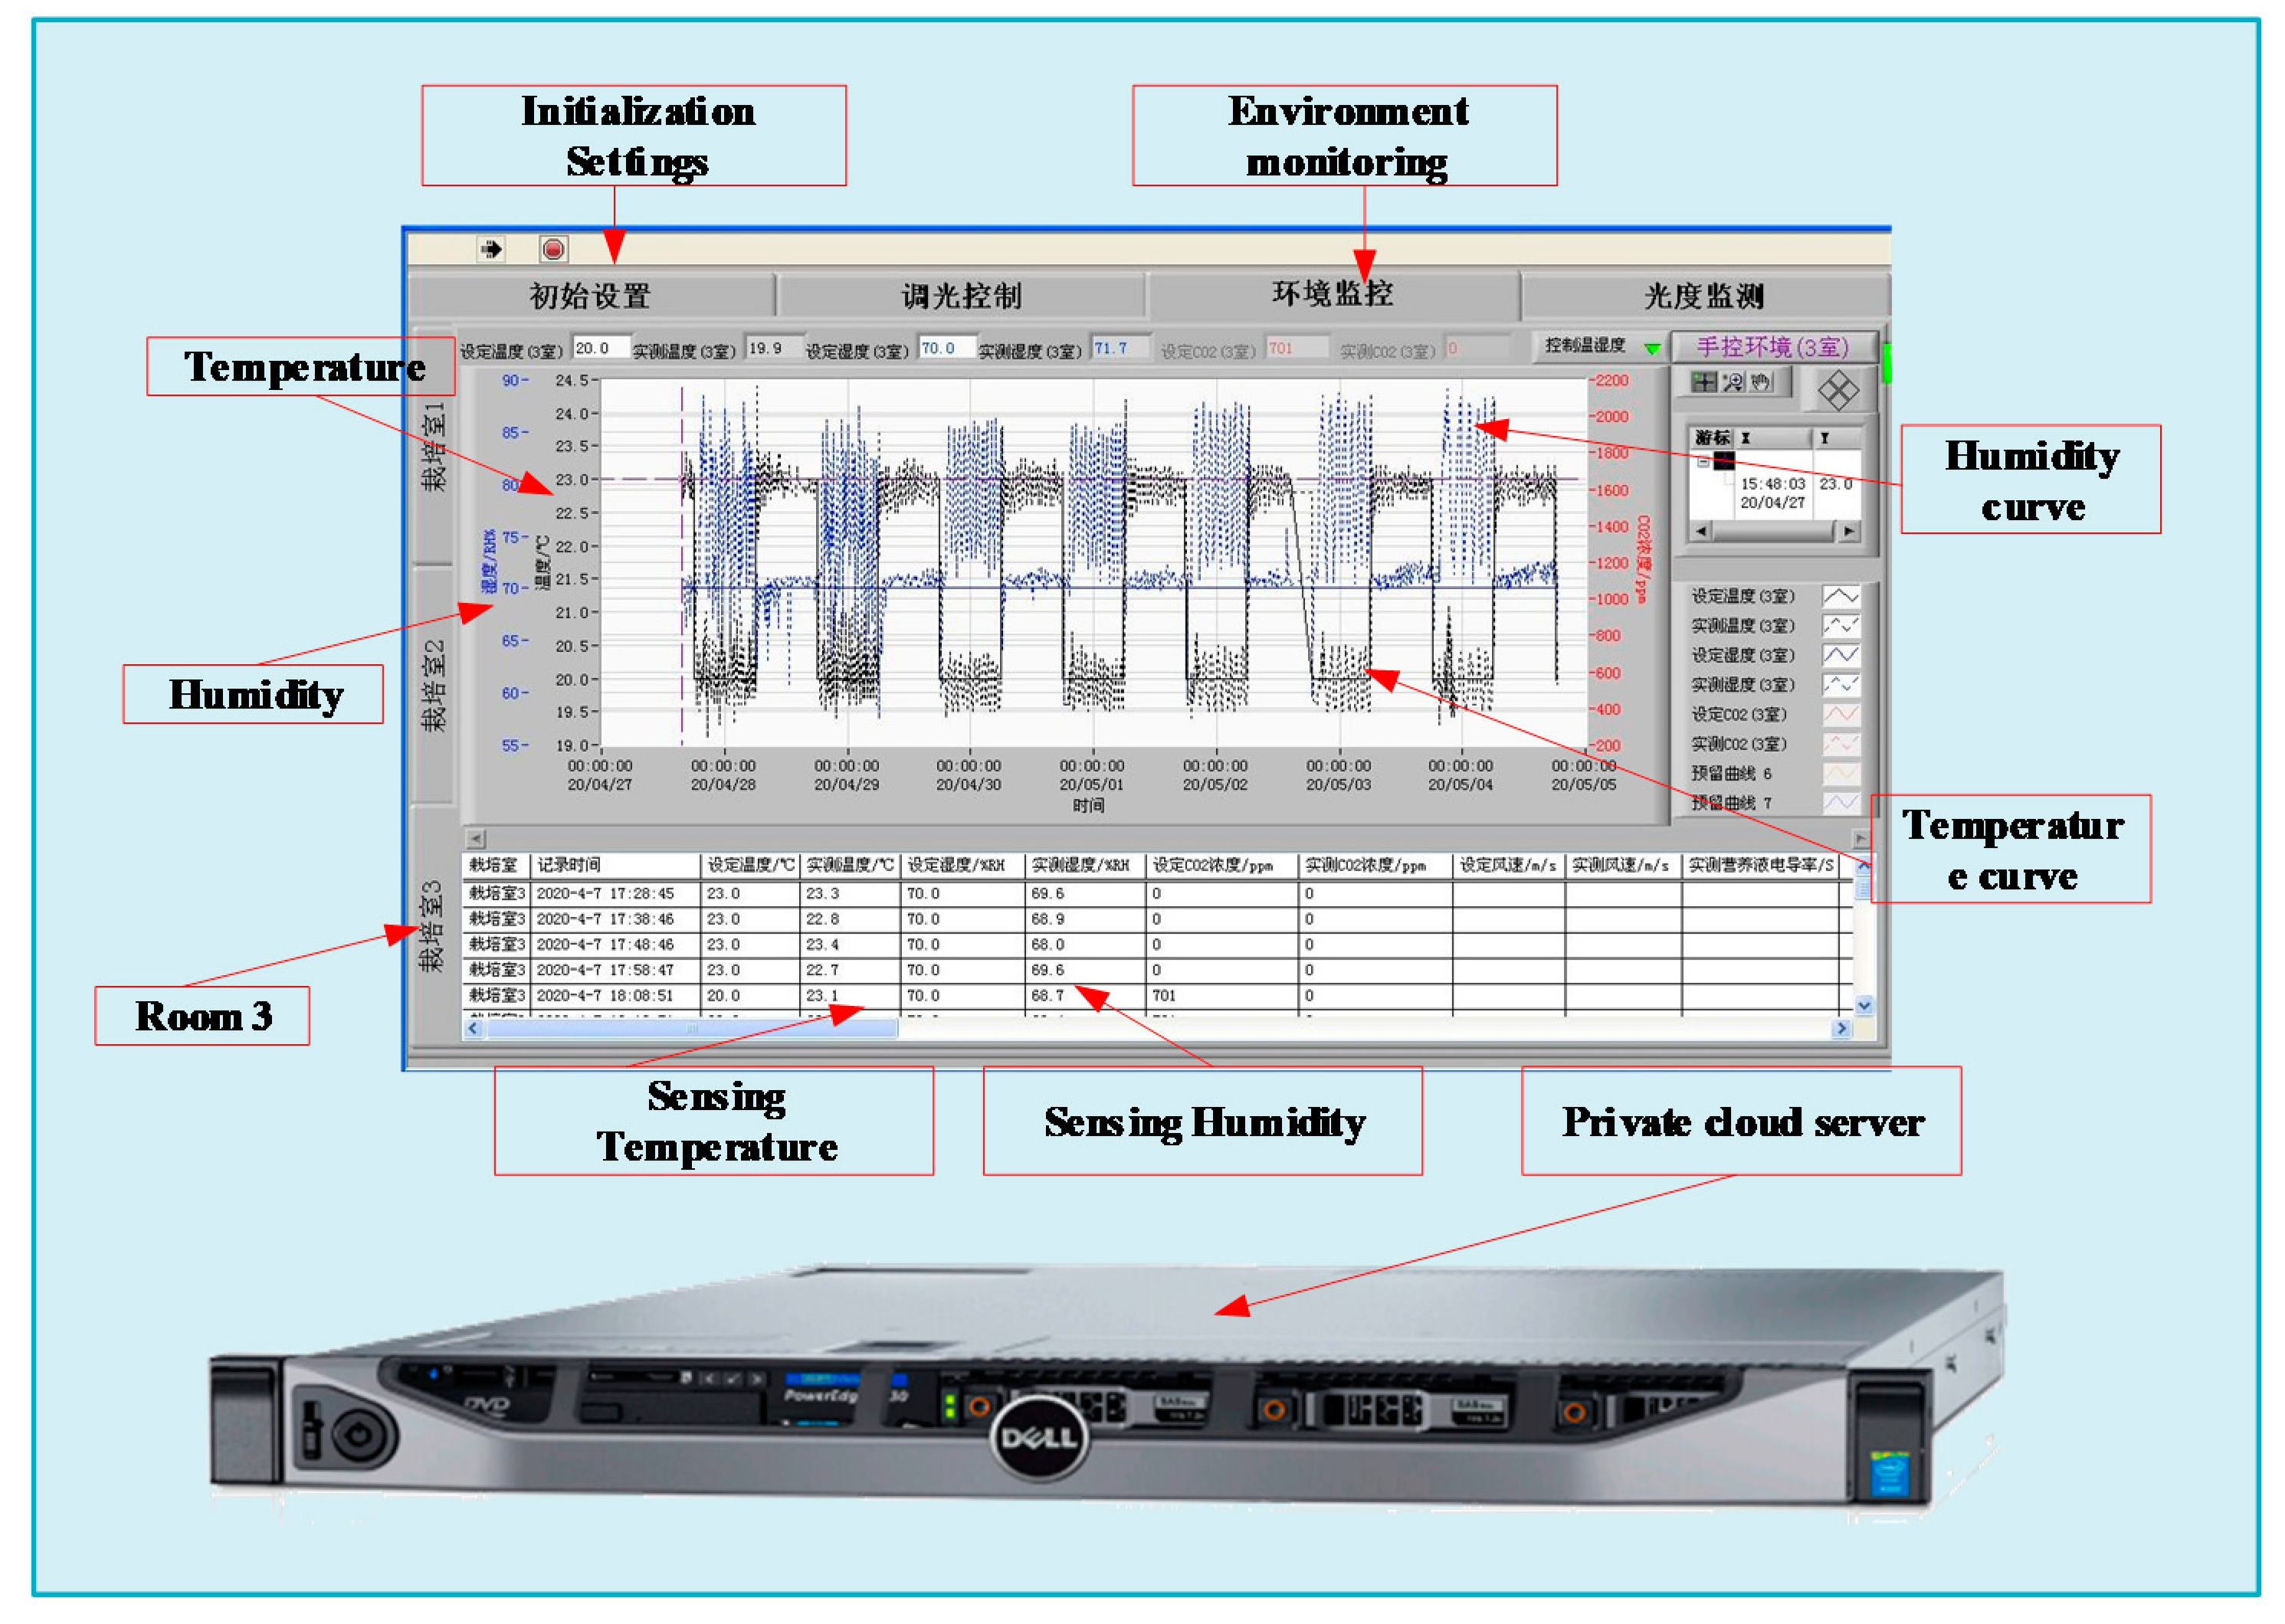
  • An experimental prototype is designed in an agricultural greenhouse to verify the proposed strategy and compare it with the existing methods.
The remainder of this paper is organized as follows. Section 2 introduces related work about data sensing in agriculture and SDWSN. Section 3 describes the proposed agricultural data sensing framework based on a wireless network and SDN technologies. Section 4 introduces an effective data sensing method consisting of three steps. Section 5 experimentally evaluates the proposed approach and discusses the obtained results. Section 6 concludes the paper.

2. Related Work

This section reviews the existing solutions to the data collection problem in the agriculture and SDWSN fields.

2.1. Data Collection in Agriculture

As mentioned, data collection is an essential part of smart agriculture; therefore, different data collection methods have been developed. In Reference [17], Long and Mccallum proposed an on-combine multi-sensor system for collecting different parameters of grain yield, grain protein concentration, and straw yield at the same spatial resolution as the grain yield. For low-latency monitoring in agriculture, Y. Kim et al. [18] proposed a sensor network architecture based on mobile robots, where alert messages were sent to the terminal after being processed by the intelligent database. Srbinovska [19] proposed deploying a wireless sensor network to collect the environmental parameters for controlling the drip irrigation and facilities in a pepper vegetable greenhouse. Estrada-López et al. [20] designed a WSN to monitor and gather soil conditions. Moreover, spatial distribution maps were created at two different levels below the ground. Henry et al. [21] collected the in-hive temperature, relative humidity, and sound using a data gathering system, and these data were delivered to the server via Wi-Fi. In order to measure environmental variables in freshwater fishpond aquaculture, Bing et al. [22] proposed a monitoring system based on a WSN. Additionally, the authors presented hardware and software schemes of different WSN nodes.
The aforementioned studies employed WSNs to collect heterogeneous data for smart agriculture, but these methods are based on static networks and lack the consideration of data effectiveness for CE. Meanwhile, there is a large redundancy in collected data, which increases the working load, communication latency, and energy consumption.

2.2. Software-Defined WSNs

Recently, the improvement of network flexibility has become a research hotspot. Dobslaw et al. [23] introduced an integrated cross-layer framework by routing and scheduling configurations for a backbone with the gateway that guaranteed that the application-specific constraints would be built. Costa et al. [24] designed a dynamic configuration of visual sensors based on a fuzzy approach to realize the sensing, coding, and transmission patterns by exploiting different types of reference parameters. With the development of sensor networks, SDNs have become a promising way to realize dynamic configuration [25,26]. Zeng et al. [27] designed an energy-efficient sensor schedule and management strategy based on software-defined sensor networks with the guaranteed sensing quality for all tasks. Li et al. [28] designed a data flow splitting optimization strategy for solving the problem of traffic load minimization in SDWSNs by considering the selection of optimal relay sensor nodes and the transmission of optimal splitting flow. Jun et al. [29] proposed an approach for the effective collection of traffic packets generated from base stations and edge servers (ESs) via node selection and dynamic sampling duration allocation in the SDN frameworks. A situation-aware protocol switching scheme for SDWSNs was presented by Misra et al. to meet the application-specific real-time requirements, which contained decision making and protocol deployment [30].
The mentioned works have provided references for effective data collection for CEs and proved that the software-defined sensor networks represent optimal solutions for data sensing in agriculture. Meanwhile, with the development of the SDN and WSN, the SDN has not been used only for routing, networking traffic optimization, but also for other tasks, such as defining sensing and coverage control in WSN. The related information can be found in [24,27]. In this paper, SDN is used to dynamically adjust the relevant parameters of data sensing, and realize software defined data collection. However, these studies have seldomly focused on the CE data collection, and there have been many redundant data types in data collection.

3. Data Collection Framework for Critical Event Combing Edge Computing and SDWSN

The data collection parameters are set in the traditional sensing network, it is difficult to change parameters dynamically to meet actual requirements of event monitoring, especially critical events. Namely, the traditional sensing networks can difficultly change data-collection or sensing parameters (e.g., sensing data types, sensing period) dynamically. Following the idea of the SDN, SDWSN is adopted in the proposed framework. Particularly, the SDWSN realizes dynamic configuration of parameters in the processes of data sensing and collection in WSN [24]. At the same time, the lack of computing resources at the sensing system edges, which makes it difficult for WSN to respond effectively in monitoring specific events. Therefore, the traditional frameworks for data collection lack flexibility, and the low latency performance is unsatisfactory, and much computing resources are needed. In the paper, the focus is on data sensing by the SDWSN, which determines the sensing nodes for monitoring CE and sensing data types for each node. Thus, edge computing and SDWSN are introduced in our proposed data collection framework. The proposed framework is presented in Figure 1, and the details of the proposed framework are given in the next sections.

3.1. Framework Overview

The fixed loop data collection strategies of conventional systems lack flexibility when needed to dynamically adjust the network or sensing parameters for particular CEs. Furthermore, the collected data usually contain information that is ineffective for event monitoring. Therefore, the upper layer systems have to devote efforts to extract these event-related data, which increases time and energy costs.
As shown in Figure 1, the proposed framework contains four components: wireless sensor network, SDWSN layer, edge computing layer, and application layer. The WSN consists of sensor nodes and access points. The sensor nodes are equipped with various sensors, such as soil humidity sensors, light sensors, and crop images sensors. The function of access points is to provide an effective link between sensor nodes and edge servers on the cloud. Meanwhile, the SDWSN is adopted in the proposed framework to increase the flexibility of data collection system and the key network nodes, such as access points (APs). Cloud computing provides the data processing and storage capacity to the application layer. Besides, the cloud-enabled applications are categorized into data visualization, user demand analysis, and system management.

3.2. Proposed Framework Working Principle

The working principle of the proposed framework can be divided into two main steps. In the first step, the cloud server (CS) obtains the main features of each CE, such as data collection types, by using big data analysis technologies. Then, edge server (ES) determines the CE according to the difference between the current sensing value and the feature value of each CE. Then, the required parameters, such as the number of selected sensor nodes, the number of data types, and data types, are optimized using the CE features, and the corresponding sensing arguments are sent to the SDWSN controller. Next, sensor nodes get the information on the sensing data types and communication parameters considering the current CEs from SDWSN severs. Besides, the parameters can be dynamically adjusted.
In the second step, the SDWSN controller sends the related control flows to the AP, which contains the data collection commands and other parameters. Then, these data are delivered to the corresponding management destinations, e.g., cluster heads and cloud centers. Finally, data mining is conducted on the cloud, and the analytic results are forwarded to the related applications, such as data visualization.

4. Edge-Assisted Effective Data Collection Design

This section describes the proposed effective data sensing algorithm incorporating edge computing and SDN. The efficient data sensing algorithm includes three steps: Predictive data selection by exploiting historical data, event identification by edge computing, and data sensing with time constraints.

4.1. Sensing Data Type Selection by Exploiting Historical Data

Mutual information (MI) is an optimal method for feature selection. Therefore, in this study, the MI is used to determine the sensing data type (SDT) using the historical data on events. Assume X = ( x i j ) n × m is the historical dataset including n sampling vectors and m data types; S = ( s 1 , s 2 , , s m ) denotes its vector form, and V j is the value domain of s j . Further, X can be divided into k categories with a value domain V k . According to the MI theory, the MI of s j and k can be defined as:
I ( s j , c ) = v j V j v k V K p ( v j , v K ) log 2 p ( v j , v k ) p ( v j ) p ( v k )
where p ( v j , v k ) denotes the probability that a value of s j is v j and a value of k is v k . The larger I ( s j , k ) is, the greater the relevance between s j and k will be. After the MI between the SDT and k is calculated, the SDT is sorted in the descending order. Then, the MI between two SDTs ( ( s j , s l ) and j , l m ) can be obtained. The SDT MI of ( s j , s l ) is calculated by:
I ( s j , s l ) = v j V j v l V l p ( v j , v l ) log 2 p ( v j , v l ) p ( v j ) p ( v l )
According to Equation (2), the sorting sensing data type set (SSDTS) associated with the event type is obtained.
However, in real applications, the SSDTS redundancy should also be considered. Thus, a metric to evaluate the redundancy should be defined. Assume G represents an SSDTS, then the standard Gs formulation is defined as follows:
G S = s j G I ( s j , k ) s j , s l G I ( s j , s l )
A larger value of GS indicates that the SSDTS member has a greater degree of association with event k, and there is less redundancy between the SSDT members.
Assume there are k events, then the events historical dataset can be expressed as:
X = { X 0 , X 1 , X 2 , , X k }
where X 0 denotes the value of the normal situation in smart agriculture, which means there are no CEs. Therefore, the extensibility dataset of X i k can be obtained by:
X i + = X i X 0
Moreover, X can be divided into many sub extensibility datasets for obtaining a small number of related SDTs, which can be expressed as:
X = { X 1 + , X 2 + , , X k + }
Accordingly, the MI and standard GS can be used to create a strategy for selecting a sensing data type for different events to reduce both the number of SDTs and the sensing time.
The proposed method is given in Algorithm 1. The steps of Algorithm 1 can be described as follows. First, as given by Equation (6), the historical dataset is divided into many sub-datasets while considering the number of events. For obtaining the SSDTS of each event, the SDT is sorted in accordance with the MI of each member. Moreover, based on the values of GS, the redundancy is deleted, and the low correlation is removed from the selected SDT set.
Algorithm 1 Sensing data type selection based on the MI
Input: X; k; S
Output: G
1.Initialize X { X 1 + , X 2 + , , X k + } , G
2.for   i 1   t o   k , S S , G k //for each event
3.    for j 1   t o   m //for each data type
4.        each  s j S , calculate I ( s j , c k ) .
5.        if I ( s j , c k ) > I 0
6.             G k G k { s j } , S S \ { s j }
7.        Sort  G k in descending order in light of  I ( s j , c k )
8.      until S =
9.     G k s 1 G k , G k G k \ s 1
10.    for l 1   t o   | G k |
11.        each  s l | G k | calculate G S ( s l ) G S ( G k )
12.        if G S ( G k + s l ) > G S ( G k )
13.         G k s l G k , G k G k \ s l
14.      until G k =
15.     G G k
16.until i = k
17.return  G

4.2. Event Identification Based on Edge Computing

In Section 4.1, the sensing data type set G is selected for each CE on the cloud servers (CSs) according to the historical dataset. This section focuses on event identification by finding the minimum variance of an event on the edge server. Specifically, the details of the even identification method are given in Algorithm 2.
Algorithm 2 Event identification method based on the minimum variance
Input: G; Output: E d
1.Initialize G R G 1 G 2 G k , G
2.for i 1   t o   k //for each event
3.    Clean the historical dataset X
4.    Normalized historical dataset X according to Equations (8) and (9)
5.    Averaged the normalized dataset
6.untili = k
Randomly select node for routine data sensing
7.Collect sensing data
8.for i 1   t o   k // Calculate an average variance of each event
9.     v m i ( g j ( i ) x j ( i ) ) 2 | G i |
10.     V M v m i
11.untili = k
12.Find the minimum value of VM.
13.Identify the event type Ed based on the minimum value of VM.
14.returnEd
As shown in Algorithm 2, first, a few nodes are selected to monitor all the agricultural events by sensing the most relevant data types. Then, based on the sensing data type set G , the routine sensing data types G R can be obtained by:
G R = G 1 G 2 G k
For reducing the error caused by dimensional difference, self-variation, or large numerical difference, the normalization should be conducted. Subsequently, according to G , the historical dataset X = { X 0 , X 1 , X 2 , , X k } , which includes only the most relevant data types, can be normalized as follows:
x = x x min x max x min
The normalized dataset is averaged in the light of data types to identify events easily. Through a series of processing, the i-th ( i k ) event dataset can be expressed as:
X ( i ) = { x 1 ( i ) , x 2 ( i ) , , x | G i | ( i ) }
Assume that the routine sensing data value of the i-th ( i k ) event is G R ( i ) = { g 1 ( i ) , g 2 ( i ) , , g | G i | ( i ) } , then the average variance of the mean ( v m i ) can be calculated by:
v m i = ( g j ( i ) x j ( i ) ) 2 | G i |
Then, all the event variances of the mean set V M = { v m 1 , v m 2 , , v m k } can be obtained. Finally, the current event type is identified by calculating the minimum value of V M .

4.3. Data Sensing with Time Constraints in SDWSN

In the section, the data sensing process with time constraints in an SDWSN is introduced.
In a WSN cluster, A denotes a set of sensor nodes A = { a 1 , a 2 , a 3 , , a | A | } , and B denotes a set of data types of each node B = { b 1 , b 2 , b 3 , , b | B | } . For each event, the data collection time T c includes the sensing time T s , communication time T T , and data retransmission time Δ , which is given by:
T c = T s + T T + Δ = b i B t s ( b i ) + b i B a i A d s b i ( a i ) v a i + a i A δ ( a i )
According to Equation (11), the energy consumption of an event can be defined by:
T c = α T s + β ( T T + Δ )
Assume that sensing time t s ( b i ) , data size d s ( a i ) , and communication speed v a i are constant values ( t s ,   d s ,   v ), and the data retransmission δ ( a i ) is close to zero. Thus, Equation (12) can be simplified as follows:
T c = t s | B | + d s | A | | B | V
Therefore, let T d e a d l i n e be the deadline for a data collection time. Therefore, the time constraints for data collection can be expressed as:
T c = t s | B | + d s | A | | B | V T d e a d l i n e .
In practical systems, in order to obtain effective monitoring areas, the number of nodes | A | can be determined by adopting covering strategies, for instance, 95% coverage. According to Equations (12) and (13), the number of data types can be determined by:
| B | = T d e a d l i n e V t s V + d s | A |
Finally, the SDN sever drives the WSN to finish the data collection within the time constraints. The pseudocode of the data sensing method is given in Algorithm 3.
Algorithm 3 Sensing method with time constraints based on SDN
1.Initialize Ed, V, ts, T d e a d l i n e
2.Adopt covering strategies to determine the sensing node set A
3.SDN sever rouse A to prepare for Ed
4.According to T d e a d l i n e calculate the number of data types
5.     | B | T d e a d l i n e V t s V + d s | A |
6.SDN sever drives A sensing | B | data types
7.for i 1   t o   | A | //WSN node to collect data
8.    for j 1   t o   | B | //for each data type
9.        Sensing and collect data from node s j
10.        Save the data
11.    until
12.    Transmit the data to the cluster head
13until i = | A |
14Return finish the data collection flag

5. Experiment and Results

The proposed approach was evaluated experimentally and compared with two classical data collection methods, the ASDT method and the PNDT method. The performance of the data collection was evaluated in terms of data size, energy consumption, data collection time, and the proportion of unrelated data.

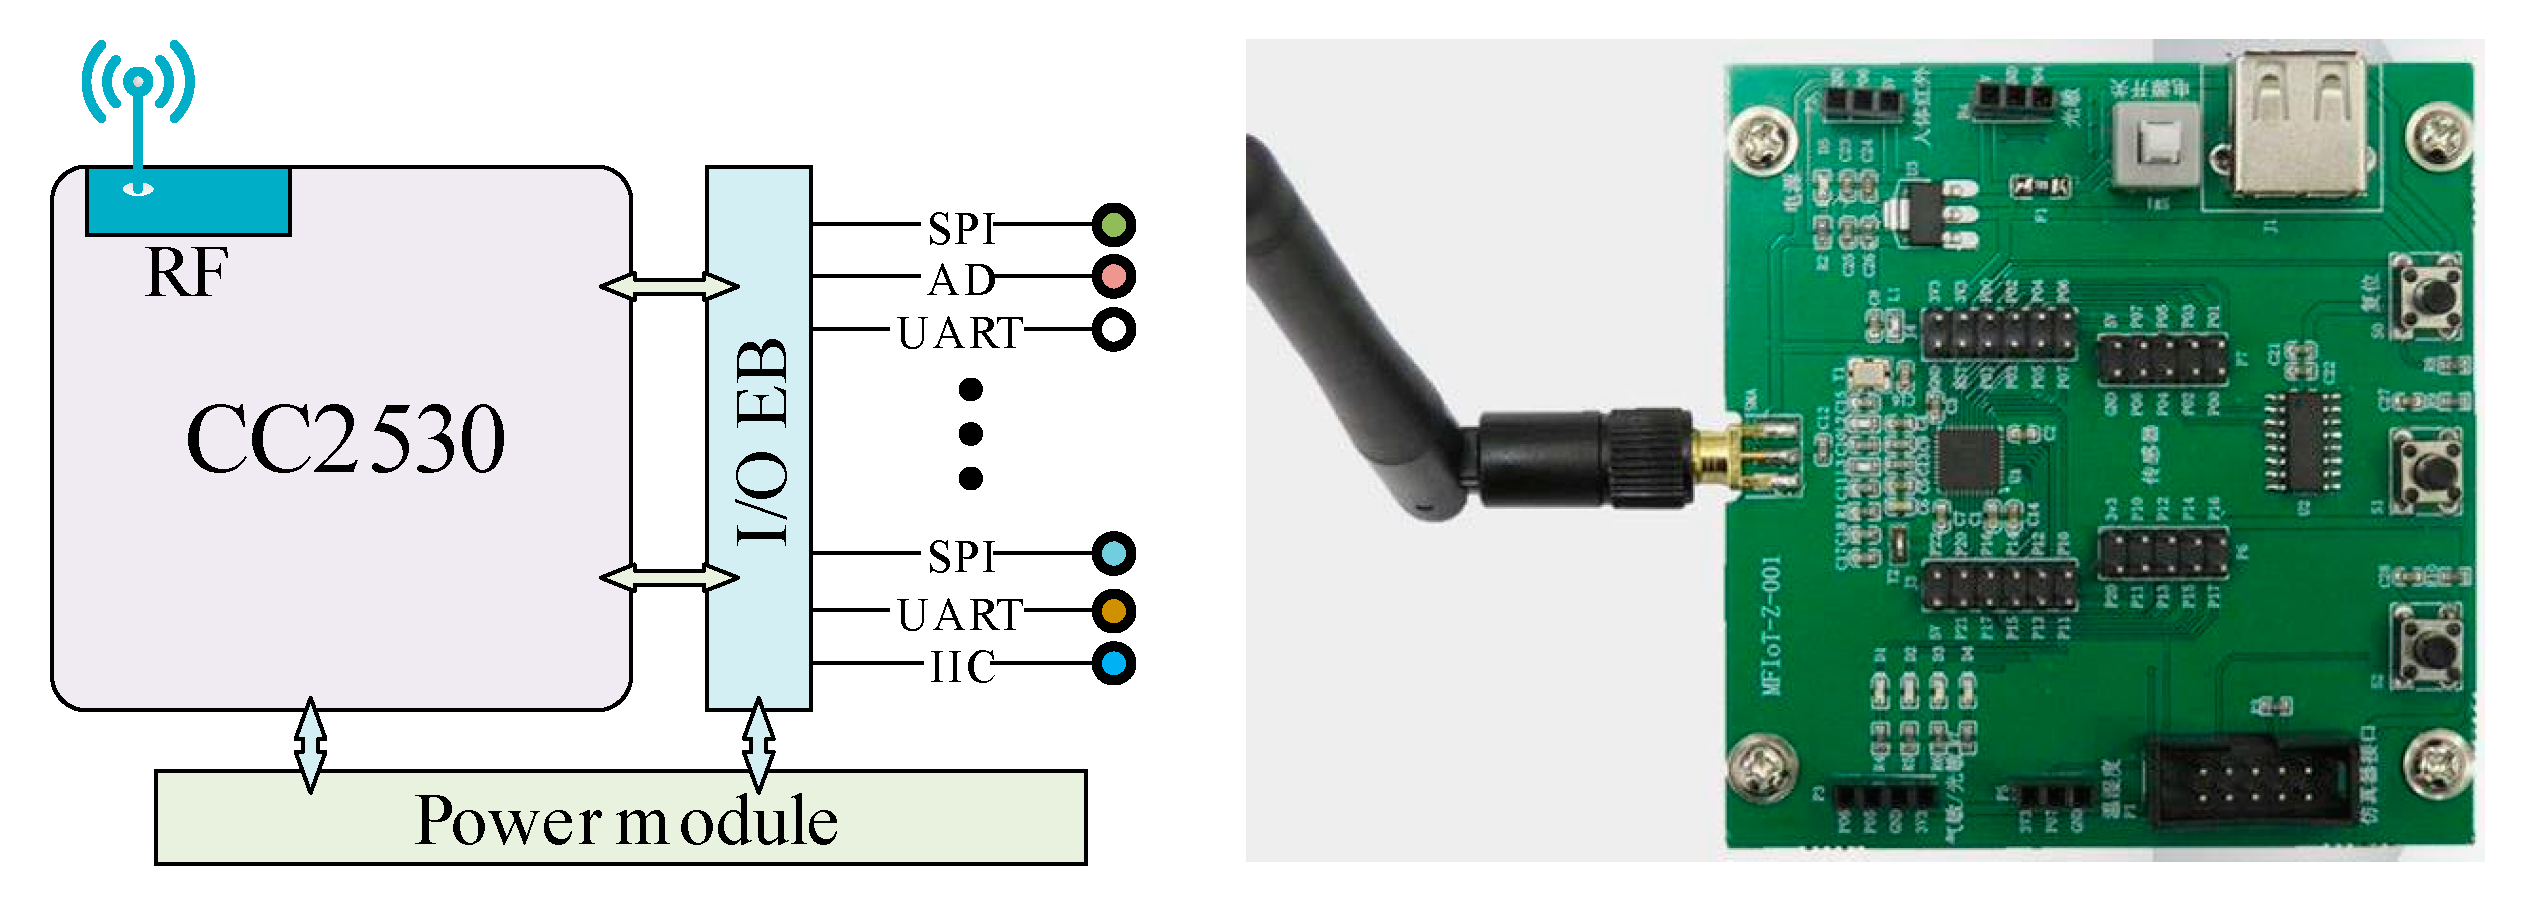
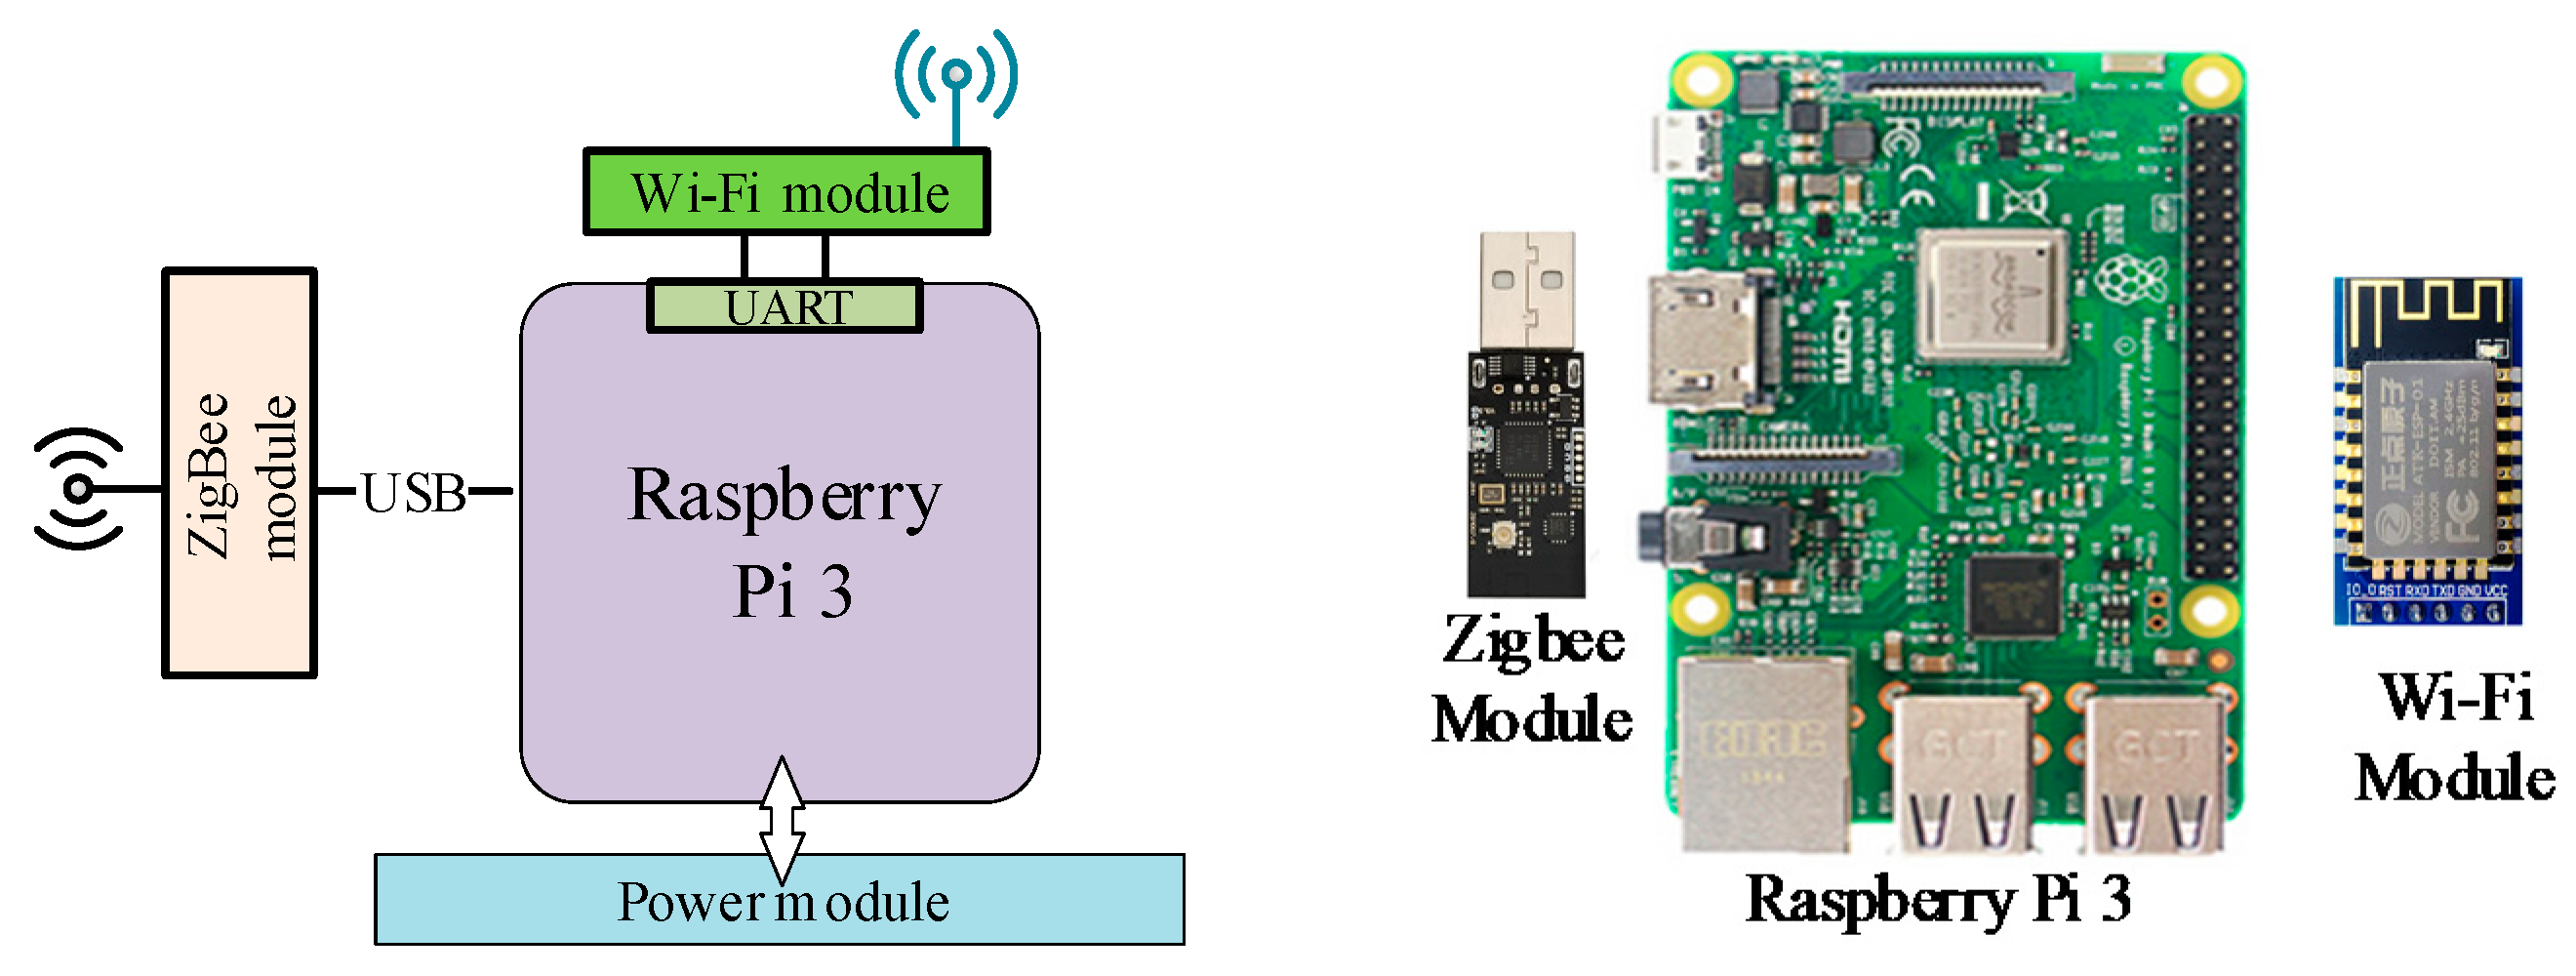
5.1. Experimental Setup

In order to analyze the proposed data sensing strategy, an experiment with a multiple-sensor WSN and edge computing was performed. The experiment system block diagram is given in Figure 2. The experimental platform was constructed in a greenhouse with four rooms. As Figure 2 shows, the platform consisted of three parts: WSN, edge computing layer, and private cloud servers. The experimental process was as follows. First, experimental modules were deployed in the greenhouse. Next, different data collection methods were used on the platform to obtain the related experimental results. Particularly, the WSN sensing data were obtained by the traditional methods and our proposed algorithm, and the sensing data were delivered to the edger server. Then, the data were sent to the private cloud server via wired networks. Finally, the results were analyzed from different aspects.
The construction and physical image of the WSN nodes are given in Figure 3. The WSN nodes consisted of a microprocessor, power module, sensor, and RF module. The nodes were constructed based on CC2530 with IEEE 802.15.4 structure to meet the requirement for low energy consumption. The multiple sensors for environmental monitoring of the greenhouse were directly linked to the MCU by the interface sharing technology and I/O expansion board (I/O EB). The parameters of the sensors are given in Table 1.
The structure of edge computing servers is displayed in Figure 4. In the edge computing layer, Raspberry Pi 3 with ZigBee and Wi-Fi modules were used as edge servers. Each edge server had a powerful processing capacity and was equipped with big data analysis tools or software. For creating an effective agricultural monitoring network, the clustered WSN was constructed by selecting the edge server as a cluster head. Meanwhile, the edge computing server was connected to the private cloud computing server via Wi-Fi. In summary, the greenhouse monitoring network consisted of the WSN, edge computing layer, and cloud server.
The private cloud server was constructed based on Dell R230, which had a quad-core processor and a hard disk with a capacity of 500 GB. The private cloud server was connected to the WSN and edge servers via a multi-hop hybrid network. Moreover, software was developed to store the sensing data. The execution screen of a private cloud server is presented in Figure 5.
After the construction of the above-mentioned experimental platform components, the data sensing network was deployed in a four-room greenhouse. The network topology of the experimental platform is presented in Figure 6. A clustered WSN was used in the experiment. For simplifying the experiment, the edge servers’ nodes played a double-role of cluster head and computing resources for WSN nodes. Eight different type sensors were integrated into WSN nodes; note that the air temperature and humidity sensing were integrated into one sensor. Next, five WSN nodes and one edge server were deployed in a single greenhouse room. Then, the sensing data were sent to the corresponding edge server via a ZigBee wireless network. Finally, edge servers delivered the WSN sensing data to the private cloud server via gateway and router.
Using the constructed components and network topology to evaluate the proposed algorithm, we first tested the sensor number, sensing time, sensing data size, sensing energy, communication times to edge and cloud servers, communication energy consumption, and data reception ratio (DRR). Subsequently, using the monitoring platform, an experiment was conducted to evaluate the performance of the proposed approach. In the experiment, a historical dataset included four critical events (I. air temperature; II. air humidity; III. CO2; and IV. soil humidity). For selecting the events, the selecting commands were delivered to the edge servers, and then according to the selecting commands, the edge servers determined the sensing nodes for each cluster and sensing data type for each node. As shown in Table 1, nine sensor types were used to select the related sensing data types by using the MI. Then, different methods were used to assess their performances by running a 20-node clustered WSN. Then, by using different methods and deadlines for each event, different parameters were measured by driving the WSN node to conduct the monitoring.
The data size, energy consumption, data collection time, and other indexes were used as evaluation metrics to assess the proposed strategy (called the SSDTS) through the comparison with the ASDT and PNDT methods. Based on the network topology presented in Figure 5, the working mechanisms of the three data collection methods were introduced. In the ASDT method, all sensor nodes were used to sense all the related data periodically. For instance, in a 60-s period, all sensor nodes sensed all nine parameters, as presented in Table 1. In the PNDT method, the part sensor nodes were selected to sense all the related data. Particularly, in the greenhouse room, two sensor nodes were selected to sense all nine parameters.

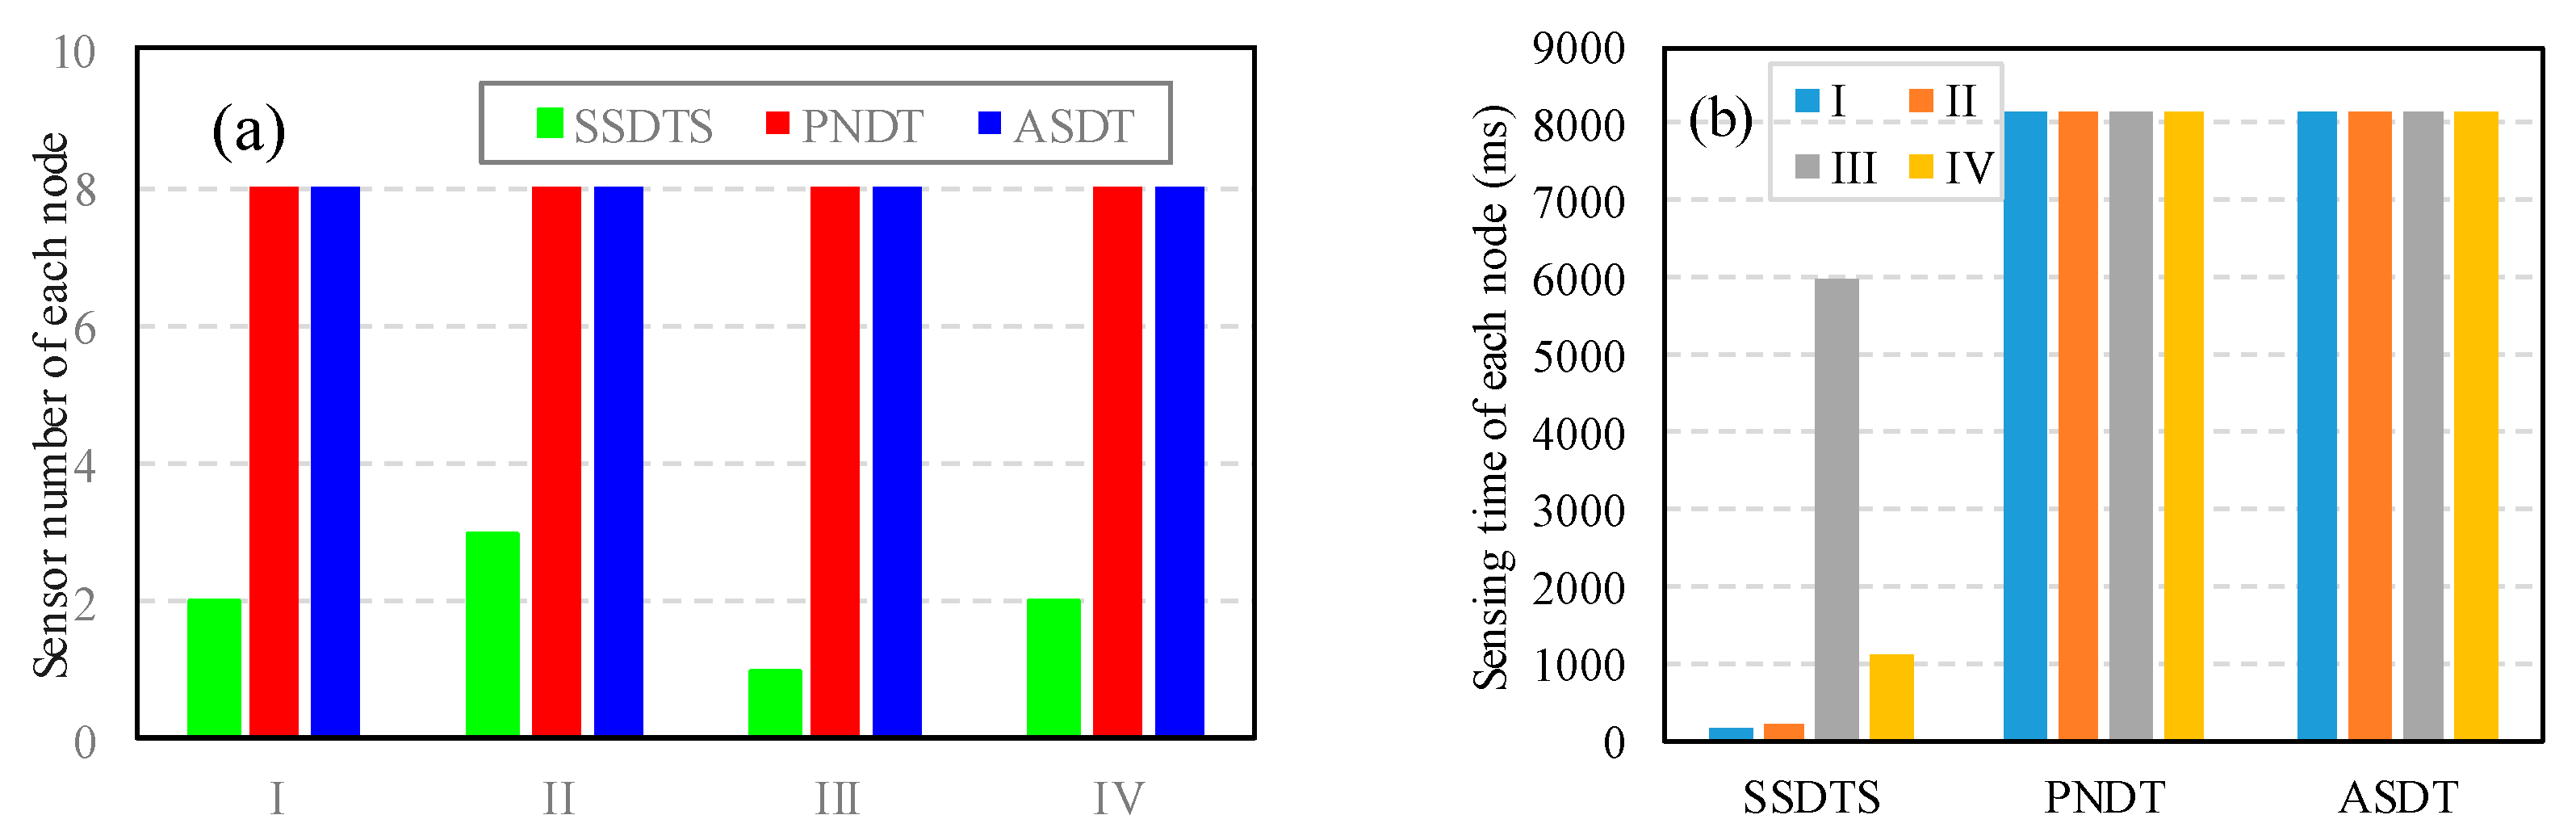
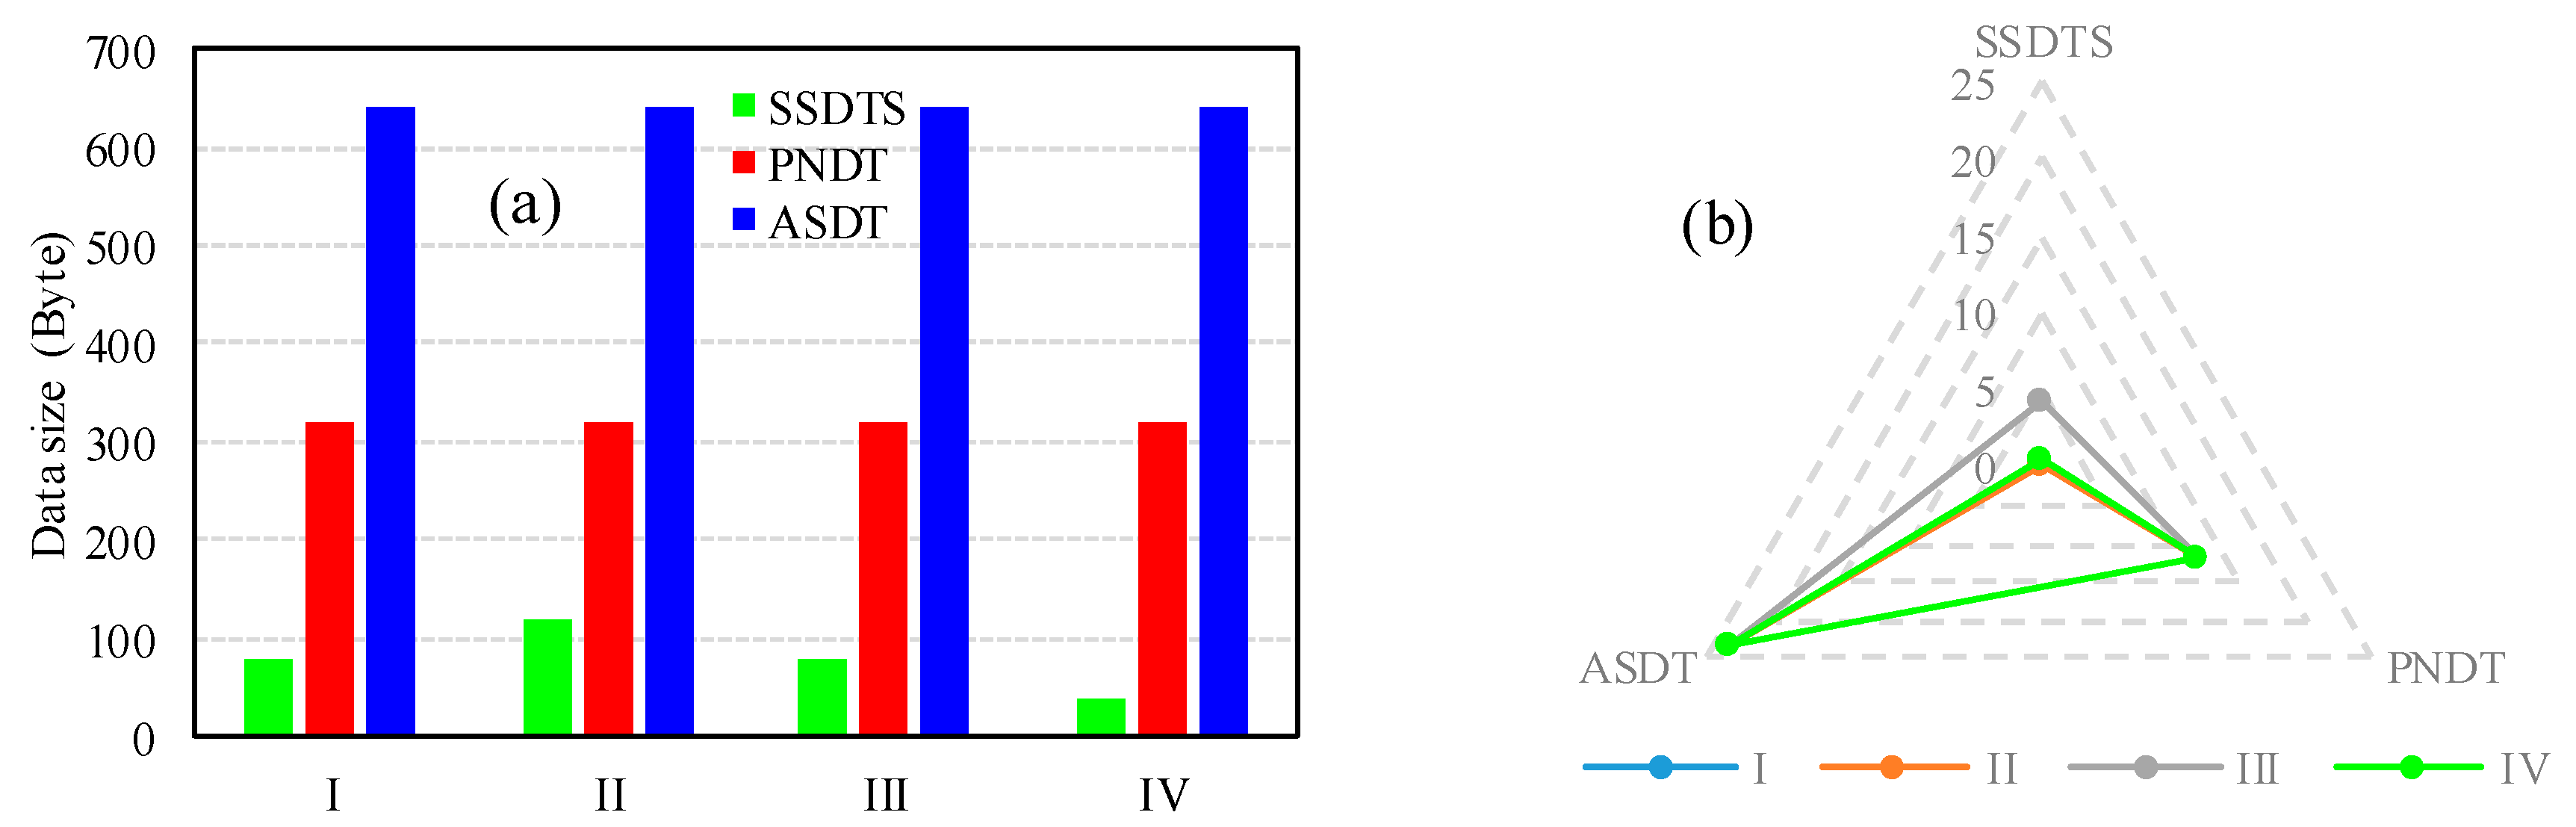
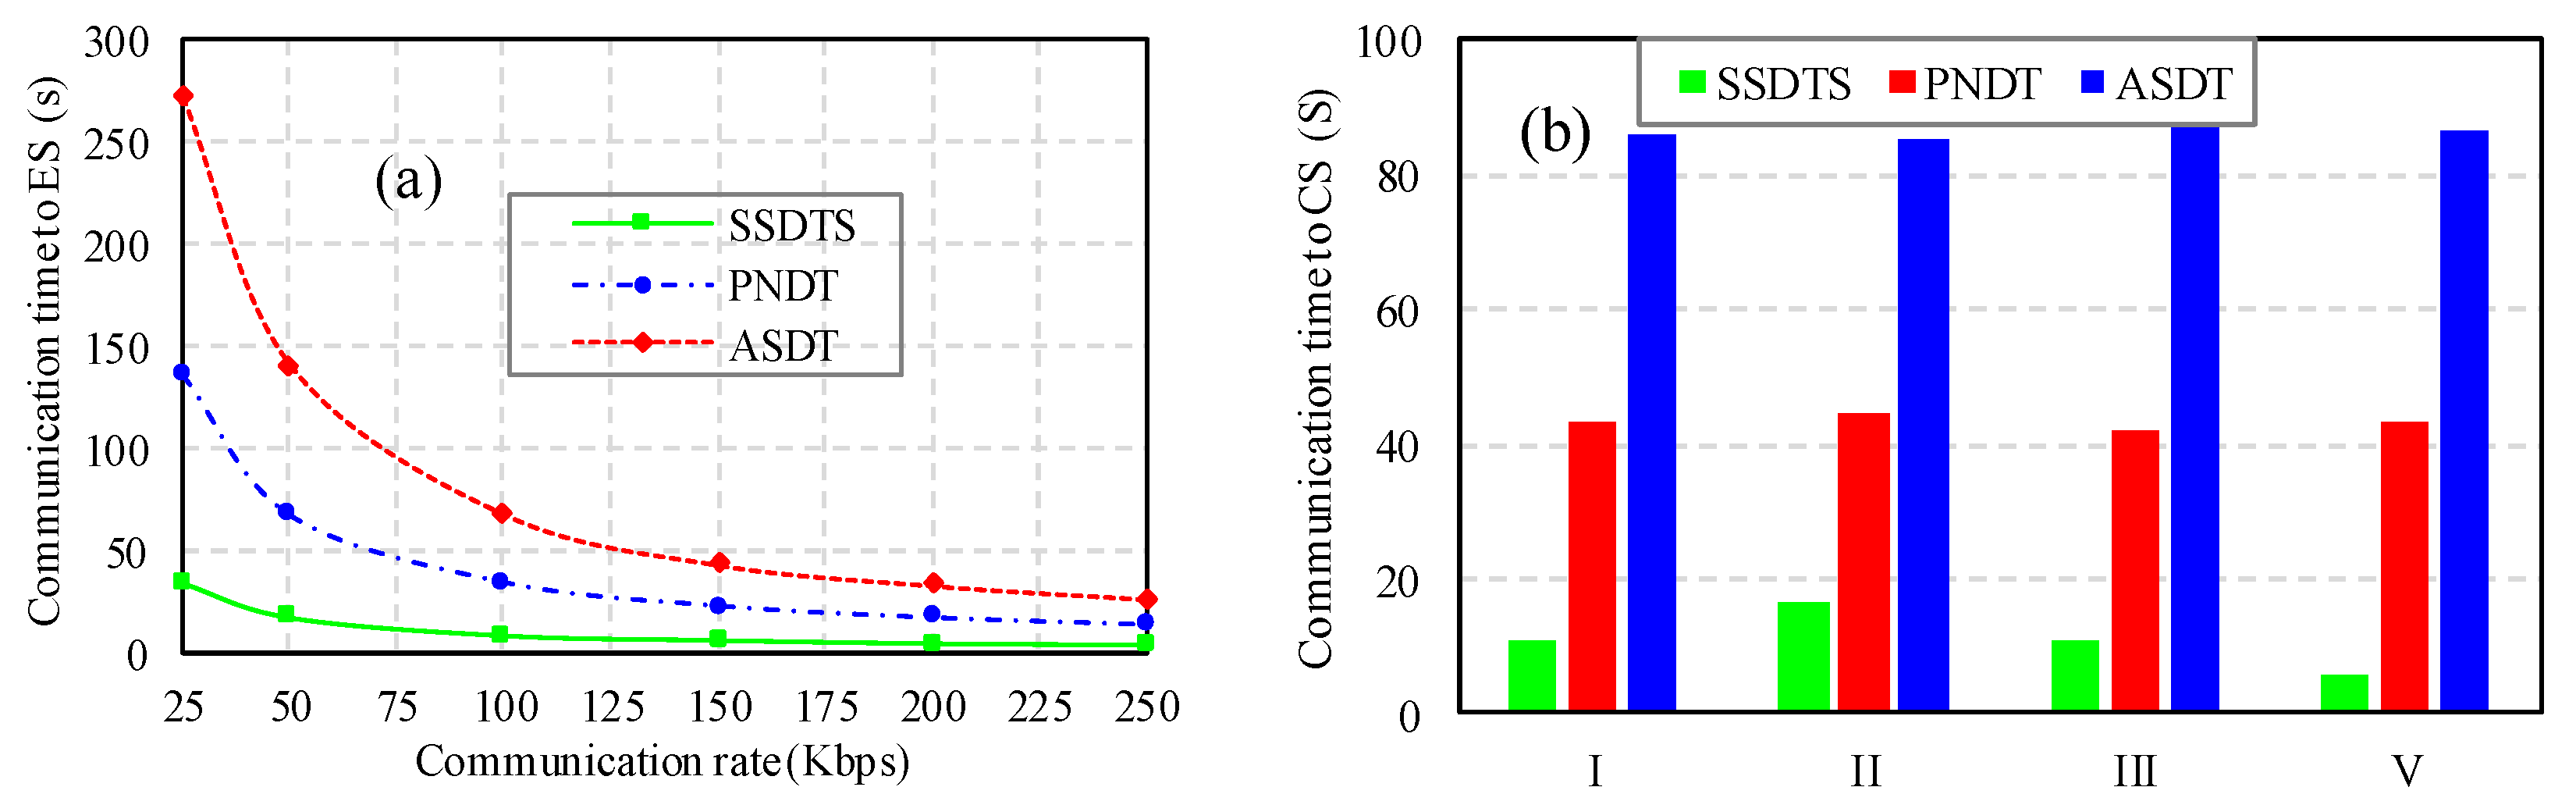
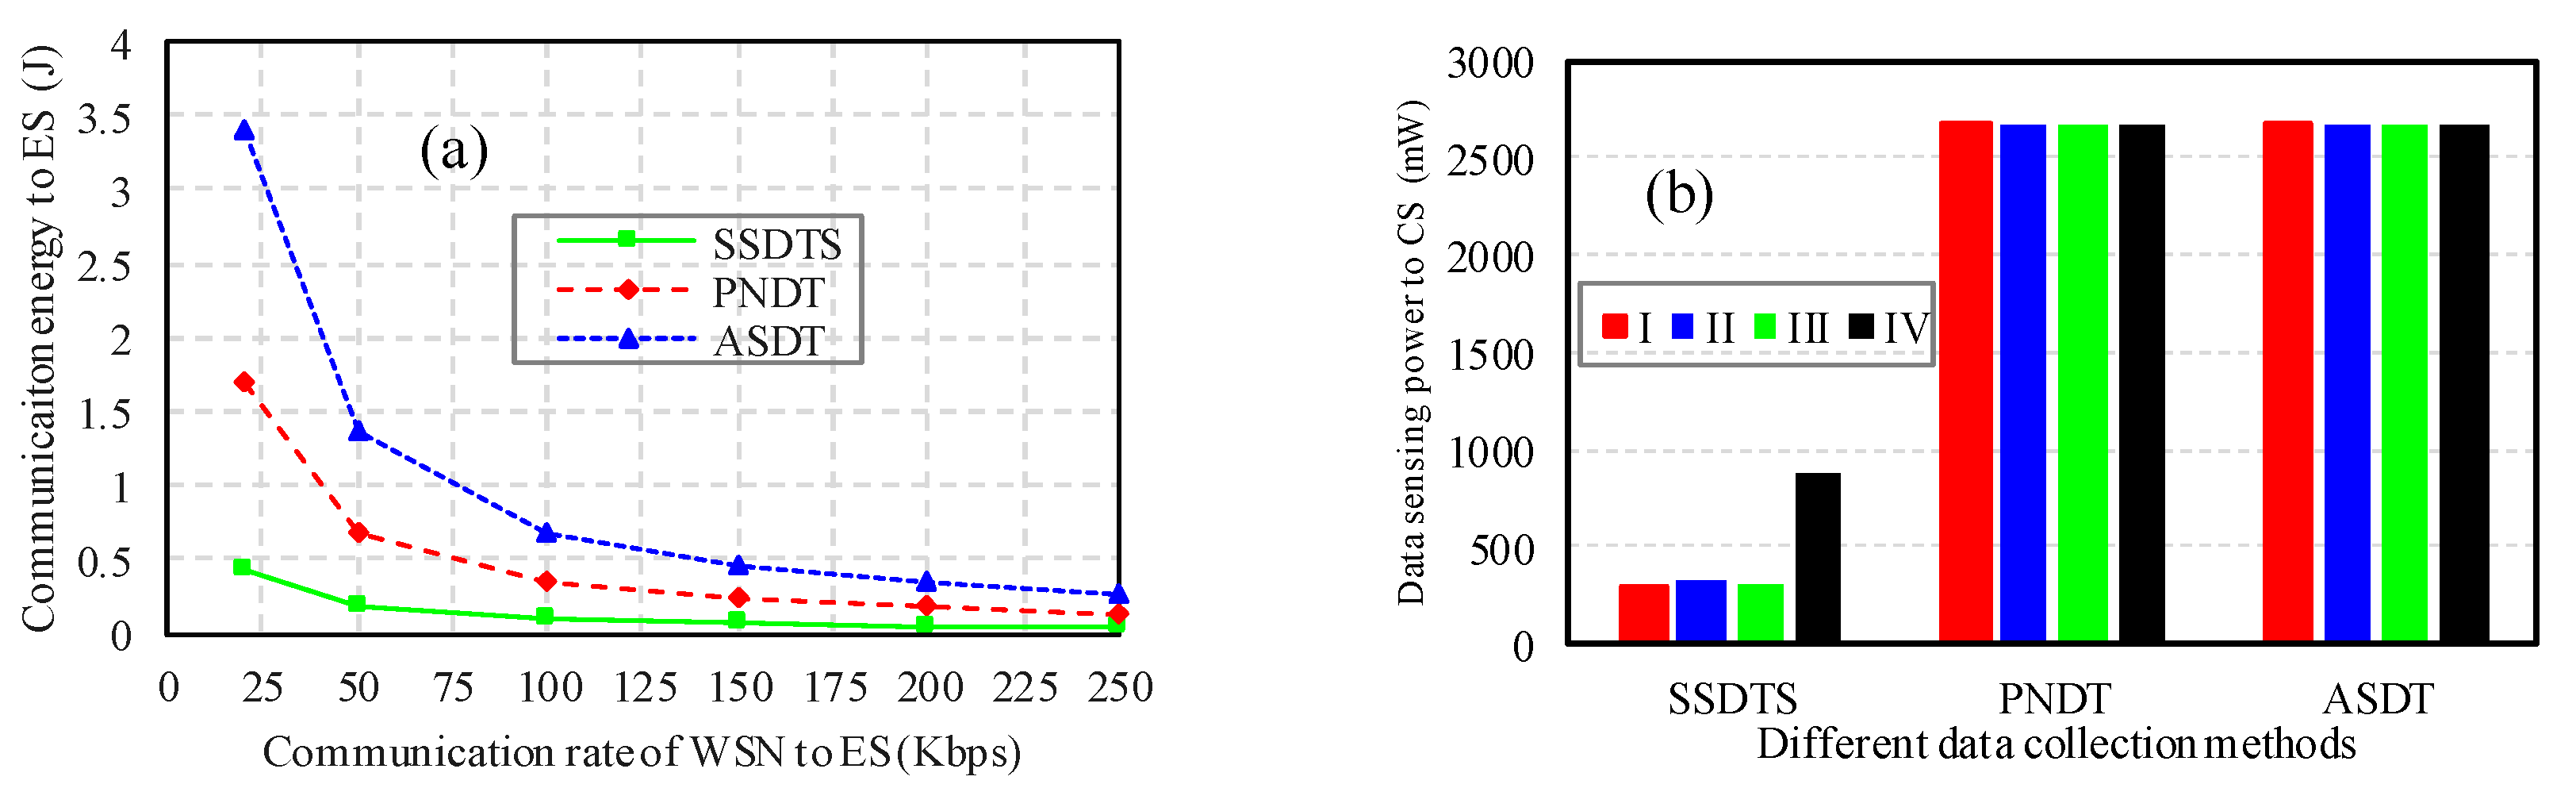
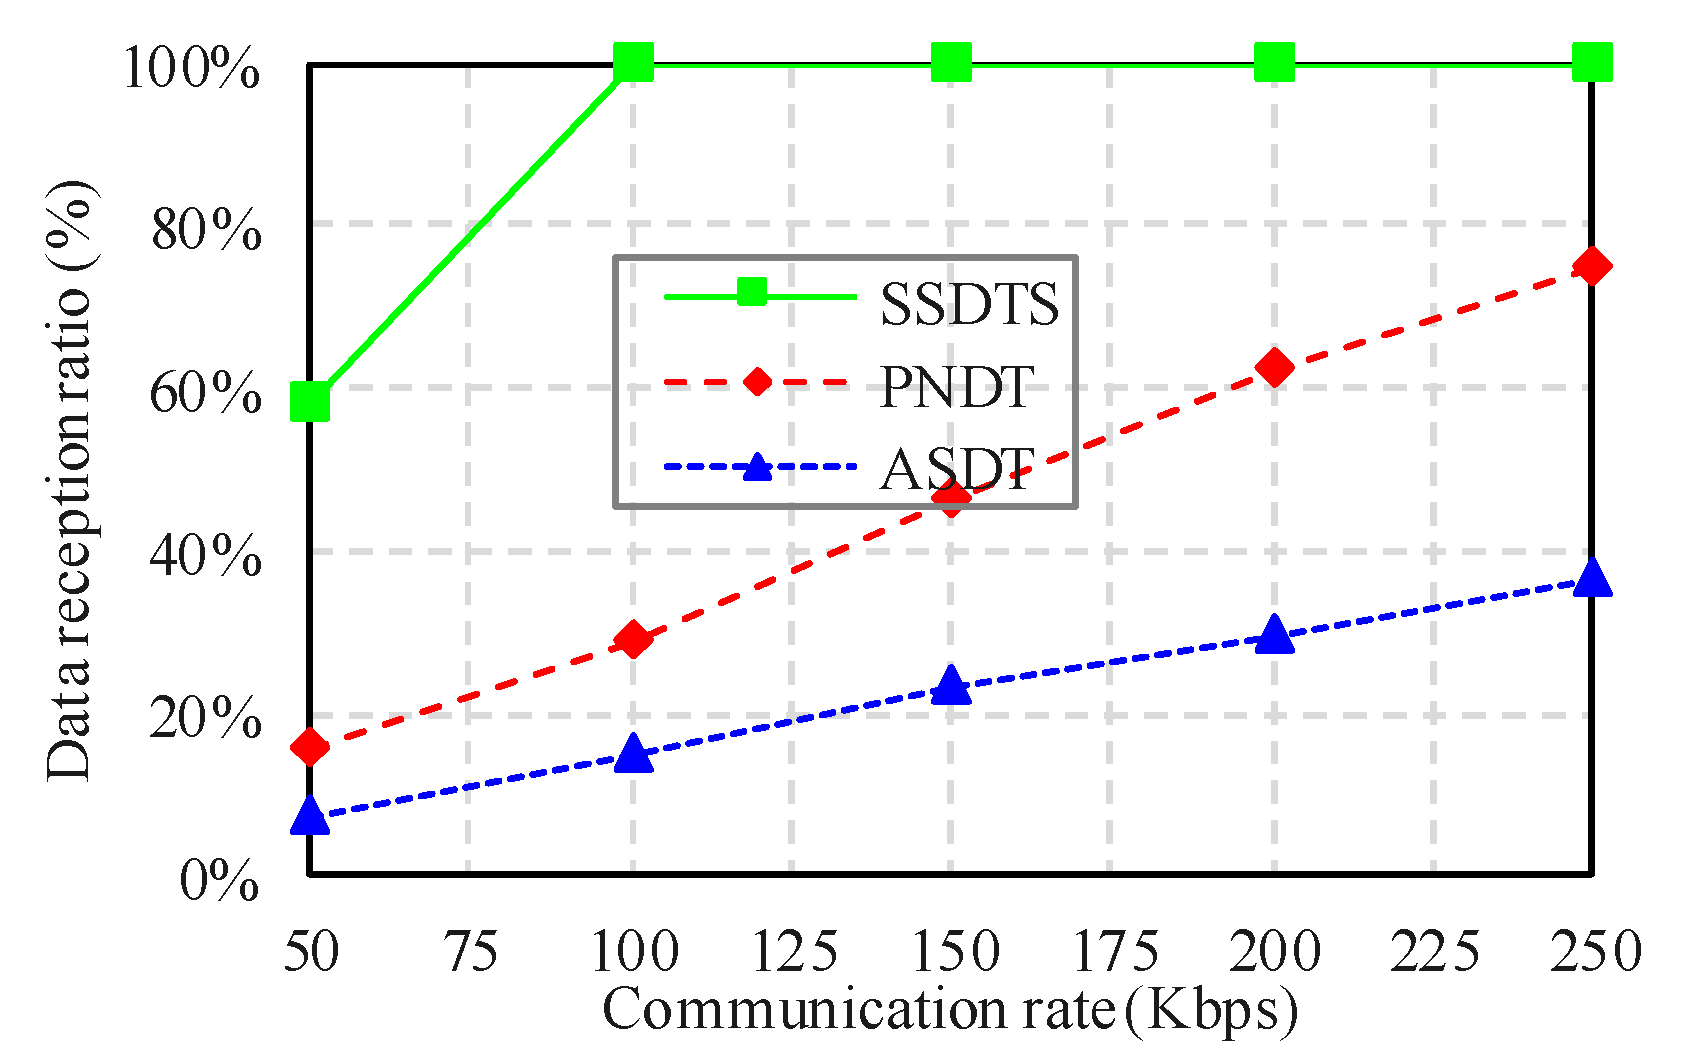
5.2. Results Analysis

Sensing time and energy consumption of sensor: Table 2 shows the average sensing time and energy consumption of sensors. For each sensor, the data size was the same, and it was 4 Byte, but the sensing time differed. Moreover, the data were transmitted via Wi-Fi to the edge server and cloud server in one and three hops, respectively. The WSN nodes were connected via ZigBee with a communication rate of 1–250 kbps, and the edge and cloud servers were connected at the communication rate of 100 Mbps. After testing, the working current of CC2530 was 35 mA at the transmitted power of 1 dBm, and the current of the Wi-Fi module was 180 mA. Also, after testing, the communication energy consumption of ZigBee nodes was 0.105 W. Meanwhile, the energy consumption of Wi-Fi communication between the edge and cloud servers was 0.9 W.
Sensor number and sensing time of each node: The sensor number and sensing time of each node for different methods and events are shown in Figure 7. As can be seen in Figure 7a, with the increase in the number of sensor types for different events that were optimized by the SSDTS based on the MI, the SSDTS used the least number of sensors to finish the event parameter sensing. Meanwhile, the results of the sensing time of each event obtained by different methods are given in Figure 7b. It can be seen in Figure 7b that the proposed approach spent less sensing energy than the other methods, as the related sensors were driven to complete the events. In a word, the SSDTS reduced the sensor number and sensing time of each node.
Sensing data size and sensing energy: The average data size of different events and sensing energy consumption of the WSN nodes are shown in Figure 8. As shown in Figure 8a, by using different methods, different data sizes were obtained, and the data size of all method had minor changes for different events. The proposed approach outperformed the other methods in terms of data size because it collected the most related data. Under event I, the data size that the proposed method required was only about one-tenth and one-fifth of those of the ASDT and the PNDT, respectively. Meanwhile, the sensing energy consumption is given in Figure 8b, where it can be seen that the SSDTS consumed the least amount of sensing energy because the proposed approach adopted the MI to reduce the sensor number.
Communication time to edge and cloud servers: The communication times from the WSN node to the edge computing server and cloud server under different conditions are shown in Figure 9. The data collection times of ten cycles are shown in Figure 9a; the data were collected once per cycle. As presented in Figure 9a, with an increase in the communication rate from 25 kbps to 250 kbps, the data collection time of the communication to the edge computing server decreased for each method. A higher communication rate meant spending less time on data delivery. However, the proposed method spent the shortest time for data collection among all the methods. When the communication rate was 100 kbps, the SSDTS saved 65% and 75% of the data collection time compared to the PNDT and ASDT methods, respectively. The data collection times for different events for the 100-kbps WSN and at 1-Mbps edge and cloud server communication rates are shown in Figure 9b. The results presented in Figure 9b are similar to the results shown in Figure 9a. The proposed method could adapt to different events and finish data collection. Consequently, it can be concluded that the traditional methods cannot be used in agricultural monitoring systems due to the high time consumption of data collection, thus omitting to meet the requirements of event-driven monitoring.
Communication energy consumption and sensing power: The energy consumption of the wireless system was evaluated. The two conditions of energy consumption of the communication to the edge computing server and cloud server are shown in Figure 10. The result of the first situation for event I is presented in Figure 10a, where it can be seen that with the increase in the communication rate, the energy consumption of all methods increased. The energy consumption of the ASDT was less than that of the PNDT because the ASDT adopted an appropriate number of nodes for the critical events. However, with the increase in the communication rate, the energy consumption of the SSDTS decreased. Meanwhile, the proposed method obtained the best performance regarding the communication energy consumption because it collected the related data for the event and had the smallest data size among all the methods. The sensing powers of the WSN nodes in different event situations are presented in Figure 10b. Similarly, the SSDTS spent less energy to finish the sensing process than the other methods.
Data reception ratio: The data reception ratio represents an important metric to evaluate whether data collection meets the time constraints. The results of the DRR at a 15-s deadline for event I of different methods and at different communication rates are shown in Figure 11, wherein it can be seen that with the increase in the communication rate, the DDR increased for all the methods. However, when the communication rate was higher than 100 kbps, only the DRR of the SSDTS could reach 100%. Thus, the proposed SSDTS outperformed the other methods because it selected the most related data type to finish data collection while considering the deadline constraints.
Consequently, the results of sensing time, data collection time, energy consumption, and other comparison metrics have similar values, so Figure 8, Figure 9 and Figure 10 show similar trends. In the experiment, the amount of sensing data was very small, so the communication time and energy consumption of data transmission occupied a very small proportion. The relevant evaluation values are directly related to the number of participating sensing nodes. Meanwhile, data collection time and energy consumption are mostly used to finish data sensing. Therefore, Figure 8, Figure 9 and Figure 10 show similarity.
In summary, in the real greenhouse data collection experiment, the proposed approach outperformed the traditional methods in terms of data size, latency, energy, and data reception rate.

6. Conclusions

In this paper, data collection is studied to reduce data redundancy for a critical event and ensure the latency constraint and main information in smart agriculture with consideration of the edge computing and SDN. First, from the perspective of event-driven sensing, a four-layer framework for smart agricultural IoT is introduced. Then, a three-step strategy is proposed for effective data collection in smart agriculture. In the first step, the MI from a historical dataset is used to sort the related sensing data types of different events. In the second step, the event identification based on edge computing is conducted by computing the minimum variance of the sensing data. Moreover, a data sensing method for collecting the most related data type is used to meet time constraints. Finally, the feasibility of the proposed strategy was verified by the experiments in a greenhouse. The proposed strategy was compared with two traditional methods. The results demonstrated that the proposed strategy provided a larger margin in balancing between data validity, energy consumption, and latency. The proposed framework and data collection methods can lay a foundation for the implementation of event-based smart agriculture.
However, the proposed approach can increase the deployment cost of edge servers, which can be solved by sharing computing resources. In our future work, we will focus on the cooperation between different edges and cloud computing for data collection on ECs.

Author Contributions

Conceptualization, Z.M. and X.L.; methodology, J.Z.; software, N.Z.; validation, Y.L. and L.Z.; writing—original draft preparation, X.L. All authors have read and agreed to the published version of the manuscript.

Funding

The work was supported by the Natural Science Foundation of Guangdong Province of China under Grant 2019A1515011346, the Guangdong Provincial Education Department’s Epidemic Prevention and Control Research Project under Grant 2020KZDZX1121, Guangzhou Science and Technology Project under Grant 202002030092 and the Key-Area Research and Development Program of Guangdong Province of China under Grant 2019B020223003, Guangdong Province Modern Agriculture Innovation Team of Protected Agriculture for Generic Key Technology Systems (2019–2023).

Conflicts of Interest

The authors declare no conflict of interest.

References

  1. Ahmed, N.; De, D.; Hussain, I. Internet of Things (IoT) for smart precision agriculture and farming in rural areas. IEEE Internet Things J. 2018, 5, 4890–4899. [Google Scholar] [CrossRef]
  2. Farooq, M.S.; Riaz, S.; Abid, A.; Abid, K.; Naeem, M.A. A survey on the role of IoT in agriculture for the implementation of smart farming. IEEE Access 2019, 7, 156237–156271. [Google Scholar] [CrossRef]
  3. Elijah, O.; Rahman, T.A.; Orikumhi, I.; Leow, C.Y.; Hindia, M.N. An overview of internet of things (IoT) and data analytics in agriculture: Benefits and challenges. IEEE Internet Things J. 2018, 5, 3758–3773. [Google Scholar] [CrossRef]
  4. Roussaki, I.; Kosmides, P.; Routis, G.; Doolin, K.; Pevtschin, V.; Marguglio, A. A Multi-Actor approach to promote the employment of IoT in Agriculture. In Proceedings of the 2019 Global IoT Summit (GIoTS), Aarhus, Denmark, 17–21 June 2019; pp. 1–6. [Google Scholar]
  5. Kalatzis, N.; Avgeris, M.; Dechouniotis, D.; Papadakis-Vlachopapadopoulos, K.; Roussaki, I.; Papavassiliou, S. Edge Computing in IoT Ecosystems for UAV-Enabled Early Fire Detection. In Proceedings of the 2018 IEEE International Conference on Smart Computing (SMARTCOMP), Taormina, Italy, 18–20 June 2018; pp. 106–114. [Google Scholar]
  6. Brewster, C.; Roussaki, I.; Kalatzis, N.; Doolin, K.; Ellis, K. IoT in agriculture: Designing a Europe-wide large-scale pilot. IEEE Commun. Mag. 2017, 55, 26–33. [Google Scholar] [CrossRef]
  7. Jiang, C.; Cheng, X.; Gao, H.; Zhou, X.; Wan, J. Toward computation offloading in edge computing: A survey. IEEE Access 2019, 7, 131543–131558. [Google Scholar] [CrossRef]
  8. Dimitriou, K.; Roussaki, I. Location privacy protection in distributed IoT environments based on dynamic sensor node clustering. Sensors 2019, 19, 3022. [Google Scholar] [CrossRef] [Green Version]
  9. Roopaei, M.; Rad, P.; Choo, K.-K.R. Cloud of things in smart agriculture: Intelligent irrigation monitoring by thermal imaging. IEEE Cloud Comput. 2017, 4, 10–15. [Google Scholar] [CrossRef]
  10. Chen, J.; Yang, A. Intelligent agriculture and its key technologies based on internet of things architecture. IEEE Access 2019, 7, 77134–77141. [Google Scholar] [CrossRef]
  11. Spachos, P.; Gregori, S. Integration of wireless sensor networks and smart UAVs for precision viticulture. IEEE Internet Comput. 2019, 23, 8–16. [Google Scholar] [CrossRef]
  12. Le, T.D.; Tan, D.H. Design and Deploy a Wireless Sensor Network for Precision Agriculture. In Proceedings of the 2015 2nd National Foundation for Science and Technology Development Conference on Information and Computer Science (NICS), Ho Chi Minh City, Vietnam, 16–18 September 2015; pp. 294–299. [Google Scholar]
  13. Li, X.; Ma, Z.; Chu, X.; Liu, Y. A Cloud-Assisted region monitoring strategy of mobile robot in smart greenhouse. Mob. Inf. Syst. 2019, 2019, 5846232. [Google Scholar] [CrossRef]
  14. Cambra, C.; Sendra, S.; Lloret, J.; Garcia, L. An IoT Service-Oriented System for Agriculture Monitoring. In Proceedings of the 2017 IEEE International Conference on Communications (ICC), Paris, France, 21–25 May 2017; pp. 1–6. [Google Scholar]
  15. Liu, Y.; Bi, C. The Design of Greenhouse Monitoring System Based on ZigBee WSNs. In Proceedings of the 2017 IEEE International Conference on Computational Science and Engineering (CSE) and IEEE International Conference on Embedded and Ubiquitous Computing (EUC), Guangzhou, China, 22–23 July 2017; pp. 430–433. [Google Scholar]
  16. Dong, M.; Ota, K.; Liu, A. RMER: Reliable and Energy-Efficient Data Collection for Large-Scale Wireless Sensor Networks. IEEE Internet Things J. 2016, 3, 511–519. [Google Scholar] [CrossRef] [Green Version]
  17. Long, D.S.; McCallum, J.D. On-Combine, multi-sensor data collection for post-harvest assessment of environmental stress in wheat. Precis. Agric. 2015, 16, 492–504. [Google Scholar] [CrossRef]
  18. Kim, Y.-D.; Yang, Y.-M.; Kang, W.-S.; Kim, D. On the design of beacon based wireless sensor network for agricultural emergency monitoring systems. Comput. Stand. Interfaces 2014, 36, 288–299. [Google Scholar] [CrossRef]
  19. Srbinovska, M.; Gavrovski, C.; Dimcev, V.; Krkoleva, A.; Borozan, V. Environmental parameters monitoring in precision agriculture using wireless sensor networks. J. Clean. Prod. 2015, 88, 297–307. [Google Scholar] [CrossRef]
  20. Estrada-Lopez, J.J.; Atoche, A.C.; Vazquez-Castillo, J.; Sanchez-Sinencio, E. Smart Soil Parameters Estimation System Using an Autonomous Wireless Sensor Network With Dynamic Power Management Strategy. IEEE Sens. J. 2018, 18, 8913–8923. [Google Scholar] [CrossRef]
  21. Henry, E.; Adamchuk, V.; Stanhope, T.; Buddle, C.; Rindlaub, N. Precision apiculture: Development of a wireless sensor network for honeybee hives. Comput. Electron. Agric. 2019, 156, 138–144. [Google Scholar] [CrossRef] [Green Version]
  22. Bing, S.; Victor, S.; Dean, Z.; Suolin, D.; Jianming, J.A. Wireless sensor Network-Based monitoring system for freshwater fishpond aquaculture. Biosyst. Eng. 2018, 172, 57–66. [Google Scholar]
  23. Dobslaw, F.; Zhang, T.; Gidlund, M. QoS-Aware Cross-Layer Configuration for Industrial Wireless Sensor Networks. IEEE Trans. Ind. Inform. 2016, 12, 1679–1691. [Google Scholar] [CrossRef]
  24. Costa, D.G.; Collotta, M.; Pau, G.; Duran-Faundez, C. A Fuzzy-Based Approach for Sensing, Coding and Transmission Configuration of Visual Sensors in Smart City Applications. Sensors 2017, 17, 93. [Google Scholar] [CrossRef]
  25. Li, X.; Wan, J.; Dai, H.-N.; Imran, M.; Xia, M.; Celesti, A. A Hybrid Computing Solution and Resource Scheduling Strategy for Edge Computing in Smart Manufacturing. IEEE Trans. Ind. Inform. 2019, 15, 4225–4234. [Google Scholar] [CrossRef]
  26. Li, X.; Li, D.; Wan, J.; Liu, C.; Imran, M. Adaptive Transmission Optimization in SDN-Based Industrial Internet of Things With Edge Computing. IEEE Internet Things J. 2018, 5, 1351–1360. [Google Scholar] [CrossRef]
  27. Zeng, D.; Li, P.; Guo, S.; Miyazaki, T.; Hu, J.; Xiang, Y. Energy Minimization in Multi-Task Software-Defined Sensor Networks. IEEE Trans. Comput. 2015, 64, 3128–3139. [Google Scholar] [CrossRef]
  28. Li, G.; Guo, S.; Yang, Y.; Yang, Y. Traffic Load Minimization in Software Defined Wireless Sensor Networks. IEEE Internet Things J. 2018, 5, 1370–1378. [Google Scholar] [CrossRef]
  29. Jun, D.; Cai, H.; Wang, X. Improved Flow Awareness by Intelligent Collaborative Sampling in Software Defined Networks. In Proceedings of the International Conference on 5G for Future Wireless Networks, Beijing, China, 23–24 February 2019; pp. 182–194. [Google Scholar]
  30. Misra, S.; Bera, S.; Achuthananda, M.P.; Pal, S.K.; Obaidat, M.S. Situation-Aware protocol switching in Software-Defined wireless sensor network systems. IEEE Syst. J. 2018, 12, 2353–2360. [Google Scholar]
Figure 1. Agricultural data collection framework.
Electronics 09 00907 g001
Figure 2. The block diagram of the experiment platform.
Electronics 09 00907 g002
Figure 3. The construction and physical image of wireless sensor network (WSN) nodes.
Electronics 09 00907 g003
Figure 4. The structure and physical image of the edge computing node.
Electronics 09 00907 g004
Figure 5. The execution screen of a private cloud server.
Electronics 09 00907 g005
Figure 6. The network topology of the experimental platform.
Electronics 09 00907 g006
Figure 7. Sensor number and sensing time of each node. (a) Sensor number of each node for different events, (b) Sensing time of each node for different events.
Electronics 09 00907 g007
Figure 8. Sensing data size and energy consumption. (a) Sensing data size for different events, (b) Sensor energy consumption for different events.
Electronics 09 00907 g008
Figure 9. Communication times to the edge server and cloud server. (a) Communication time to the edge server, (b) Communication time to the cloud server.
Electronics 09 00907 g009
Figure 10. (a) Communication energy consumption of the edge server (ES) at different communication rates, (b) Sensing power of the cloud server (CS) of different methods.
Electronics 09 00907 g010
Figure 11. Data reception ratio of different methods.
Electronics 09 00907 g011
Table 1. The parameters of the sensors.
Sensor TypeRangeAccuracyInterface
Soil salinity0–3000 mg/L±3%UART
Soil temperature−30–70 °C±2%IIC
Soil humidity0–100%±2%IIC
Soil pH0–14 pH±3%UART
CO20–5000 ppm±5%UART
Air temperature & humidity−20–80 °C; 0–100%±5%; ±5%IIC
Atmospheric pressure300–1100 hpa±0.8%SPI
Ambient light1–60,000 lx±5%IIC
Table 2. Sensing time and energy consumption of sensors.
Sensor TypeSensing Time (s)Working Voltage (V)Working Current (mA)
Soil salinity31270
Soil temperature11250
Soil humidity11220
Soil pH151220
CO2603.620
Air temperature & humidity0.043.65
Atmospheric pressure13.6100
Ambient light0.123.680

