Article

The Detection of Chemical Materials with a Metamaterial-Based Sensor Incorporating Oval Wing Resonators

1
School of Physics and Electronics, Central South University, Changsha 410083, China
2
Physics Department, College of Science, University of Sulaimani, Sulaimani 46001, Iraq
3
Department of Electrical and Electronics, Iskenderun Technical University, 31100 Hatay, Turkey
4
Department of Physics, Salahaddin University, Erbil 44001, Iraq
5
Department of Physics, Faculty of Science and Health, Koya University, Koya 44023, Iraq
6
Department of Communication Engineering, Sulaimani Polytechnic University, Sulaimani 46001, Iraq
*
Author to whom correspondence should be addressed.
Electronics 2020, 9(5), 825; https://doi.org/10.3390/electronics9050825
Submission received: 19 April 2020 / Revised: 8 May 2020 / Accepted: 12 May 2020 / Published: 16 May 2020
(This article belongs to the Section Microelectronics)

Abstract

:
The detection of branded and unbranded chemical materials is essential for the quality control assessment. In this work, a metamaterial inspired sensor is designed and fabricated, which incorporates oval-shaped wing resonators, in order to use to detect branded and unbranded diesels in the X-band frequency region. The simulation studies were carried out by using the Computer Simulation Technology (CST) Microwave studio. A transmission line was introduced into the sensor design and genetic algorithm was used to optimize the proposed structure. Parametric study was investigated by changing the permittivity, permeability of the sensor layer, width of the transmission line, materials of the substrate layer, and width of the resonator. Results showed that different factors can be considered to sense the chemical materials including the shift in resonant frequency and amplitude variation in the reflection or transmission spectrum. It was found that the sensible variation in the transmission value is about −3.2 dB, which is superior to that reported in literature. It was concluded that the sensor is highly sensitive to distinguish the branded diesel from the unbranded one, which makes it viable for detecting fluidics in the chemical industry and medicine.

1. Introduction

Currently, sensor devices are playing a splendid role in various applications including robotics [1], biomedical [2,3], and chemical applications [4,5]. The involvement of metamaterials (MTMs) in the construction of highly sensitive sensors has become a new trend. This is due to the periodical structure of the MTMs, which acts to manipulate the electromagnetic waves behavior and, hence, produces unique features such as a negative refractive index, permeability, and permittivity [6,7]. As a result, each unit cell in the periodical structure can be treated as a resonator. Hence, they can be coupled to each other electrically or magnetically, depending on the configurations of the cells. Realizing strong coupling between the unit cells can enhance the sensor performance, which, thereby, tunes the resonant frequency in relevance to a small change in the electrical current.
Many techniques and platforms have been applied in sensor construction [8,9,10,11]. Among them, metamaterial-based sensors gained more attention due to unique characteristics such as high sensitivity, small size, low cost, and easy fabrication [12,13,14,15,16,17,18,19]. The most common metamaterial resonance structure is shaped by split ring resonators, which can be integrated with either microstrip structure or transmission line aiming at measuring the dielectric properties of liquids [20,21,22]. A survey of literature revealing that metamaterial-based sensors are applicable in a broad frequency range from microwave to visible [23,24,25] and for various types of materials including solid dielectrics, liquids, gases, and biomolecules [26,27,28,29,30,31]. Ahmet Tamer proposed a metamaterial integrated transmission line based sensor structure to detect authentic and inauthentic diesel and gasoline samples in the X-band frequency range [32,33]. In addition, metamaterials sensor-based on an omega shape and labyrinth resonator have been investigated for industrial implementation and chemical detection [34,35]. Along this line, an efficient metamaterials-based sensor has been presented in the frequency range of 10–11 GHz and 8–12 GHz for determining different branded and unbranded fuel oil samples [36,37]. An effective way of sensing by metamaterial resonators, which is usually considered by researchers, is to monitor the possible frequency shift in the transmission coefficient (S21) or transmission signal (S21) amplitude.
Despite the presence of several MTM-based sensors in literature, there exist little attention on the design and fabrication of sensors to implement variation in both reflection and transmission coefficients in order to operate within a broad range of frequencies.
In the current work, a new metamaterial structure is developed for sensing the application in the frequency range of 8–12 GHz. Variation in the reflection coefficient (S11) and transmission coefficient (S21) has been made possible with the help of this design, while it was utilized to detect the branded and unbranded diesels.
The proposed sensor is well recognized by presenting significant changes in the vibration amplitude of the transmission coefficient (S21) and resonant frequency. This new design is cheap and highly sensitivity, which can be easily fabricated for its use in a broad range of frequency from 1–20 GHz.

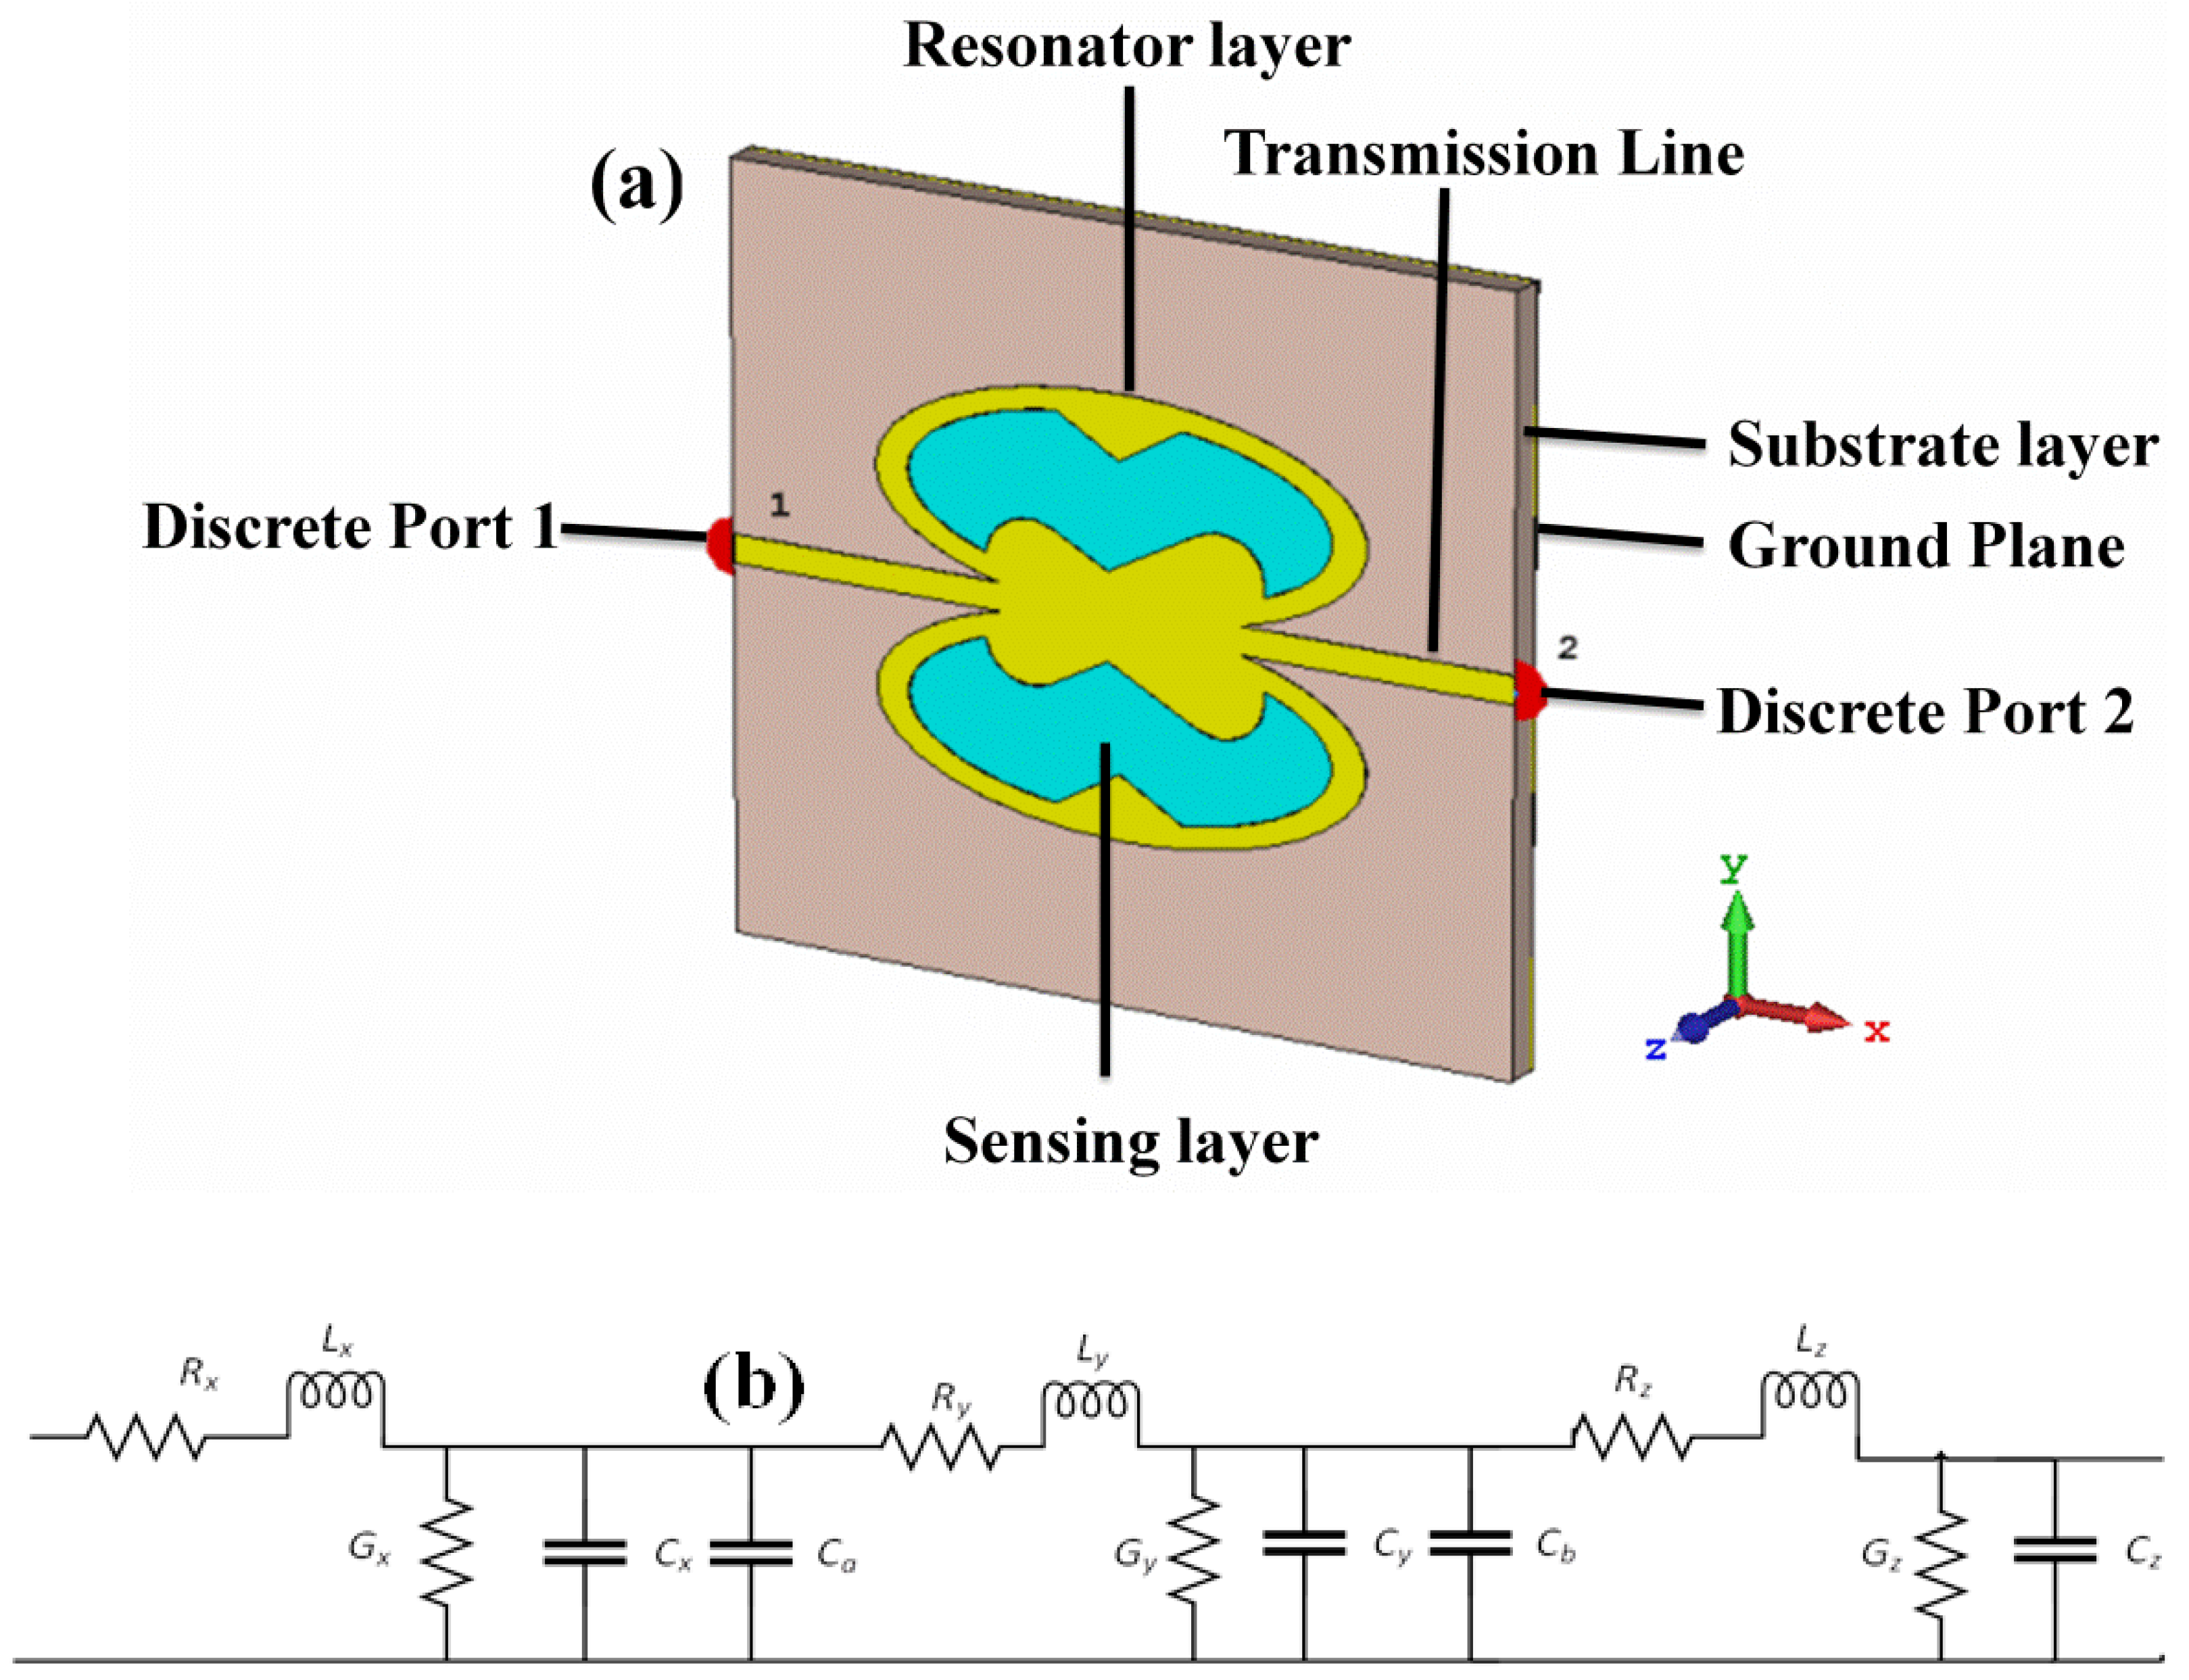
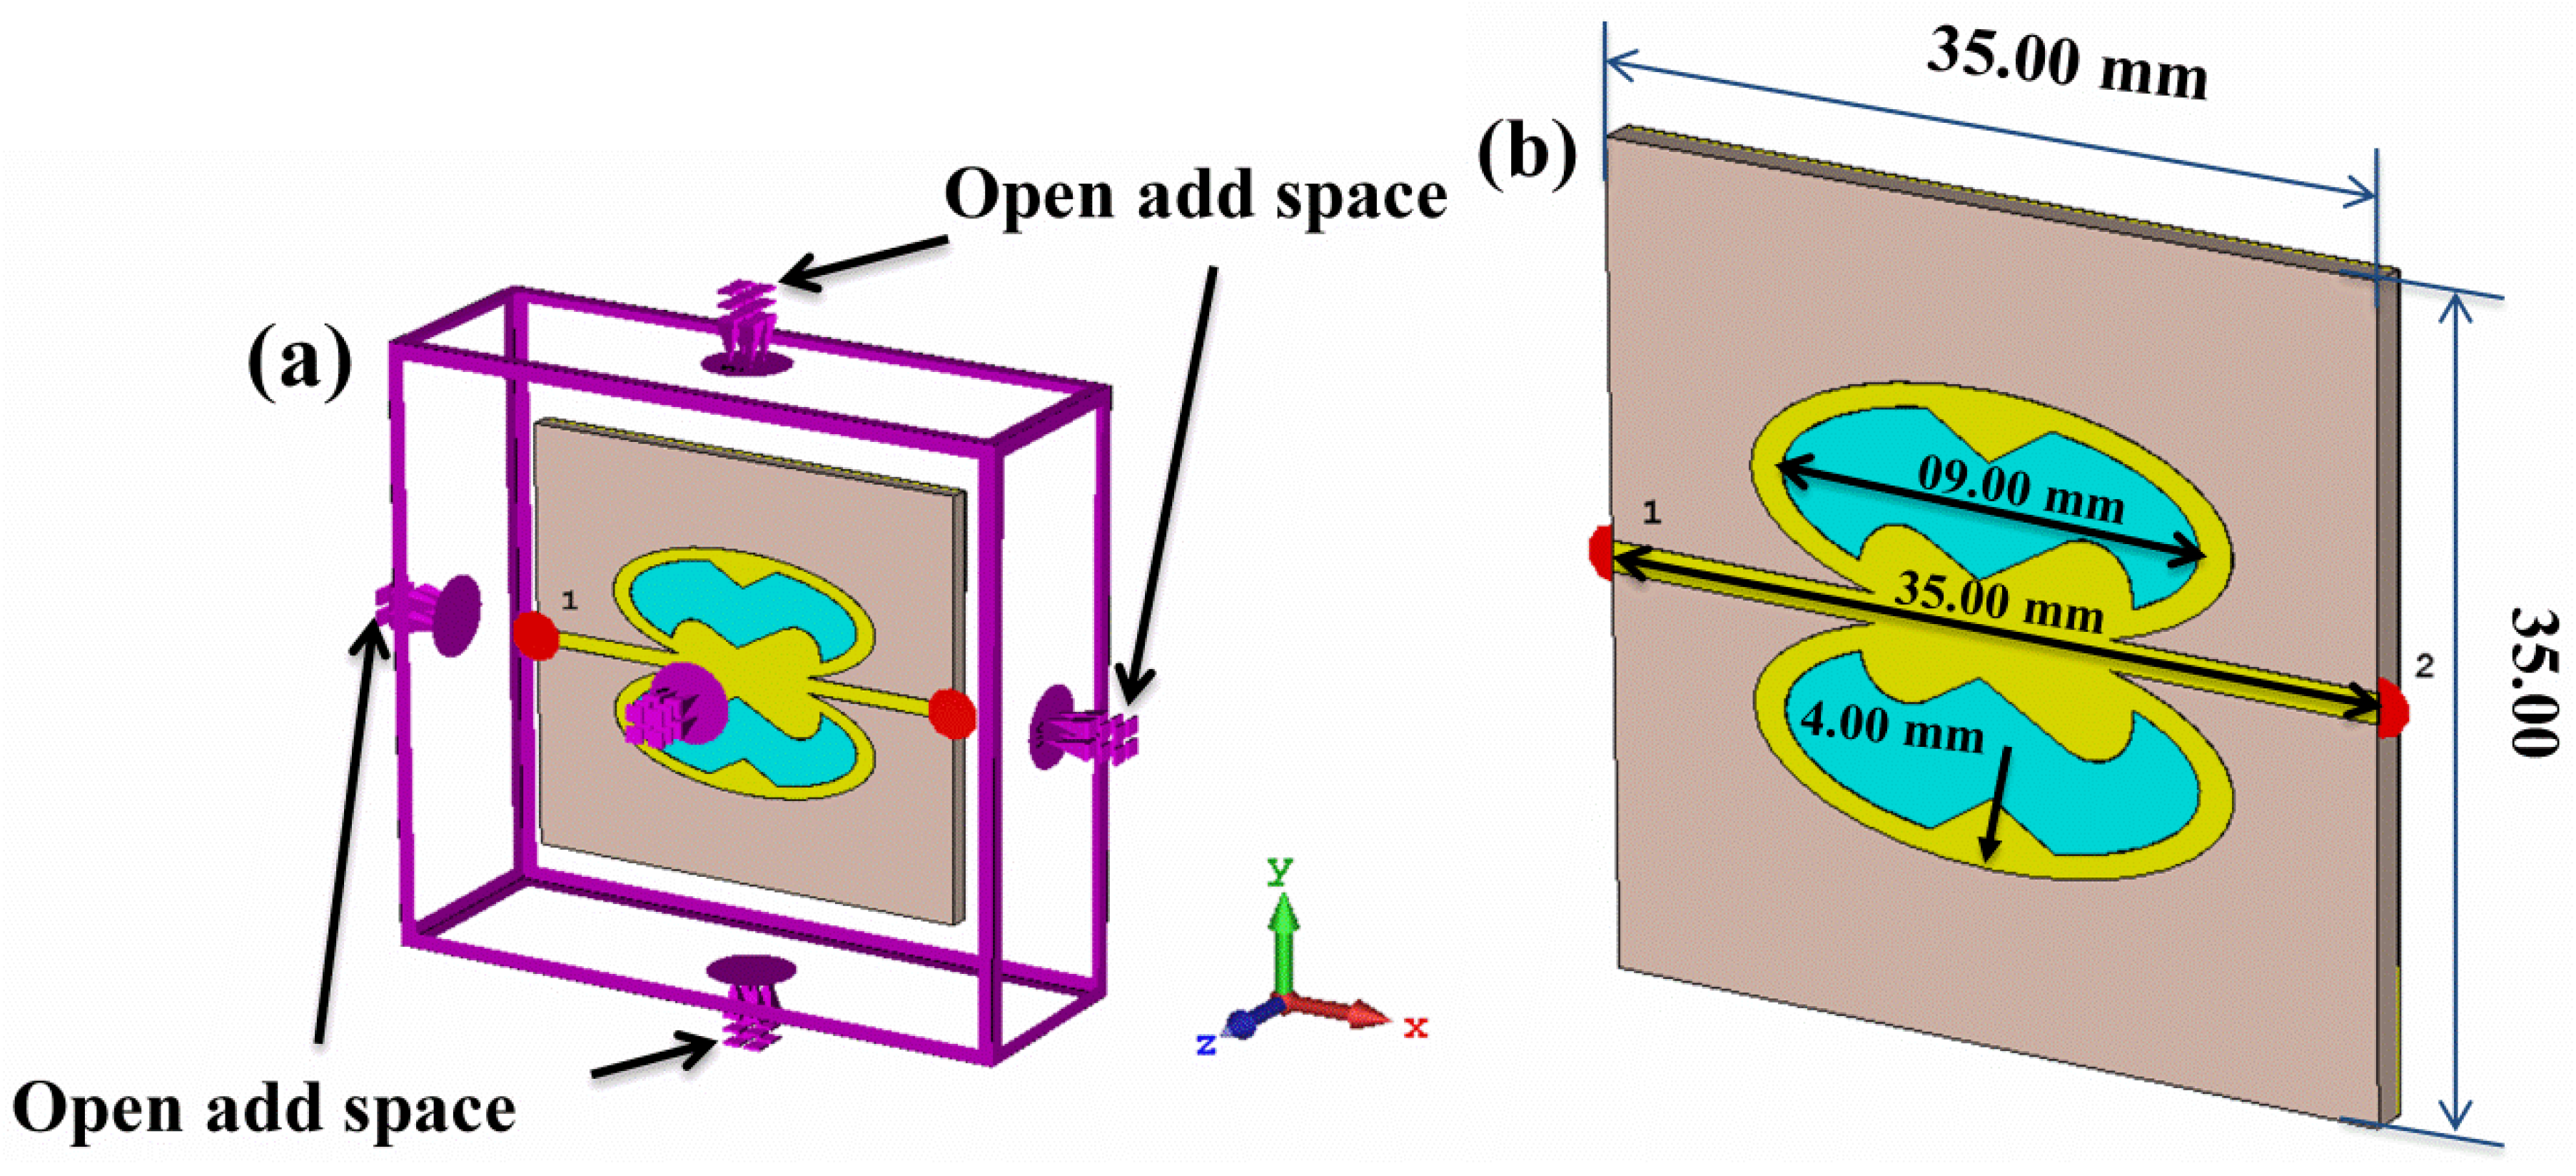
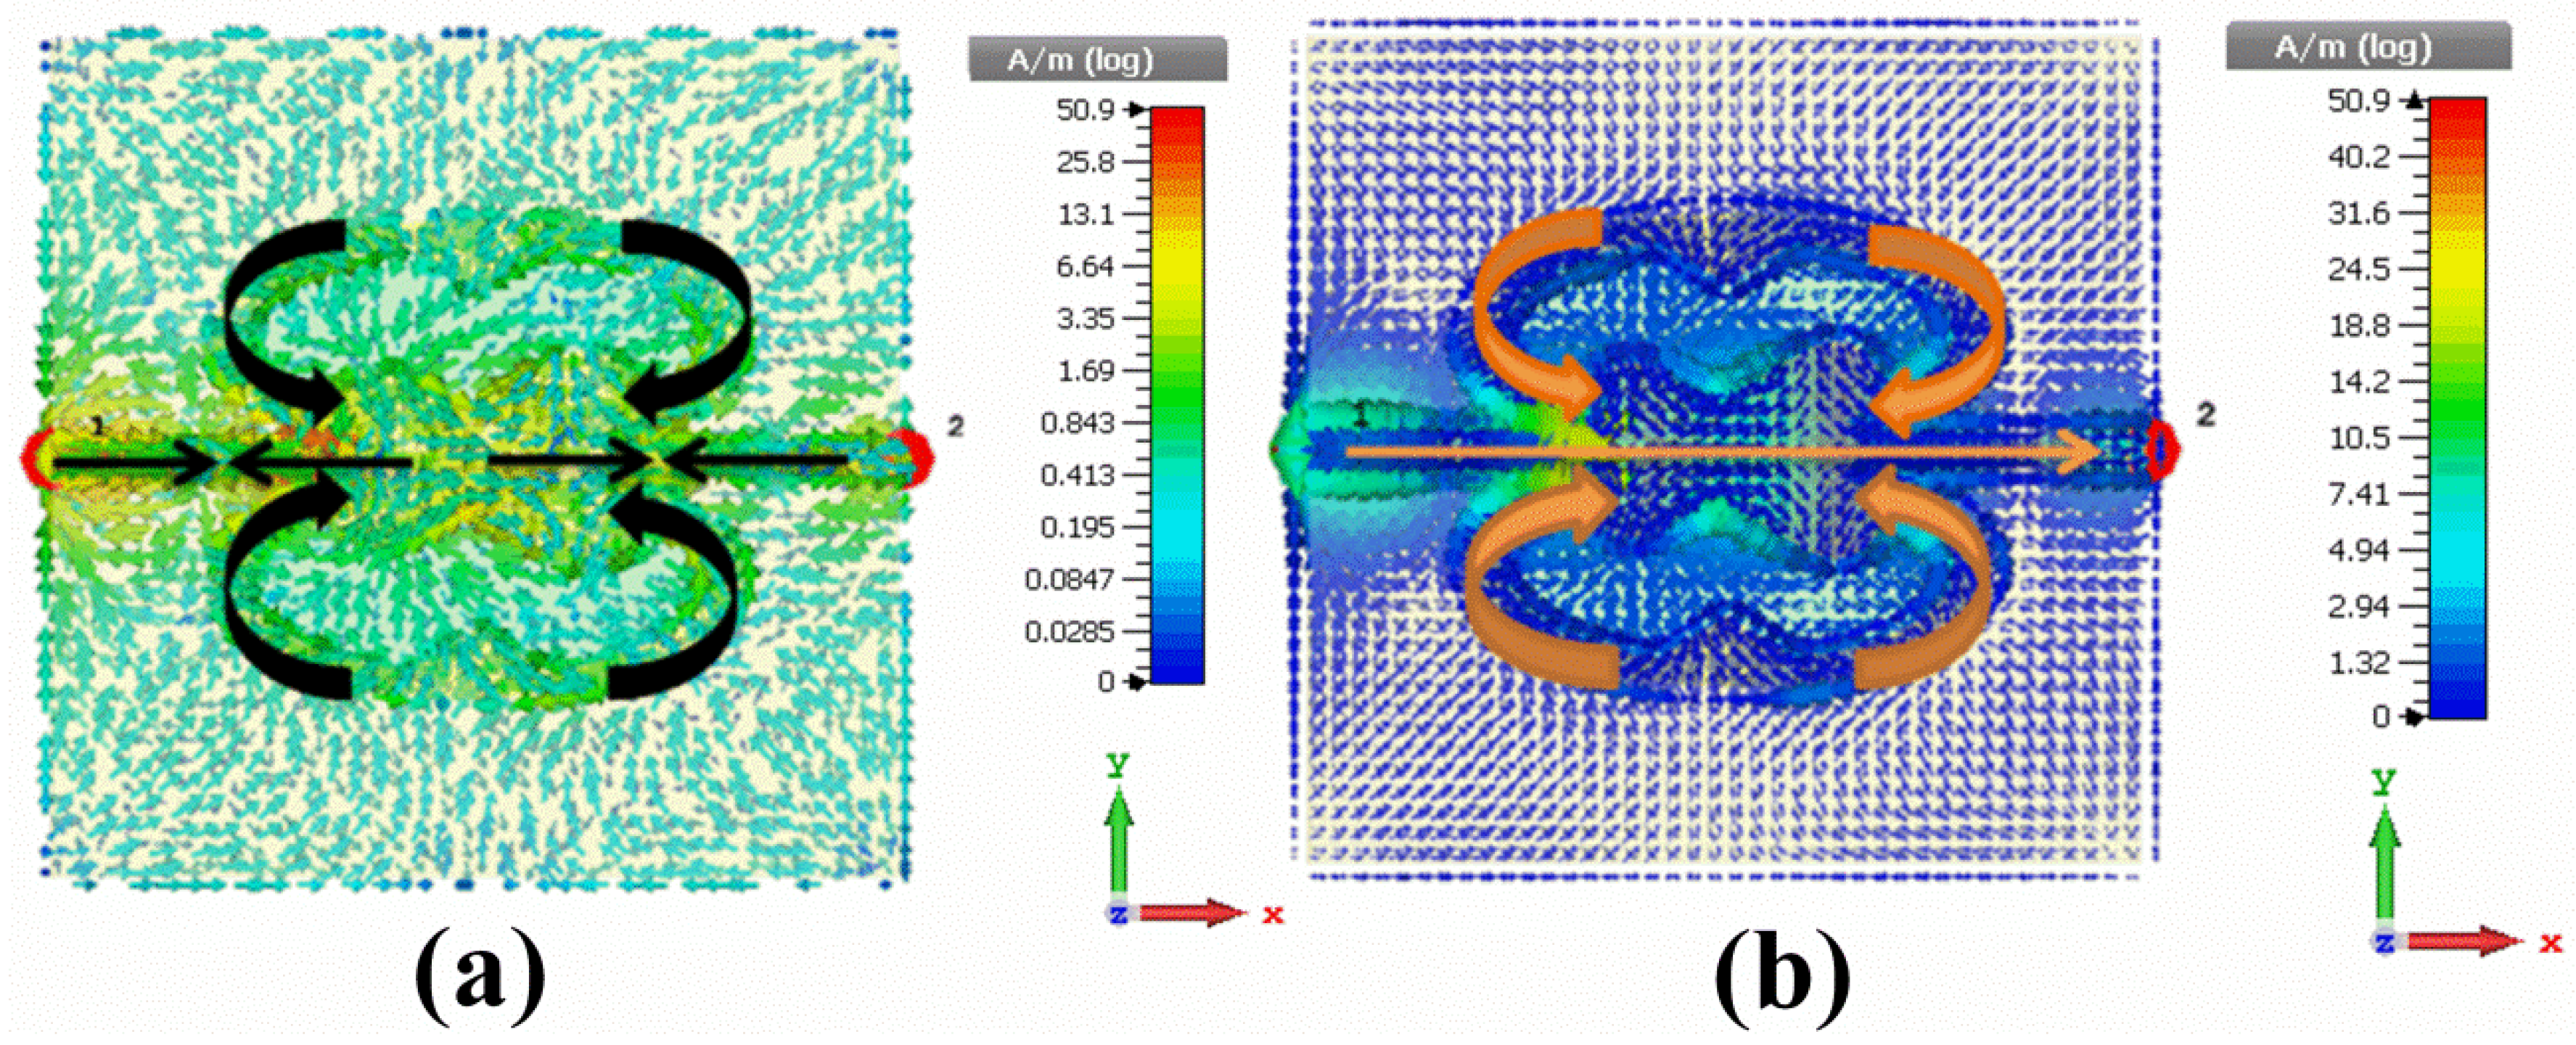
2. Design Structure of the Proposed Metamaterial-Based Sensor

The proposed design of metamaterial-based sensor, integrated with a transmission line, is made of three layers, as shown in Figure 1. On top, there exist two oval-shaped ring resonators integrated with transmission lines on both ends. The top layer is made of copper (conductivity of 5.8 × 10⁷ S/m) layer with 0.035-mm thickness, while both ends of the transmission line are connected to discrete port 1 and 2. The second layer is a substrate of type FR-4 material with 4.3 dielectric constants and a loss tangent of 0.02. The last layer is ground plane, which is used to cover the substrate with a copper film of 0.035-mm thickness. Two oval holes were produced through the first and second layers in order to place the samples inside while testing. The proposed design was carefully investigated both numerically and experimentally.
The equivalent electrical circuit of the proposed metamaterial sensor is shown in Figure 1b, where the two oval resonators behave like an Resistance, Inductance and Capacitance RLC circuit defined by resistance (Rx, Ry, and Rz, inductance (Lx, Ly, and Lz), and capacitance (Cx, Cy, and Cz). In addition, the admittance of the sensor can be presented by Gx, Gy, and Gz, having effective capacitance of Ca and Cb in which the liquid samples are tested. The sensor layer is bounded by the two oval-shaped resonators, where the effective permittivity of the resonator is increased when placing a sample. Hence, the capacitance and charge distribution are significantly changed, and, thereby, modify the inductance of the two elliptical resonators. The mutual inductance occurs between the resonator layer and the transmission line, which is responsible for the possible changes in transmission resonance. The phase and total transmitted power are dependent on the capacitive effect of the sensor layer. The equivalent resistance, admittance, and inductance values for designed transmission line-based sensor are R, G, and L, respectively. The total capacitance with parallel capacitive effects of the designed sensor is denoted by C. As such, the telegraph equations can be expressed by the equation below.
x V ( x , t ) = L x I ( x , t ) RI ( x , t )
The transmission line was well optimized in order to achieve a magnetic coupling effect with the following equation.
x I ( x , t ) = C x V ( x , t ) GV ( x , t )
The transmission line was well optimized in order to achieve a magnetic coupling effect with two oval resonators and disclose variation of transmission confession during the numerical analysis. The material of the resonators, transmission line, and ground plane is copper with thickness of 0.035 mm and conductivity of 5.8 × 10⁷ S/m. The transmission line impedance is optimized to be 50 Ω for better matching with the ports. The shape of the metamaterial resonator is very crucial in terms of sensitivity. Two symmetrical oval rings were selected and optimized to provide the highest electromagnetic response due to the electrical variation of the samples in the resonator holes (sensor layer). Consequently, a small variation of dielectric constant and dielectric loss tangent of the samples can cause a valuable change in the transmission coefficient (S21). This may be because of the symmetry feature of the two oval resonators with the transmission line. The most influential parameters of the sensor and transmission line were optimized by utilizing a parametrical study and genetic algorithm technique in the Computer Simulation Technology (CST) program. The optimum dimensions of the resonator and transmission line are shown in Figure 2b, while the boundary conditions of the proposed sensor is shown in Figure 2a. To further improve the sensitivity of the sensor, the resonators were modified by introducing two equilateral triangular shapes at the center point of their integration. The length of their right and left triangular sides are 7 mm and 6 mm, respectively, with 2 mm bending for the base corners.

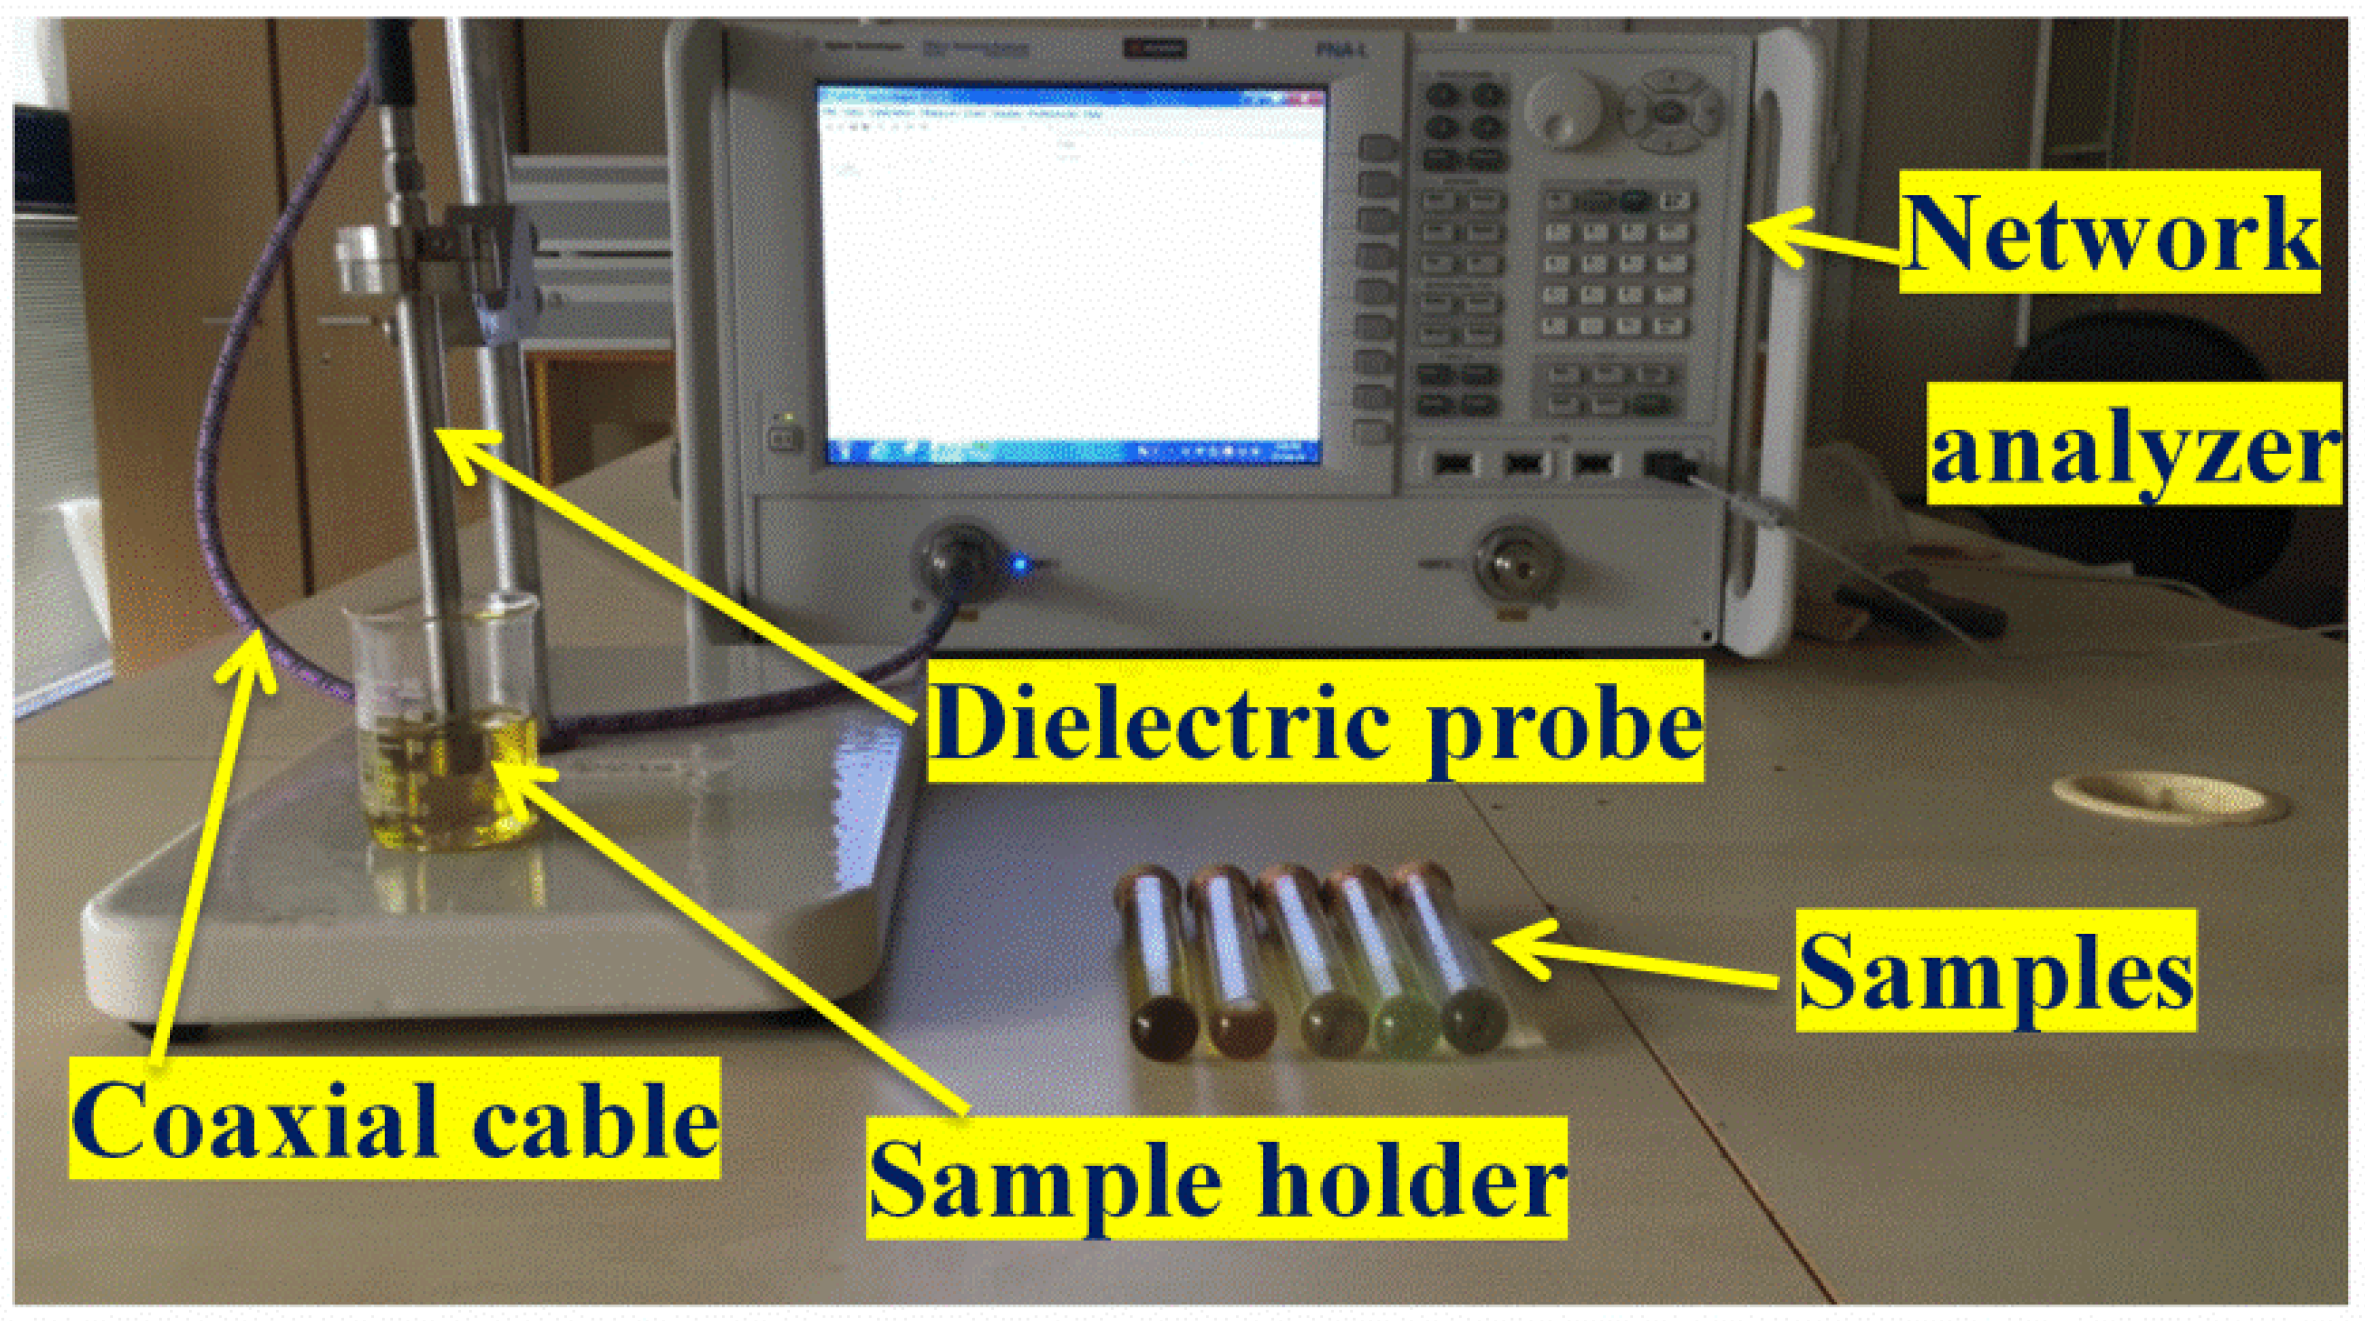
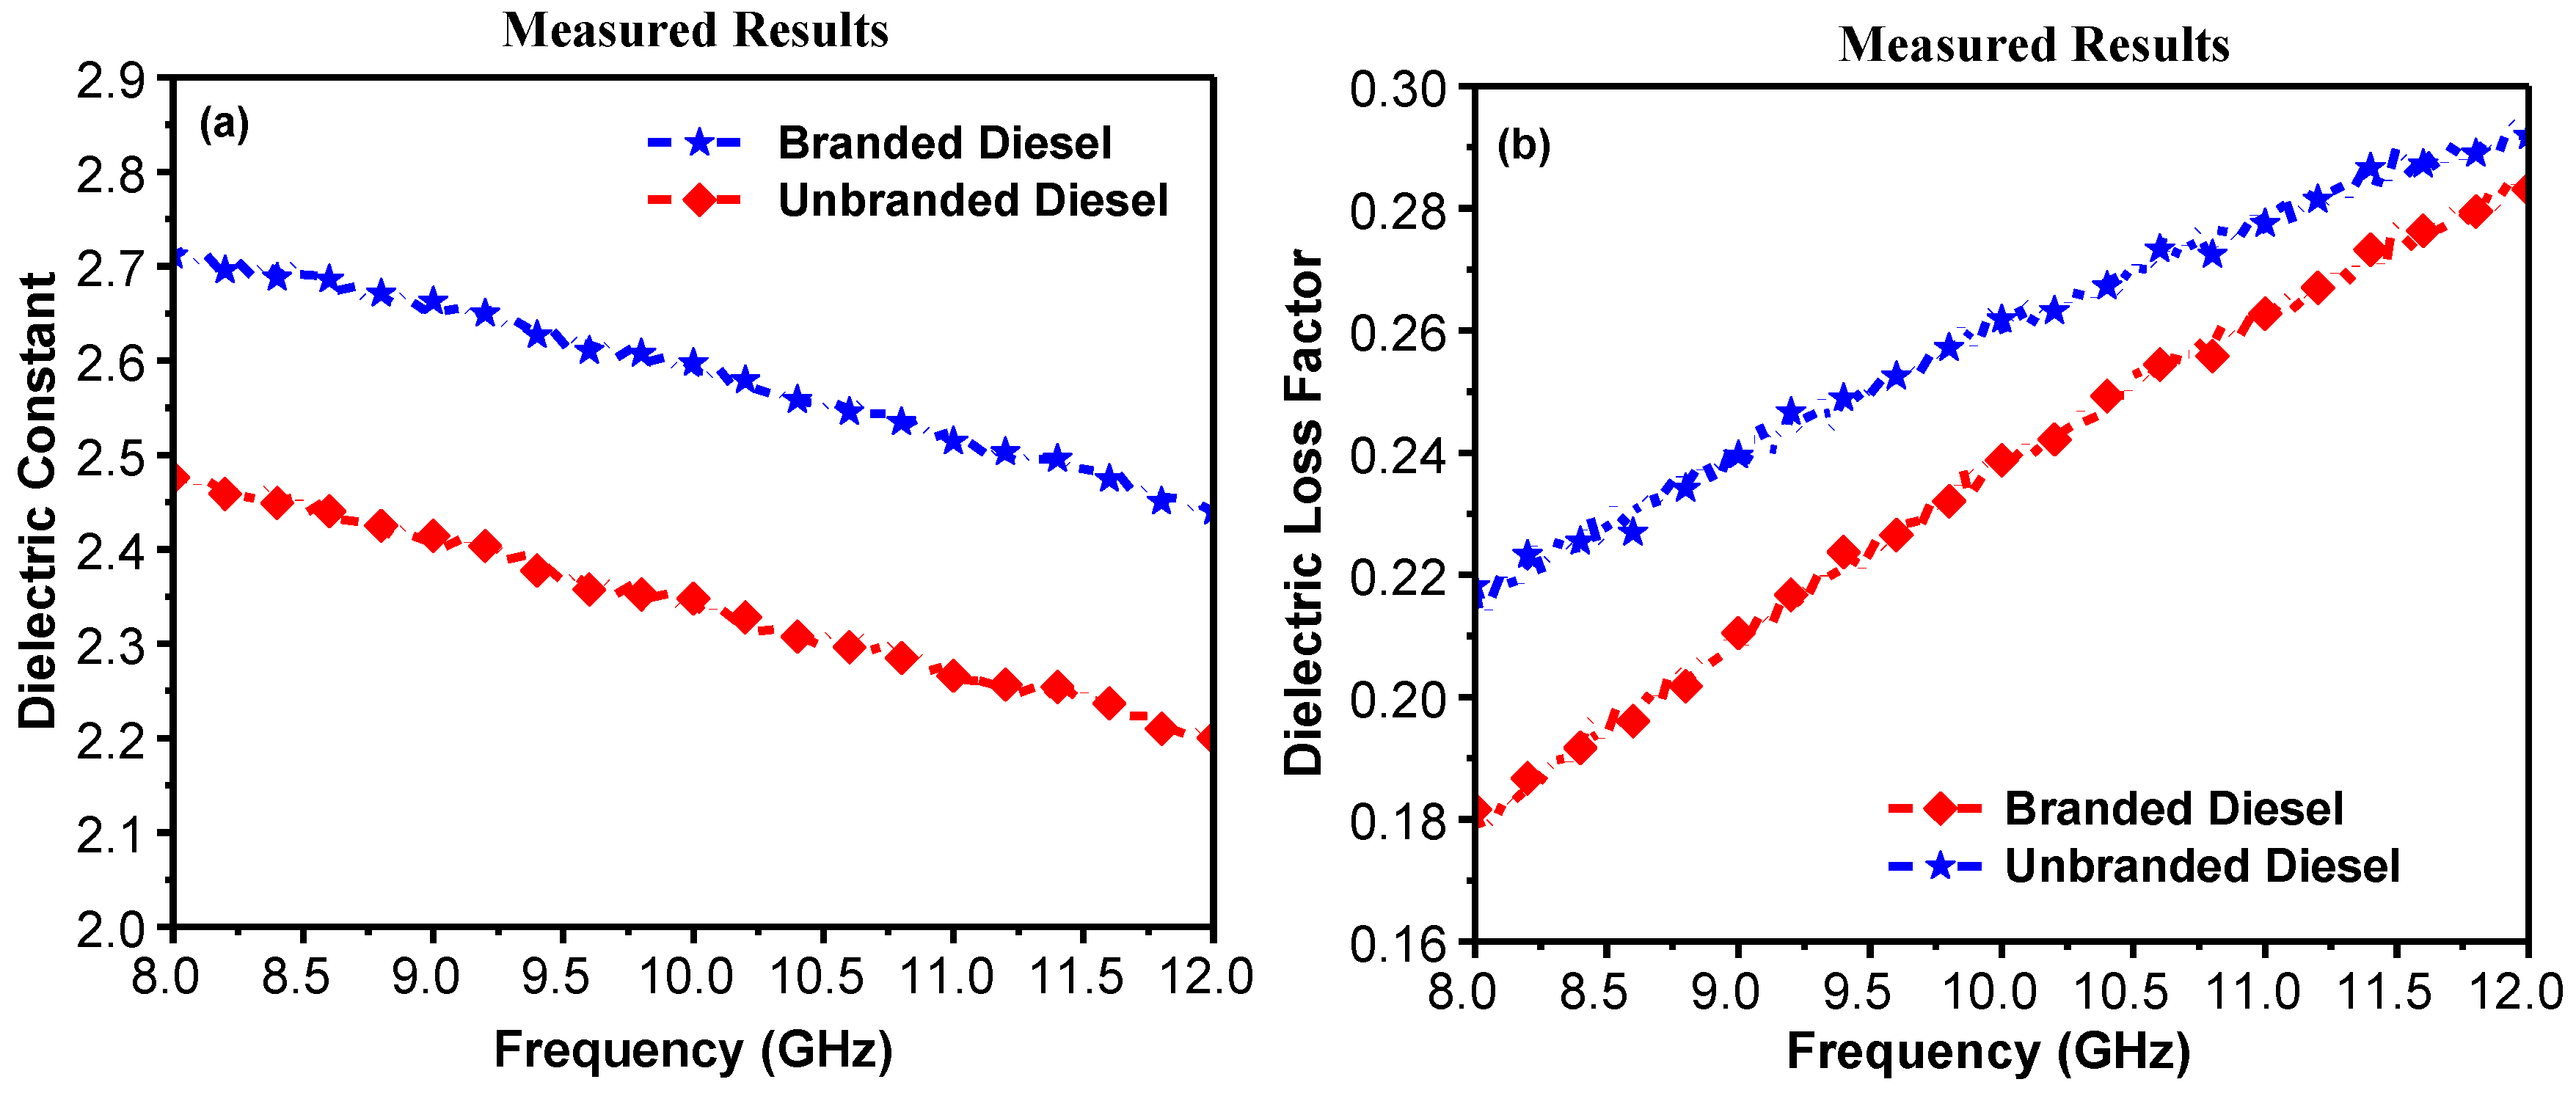
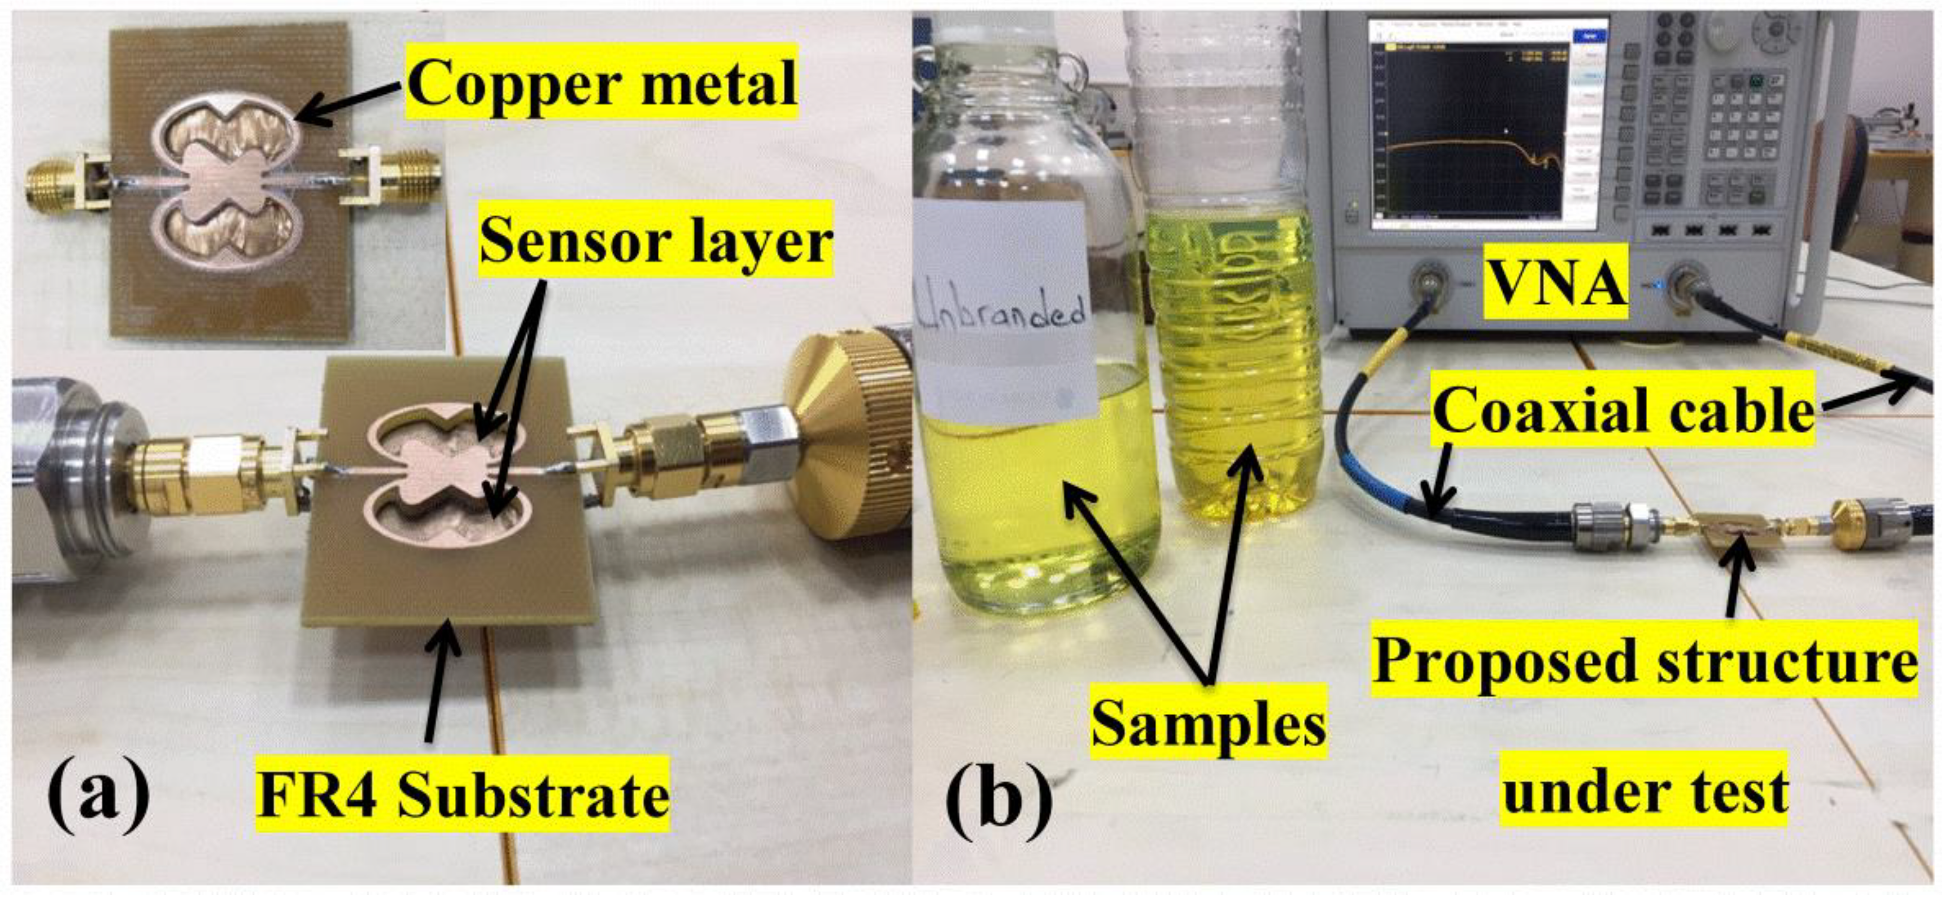
3. Measurement of Branded and Unbranded Diesels

One of the most important parameters of materials is the dielectric constant ( ε ), which can be measured using various methods such as the transmission line method, the free space method, the reflection line method, and the resonant method. Each method has its own advantages and disadvantages. The disadvantage of transmission and reflection line methods is limited measurement accuracy due to air gap effects and when the sample dimension is a multiple of one-half wavelength. The disadvantage of the free space method is multiple reflections between antenna and surface. The disadvantage of the resonant method is that it needs a high frequency resolution Vector Network Analyzer (VNA) and it is limited to a narrow band of frequencies only. The open-ended coaxial probe was used in this work to measure the electrical characteristics of the prepared samples (branded and unbranded diesel), as shown in Figure 3. The calibration was performed at room temperature using the Agilent 85070E probe kit. The dielectric constant and dielectric loss factor of the branded and unbranded diesel were measured within the X-band frequencies, as shown in Figure 4a,b.
The properties of the diesel used in this work are shown in Table 1 and Figure 4 that the measured values of the dielectric constant for the branded and unbranded diesel are 2.73 and 2.47, respectively, at operating frequency of 8 GHz. However, at 12 GHz, the measured dielectric constant was found to be 2.46 and 2.21 for the branded and unbranded samples. Table 2 shows the measured value of dielectric constant and loss tangent at different frequencies for the branded and unbranded diesel. It is concluded that, by increasing the frequency, the dielectric constant is decreased, while the loss tangent value is increased for both branded and unbranded diesels. Noticeably, the value of the dielectric constant was seen to be higher for the branded diesel, while its dielectric loss was lower when compared to that of the unbranded diesel. The proposed sensor was examined by a typical branded sample, which includes some additives. However, the unbranded sample does not include any additives. Because of these additives, the dielectric values show different characteristics. All gasoline brands have similar additives, so every branded sample could show the same characteristic with a small amount of variations. The used branded and unbranded diesel samples are different in composition due to the presence of some additives in the branded one. This can cause a noticeable difference between the electromagnetic parameters related to the branded and unbranded diesel.

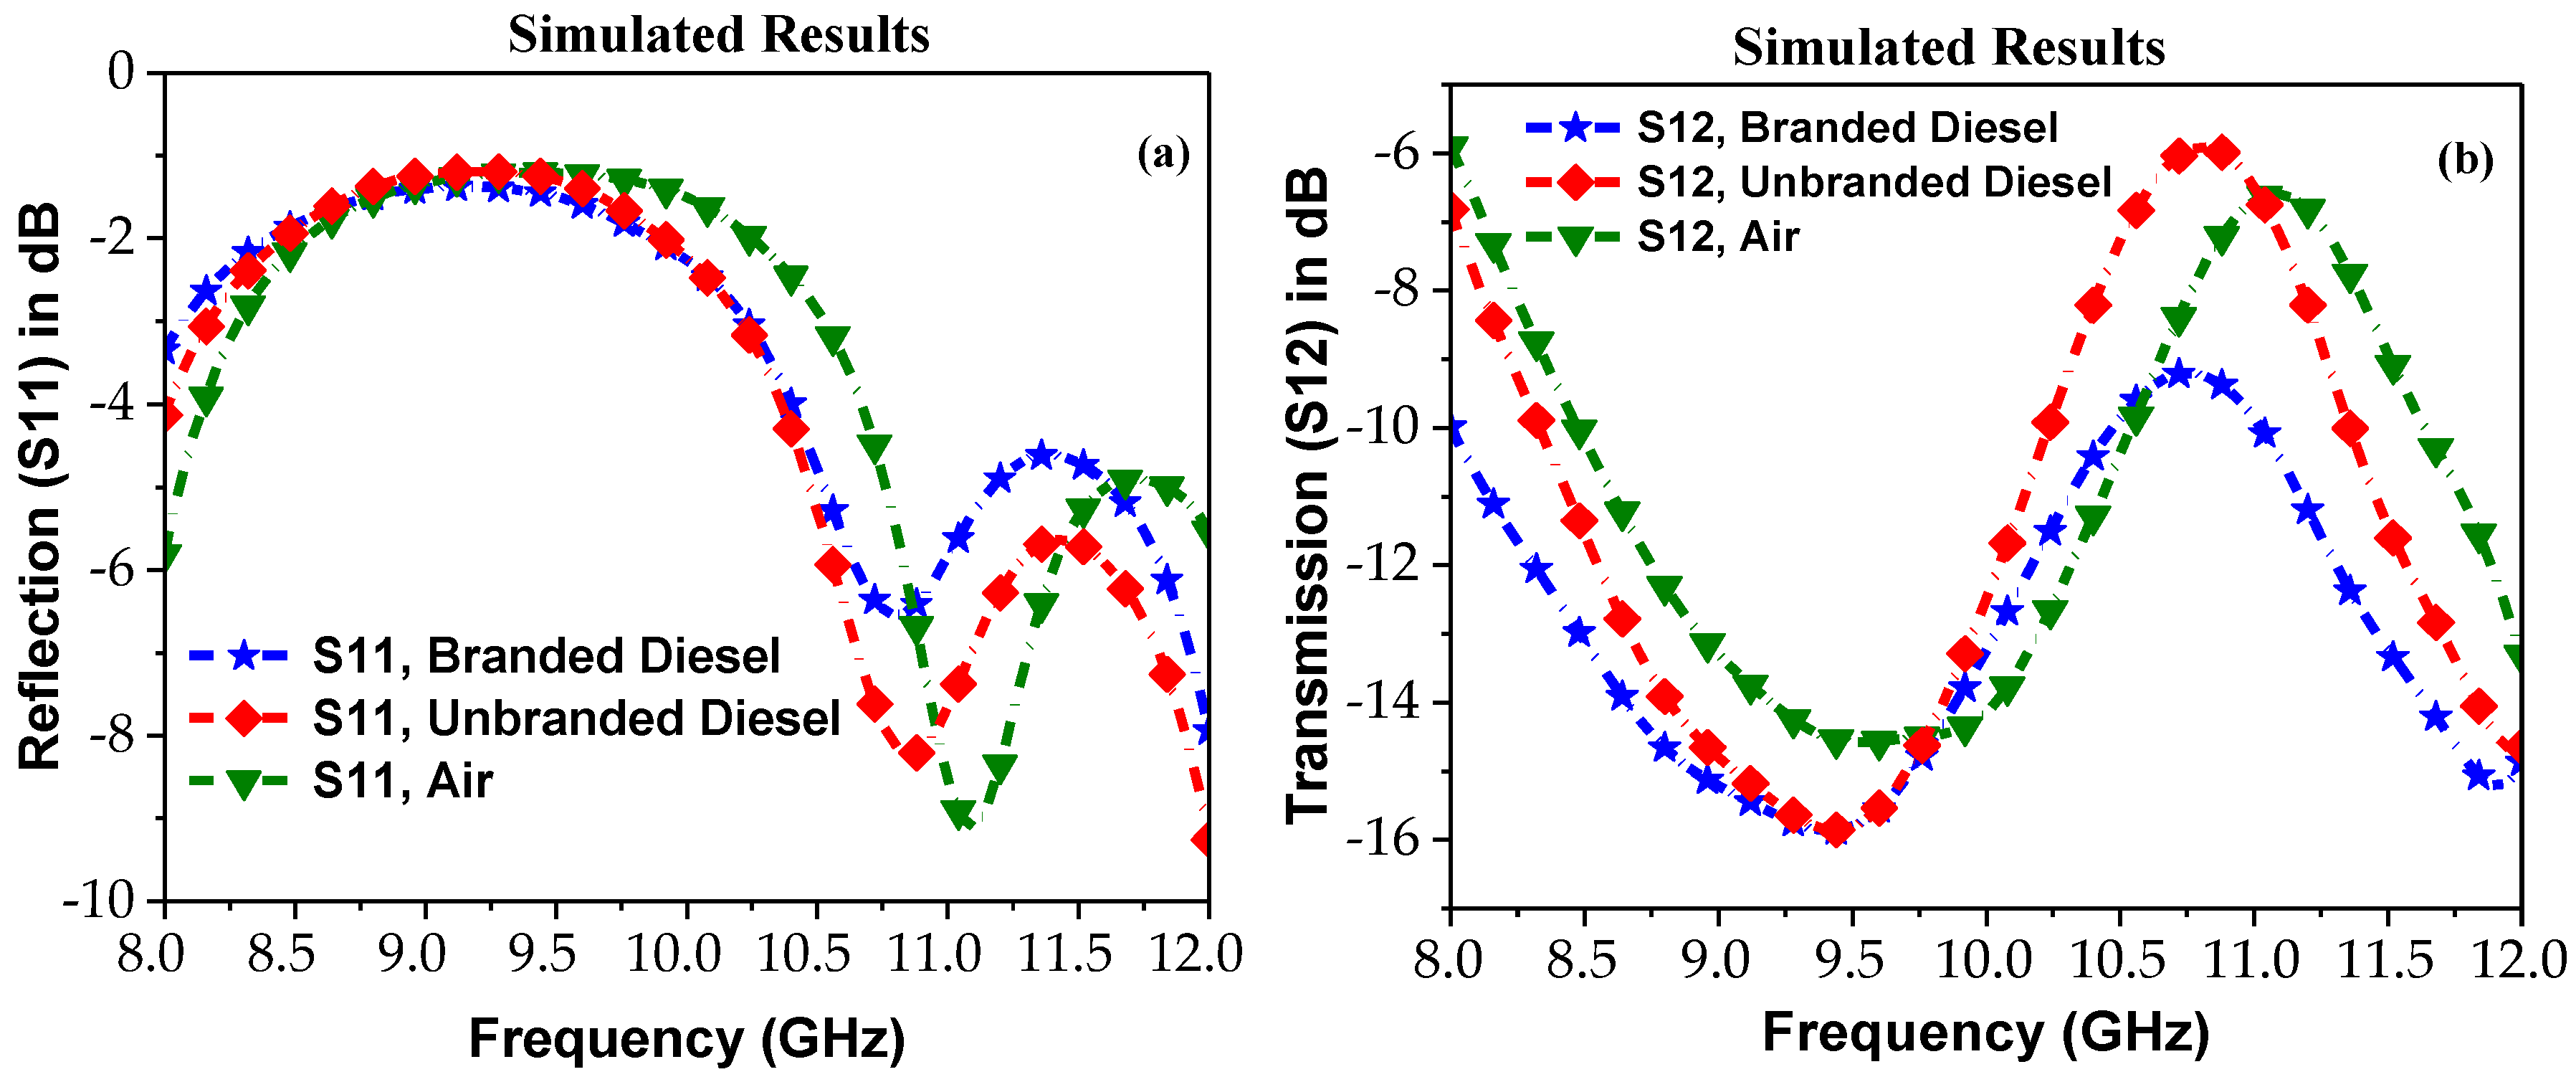
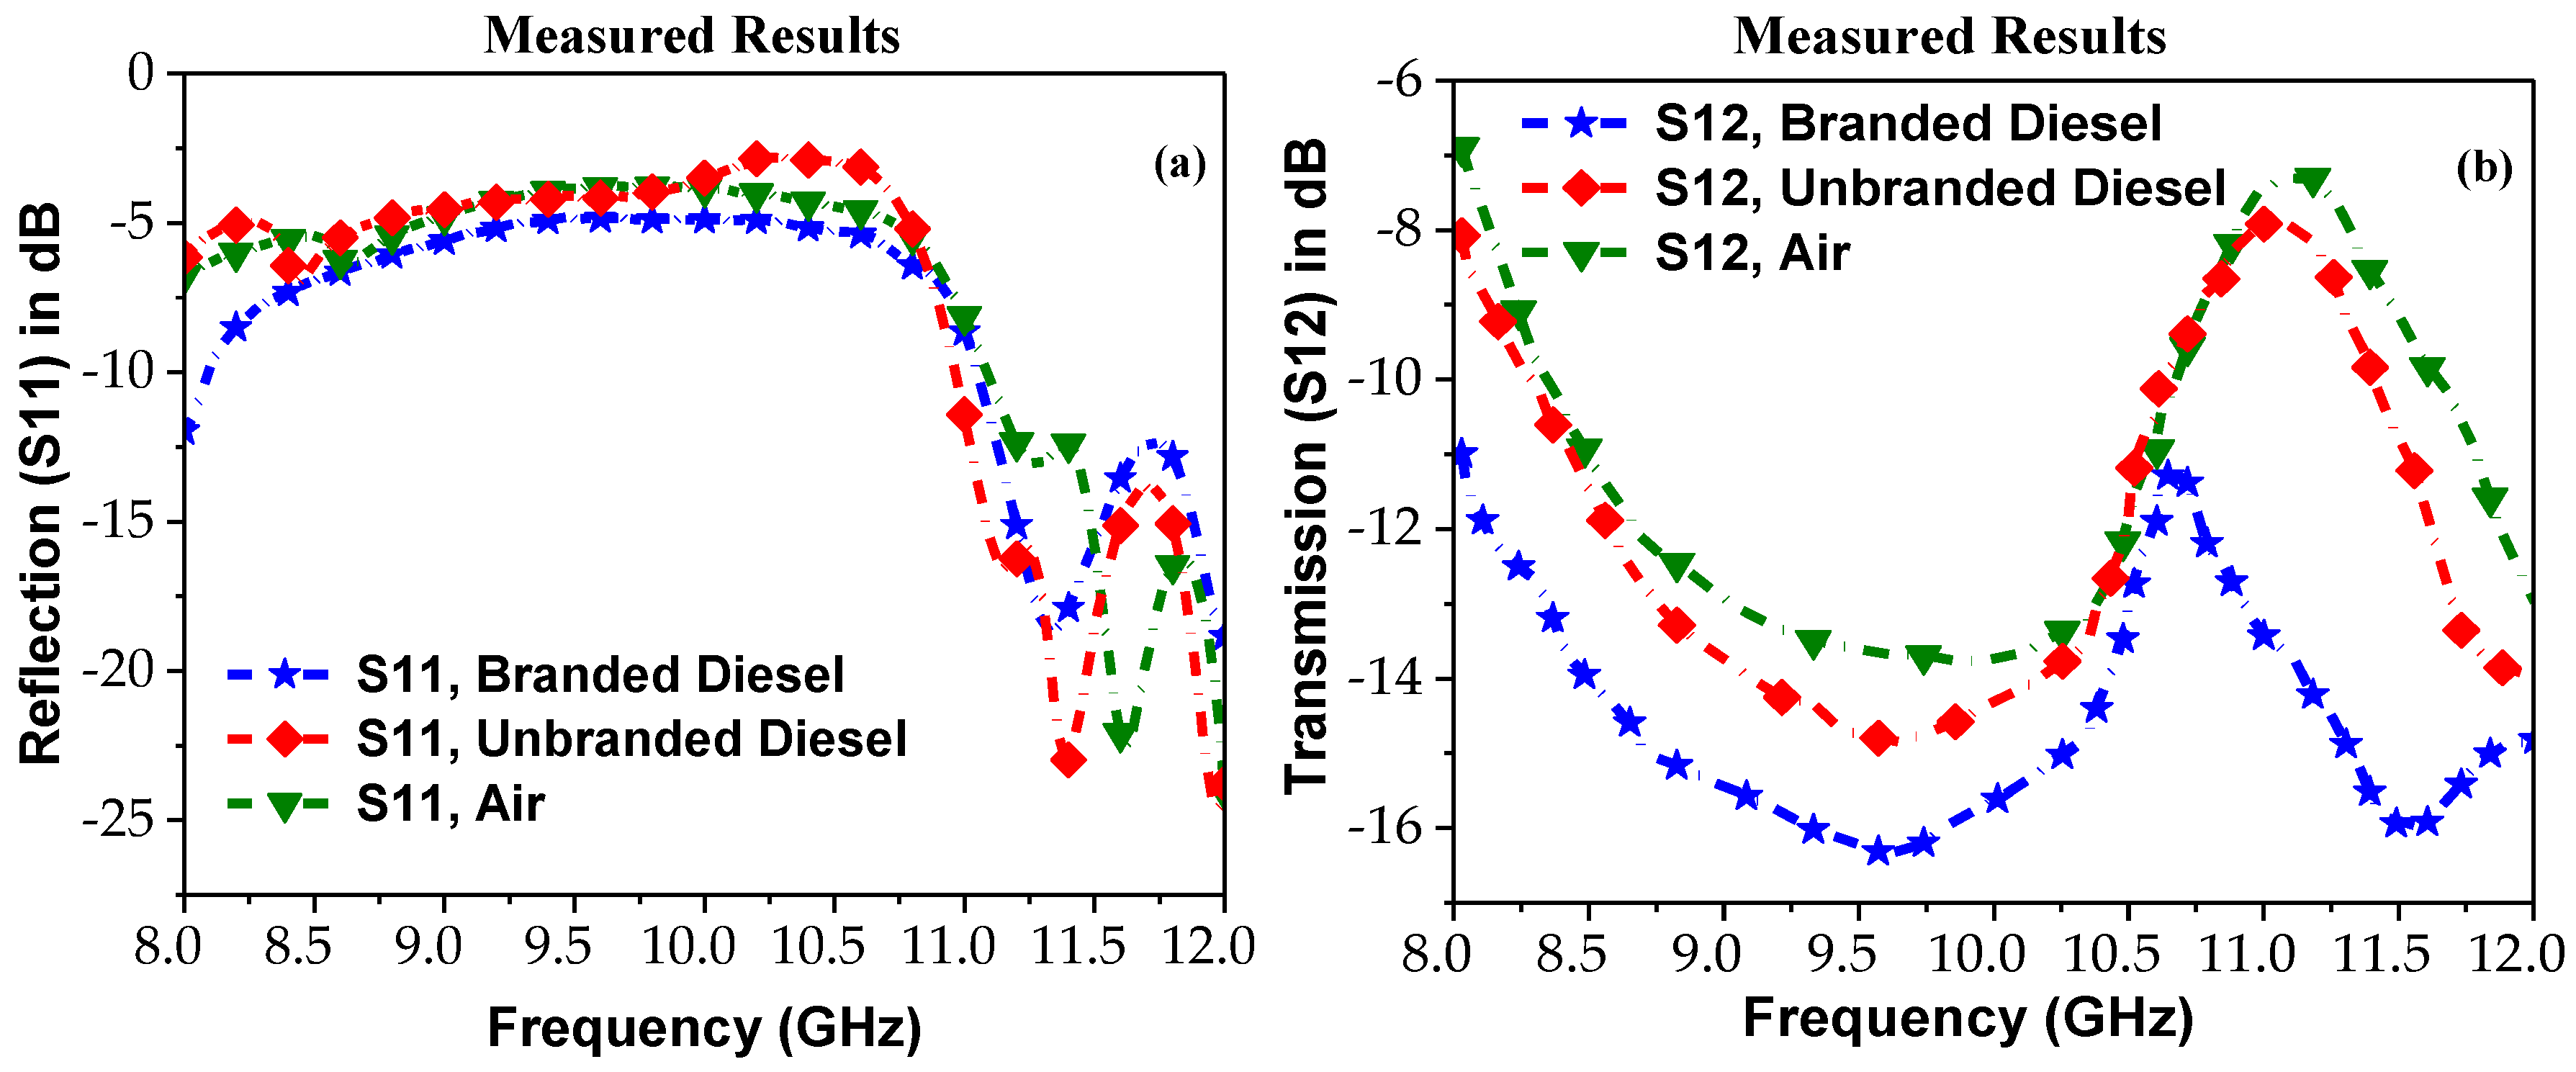
4. Simulation and Experimental Investigations

The numerical investigation was carried out by using full wave solver CST (Computer Simulation Technology) microwave software. The obtained results of the reflection, transmission, and impedance magnitudes are shown in Figure 5. In this research, a new mechanism is considered for sensing the materials by observing the possible variations in both of the reflection and transmission amplitudes in addition to the resonant frequency shift. The shift in resonant frequency has only been used by the researchers. One can notice from Figure 5 that the value of reflection spectrum has reached local minima at the resonance frequency of 11.2 GHz, while the transmission magnitude has shown a sharp peak. The impedance of the transmission line was set to be 50 Ω in orders well matched with the two ports.
The proposed metamaterials-based sensor integrated transmission line consists of three main layers as mentioned before. The important part is the sensing layer, which acts as a holder to test the samples in. Two oval-shaped holes were produced within the first and second layer. The change in the transmission phase over the frequency range from 8 GHz to 12 GHz was recorded for each of the samples, as shown in Figure 6. The degree deviations in the transmission phase around the resonant frequency with and without the presence of the samples can be interpreted as a sensing agent to the materials under detection. It was concluded that the proposed structure can easily distinguish the branded diesel from the unbranded one by monitoring shifting in the transmission phase.
The overall proposed structure and the required dimensions were optimized by using the parametrical studies and genetic algorithm technique, which is a built-in function of the CST microwave studio. The numerical investigation of the parametric studies has been carried out to address the effect of the dimension of the transmission line and sensor layer on the resonant frequency and variations in the reflection and transmission spectra. Figure 7, Figure 8, Figure 9, Figure 10 and Figure 11 show these effects when the value of permittivity of the sensor layer, width of the transmission line, and the permeability of the sensor are changed. Furthermore, the width of the transmission line, width of the resonator, and materials substrate are considered because of their high effectiveness on the resonant frequency and transmission amplitude changes.
We have specifically optimized the dimensions of the designed transmission line sensor because the main idea is to discriminate branded and unbranded chemical materials by using their electromagnetic parameters, especially permittivity and permeability values.
Figure 7 show the reflection and transmission spectral change of the proposed sensor with respect to the change of dielectric permittivity (epsilon) from 1 to 5. It was found that resonant frequency is decreased linearly with the increase of permittivity. The rate of resonant frequency shift was counted to be about 250 MHz. A similar trend of a reduction in the resonant frequency of the transmission spectrum was observed with the increase of permittivity, as shown in Figure 7b. However, the magnitude of the transmission coefficient was seen to increase, while it decreased for the reflection spectrum. The random distributions of molecular dipoles of the liquid samples are ultimately rotated and are polarized in the direction of the applied electric field. This polarization is known as dipole or oriented polarization, which can be described by Debye’s equation with its own relaxation time (τd) [38].
ϵ * = ϵ j ϵ = ϵ + ϵ s ϵ 1 + jw τ
where s and are dielectric constants at d.c. and at very high frequencies, respectively.
Figure 8 shows the change in resonant frequency and amplitude of the reflection and transmission spectra when the width of the transmission line is changed from 0.9 mm to 1.7 mm in steps of 0.2 mm. Clearly, at the resonant frequency of 10.7 GHz, the amplitude of the reflection spectrum is consistently getting deeper with the width increase of the transmission line. Noticeably, the change in the transmission line width did not affect the resonant frequency position. Consequently, from the optimization results of the genetic algorithm approach, the value of the transmission line width was fixed at 1.3 mm for the final construction of the proposed sensor.
Figure 9 shows the change in resonant frequency and amplitude of the reflection and transmission spectra when permeability of the structure is changed from 1 to 5. It was found that resonant frequency decreased linearly with the increase of permeability over the operating frequency range of 8 GHz to 12 GHz. When the value of permeability was changed from 1 to 5, the resonant frequency decreased from 10.7 GHz to 9.9 GHz. As such, the effect of change in permeability of the sensor layer on the resonant frequency and amplitude increment is clearly seen when the permeability is increased from 1 to 5. We calculated that dependency due to pure diesel is a non-magnetic material. However, the insertion of additives to the branded diesel before it reaches the user makes it susceptible to a magnetic field.
It was concluded that the resonant frequency of the proposed structure was severely affected by the change in the permittivity and permeability of the sensor layer rather than by the width of the transmission line. This is because the sensor layer acts as a reservoir for the chemical samples and, hence, any trivial changes in the electromagnetic parameters can affect the resonant frequency shift.
Figure 10 shows the result of changing substrate material while the other parameters were fixed. In the current work, the FR4 substrate was chosen due to its low loss, high mechanical strength, and low cost. When the substrate material was changed, the resonant frequency was shifted by approximately 220 MHz.
The final parametric study was meant to change the width of the wing resonators. The width of upper and lower wings was modified and the optimum values of the resonator width were found to be 1.5 mm and 1 mm, respectively. The upper width was increased from 0.9 mm to 2.1 mm in steps of 0.3 mm, while the lower width was increased from 0.4 mm to 1.6 mm in steps of 0.3 mm. Figure 11a shows the simulated results of the reflection of the proposed structure. One can see from the figure that a clear resonant shift appears when the width of the resonator is increased and, hence, the resonant frequency shift is about 500 MHz. There exist resonant frequency shifts influenced by the change in the width of the resonator.
The simulated electric field and surface current distributions for the branded and unbranded diesel samples were investigated at the resonant frequency of 8.39 GHz and 8.41 GHz aimed at better understanding the working principle of the designed structure. These results are shown in Figure 12 and Figure 13, respectively.
The electric field distributions for the branded diesel sample at the resonance frequency of 8.39 GHz are mostly located at discrete port one with a small concentration around port two. This is where the electric field distribution at the two oval resonators spanned towards port one with less concentration around port two (see Figure 12a). Comparably, the unbranded diesel has led to a lower field distribution at port one. This can be due to the different dielectric behavior of the samples, which was previously seen in Figure 4. It is known that the electromagnetic field can travel through the two ported conductive transmission lines. The field should be in TEM mode, where the electric field and magnetic field components are perpendicular to each other and are perpendicular to the propagation direction. The transmission line is copper, which is a metallic layer and, hence, it is affected by the electric field component of the travelling wave. As shown in Figure 12 and Figure 13, the proposed metamaterial-based sensor allows electric fields and the current flow is bidirectional from the center of the resonator to the ports and vice versa.
Figure 13 shows the surface current distribution for the branded and unbranded diesel at the resonance frequency of 8.39 GHz and 8.41 GHz, respectively. For the branded diesel, it was observed that the current flow is bidirectional from the center of the resonator to the ports and vice versa. However, for the unbranded diesel, a unidirectional current flow from port one to port two was seen. The current distributing on the two oval resonators emerges from the outside and enters at the resonator’s junction. Consequently, the parallel and antiparallel current flowing is responsible for controlling the electric and magnetic responses, respectively. In conclusion, the electric and magnetic response of the whole sensor can be interpreted to detect various samples based on their intrinsic properties such as dielectric parameters.
Following the simulation studies, the MTM-based sensor with the integrated transmission line was fabricated and measurements were taken by using the vector network analyzer (Agilent PNA-L series). The proposed sensor was manufactured by using the LPKF E33 Printed Circuit Board (PCB) Computerized Numerical Control (CNC) machine under the same condition of the simulated one.
The measurement process was started by calibrating the Vector Network Analyser (VNA) (with a calibration kit including open circuit, short circuit, and 50 Ω load connectors in the frequency range of interest (x-band), as shown in Figure 14. The fabricated sensor was connected to two coaxial cables from both ends. Under similar conditions of the numerical simulation, the samples were directly inserted into the sensor layer without the presence of any sample holders. This way, the reflection and transmission coefficients of the branded and unbranded diesel samples were simulated and measured, as shown in Figure 15 and Figure 16.
The numerical study for the proposed sensor has been performed by a CST studio suite electromagnetic solver. The data files of the measured dielectric constant and loss tangent were imported into the program. Subsequently, the reflection and transmission coefficients were monitored over the frequency band of 8–12 GHz (X-band), as shown in Figure 15. For the sensing capability of a sensor to be assessed, researchers commonly monitor the trivial shifts in the resonant frequency. In this work, variation in the transmission value is also considered to show the sensitivity of the proposed structure.
Figure 15a shows that, at the resonant frequency of 10.7 GHz, the reflection coefficient (S11) is about −6.5 dB and −8 dB for the branded and unbranded diesels, respectively. However, in the case of the air sample, the S11 value was about −9.1 dB. Furthermore, the resonant frequency shifts between that of the branded and unbranded diesel is about 120 MHz. Comparably, it is seen from Figure 15b that the transmission coefficient (S21) for the branded diesel, unbranded diesel, and air are −10 dB, −6.8, and −6 dB, respectively. It was observed that, when the sample was changed from branded to unbranded diesel, the transmission value increased by about −3.2 dB. Interestingly, this significant variation of the transmission coefficient in the case of branded and unbranded diesel demonstrates high sensitivity of the proposed sensor.
Figure 16 shows the measured results of reflection and transmission coefficients in three different cases. The first case is when the sensor was tested without liquid samples (air presented). The second and third cases are when the sensor was tested for branded and unbranded diesels. One can notice from Figure 16a that the reflection value at the resonance frequency of 10.7 GHz is about −12 dB, 7 dB, and −7.5 dB for the branded diesel, unbranded diesel, and air, respectively. Additionally, the shift between resonant frequency of the branded and unbranded diesel was found to be about 120 MHz. For the transmission value at 9.39 GHz resonant frequency, its amplitude was found to be −11 dB, −8 dB, and −6.8 dB for branded diesel, unbranded diesel, and air, respectively. As such, the difference between the transmission value of the branded and unbranded diesels is about −3 dB. The measured and numerical results are in good agreement with the presence of some fluctuations, which might be attributed to the manufacturing process, soldering, and calibration errors. Lastly, it is concluded that the proposed metamaterials-based sensor integrating transmission line has a high sensitivity, which can be readily used to distinguish between different chemical liquids. We believe that the designed structure can be applied in real-time life and in different applications such as chemical, industrial, and medical applications.
The decision to use the amplitude variation in this work because the change in amplitude is directly correlated to the change in dielectric constant, the normalization process is not required to be performed. Any changes in the amplitude of the transmission coefficient reflect the changes in the dielectric parameters.
The reason is that the maximum shift of −3.2 dB in the transmission peak was seen, which is higher than those reported in literature. The key issue of considering the peak of transmission value instead of resonant frequency can be due to the trivial effect of the dielectric variation on the resonant frequency when compared to its pronounced impact on the transmission value. We believe that the shape and design architecture of the proposed sensor plays a vital role in defining such a variation in the transmission peak, whereas composition of the chemical materials favorably affect the electromagnetic transmission behavior of the sample under test. In this work, the amplitude variation was highly considered as the sensing agent to detect the branded and unbranded samples, unlike the other published works that have solely depended on the resonant frequency shifts.
In terms of measured dielectric constant, loss tangent, frequency range, sensitivity (amplitude variation), or difference in the transmission value and resonance frequency shifts, results of the proposed Metamaterial (MTM)-based sensor integrated transmission line were compared to those of the literature, as shown in Table 3.

5. Conclusions

In this work, a new design of metamaterials-based sensor integrated transmission line has been successfully designed and fabricated to be used for chemical detection. Both numerical and experimental investigations were realized in the x-band (8–12 GHz) frequency range. The proposed structure was made of two oval-shaped resonators deposited onto the FR4 substrate with integrated transmission lines on both ends and a ground plane of copper metal. The dielectric constant and loss tangent of the branded and unbranded diesel has been examined and was measured to be 2.73, 2.47, 0.18, and 0.213, respectively. The simulated and experimental results confirmed that the proposed structure has a higher sensitivity when compared to those reported in literature. In this study, the difference in transmission amplitude of the branded and unbranded diesel was −3.2 dB, while the resonant frequency shift between these two samples was about 120 MHz. It was concluded that parametric investigation is crucial to build useful correlation between the resonant frequency and amplitude change in the reflection and transmission spectra of the proposed sensor. Results showed a clear shift in the resonant frequency for the branded and unbranded diesels under test, which implies that the proposed metamaterials’ structure has a good sensitivity and can be easily utilized to distinguishing any chemical liquids even though their dielectric constant are close enough.

Author Contributions

Y.I.A. and M.K. conceived the idea. Y.I.A. and H.N.A. performed the simulations. Ş.D. and F.O.A. performed the experiment. Y.I.A. wrote the manuscript. R.H.M., L.D., F.F.M., S.H., H.L., and M.K. revised the manuscript. M.K. and L.D. supervise this work. All authors have read and agreed to the published version of the manuscript.

Funding

The National Key Research and Development Program of China (Grant no.2017YFA0204600), the National Natural Science Foundation of China (Grant no. 51802352), and the Fundamental Research Funds for the Central Universities of Central South University (Grant no. 2018zzts355) supported this work.

Acknowledgments

The author would like to thanks Central South University and Iskenderun Technical University for technical support.

Conflicts of Interest

The authors declare no conflict of interest.

References

  1. Yan, H.; Wang, H.; Vladareanu, L.; Lin, M.; Vladareanu, V.; Li, Y. Detection of Participation and Training Task Difficulty Applied to the Multi-Sensor Systems of Rehabilitation Robots. Sensors 2019, 19, 4681. [Google Scholar] [CrossRef] [Green Version]
  2. Faragó, P.; Gălătuș, R.; Hintea, S.; Boșca, A.B.; Feurdean, C.N.; Ilea, A. An Intra-Oral Optical Sensor for the Real-Time Identification and Assessment of Wine Intake. Sensors 2019, 19, 4719. [Google Scholar] [CrossRef] [Green Version]
  3. Al-Naib, I. Biomedical sensing with conductively coupled terahertz metamaterial resonators. IEEE J. Sel. Top. Quantum Electron. 2017, 23, 1–5. [Google Scholar] [CrossRef]
  4. Abdulkarim, Y.I.; Deng, L.; Karaaslan, M.; Unal, E. Determination of the liquid chemicals depending on the electrical characteristics by using metamaterial absorber based sensor. Chem. Phys. Lett. 2019, 732, 136655. [Google Scholar] [CrossRef]
  5. Abdulkarim, Y.I.; Deng, L.; Altıntaş, O.; Ünal, E.; Karaaslan, M. Metamaterial absorber sensor design by incorporating swastika shaped resonator to determination of the liquid chemicals depending on electrical characteristics. Phys. E Low-dimens. Syst. Nanostruct. 2019, 114, 113593. [Google Scholar] [CrossRef]
  6. Shelby, R.A.; Smith, D.R.; Schultz, S. Experimental Verification of a Negative Index of Refraction. Science 2001, 292, 77–79. [Google Scholar] [CrossRef] [PubMed] [Green Version]
  7. Smith, D.R.; Padilla, W.J.; Vier, D.C.; Nemat-Nasser, S.C.; Schultz, S. Composite Medium with Simultaneously Negative Permeability and Permittivity. Phys. Rev. Lett. 2000, 84, 4184–4187. [Google Scholar] [CrossRef] [Green Version]
  8. Naqui, J.; Martı, F. Transmission Lines Loaded With Bisymmetric Resonators and Their Application to Angular Displacement and Velocity Sensors. IEEE Trans. Microw. Theory Tech. 2013, 61, 4700–4713. [Google Scholar] [CrossRef]
  9. Abdulkarim, Y.I.; Deng, L.; Karaaslan, M.; Altıntaş, O.; Awl, H.N.; Muhammadsharif, F.F.; Liao, C.; Unal, E.; Luo, H. Novel Metamaterials-Based Hypersensitized Liquid Sensor Integrating Omega-Shaped Resonator with Microstrip Transmission Line. Sensors 2020, 20, 943. [Google Scholar] [CrossRef] [Green Version]
  10. Zarifi, M.H.; Sohrabi, A.; Shaibani, P.M.; Daneshmand, M.; Thundat, T. Detection of Volatile Organic Compounds Using Microwave Sensors. IEEE Sens. J. 2014, 15, 248–254. [Google Scholar] [CrossRef]
  11. Staszek, K.; Piekarz, I.; Sorocki, J.; Koryciak, S.; Wincza, K.; Gruszczynski, S. Low-cost microwave vector system for liquid properties monitoring. IEEE Trans. Ind. Electron. 2017, 65, 1665–1674. [Google Scholar] [CrossRef]
  12. Boybay, M.S.; Ramahi, O.M. Material characterization using complementary split-ring resonators. IEEE Trans. Instrum. Meas. 2012, 61, 3039–3046. [Google Scholar] [CrossRef]
  13. Ebrahimi, A.; Withayachumnankul, W.; Al-Sarawi, S.; Abbott, D. High-sensitivity metamaterial-inspired sensor for microfluidic dielectric characterization. IEEE Sens. J. 2014, 14, 1345–1351. [Google Scholar] [CrossRef] [Green Version]
  14. Saadeldin, A.S.; Hameed, M.F.O.; Elkaramany, E.M.; Obayya, S.S. Highly Sensitive Terahertz Metamaterial Sensor. IEEE Sens. J. 2019, 19, 7993–7999. [Google Scholar] [CrossRef]
  15. Ebrahimi, A.; Scott, J.; Ghorbani, K. Ultrahigh-sensitivity microwave sensor for microfluidic complex permittivity measurement. IEEE Trans. Microw. Theory Tech. 2019, 67, 4269–4277. [Google Scholar] [CrossRef]
  16. Salim, A.; Lim, S. Review of recent metamaterials microfluidic sensor. Sensors 2018, 18, 232. [Google Scholar] [CrossRef] [Green Version]
  17. Zhang, X.; Ruan, C.; Chen, K. High-sensitivity microwave sensor for liquid characterization using a complementary circular spiral resonator. Sensors 2019, 19, 787. [Google Scholar] [CrossRef] [Green Version]
  18. Sadeqi, A.; Nejad, H.R.; Sonkusale, S. Low-cost metamaterial-on-paper chemical sensor. Transducers Int. Conf. Solid-State Sens. Actuators Microsyst. 2017, 25, 1437–1440. [Google Scholar] [CrossRef]
  19. Withayachumnankul, W.; Abbott, D. Metamaterials in the terahertz regime. IEEE Photonics J. 2009, 1, 99–118. [Google Scholar] [CrossRef]
  20. Soffiatti, A.; Max, Y.; Silva, S.; M de Mendonça, L. Microwave Metamaterial-Based Sensor for Dielectric Characterization of Liquids. Sensors 2018, 18, 1513. [Google Scholar] [CrossRef] [Green Version]
  21. Zaid, J.; Abdulhadi, A.; Denidni, T. Miniaturized Multi-Port Microstrip Patch Antenna Using Metamaterial for Passive UHF RFID-Tag Sensor Applications. Sensors 2019, 19, 1982. [Google Scholar] [CrossRef] [Green Version]
  22. Muñoz-Enano, J.; Vélez, P.; Gil, M.; Mata-Contreras, J.; Grenier, K.; Dubuc, D.; Martin, F. Microstrip Lines Loaded with Metamaterial-Inspired Resonators for Microwave Sensors/Comparators with Optimized Sensitivity. In Proceedings of the 49th European Microwave Conference (EuMC), Paris, France, 1–3 October 2019; Volume 1, p. 19173789. [Google Scholar] [CrossRef]
  23. Bakır, M.; Karaaslan, M.; Karadag, F.; Dalgac, S.; Ünal, E.; Akgöl, O. Metamaterial sensor for transformer oil, and microfluidics. Appl. Comput. Electromagn. Soc. J. 2019, 34, 799. [Google Scholar]
  24. Lee, Y.; Kim, S.J.; Park, H.; Lee, B. Metamaterials and Metasurfaces for Sensor Applications. Sensors 2017, 17, 1726. [Google Scholar] [CrossRef] [Green Version]
  25. Luk’yanchuk, B.; Zheludev, N.I.; Maier, S.A.; Halas, N.J.; Nordlander, P.; Giessen, H.; Chong, C.T. The Fano resonance in plasmonic nanostructures and metamaterials. Nat. Mater. 2010, 9, 707–715. [Google Scholar] [CrossRef] [PubMed]
  26. Li, J. Permittivity measurement of low-loss substrates based on split ring resonators. World J. Eng. Technol. 2017, 5, 62–68. [Google Scholar] [CrossRef] [Green Version]
  27. Vélez, P.; Su, L.; Grenier, K.; Mata-Contreras, J.; Dubuc, D.; Martín, F. Microwave microfluidic sensor based on a microstrip splitter/combiner configuration and split ring Resonators (SRRs) for dielectric characterization of liquids. J. IEEE Sens. 2017, 17, 6589–6598. [Google Scholar] [CrossRef] [Green Version]
  28. Rawat, V.; Joglekar, S.; Bhagat, B.; Kale, S.N. Nanomaterial-Functionalized-Metamaterial-Inspired Resonators for Ultra-Sensitive and Selective H2S Sensing. In Proceedings of the IEEE Sensors, New Delhi, India, 28–31 October 2018; Volume 31, pp. 1–4. [Google Scholar] [CrossRef]
  29. Lee, H.J.; Yook, J.G. Biosensing using split-ring resonators at microwave regime. Appl. Phys. Lett. 2008, 92, 254103. [Google Scholar] [CrossRef]
  30. Bahar, A.A.M.; Zakaria, Z.; Arshad, M.M.; Isa, A.A.M.; Dasril, Y.; Alahnomi, R.A. Real time microwave biochemical sensor based on circular SIW approach for aqueous dielectric detection. Sci. Rep. 2019, 9, 5467. [Google Scholar] [CrossRef]
  31. Tamer, A.; Karadağ, F.; Ünal, E.; Abdulkarim, Y.I.; Deng, L.; Altintas, O.; Bakir, M.; Karaaslan, M. Metamaterial based sensor integrating transmission line for detection of branded and unbranded diesel fuel. Chem. Phys. Lett. 2020, 742, 137169. [Google Scholar] [CrossRef]
  32. Tamer, A.; Alkurt, F.O.; Altintas, O.; Karaaslan, M.; Unal, E.; Akgol, O.; Karadag, F.; Sabah, C. Transmission line integrated metamaterial based liquid sensor. Electrochem. Soc. 2018, 165, B251–B257. [Google Scholar] [CrossRef]
  33. Altıntaş, O.; Aksoy, M.; Ünal, E. Design of a metamaterial inspired omega shaped resonator based sensor for industrial implementations. Phys. E Low-dimens. Syst. Nanostruct. 2020, 116, 113734. [Google Scholar] [CrossRef]
  34. Altintaş, O.; Aksoy, M.; Ünal, E.; Karaaslan, M. Chemical liquid and transformer oil condition sensor based on metamaterial-inspired labyrinth resonator. Electrochem. Soc. 2019, 166, B482–B488. [Google Scholar] [CrossRef]
  35. Tümkaya, M.A.; Karaaslan, M.; Sabah, C. Metamaterial-based high efficiency portable sensor application for determining branded and unbranded fuel oil. Bull. Mater. Sci. 2018, 41, 91. [Google Scholar] [CrossRef] [Green Version]
  36. Tümkaya, M.A.; Karaaslan, M.; Sabah, C. Metamaterial-Based Fluid Sensor for Identifying Different Types of Fuel Oil Samples. Chin. J. Phys. 2018, 56, 1872–1878. [Google Scholar] [CrossRef]
  37. Tümkaya, M.A.; Dinçer, F.; Karaaslan, M.; Sabah, C. Sensitive Metamaterial Sensor for Distinction of Authentic and Inauthentic Fuel Samples. J. Electron. Mater. 2017, 46, 4955–4962. [Google Scholar] [CrossRef]
  38. Mehrotra, P.; Chatterjee, B.; Sen, S. EM-Wave Biosensors: A Review of RF, Microwave, mm-Wave and Optical Sensing. Sensors 2019, 19, 1013. [Google Scholar] [CrossRef] [Green Version]
Figure 1. (a) The metamaterial-based sensor: 3D view and (b) its equivalent circuit model.
Electronics 09 00825 g001
Figure 2. (a) The proposed metamaterial sensor: boundary condition and (b) optimum dimensions.
Electronics 09 00825 g002
Figure 3. Experimental setup to measure the samples by the 85070E dielectric probe kit.
Electronics 09 00825 g003
Figure 4. (a) Measured results of dielectric constant and (b) dielectric loss factor for branded and unbranded diesel.
Electronics 09 00825 g004
Figure 5. Normalized reflection, transmission, and impedance spectra for the proposed metamaterials-based sensor while the sensor layer was filled with air.
Electronics 09 00825 g005
Figure 6. Simulated transmission phase for air, branded diesel, and unbranded diesel.
Electronics 09 00825 g006
Figure 7. (a) Effect of epsilon variation of the sensor layer on the resonant frequency and amplitude in the reflection spectrum and (b) transmission spectrum.
Electronics 09 00825 g007
Figure 8. (a) Parametric study of the effect of transmission line width on the reflection spectrum (a) and (b) transmission spectrum.
Electronics 09 00825 g008
Figure 9. (a) Simulated variation effect of permeability of the sensor layer on the resonant frequency in the reflection and (b) transmission spectra.
Electronics 09 00825 g009
Figure 10. (a) Simulated variation effect of materials of the substrate layer on the resonant frequency in the reflection and (b) transmission spectra.
Electronics 09 00825 g010
Figure 11. (a) Simulated variation effect of width of the resonator layer on the resonant frequency in the reflection and (b) transmission spectra.
Electronics 09 00825 g011
Figure 12. (a) Simulated electric field distributions for branded diesel at 8.39 GHz and (b) unbranded diesel at 8.41 GHz.
Electronics 09 00825 g012
Figure 13. (a) Surface current distributions for branded diesel at 8.39 GHz and (b) unbranded diesel at 8.41 GHz.
Electronics 09 00825 g013
Figure 14. (a) Photograph of the fabricated structure connected to the vector network analyzer under the test and (b) the complete experimental setup.
Electronics 09 00825 g014
Figure 15. (a) Simulated result for air, branded diesel, and unbranded diesel samples: reflection coefficient and (b) transmission coefficient.
Electronics 09 00825 g015
Figure 16. (a) Measured result of the reflection coefficient and (b) transmission coefficient for the empty sensing layer, branded diesel, and unbranded diesel.
Electronics 09 00825 g016
Table 1. Properties of the diesel used in this study.
PropertyUnitDiesel
Density at 60 °Ckg/m3832.4
Water contentmg/kg160
Carbon content% wt87.2
Heating valueMJ/kg43
Sulfur contentppwt9.1
Oxygen content% wt0.77
Hydrogen content% wt12
Table 2. Dielectric constant and loss tangent value for branded and unbranded diesel at different frequencies.
Dielectric Constants (ε)Loss Tangent (tanδ)
Frequency (GHz)Diesel (Branded)Diesel (Unbranded)Diesel (Branded)Diesel (Unbranded)
82.732.470.180.213
92.662.420.210.24
102.602.350.2390.262
112.542.280.2630.28
122.462.210.2820.291
Table 3. Comparison of frequency range, dielectric constant, loss tangent, variation of transmission coefficient, and resonant frequency shift with other similar studies published in literature.
ReferenceFrequency Range (GHz)Dielectric ConstantLoss Tangent (tan δ)Publication YearResonant Frequency Shift (MHz)Sensitivity (Amplitude Variation) in dB
Branded Diesel and Unbranded Diesel
Current work8–122.73 and 2.470.18 and 0.213-120−3.2
[31]8–122.72 and 2.480.49 and 0.53202060−0.8
[32]8–122.41 for Authentic and 1.5 for Inauthentic Gasoline0.81 for Authentic and 0.28 for Inauthentic Gasoline2018500−1
[33]8–122.7 and 2.50.50 and 0.492020172−0.9
[35]10–122.07 and 2.680.15 and 0.16201872−1.9
[36]8–122.08 and 2.70.15 and 0.162018104−2
[37]10–112.07 and 2.680.15 and 0.162017100−1.9

