1. Introduction
Automotive OEMs (original equipment manufacturers) are investing in advanced electronics to provide a safer experience for their customers. To prevent putting any driver in danger and to avoid liability issues, OEMs and its supply chain (down to the IP provider) must produce evidence of “absence of unreasonable risk”—the definition of “safety” according to the ISO 26262 standard. The first edition of the ISO 26262 was published in 2011, containing the state-of-the-art framework for achieving Functional Safety [
1]. Recently, a second version of the standard was released in 2018, further refining the guidance to safety activities related to the semiconductor development like fault injection [
2]. Although being just a recommendation, the ISO 26262 is implicitly mandatory due to existing regulations that demand “current state of science and technology” when developing safety applications [
3,
4].
During the safety analysis (e.g., supported by an FMEDA—Failure Mode Effect and Diagnostic Analysis—tool), it is possible to see which parts of the design that most contribute to the overall failure rate. Actions to reduce the failure rate to an acceptable level must be made—for example, by adding safety mechanisms (SM) in order to bring and keep the design in a safe state when a fault occurs. The proportion of the hardware failure rate that is detected or controlled by an SM is given by its diagnostic coverage (DC).
An SM implements techniques to prevent single-point faults from directly leading to a failure. In the case of automotive safety integrity level (ASIL) diagnostic (D), the SM needs to cover 99% of the single point faults—in other words, only 1% of residual single point faults is allowed. Thus, implementing extras SMs can reduce the number of residual faults, and hence minimize the failure rate associated with single-point faults that were not prevented by the first SM. The failure rate related to multi-point faults corresponds to the risk of a latent fault, which cannot directly lead to failure, to propagate and to disrupt the circuit functionally when a second fault occurs. For that reason, the SMs must be capable of detecting 90% of the prevented faults thus minimizing the number of latent faults in order to claim ASIL D compliance.
In this context, fault injection techniques are recommended to assess DC relative to residual faults or to the faults that remain latent. The assessment can be done using the design model at gate-level, when fault injection at the hardware product level is difficult (e.g., using irradiation tests), especially, if the SM is deeply integrated into a complex circuit like a micro-controller. After assessing the DC of the whole circuit, then the hardware architectural metrics associated with the single point faults and latent faults are calculated.Therefore, it is essential to have efficient fault injection solutions and methodologies to support this challenging task.
Given the distinct possibilities of employing fault injection, it is important to define the research scope clearly. From the perspective of this paper proposal, fault injection means the imitation of fault effects at the semiconductor level, using the design model prior to production – that is, HDL (hardware description language), either RTL (register transfer level) or GL (gate-level).
Thus, this paper presents a methodology to accelerate diagnostic coverage assessment (M-AC/DC) approach, which leverages the advanced verification tools (e.g., simulators and emulation solutions) to accelerate DC assessment. Fault injection acceleration plays a key role, as it is required to augment the confidence of the DC numbers initially estimated. Thus, DC estimation based only on expert judgment might not be acceptable when solutions like M-AC/DC are available, especially if the ASIL is set to coverage or diagnostic. M-AC/DC traverses the gate-level netlist to identify the faults to accelerate. An OpenRISC architecture is used to exemplify the M-AC/DC approach.
This paper is organized as follows. A review of related works is presented in
Section 2.
Section 3 presents the proposed methodology. Simulation results are shown in
Section 4. Final remarks appear in
Section 5.
2. Related Work
Different fault injection approaches have been proposed over the last decades. Many of them aiming to optimize the assessment of dependability attributes—for example, availability, reliability, and safety—of fault tolerant designs [
5]—especially against soft errors. The techniques can be grouped according to the technology/method that underlies the fault injection, which can be: hardware or physical injection, simulation, and emulation. Software-based fault injection can be another group when distinguishing hardware design that processes software [
6]. Each approach has specific characteristics that define its application suitability. For example, simulation-based approaches are likely to provide more controllability and observability, while there is a compromise between accuracy and performance that must be considered. Field-programmable gate arrays (FPGA) are the most common technology used to emulate fault injection by providing the performance that lacks in the simulation based solutions. Minimal design modifications—also called instrumentation—are required to enable similar controllability and observability tough. Despite the facilities costs and the setup complexity, hardware or physical fault injection requires a prototype only available too late in the design flow and hence not considered here.
Emulation-based solutions, often using FPGAs, are typically proposed to overcome the long run time of fault simulation [
5,
6]. In the FPGA-based flow, the design must be synthesized to the specific target device, which is later configured with the resulting bitstream—that is, the “synthesis image”. Different approaches to avoid synthesizing the design for each fault injection have been proposed over the years in order to overcome this bottleneck and enable the benefit of emulation-acceleration [
7,
8,
9,
10]. However, either they use highly intrusive methods to enable the injection, or they rely on device dependent features that limit their applicability. Researches that explore emulation platforms not based on FPGAs show interesting acceleration results [
11,
12]. However, their approaches also rely on the instrumenting design model to enable higher fault injection performance.
A safety assessment based on the actual design model will avoid the additional effort of collecting evidence and the risk of not convincing an auditor. Therefore, this paper presents an approach to accelerate diagnostic coverage verification (M-AC/D), as a result of the proposed non-intrusive fault injection solution. The proposed solution explores the hardware-assisted verification platform—also used in [
11,
12]—to emulate faults injection on the actual design model. Additionally, the M-AC/D uses the latest commercial fault simulators that already target the functional safety market. Therefore, leveraging the state-of-the-art verification technologies, the M-AC/D may provide helpfull insights in future recommendations of the standard, since it allows a more thorough DC assessment in a feasible time.
The presented M-AC/DC methodology does not require changing the design description neither to provide the required controllability/observability nor to synthesize for a different technology than the targeted one. Next is a review with some comments on the related work considering their application to functional safety.
2.1. FPGA-Based Acceleration via Instrumentation
FPGA technology is vastly explored to accelerate fault injection campaigns. In 2001, Civera et al. [
13,
14] presented an instrumentation approach in order to provide the controllability and observability required to enable the fault injection emulation. In the next year, the more recent published results have shown a slight increase in the area overhead—that is, between 8% and 42%—imposed by the presented solution [
15]. The reported acceleration was up to 60 times faster fault injection when compared to fault simulation.
Lopez-Ongil et al. [
16] in 2007 proposed an approach also based on instrumentation to enable the control of the design atomic parts in order to inject the faults. However, the presented “time-multiplexed” technique seems to be the main difference of this solution, which allows having the fault-free and the faulty version of the design running in alternate clock cycles.Another two instrumentation techniques are presented with less area overhead, but consuming more memory resources of the FPGA. The claimed performance is about 106 SEU (Single Event Upsets) fault injections per second. However, such performance is achieved by quadruplicating the FPGA area consumed by the user design.
Entrena et al. [
7] in 2010 extended the work presented by Lopez-Ongil in 2007. In this version, SET faults are supported due to the modeling of delays inside of the cells at gate-level netlist. A second design module is generated with only the FF instrumented. The idea is to inject SET faults using in delay-enabled module implemented using shift registers resources available in the used FPGA. Whenever a sequential element captures the fault, then the design state—that is, flip-flop logic values at a given moment—is copied to the module version with the instrumented flip-flops only. This second module can run faster since it has not implemented the delay. Both modules run on the FPGA, and the “emulation manager” selects the module to execute. To enable SET fault injection acceleration, the proposed solution requires a massive instrumentation. Additionally, the fault injection campaign is executed over two generated models, which are derived from the original design description.
2.2. FPGA-Based Acceleration via Reconfiguration
Kenterlis et al. [
17] in 2006 presents a platform, which automates the fault injection of SEU faults by using the JBits API to tweak the bitstream image used to configure the FPGA. With the API and full control of the bitstream generation, only bits actually disturbing configurable logic blocks could be selected to inject the faults, thus reducing the fault space. Even if the faults were injected on the occupied FPGA resources, the proposed methodology still was more verifying the device itself than the fault tolerant design configured in the FPGA. Hence, the approach was overdoing the vendor’s work, which already provided reliability experiments information at that time [
18]. Additionally, significant interaction with the host is required, and a faster communication link had to be used in order to reduce the bottleneck. Up to two orders of magnitude have been observed between simulation and the proposed solution. Kuuhn et al. [
19] in 2013 presented a similar approach, but instead of using the JBits API, a tool was developed to make the link. The developed tool provides the correlation between the fault selected at circuit description—for example, VHDL, Verilog—level, and the generated bitstream for the injection of the fault. However, the research focus was fault tolerance hence no fault injection performance figures were discussed.
Aguirre et al. [
20,
21] presented a non-intrusive FPGA solution, where the faults are injected by the manipulating the configuration memory of the device. Instead of corrupting the bitstream, FT-UNSHADES leverages the dynamic partial reconfiguration available in some FPGAs to inject the faults.
Mogollon et al. [
9] in 2011 presented the second version of the FT-UNSHADES solution. The new release promises to have eliminated the communication bottleneck by processing all data management in the developed platform. Experiments showing performance ration about 100k faults per second are claimed. However, the presented results achieve up to 1980 fault injection runs per second.
2.3. Simulation-Based Acceleration via Instrumentation
Rohani and Kerkhoff [
22] in 2011 presented the experimental results achieved with the proposed simulation-based approach. First, the design is modified in order to add the saboteurs. These saboteurs allow to inject two SET and the SEU transient faults, and it also permits to instrument a delay fault model. Each saboteur has an enable signal which is controlled through the simulator tool commands. A pre-analysis is performed utilizing a mathematical tool to configure the fault campaign by defining the fault target, injection time, and injection duration. The detection is checked as a post-process step by comparing the logged data generate during the fault-free run after each fault simulation. The authors claim between 27% and 67% CPU time reduction against the other two considered.
2.4. Acceleration via Fault Campaign Optimization
Ebrahimi et al. [
23] in 2015 presents a fault injection solution applicable to the fault campaign pre-analysis in order to avoid wasting time by ineffective fault injection. The proposed solution does not consider an injection technique per se. Instead, it highlights the potential benefit achieved with sampling by using the proposed analytical analysis, thus providing a campaign speedup factor up to thirteen. Such contribution can be leveraged by the workload profiling technique mentioned in the functional safety assessment methodology presented in [
24]. In general, the proposed approach applies to any fault injection technique.
2.5. Acceleration via Complexity Abstraction
Bombieri et al. [
25] in 2011 utilize Transaction-Level Modeling vastly used for functional verification at the system level in order to optimize the fault simulation. The proposed approach claims the automatic extraction of the TLM models from the RTL description. Additionally, an ATPG implemented with TLM models is used to generate the stimulus for the DUT automatically. Even stating initially that by using TLM, the performance gain can get up to a factor of thousand when compared to standard RTL simulation, the results show a speedup between 6.3 and 68.8 times faster runs. Moreover, an interesting contribution corresponds to the possibility of reusing the test vectors generated by TLM-ATPG back into the RTL simulation.
2.6. Acceleration via Hardware-Assisted Verification Platforms
Daveau et al. [
11] in 2009 proposed a fault injection acceleration methodology using the hardware-assisted verification platforms. In the following year, Bailan et al. [
12] seemed to have moved forward with the research, and published more experimental results. Similar to other approaches, the acceleration is based on the instrumentation of the flip-flops to enable the controllability required by SEU fault injection. About 20% of area overhead in addition to the fault injection controller that also runs on the platform. Given the massive parallelism implemented, a significant fault injection runtime reduction is achieved. The selected fault target is a Leon2 IP core, which can be replicated 19 times into the same hardware-assisted platform domain. Using the 16 domains, 304 faults could be injected at the same time. To achieve such parallelism, one controller per domain is required in addition to the master controller running in the host.
3. Methodology
This research leverage the same emulation technology used in [
12] to propose a non-intrusive fault injection accelerate technique, since it can run the simulation and the emulation sharing the same snapshot, that is, the HDL design compilation image. The hardware-assisted platform aims to speed-up many complex verification tasks; simulation acceleration is one example. As expected, the emulation platform supports standard simulation features like
force,
deposit and
release command, in addition to signal probing for waveform viewing, among many other features. The proposed solution injects faults by using standard features, thus being portable to any technology which supports similar capability. M-AC/DC initially only implements permanent faults because the SAT (stuck-at) fault model is not fully considered other researches also based on hardware-assisted platforms [
11,
12]. However, there is no foreseen reason for the M-AC/DC not to support Single-Event Upset (SEU).
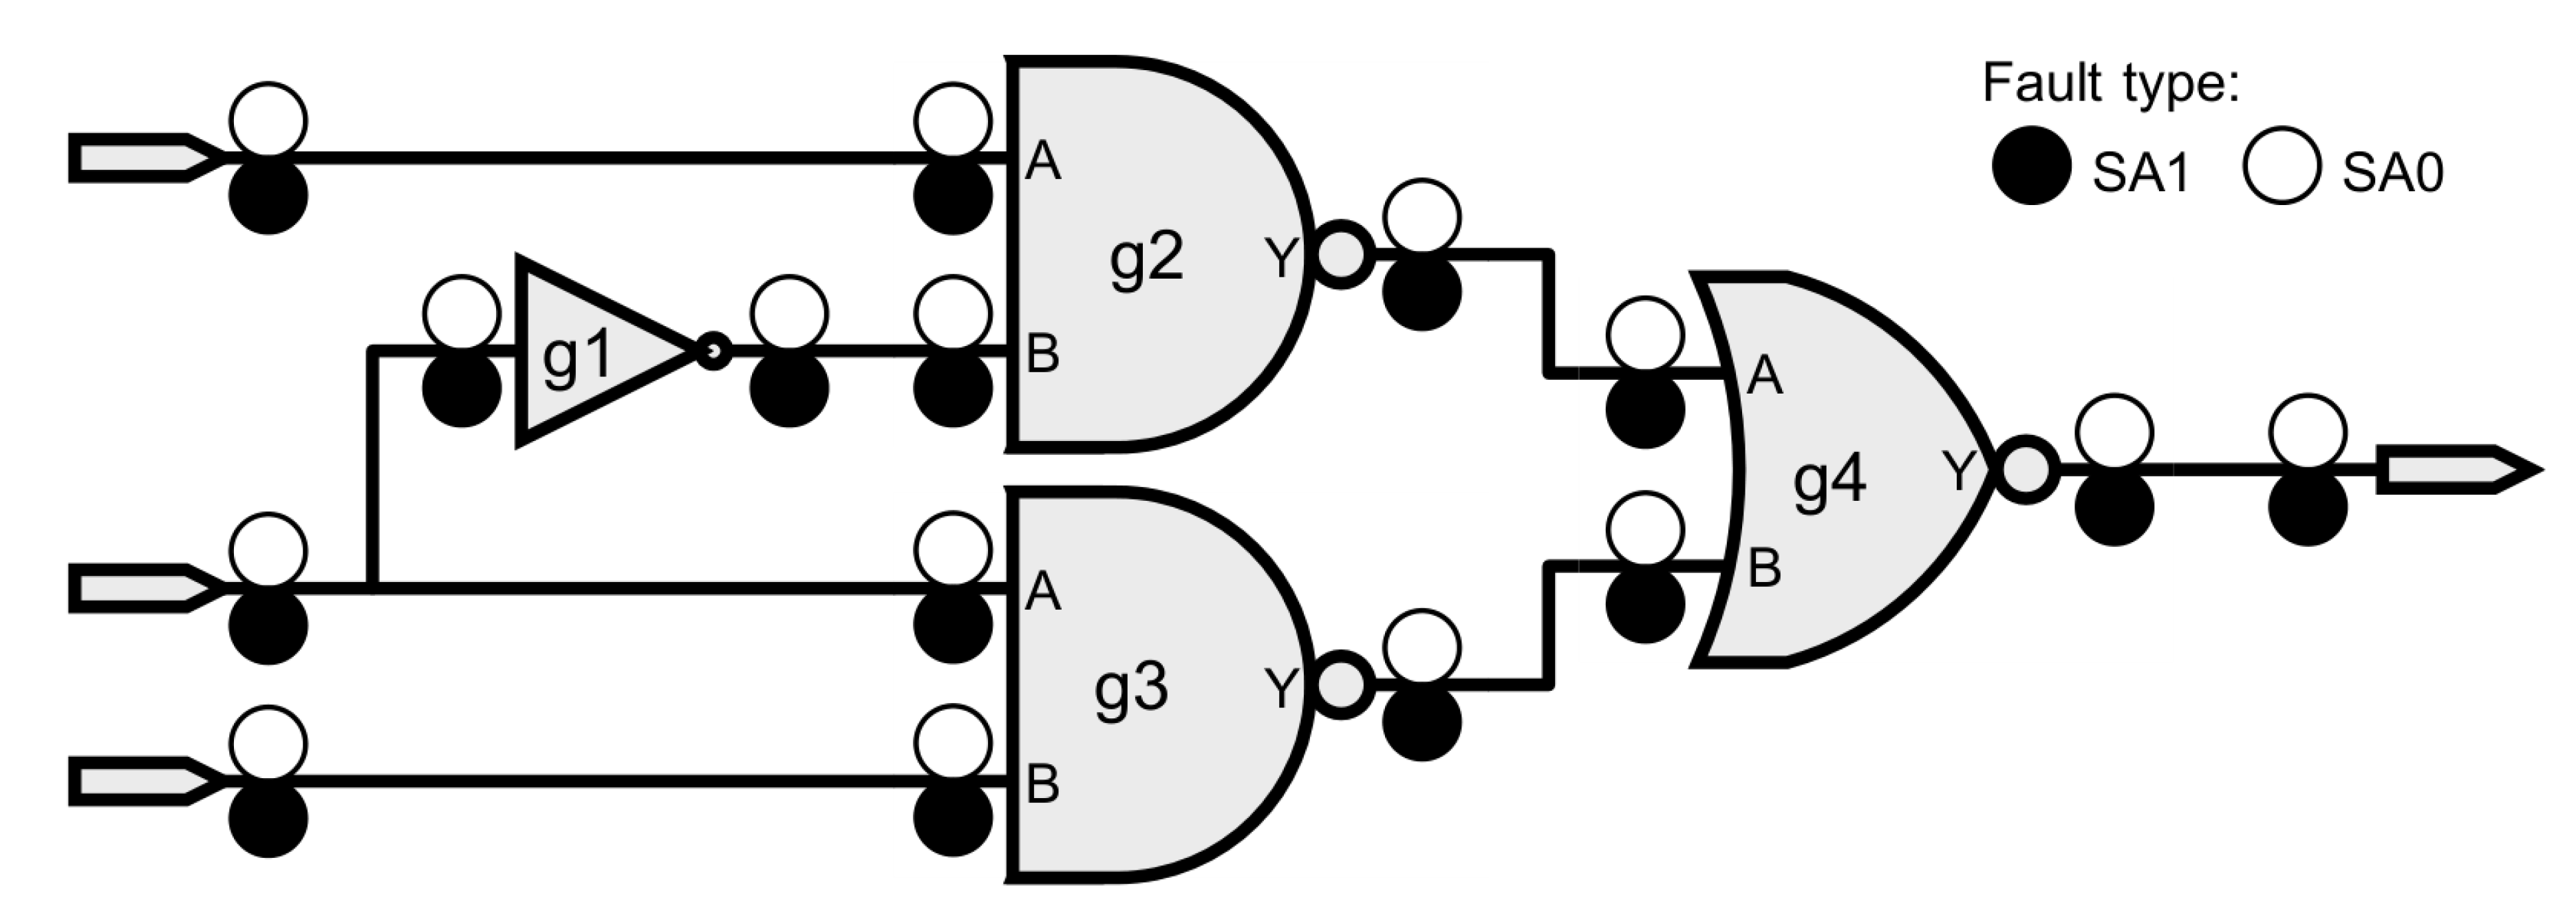
For instance,
Figure 1 illustrates a multiplexer (MUX) in order to highlight the locations where the SAT faults shall be considered according to the industry compatible fault model, SA0 stands for “stuck-at-0” and SA1 for “stuck-at-1” [
26].
Force (set a circuit node to a constant value), and deposit (hold the circuit node value until override) have similar characteristics to the SAT, and SEU fault models, respectively. An SA0 can be imitated by a force command configured to hold a signal to the logic low value.
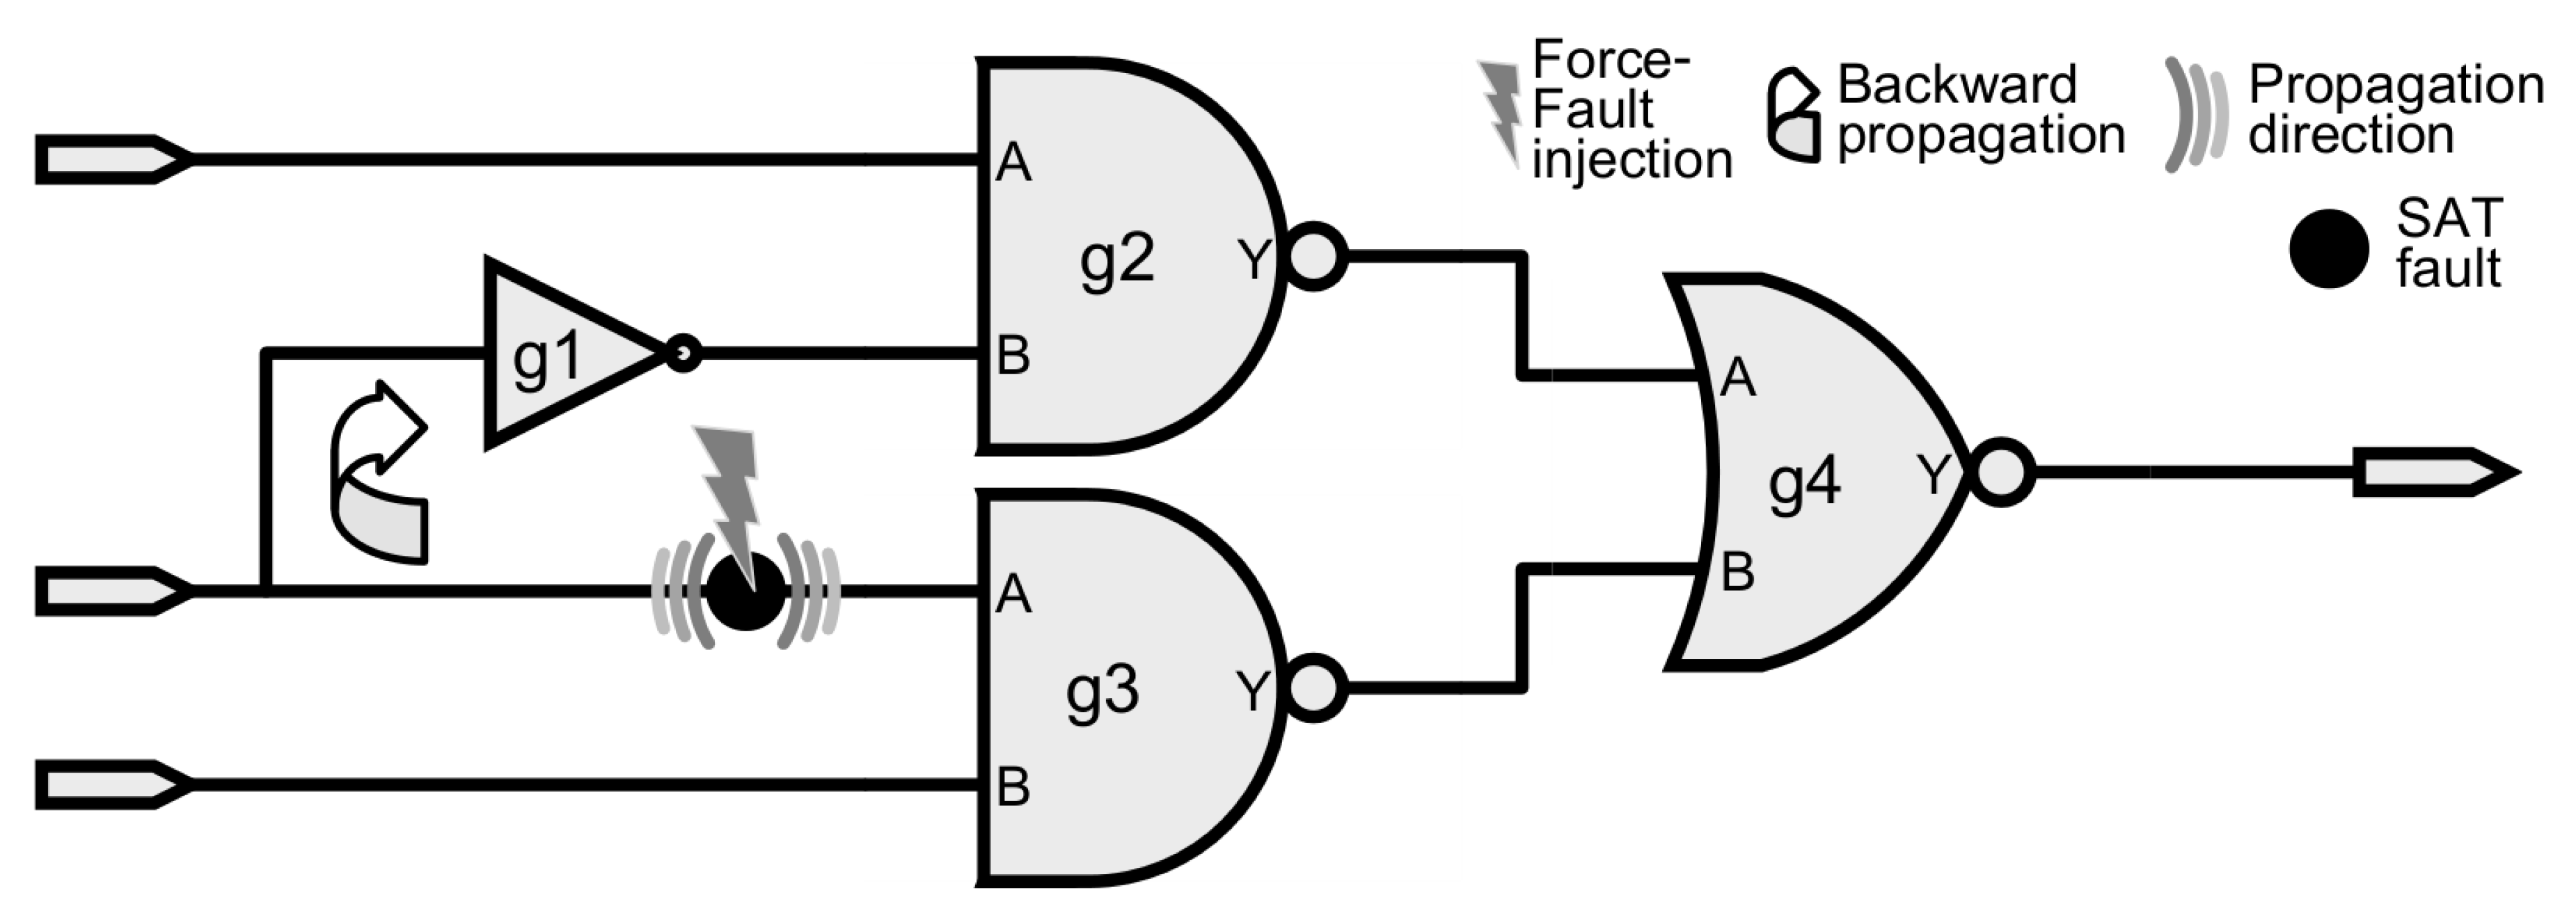
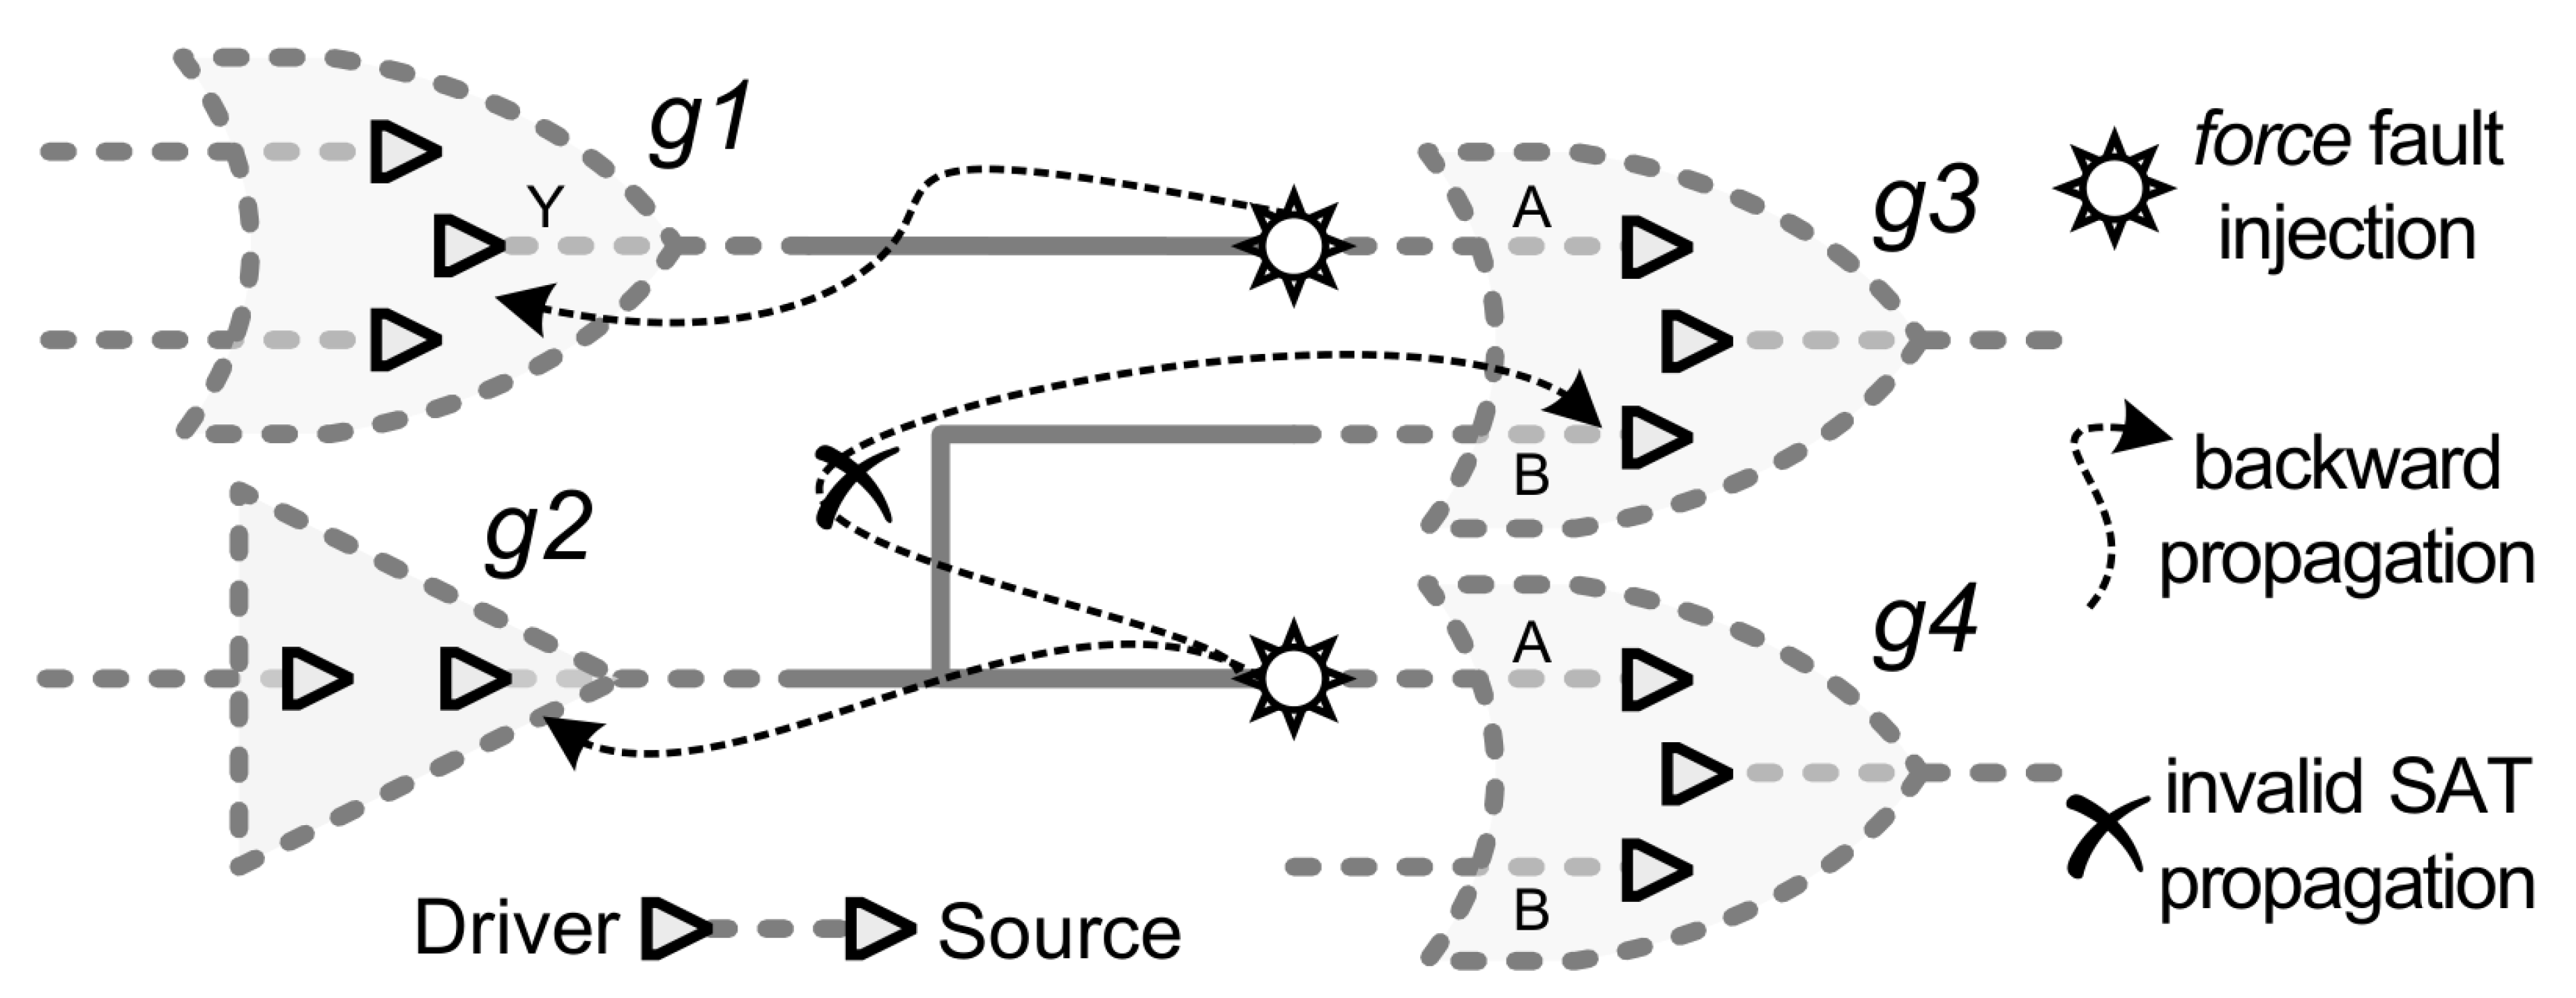
The effect of an SAT fault shall not propagate backward. However, the
force command applies to the whole line, thus generating an inappropriate behavior towards the SAT fault model.
Figure 2 highlights the backward propagation problem when using the force command to inject an SAT fault in the “g3.A” pin, which would reflect at “g1.A” input (as indicated by the arrow) hence not reproducing the expected SAT fault model behavior [
26]. On the other hand, there are many faults in the design, in which the backpropagation has no impact on any other part of the design—for example, cell outputs.
Fault simulators that claim support of SAT fault model must handle backward propagation of the fault effect. It is important to notice that this feature is not part of standard functional verification tools. To cope with that, M-AC/DC implements a structural circuit analysis to discover those faults that do not require isolation, hence can be accelerated, hereinfater called “accelerated faults”. Algorithm 1 describes the structural analysis, in which:
c.faults(out,SAT)—prints the SAT (SA0 and SA1) faults on the output of cell c;
c.faults(in,SA0)—prints the SA0 faults on inputs of c;
p.faults(SA1) prints the SA1 fault of the corresponding cell port p;
p.connections()—returns the total of ports interconnected by the wire that is also connected to port p. If port p is only wired to its driver—that is, “p.connections()==2”—then the fault on p is equivalent to the fault at the driver.
The number of faults that can be accelerated considering the design model at gate-level is given by
in Equation (
1a).
consists of three addends:
and the summations of the functions
in Equation (1d) and
in Equation (1e), which are associated with the steps in the Algorithm 1.
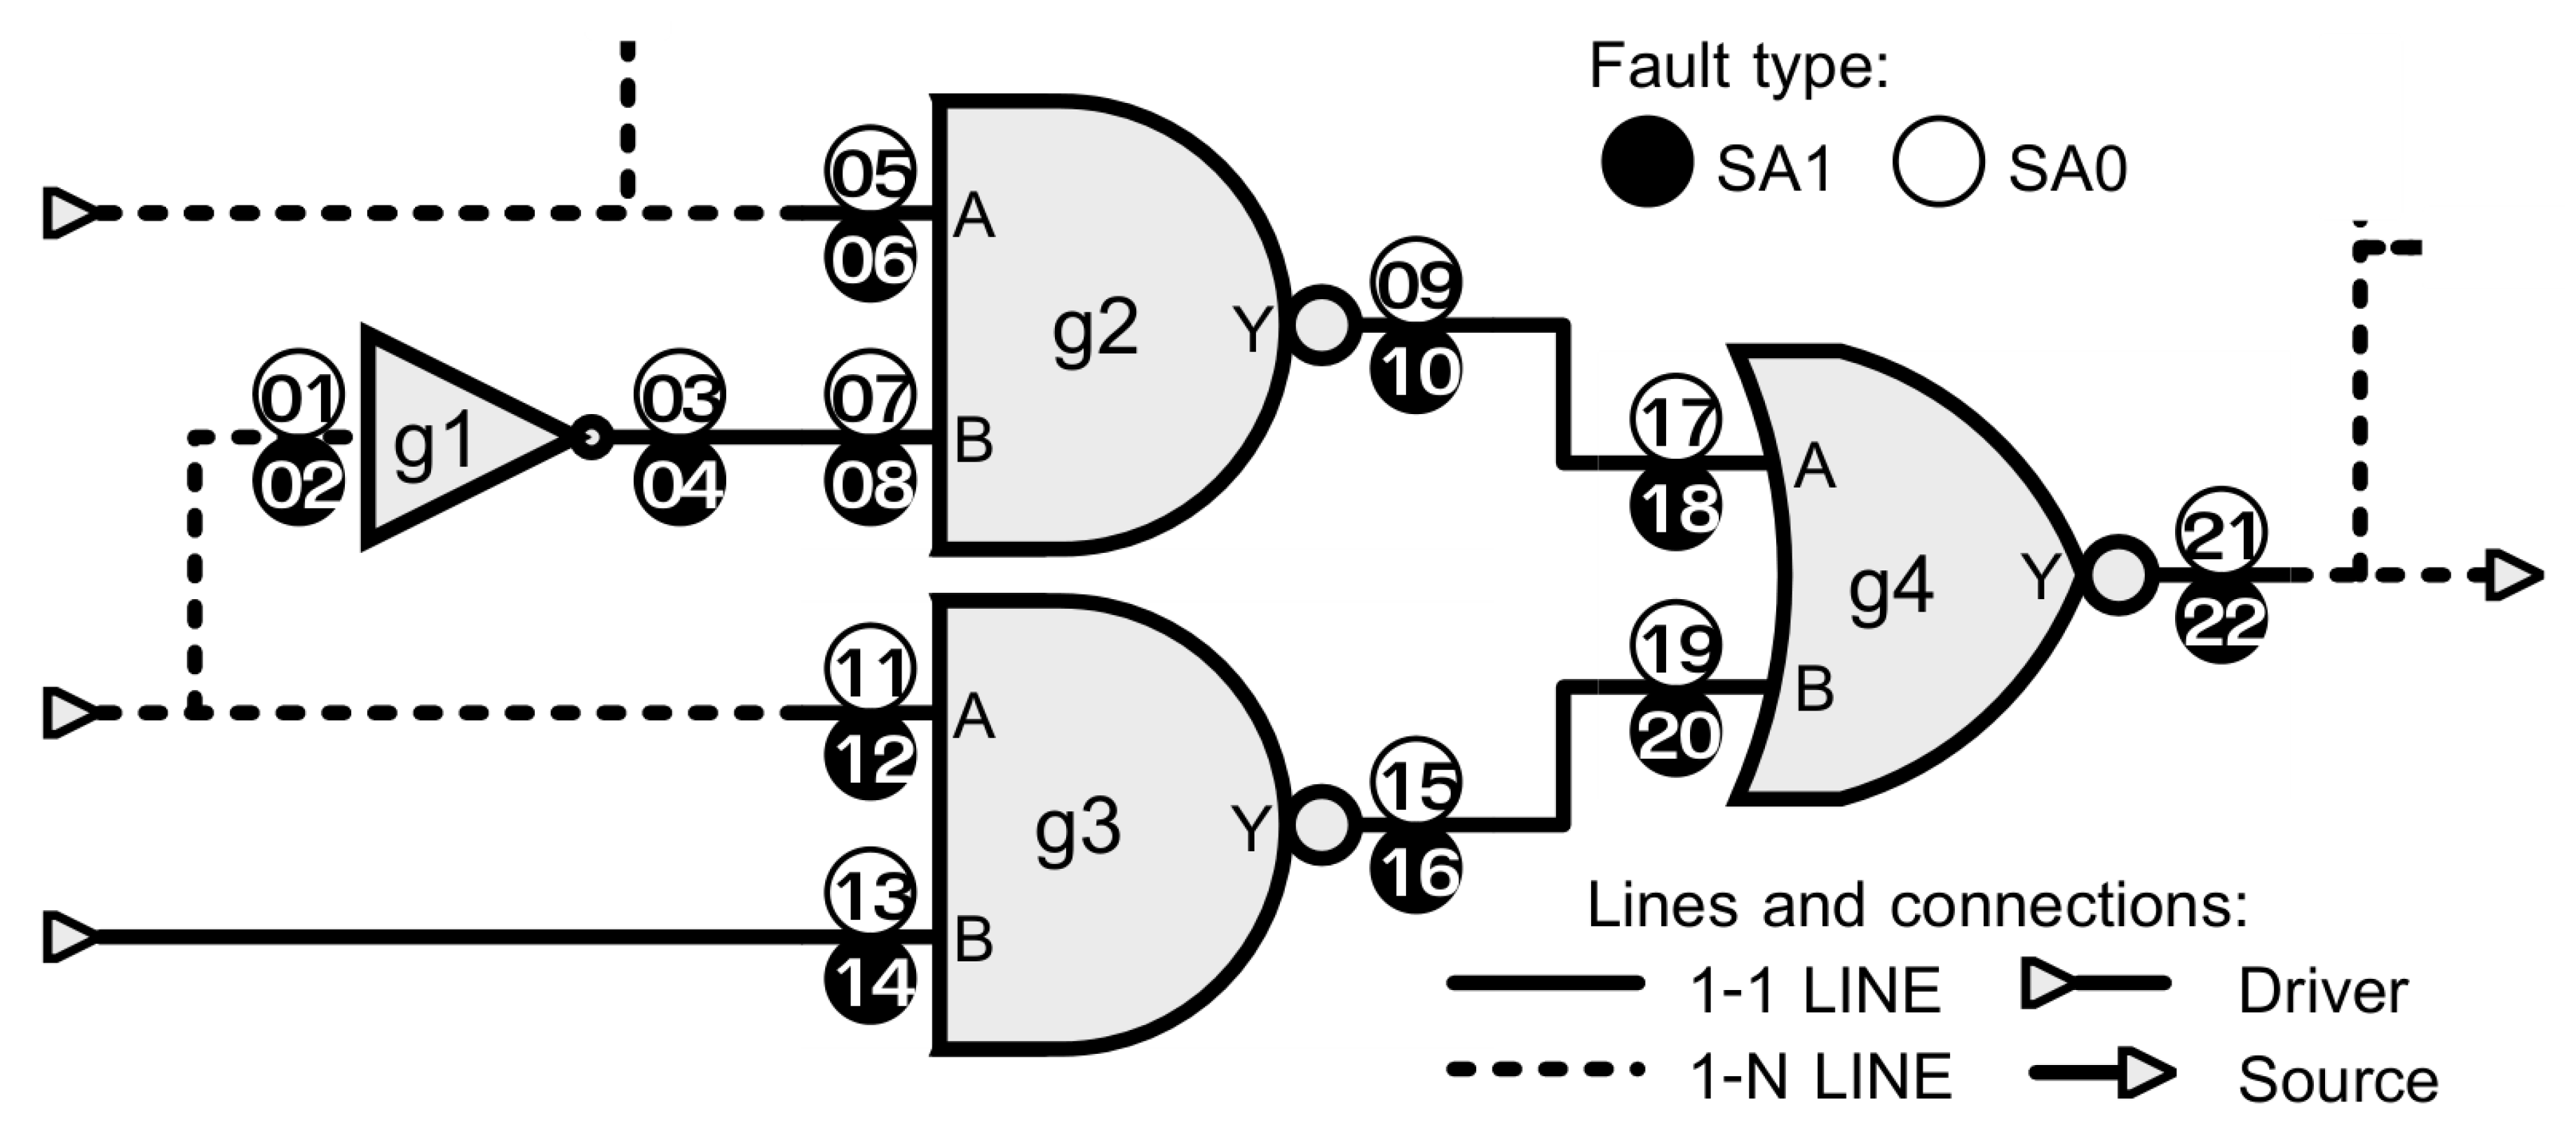
Consider the circuit shown in
Figure 3. This MUX is used to explain which faults can be selected for injection utilizing the force command, and how the number of faults suitable for acceleration can be optimized leveraging the collapsing and the testability information.
| Algorithm 1: Prints faults selected to be accelerated. |
 |
Naturally, faults located on cell outputs do not have the backward propagation issue since the effect of the force command cannot overpass the line driver. The remaining faults may be collapsible with the output faults, thus allowing to maximize the ratio of faults verified by acceleration and those that can only be simulated. However, it is important to select the appropriate set of prime faults—equivalent group representatives—in order to guarantee the correctness of the fault injection executed in the emulator.
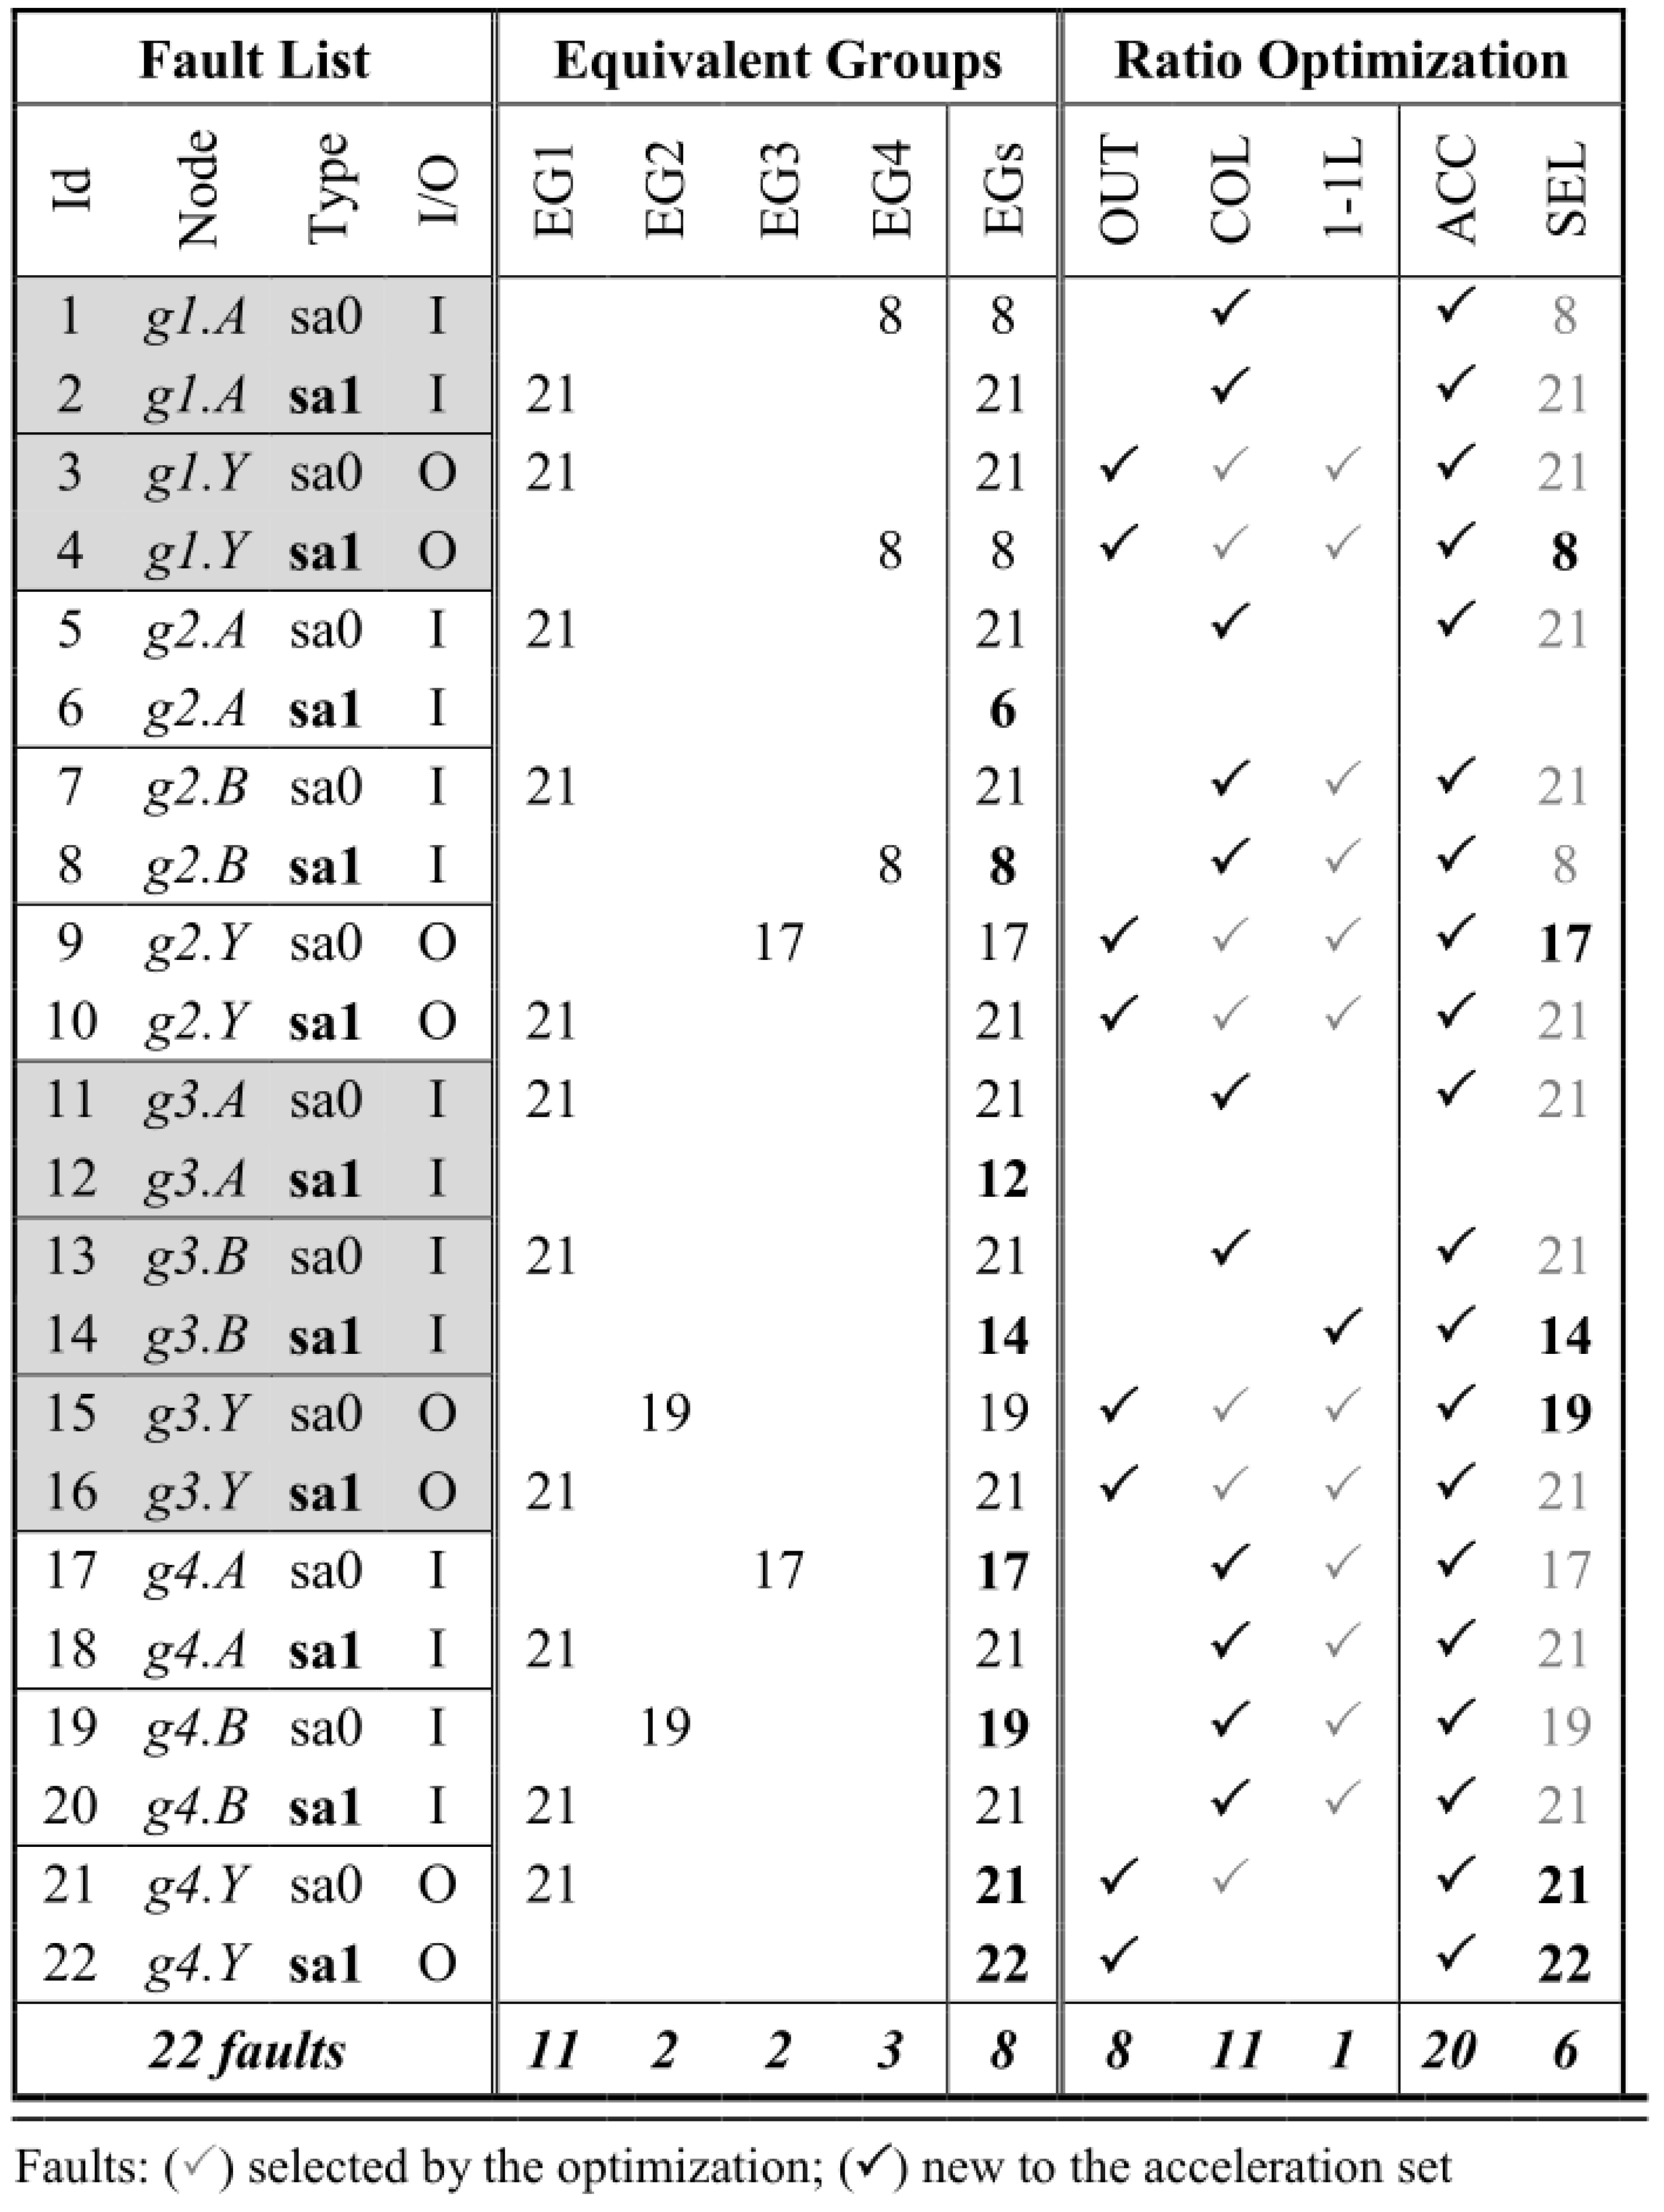
Figure 4 contains the equivalent groups (EGs) for the example of
Figure 3, and the IDs of the prime faults are highlighted in bold—that is, faults 6, 8, 12, 14, 19, 21, and 22.
The “acceleratable” (ACC) set of faults starts with those eight located on cell outputs (OUT). The ratio of ACC faults is then optimized by using logical collapsing (COL). Faults on input cells may not appear in any equivalent group but still fit for verified through acceleration. Such a case can occur when the fault resides in an input cell that is connected to a 1-1 LINE (1-1L), and there is no fault instrumented in the driver side; otherwise, the two faults would have been collapsed. Fault 14 fits this situation; hence it is the only fault on the 1-1L column that is added to the ACC list in
Figure 4. A similar case happens with faults on unconnected pins of registers or other cells, which also are not collapsible but still can be accelerated.
From the 22 SAT faults in the MUX example, 20 can be accelerated (ACC), as shown in
Figure 4. However, the faults that can be injected must be located on a cell output, 1-1 line, or a not driven pin. Therefore, the representative faults of the equivalent groups within the set of ACC faults need to be appropriately selected in order to avoid the backward propagation issue. The faults that are selected (SEL) to be injected via the hardware-assisted platform are marked in bold—that is, 8, 14, 17, 19, 21 and 22. For that reason, the fault representatives of the EGs that are selected for acceleration can be different from the original prime faults.
Table 1 shows the results of applying Algorithm 1 for the example in
Figure 3. Up to 90.91% of all faults can be accelerated by just selecting the appropriate set of prime faults—the fault representative of equivalent collapsed fault groups—to be used for the injection campaign.
The “Accelerated” row shows the accumulated result of each term in Equation (
1a) in
Table 1. After each term is calculated, the number of accelerated faults increases hence reducing the number of faults that can only be simulated. For the multiplexer, the example shown in
Figure 3, up to 90.91% of all faults can be accelerated by just selecting the appropriate set of prime faults to be used for the injection campaign. In other words, less than 10% of the faults would involve design model adaption to provide the isolation required by the SAT model. To keep M-AC/DC as a zero intrusion solution, then a fault simulator is used for these two faults. The Cadence® Incisive® Functional Safety Simulator (IFSS) is the fault simulator tool employed in this research, but it could be any other fault simulator. Meanwhile, the hardware-assisted platform can accelerate 90.91% of the faults; hence it is possible to execute the fault injection using both engines in parallel, thus reducing the overall execution time of the fault campaign.
To summarize the importance of the M-AC/DC fault selection, then the backward propagation related to the SAT fault injection via force command must be clear.
Figure 5 shows a hypothetical circuit to explain the effect of the force command on the line in order to define when this effect can be used to mimic an SAT fault model. Considering this fault model, then the forward propagation is the expected behavior hence not represented in the circuit illustration. Although the backward propagation is not a valid SAT fault behavior, yet there are many circuit locations where it has no actual side effect thus allowing to employ the force feature.
The force command is used to inject one SAT fault in the input of the cell “g3” in
Figure 5. Given the
force semantics [
27], then everything between the drivers and the sources of the line gets affected. Since the fault is injected close to the source (“g3” input pin) of the line, then the force behavior in the line can be seen as the backward propagation of the fault effect. For the fault injected in the “g3.A”, the force effect goes backward until it gets to the driver (“g1.Y” output) thus not disturbing any other part of the circuit. Therefore, this fault is a suitable candidate for acceleration. Notice that backward propagation concern does not apply to fault located at the drivers.
4. Experiments
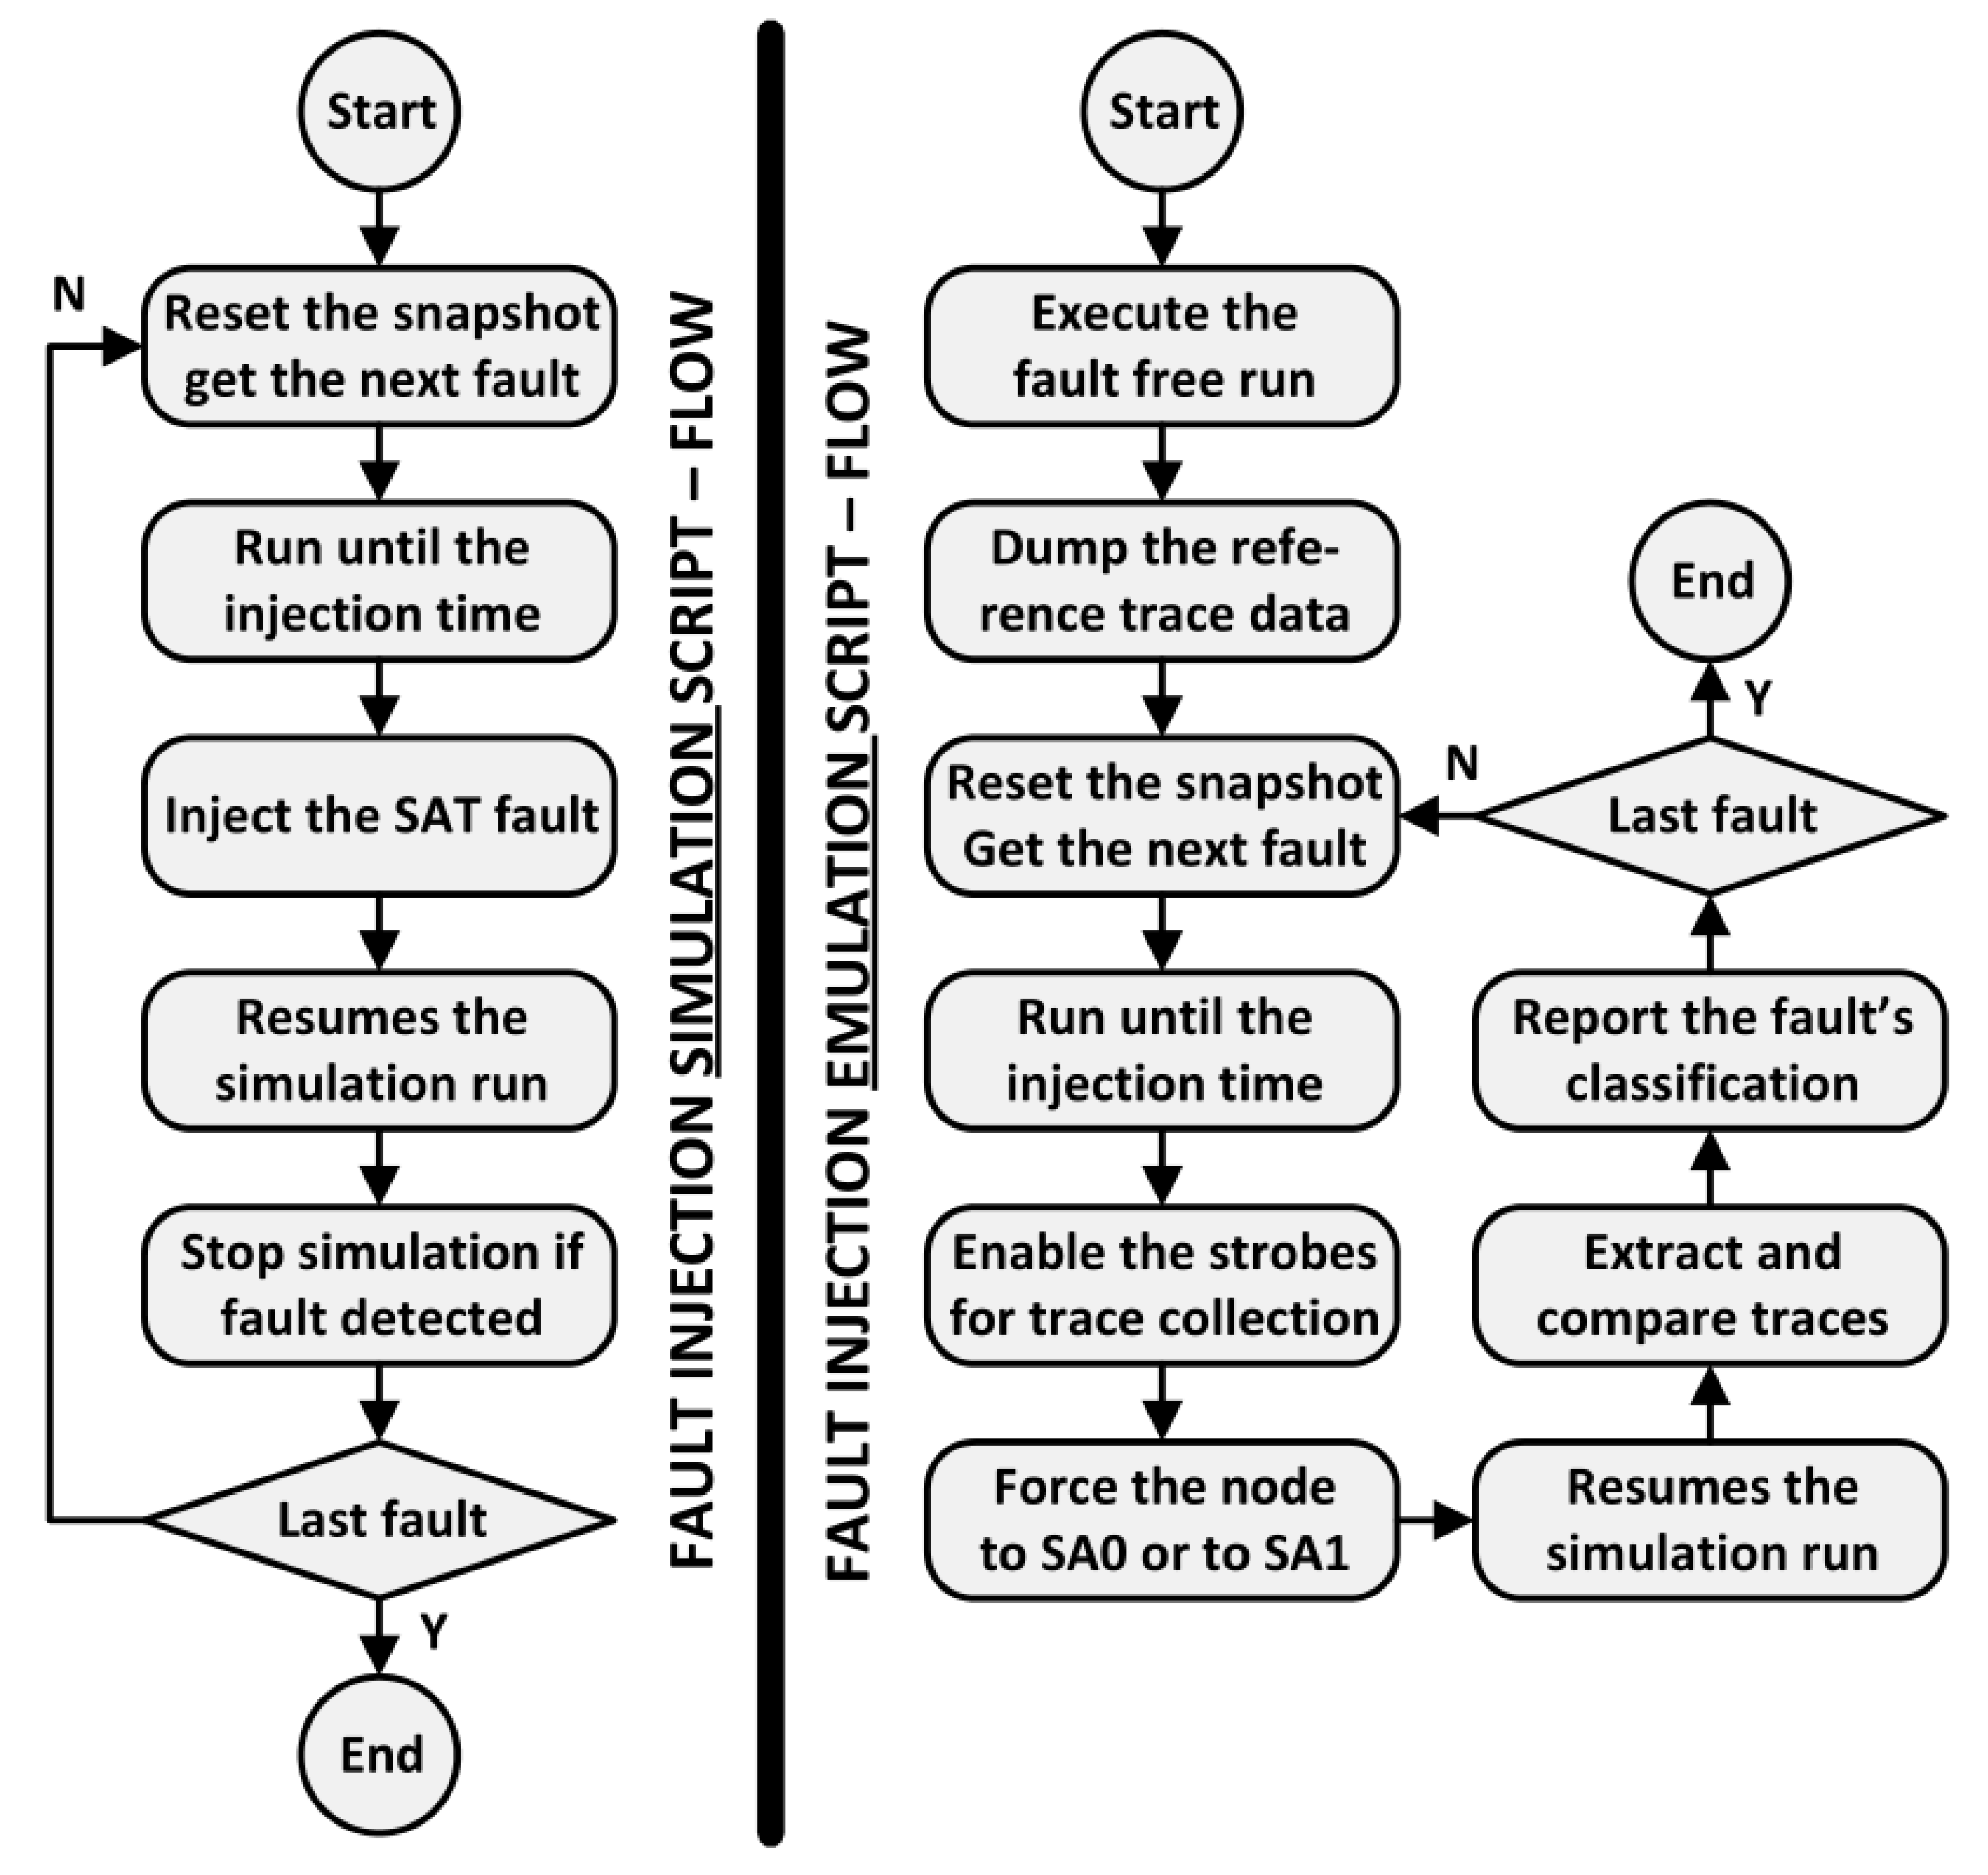
In the IFSS flow, the faults to be injected must be defined at elaboration while the strobes are passed to the tool during the good run. The strobe definition includes the instance path of each node selected as an observation point, and the strobe type—that is, function or checker.
During good simulation (i.e., fault-free run), IFSS saves the traced data of the signals selected as detection points (strobes). This trace information is constantly compared during fault injection runs, and a detection notification is issued if any discrepancy occurs. A similar approach was implemented using the emulator capability to store waveform data of selected signals. After each accelerated fault injection, the waveform data is compared with the one generated by the fault-free run using a simulator utility that informs the timestamp and the signals of each existing mismatch. This post-run check procedure implemented does not stop the simulation as soon as the fault effect is detected at any strobe signal. On the other hand, this feature is fully supported on IFSS thus optimizing the overall fault simulation time. The summary of the fault injection commands executed on each engine is shown in
Figure 6.
4.1. Using M-AC/DC in a Combinatorial Circuit
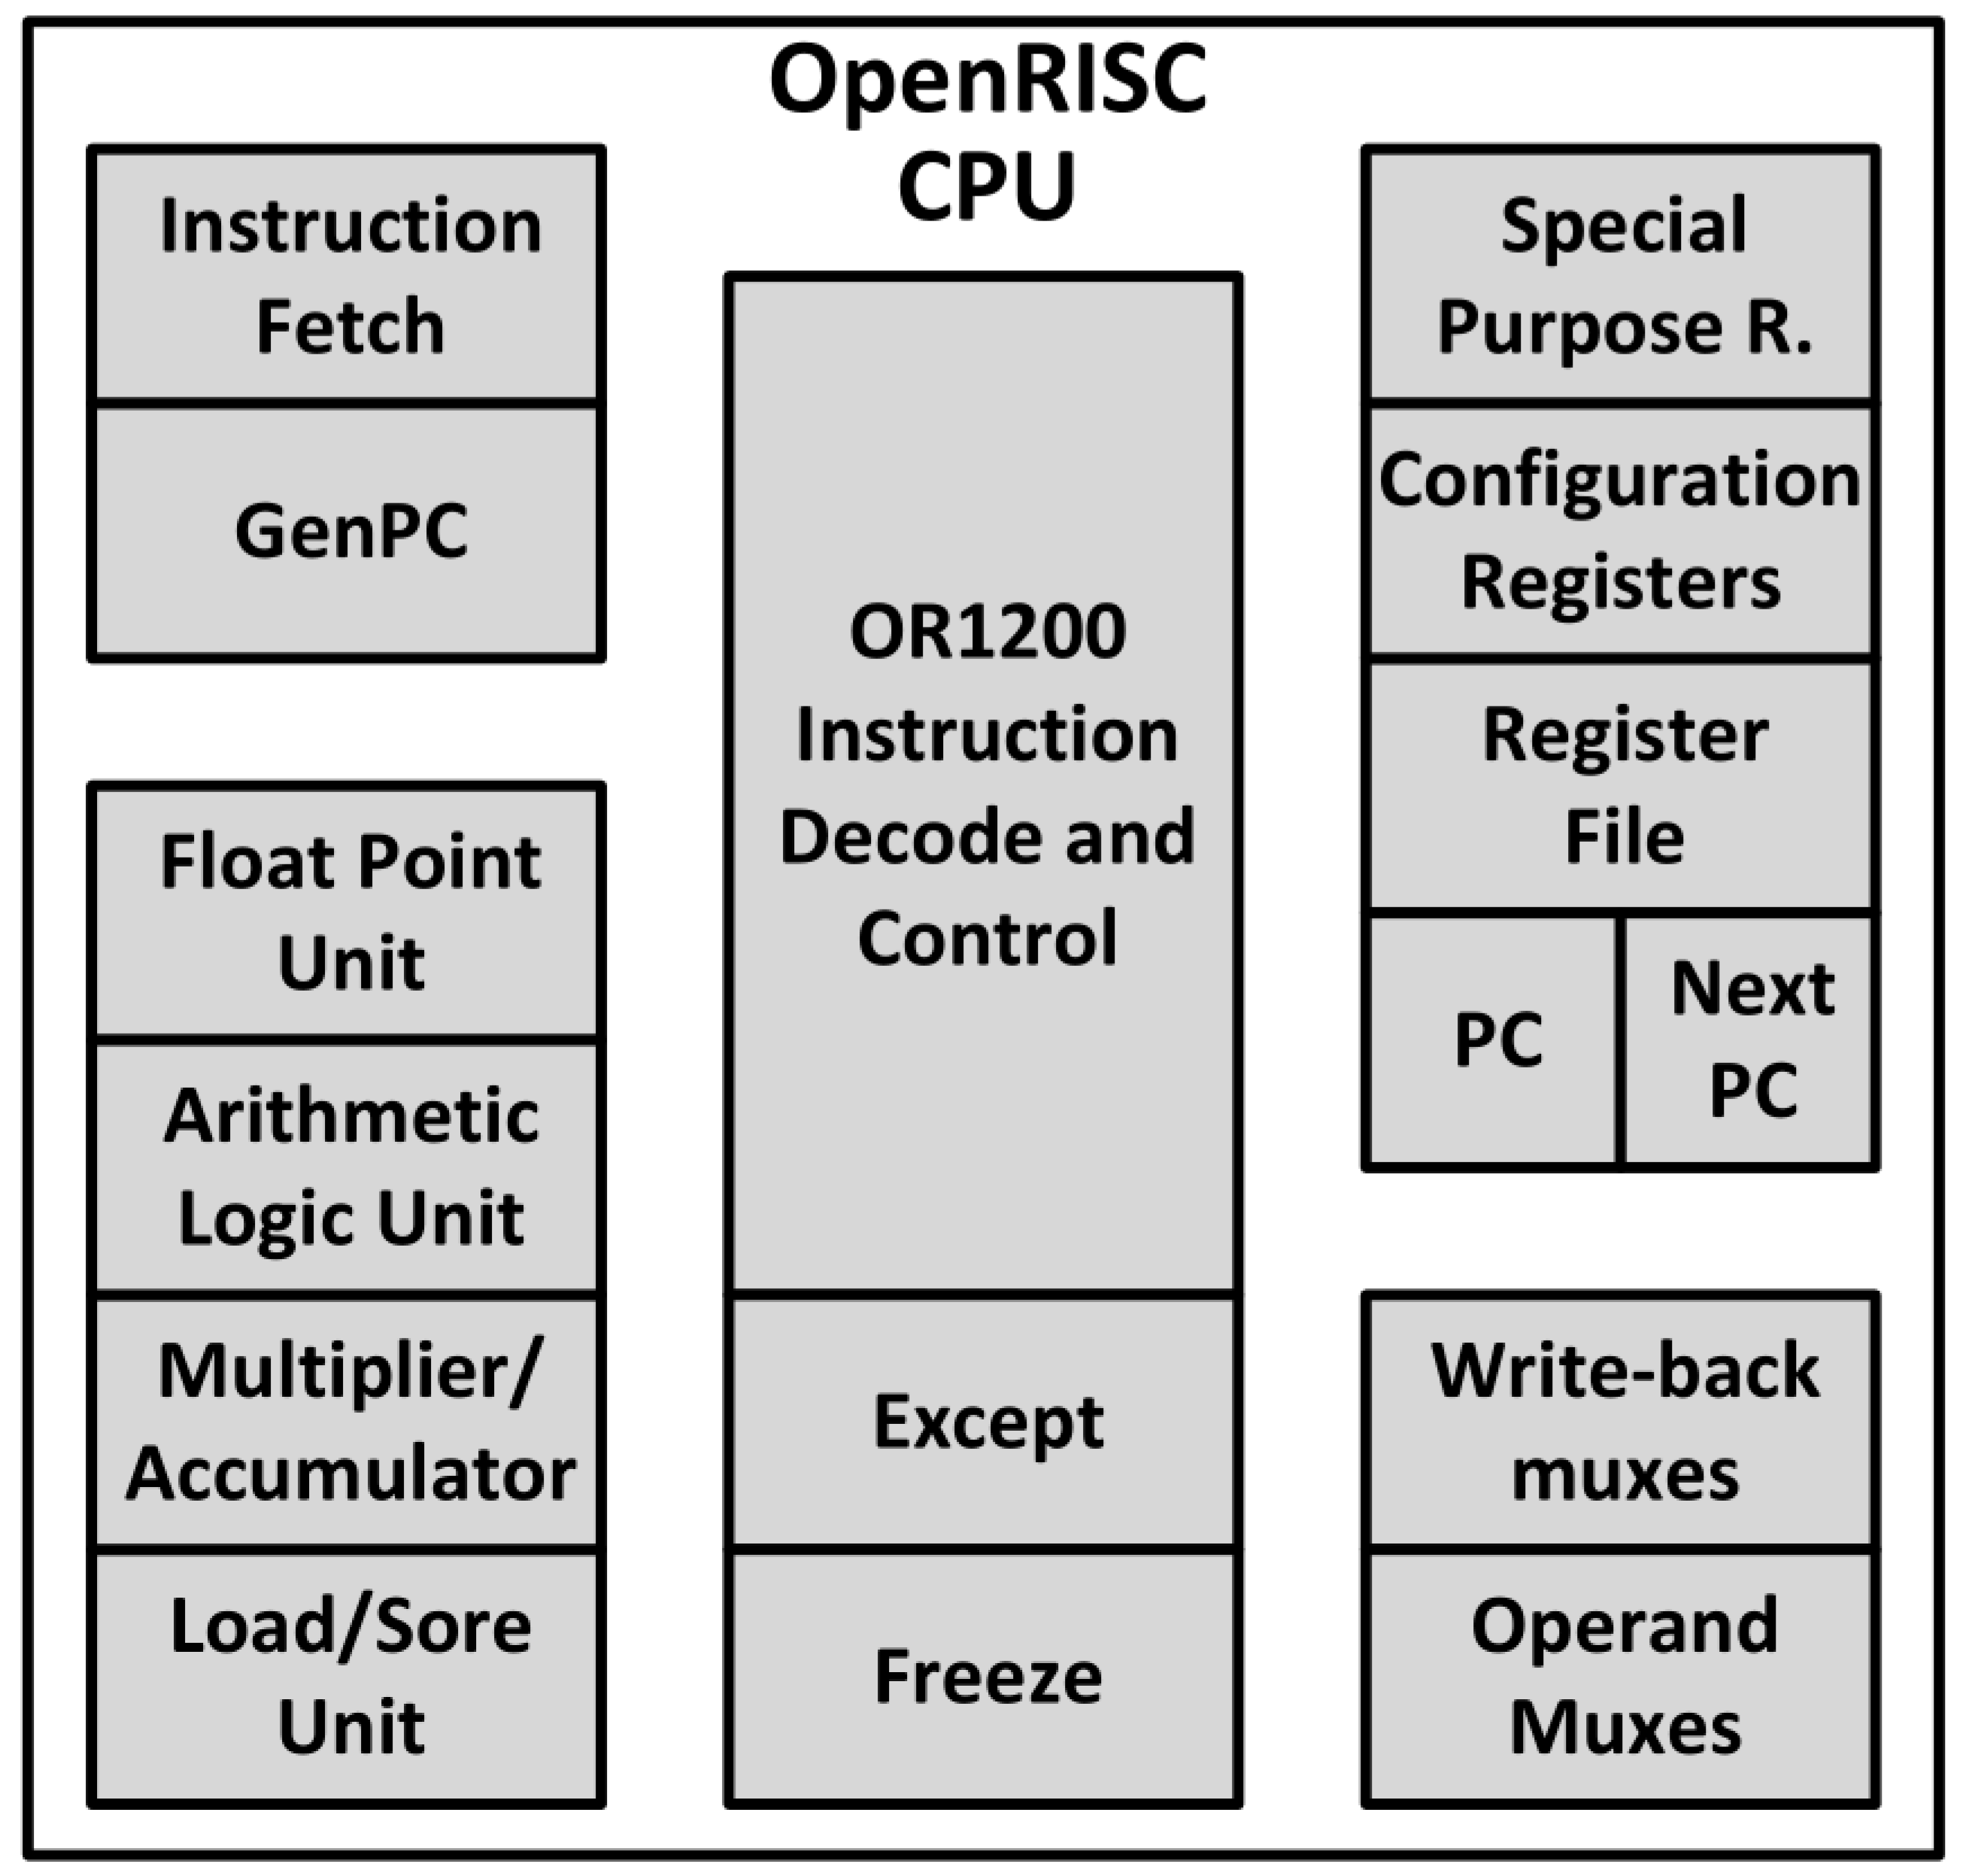
To illustrate the M-AC/DC results, the faults selected for acceleration were also simulated, and equal fault detection status was obtained with both engines. A leaf block of the OpenRISC (
Figure 7) design was used as the fault target due to its small number of faults, thus fitting to the purpose of checking the feasibility. The block selected for this experiment is an unsigned carry adder (CA)—purely combinatorial—automatically added by the synthesis tool.
Table 2 has the outcome of ”M-AC/DC analysis“—most of SAT faults can be accelerated. Only faults that are distinguishable from each other (i.e., prime faults) need to be run, so 288 (45% of all primes) injections were executed, and they had same fault detection status on both engines. The execution time of each engine is shown in
Table 3 subdivided according to the fault detection status.
The fault runs were executed sequentially on both platforms. The overall time results in
Table 3 shows the acceleration was 1.45 times slower than simulation. This negative performance is mainly related to the time overhead for uploading the design to the acceleration platform and for dumping the waveform data at the end of each fault injection.
Additionally, IFSS was configured to stop as soon as a fault is detected, but such optimization for the accelerator could not be imitated yet, and a post-run comparison is used in M-AC/DC. However, for undetected faults where the test must be fully executed, the acceleration has been 3.46 times faster. Given the small portion of detected faults (i.e., only 15.97%), the acceleration factor per fault run is more significant compared with the simulation gain per fault run among the undetected faults. Therefore, it is important to notice that the overall performance gain is associated with the detection profile of the fault set under consideration. Additionally, the strobes were placed on the boundary of the fault target instance. This means that the detection points (strobes) are sequentially close to where the faults were injected.
4.2. Using M-AC/DC in a Sequential Circuit
An SM, external to the ALU or even to the CPU, would result in strobes defined sequentially more distant, thus requiring a longer run until detection hence reducing the simulation performance associated with the group of detected faults. The SM technique must also be taken into account. For instance, the evaluation of a software-based self-test (SBST) SM—that executes diagnostic routines during boot up or periodically for example—would naturally require longer simulations. Therefore, for such cases, M-AC/DC can be extremely beneficial.
In order to illustrate such argument, a block with sequential elements at a higher level of the OpenRISC architecture was selected for the evaluation potential performance gain to be achieved with M-AC/DC. The Tick Timer (TT) peripheral of the OpenRISC architecture was chosen as the fault target of the injection campaign. The TT unit provides a programmable counter at the clock frequency that can be used to interrupt the CPU whenever the counter threshold is reached or periodically by configuring the time interval. Even if the software application running on OpenRISC does not use the timer peripheral, a fault can still propagate out the TT block and cause an unexpected CPU interruption. For this to happen, a fault may propagate through many registers until triggering an interruption or any other disturbance to the CPU. Therefore, the detection profile of the faults injected in the TT unit is expected to be different from the one presented with the unsigned CA (combinatorial circuit).
The TT unit has 4014 SAT fault candidates according to the results from the ATPG tool. The ratio of faults suitable for acceleration is shown in
Table 4. The percentages of faults that can be accelerated before and after collapsing are similar to the numbers found in
Table 2 for the CA test case.
Table 5 compares the results from the CA and the TT test cases regarding the average run time required for each fault injection. For the CA, the average execution time of each fault simulation was 1.45 times better than the acceleration. However, the experiments with the TT instance present acceleration gain over the simulation. As explained earlier, this alteration in the results is expected due to the fault injection profile. The TT block has registers, thus making it more difficult to propagate the fault. This affects the number of undetected faults, which for the TT test case corresponded to 74% of the injected faults. Another factor that impacts the average injection time is the test duration. The test duration for the TT example is four times longer than the one used for the CA, in order to run at least up to the point where the SW running in the OpenRISC can initialize TT block. Given that no SM is used, the outputs of the TT were selected as strobe points, thus not contributing to a longer detection time.
Table 6 shows that the average execution time for the fault injection on TT was 2.54 times faster when compared with the injection of the same faults via simulation. This result corroborates the idea that the campaign profile has a significant impact on the benefits potential of M-AC/DC. Fault campaigns on complex designs with not so many shortly detected faults, running complex test benches (TB), to evaluate software based SMs are likely to benefit from the proposed M-AC/DC approach. The benefit potential becomes evident when analyzing the amount of time spent on each step to inject a fault on the hardware-assisted platform.
Table 6 shows the average time required for loading the snapshot on the emulator, injecting the fault while running the test, and comparing the waveform databases to identify the detection status.
If equivalent fault injection features supported on IFSS—that is, stop at detection, and run time comparison between good and fault runs—would have been implemented here for the hardware-assisted platform, then the time spent with the strobes comparison could be saved. In the TT fault campaign, the waveform database comparison consumed almost half of the injection run time as indicated in
Table 6. By only considering the actual time spent for a fault injection execution on the emulator, and comparing it with simulation, the difference would be almost eight times (+7.83) faster for the TT test case as shown in
Table 6. Therefore, different techniques are being investigated to cope with these bottlenecks in order to increase M-AC/DC performance.
A fault injection campaign over the exception (EX) block (
Figure 7) of the OpenRISC CPU was also executed. The EX block has almost three times more gates than the TT unit. The difference in the number of faults between the EX and TT has similar ratio. The TT unit has 4,014 faults almost a third of the 11,798 faults found in the EH instance.
Table 7 summarizes the number of faults located in the analyzed CPU block. The fault set for the EH test case presented higher collapsed ratio if compared to the other two test cases.
Table 8 compares the runtime average for each fault injection between the TT and the EX test cases. Once again, the size of the of the block has influence on the campaign profiles thus highlighting even more the performance gain achieved with acceleration in comparison to simulation.
Table 9 shows the runtime average comparison between acceleration and simulation in total and the stepwise. The EX test case shows almost 60% performance ratio increase (+4.04) than in the TT campaign.
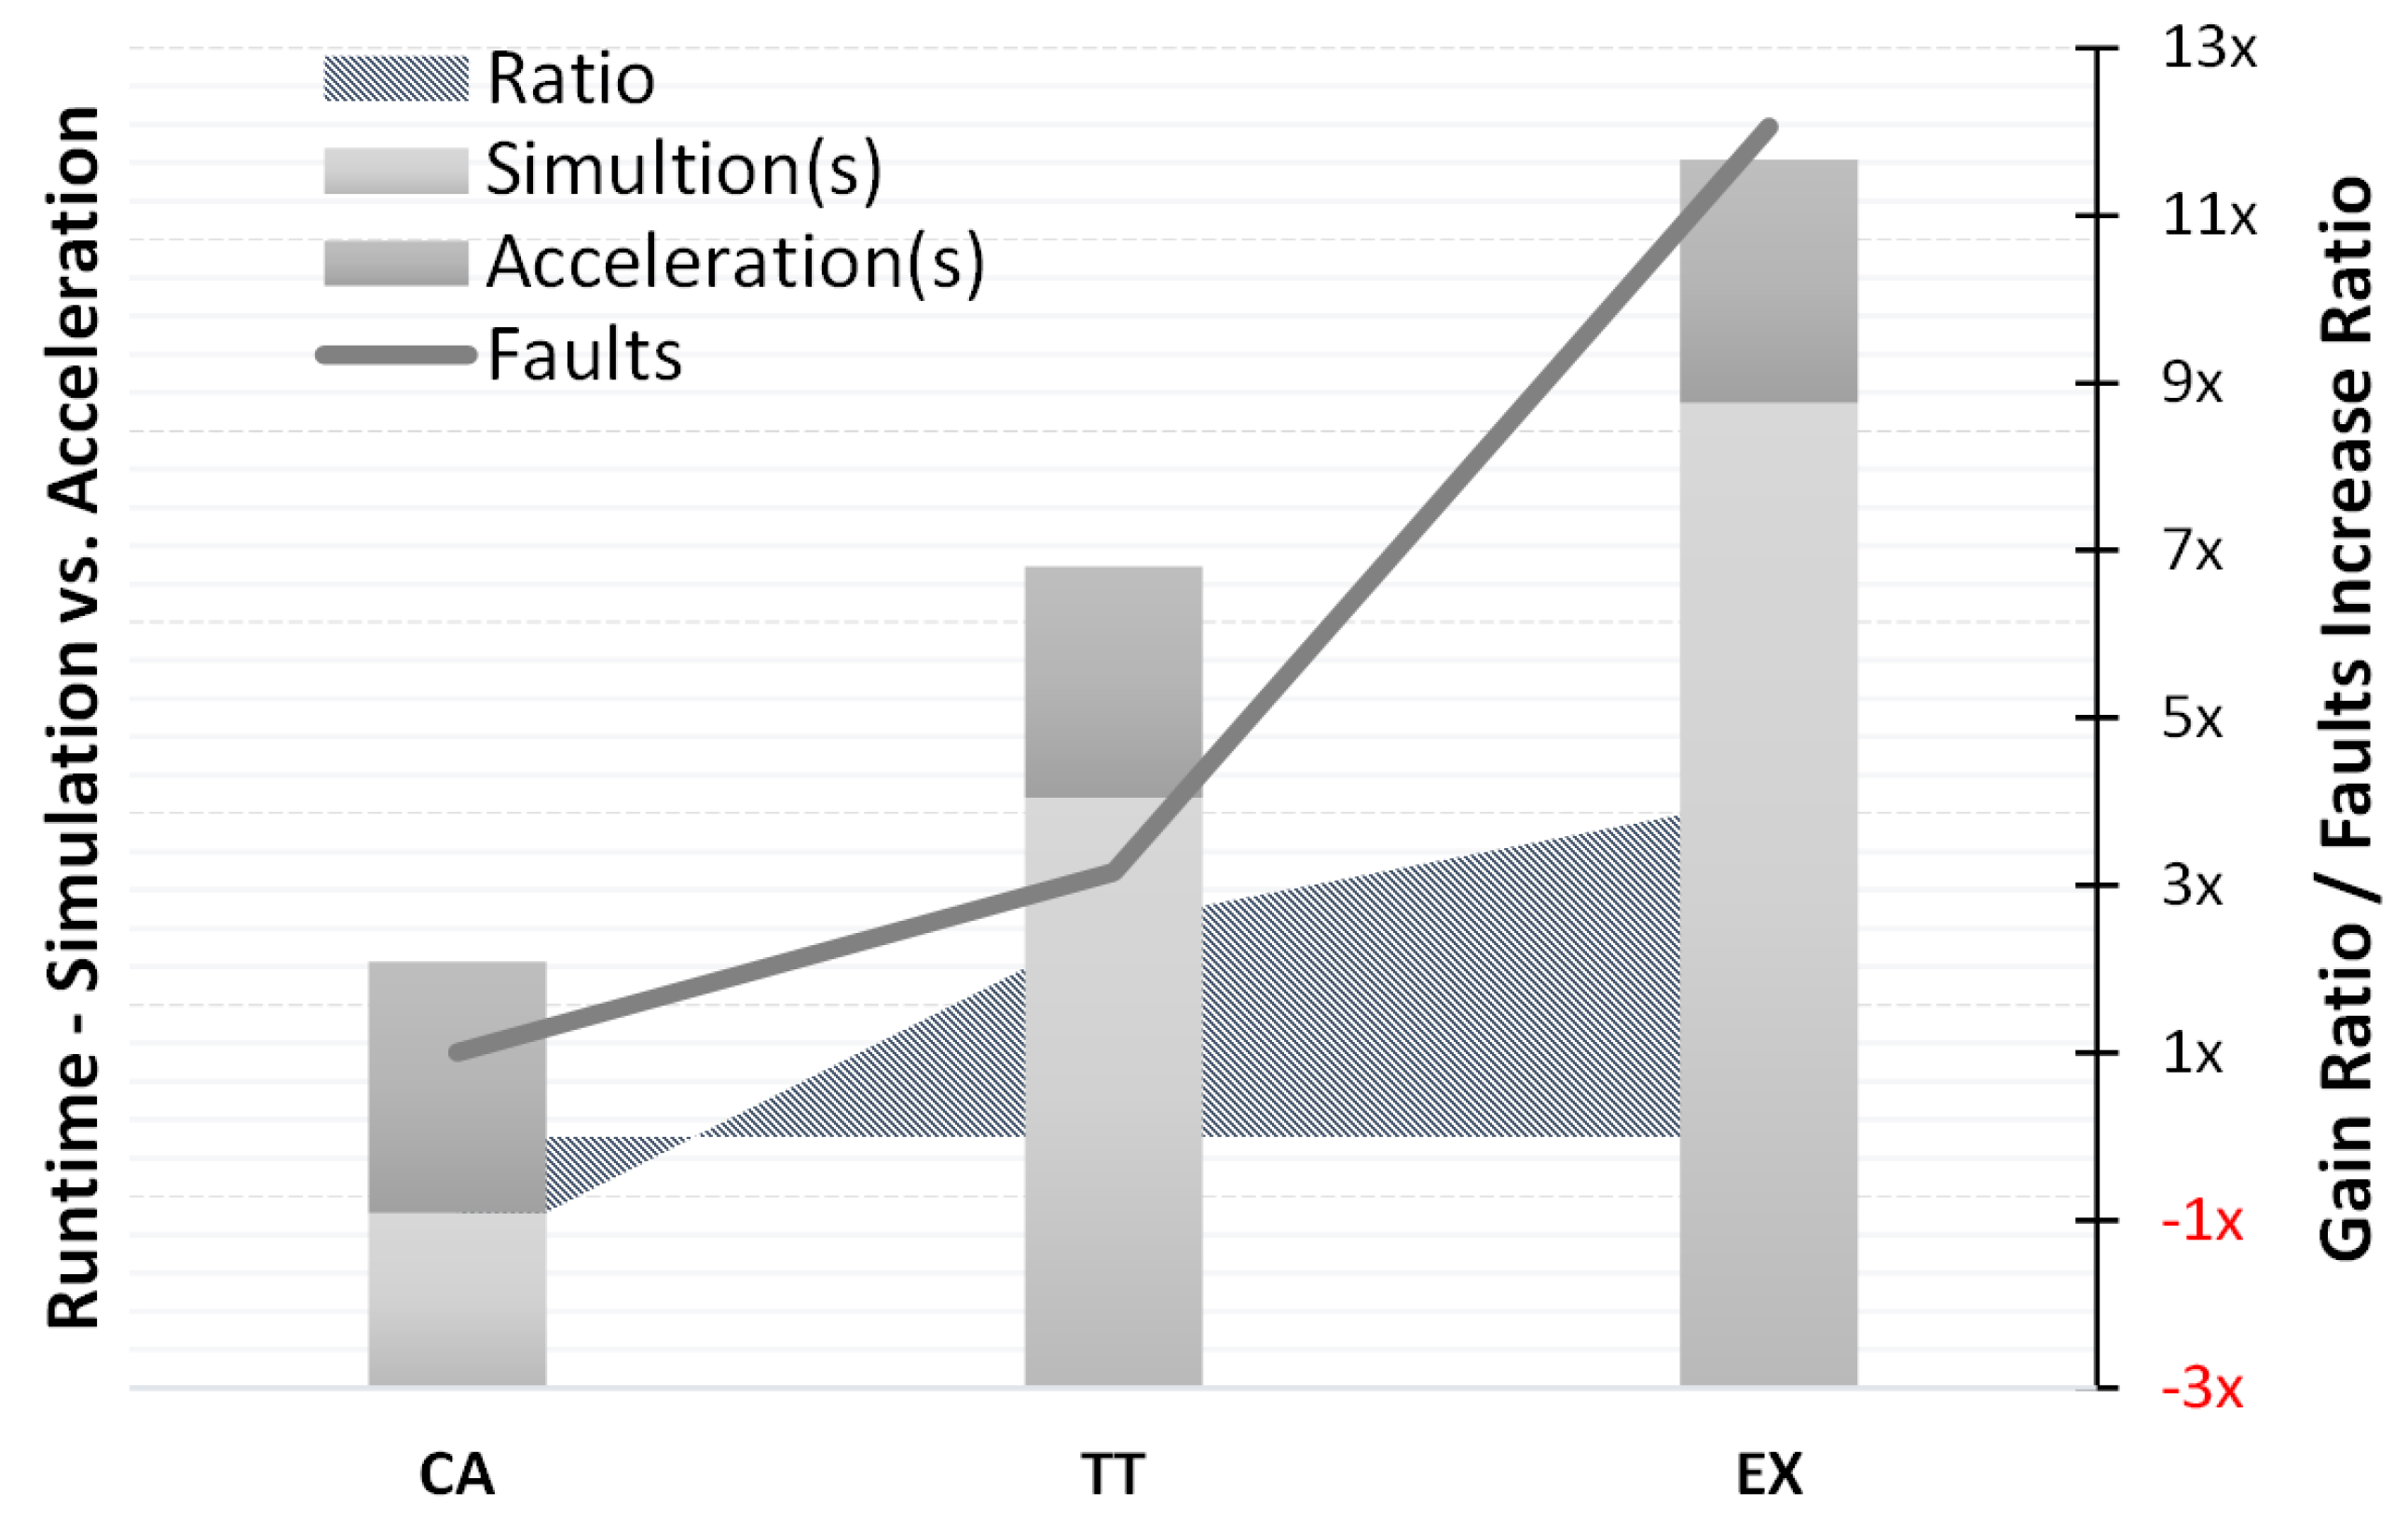
The graph in
Figure 8 compares the acceleration gain, and the total number of fault candidates to highlight the achieved gain increase in each test scenario.
5. Conclusions
In this paper, we presented the M-AC/DC approach that enables the acceleration of SM’s DC evaluation by leveraging the advanced functional verification solutions including fault simulator tools that already target functional safety. The TB environment can be seamlessly reused for the stimulus generation, and therefore limitations from DFT oriented fault simulators (e.g., lack of advanced TB support) do not apply to M-AC/DC. Benefiting from edge technology emulators like those used in [
5], M-AC/DC provides a non-intrusive fault injection solution. Hence, it is more likely to satisfy an ISO 26,262 auditor. Transient fault models required by ISO 26262 can also be supported. M-AC/DC is part of a methodology being developed that extracts data from an FMEDA to assess the initially estimated DC numbers to increase the confidence of the analysis.
This research used parts of the OpenRISC architecture (namely a carry adder, the Tick Timer peripheral, and the exception block) to illustrate the developed M-AC/DC flow and to share the details of the solution. Negative performance results were observed when injecting faults in the small combinatorial block analyzed. However, acceleration gain was observed when analyzing a larger block containing sequential cells. This paper discusses the existence of a threshold defining whether the M-AC/DC can be leveraged. This threshold seems to be influenced by the fault campaign profile. The profile includes the ratio of undetected faults, the test length, the sequential distance of the strobe points to the fault injection locations, the SMs being evaluated, among other aspects. The M-AC/DC results show great potential benefit when considering its application to assess SMs that naturally require long runs regardless of the proportion of undetected faults.
Although the detection mechanism implemented by M-AC/DC imposes a significant bottleneck, yet positive results could be observed. Therefore, the illustrative scenarios show the potential of the methodology. Meanwhile, a solution for the bottleneck is under investigation to maximize the potential of the proposed M-AC/DC solution. As future work, the support to SEU by using deposit command and the fault injection at RTL is planned. Additionally, parallel fault injection using multiple emulator domains and leveraging distributed resource management for simulation must be investigated to improve the M-AC/DC turnaround time further.


