Correlation in MIMO Antennas


Abstract
1. Introduction
- (a)
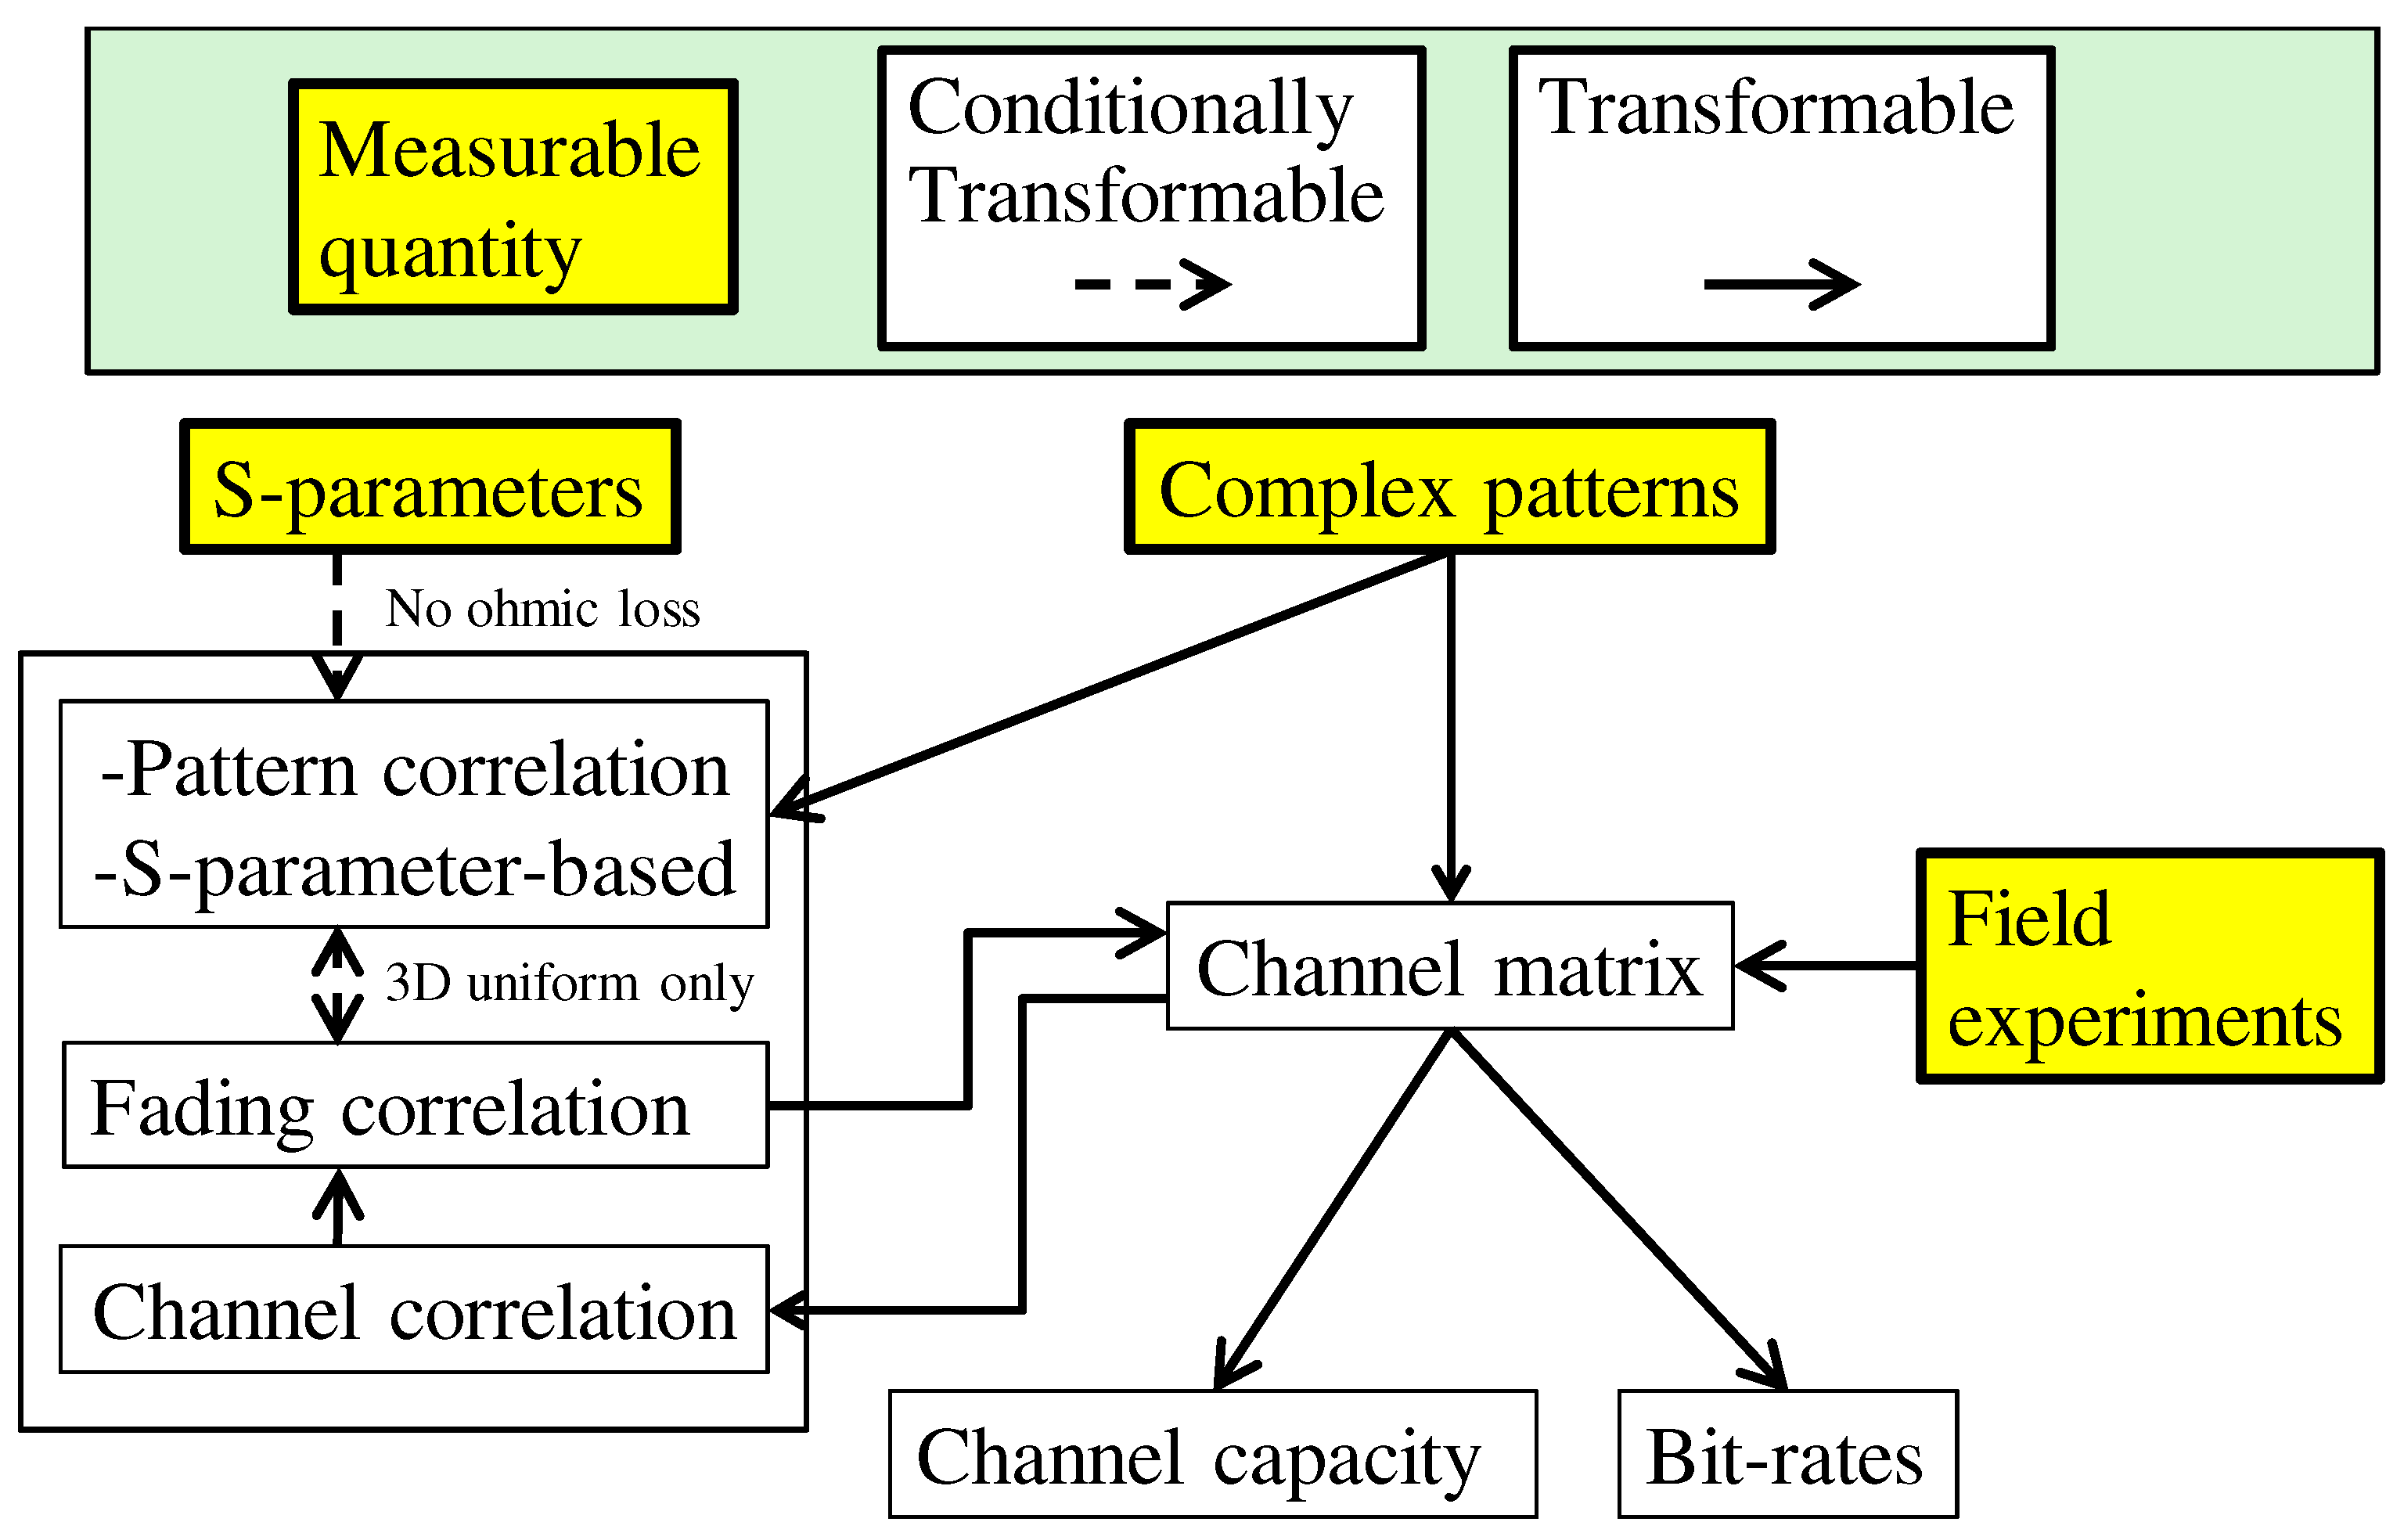
- Categorizing the correlation coefficients used in MIMO antenna evaluation.
- (b)
- Clarifying the commutativity among the correlation characteristics and some of the physical quantities
2. Definitions and Computations of Correlation Coefficients
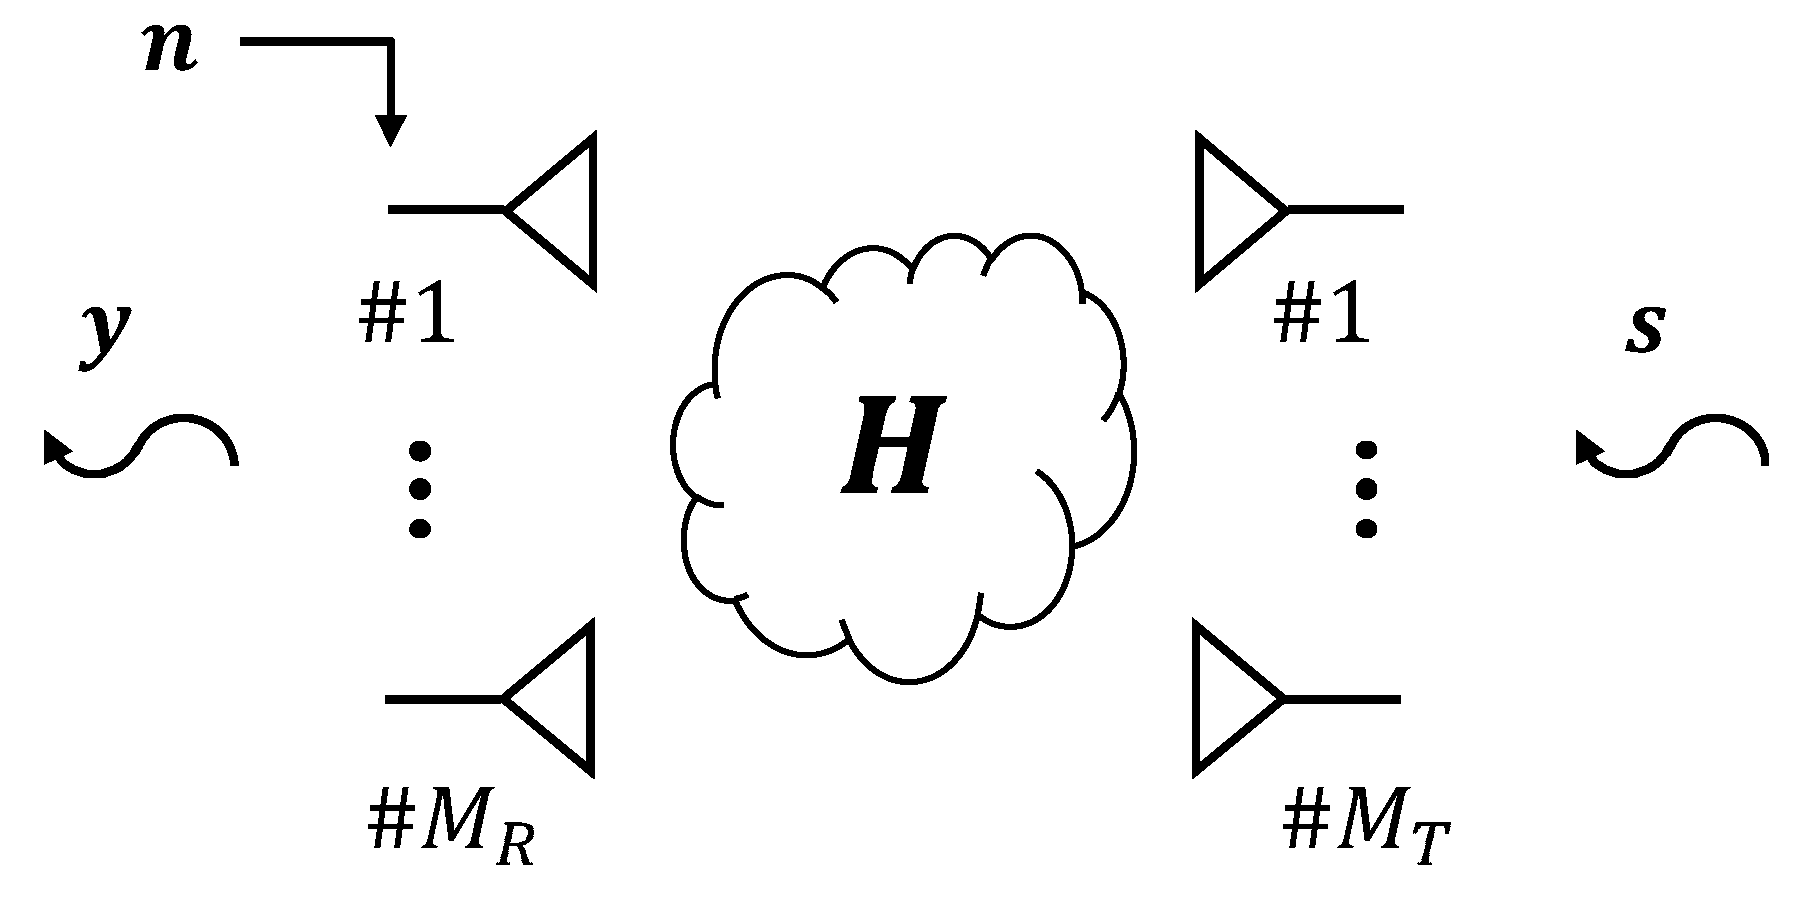
2.1. MIMO Signal Model
2.2. Received Signal Correlation
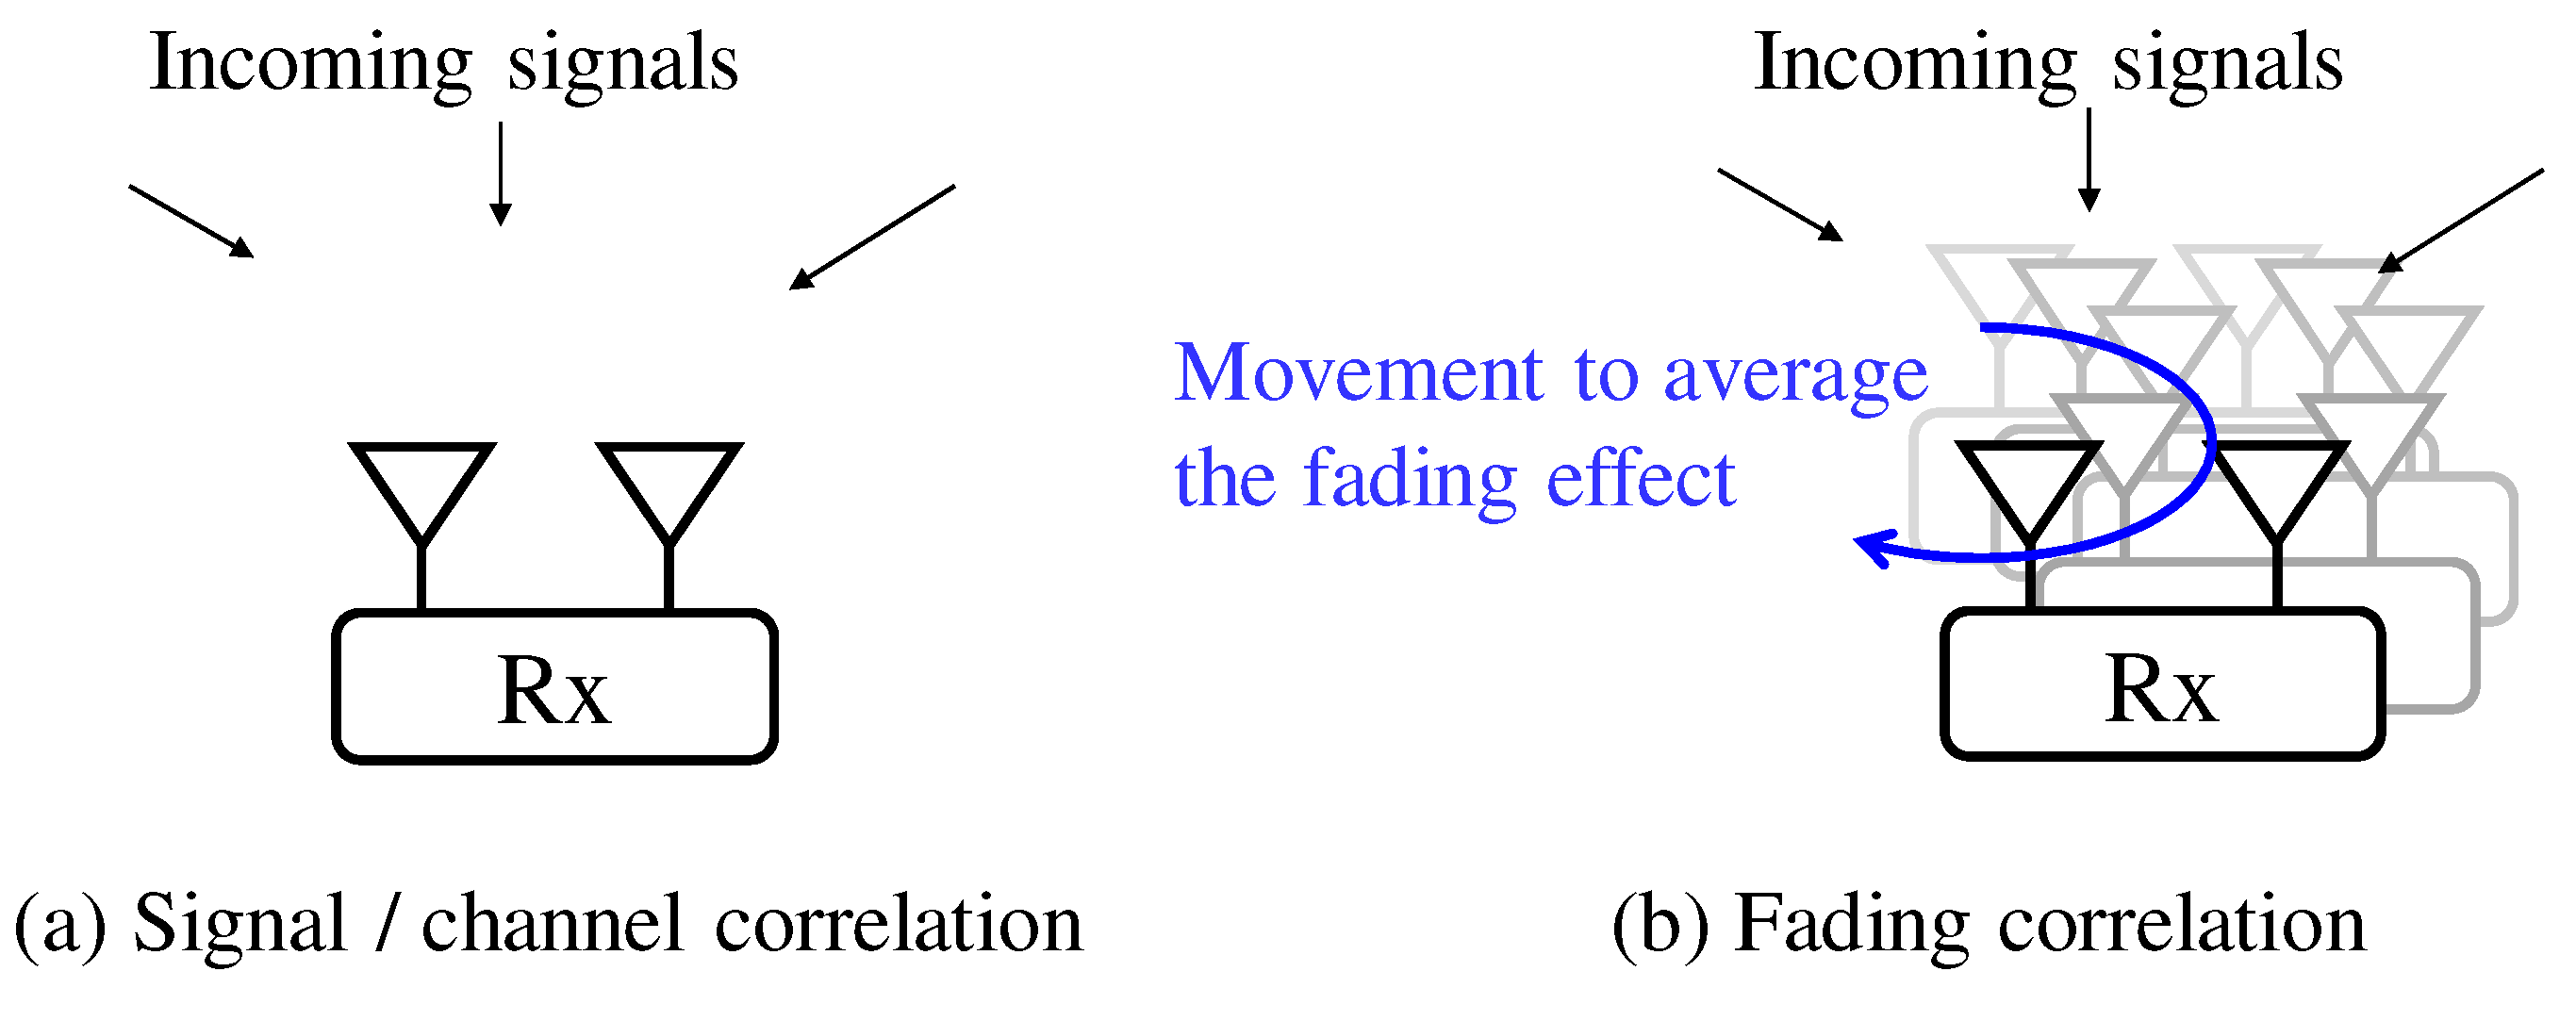
2.3. Channel Correlation
2.4. Fading Correlation
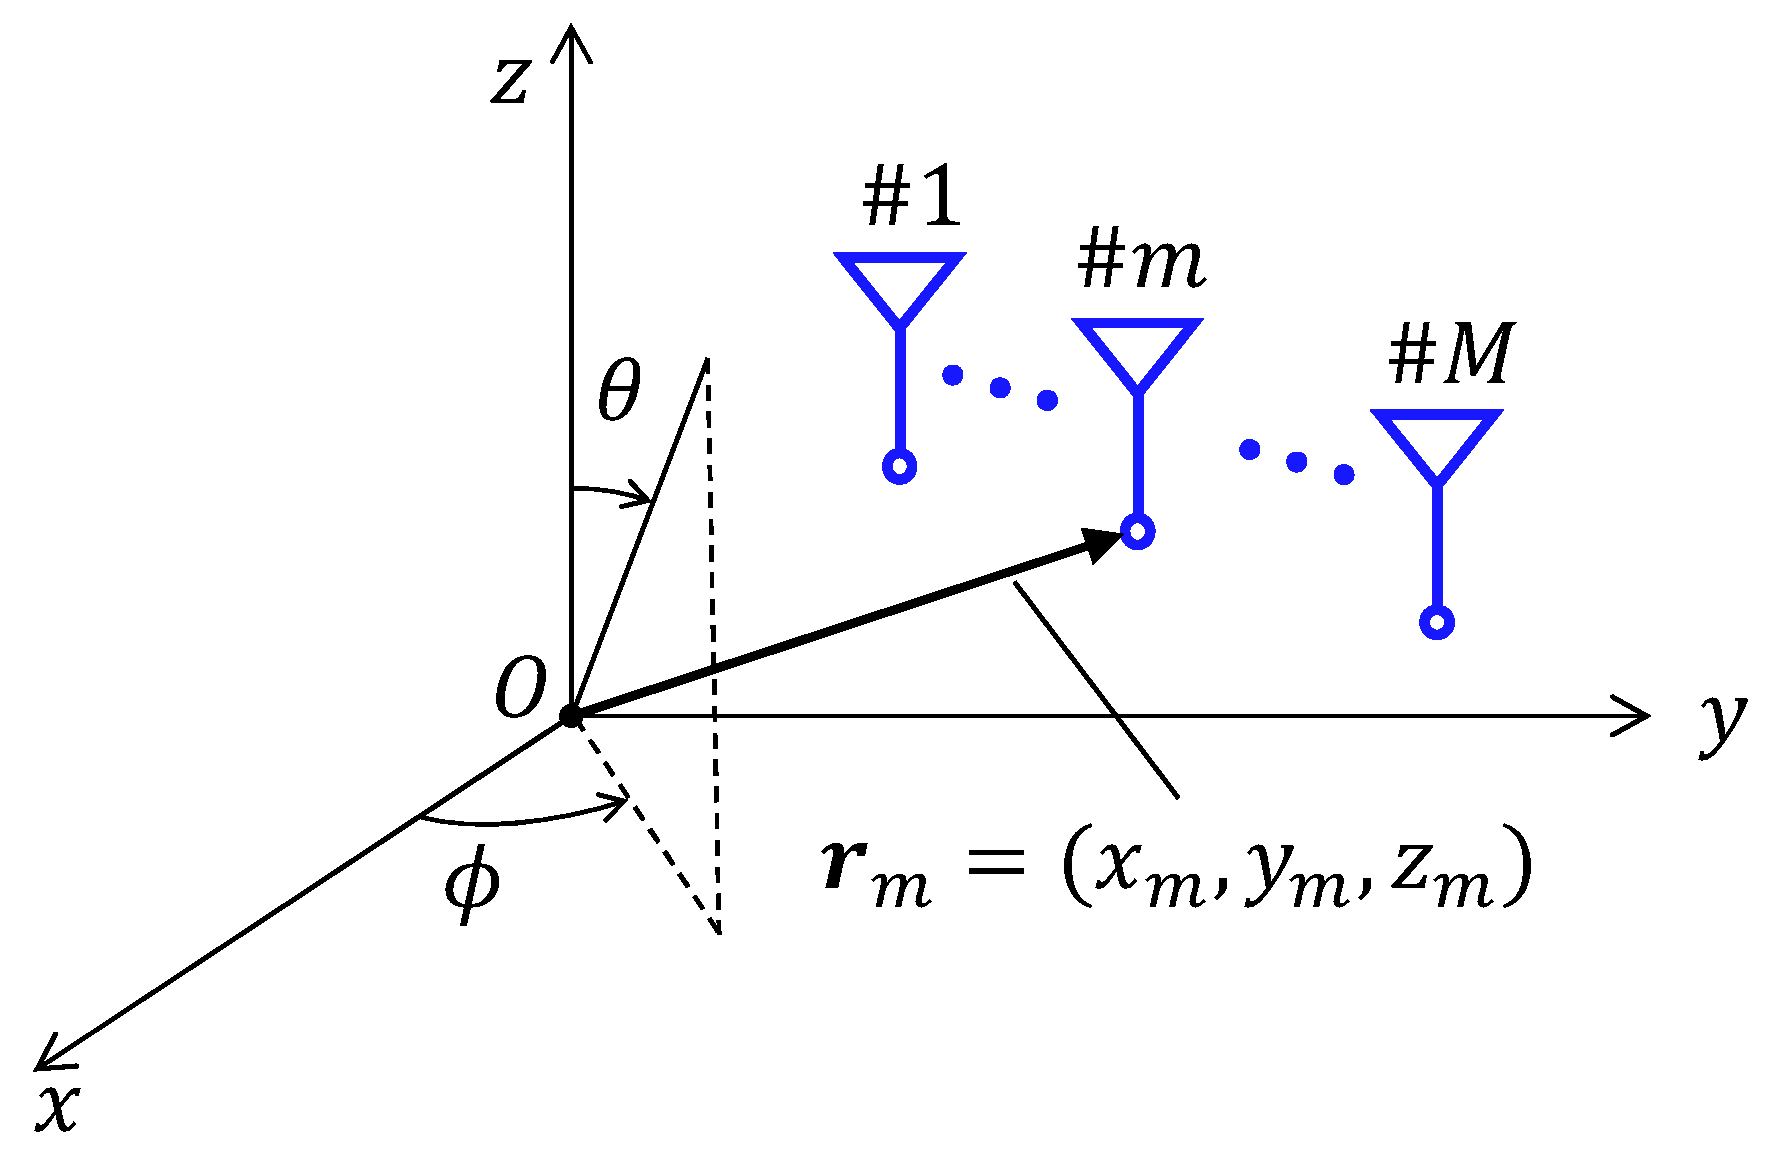
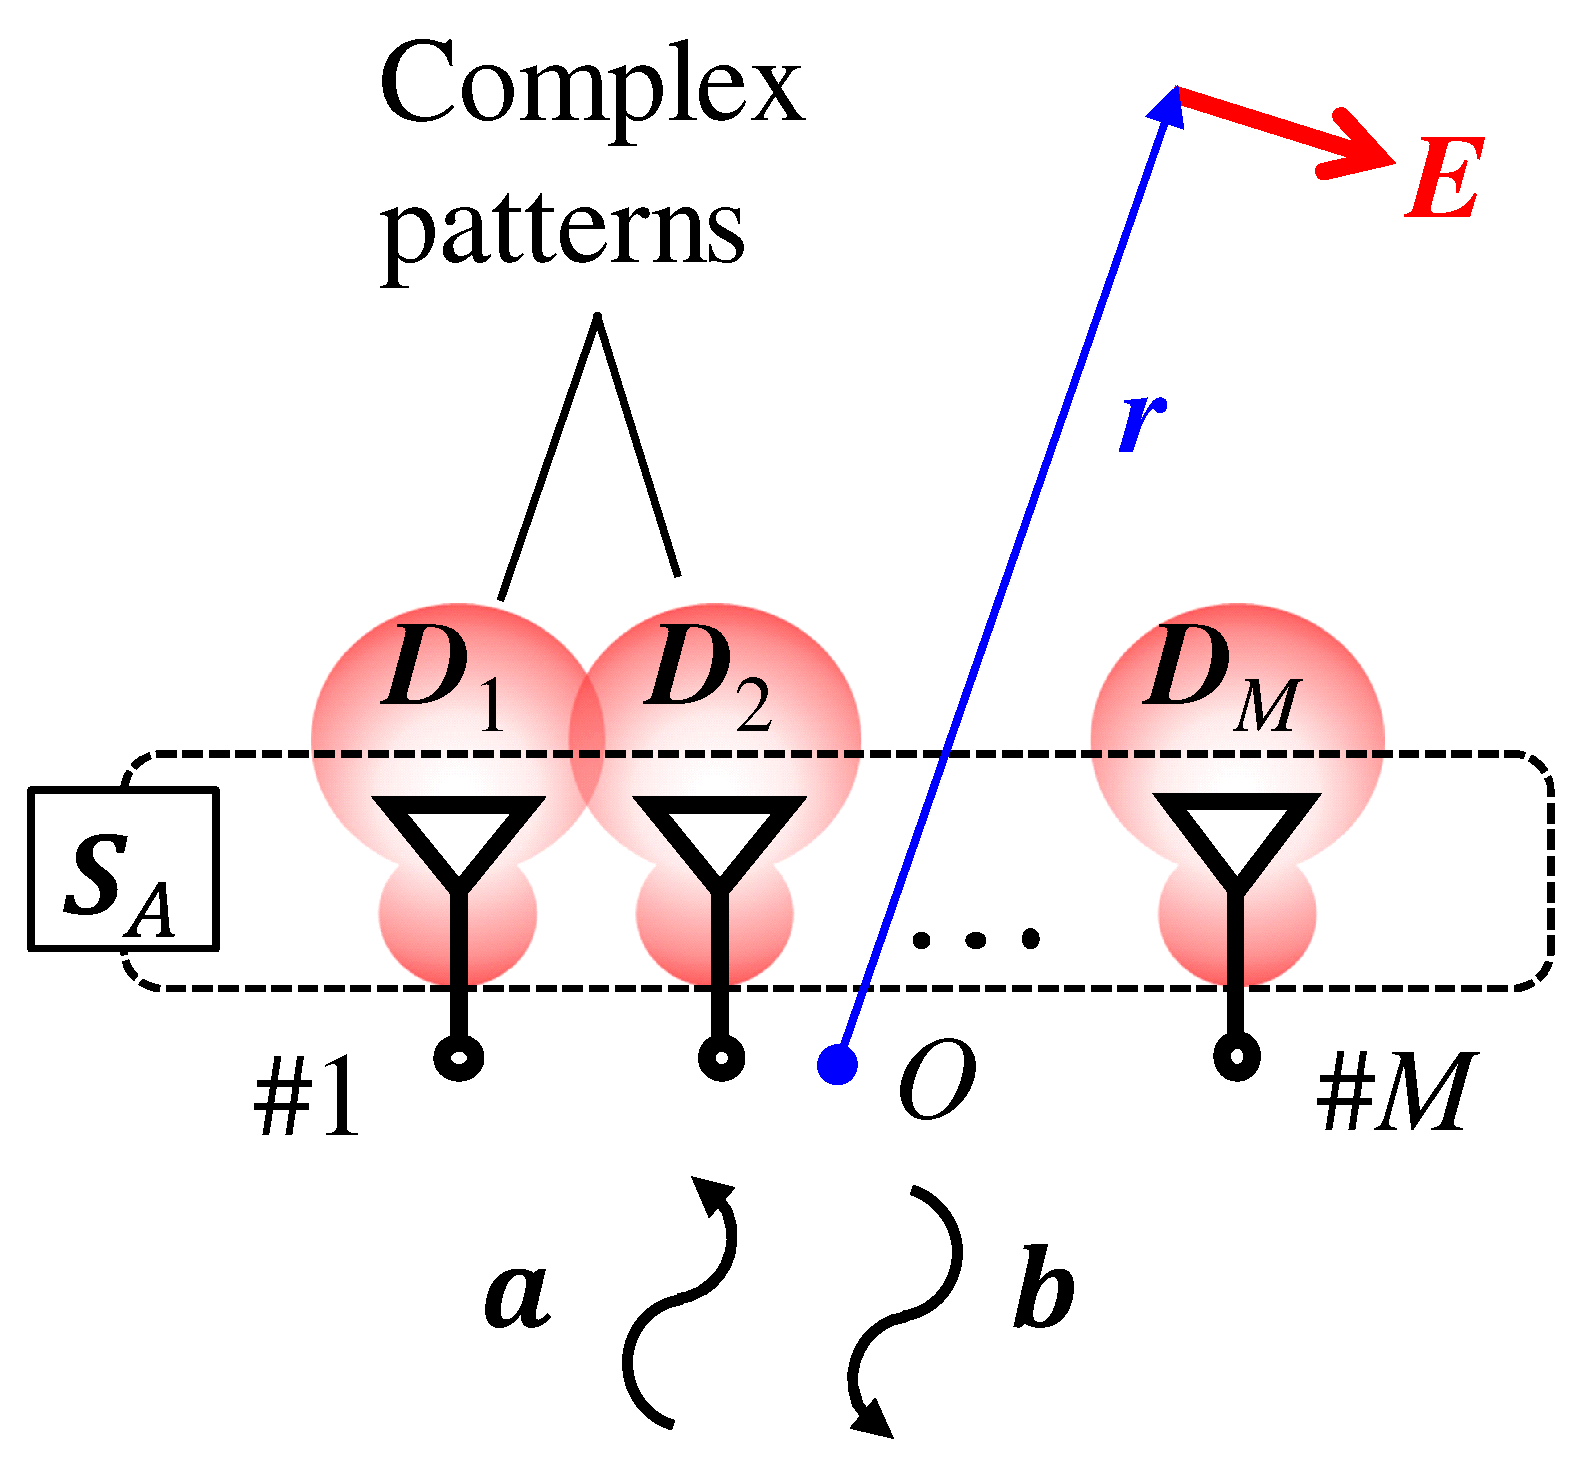
2.5. Complex Pattern Correlation
2.6. S-Parameter Based Correlation
2.7. Summary of the Various Kinds of Correlation Definitions
3. Simulation
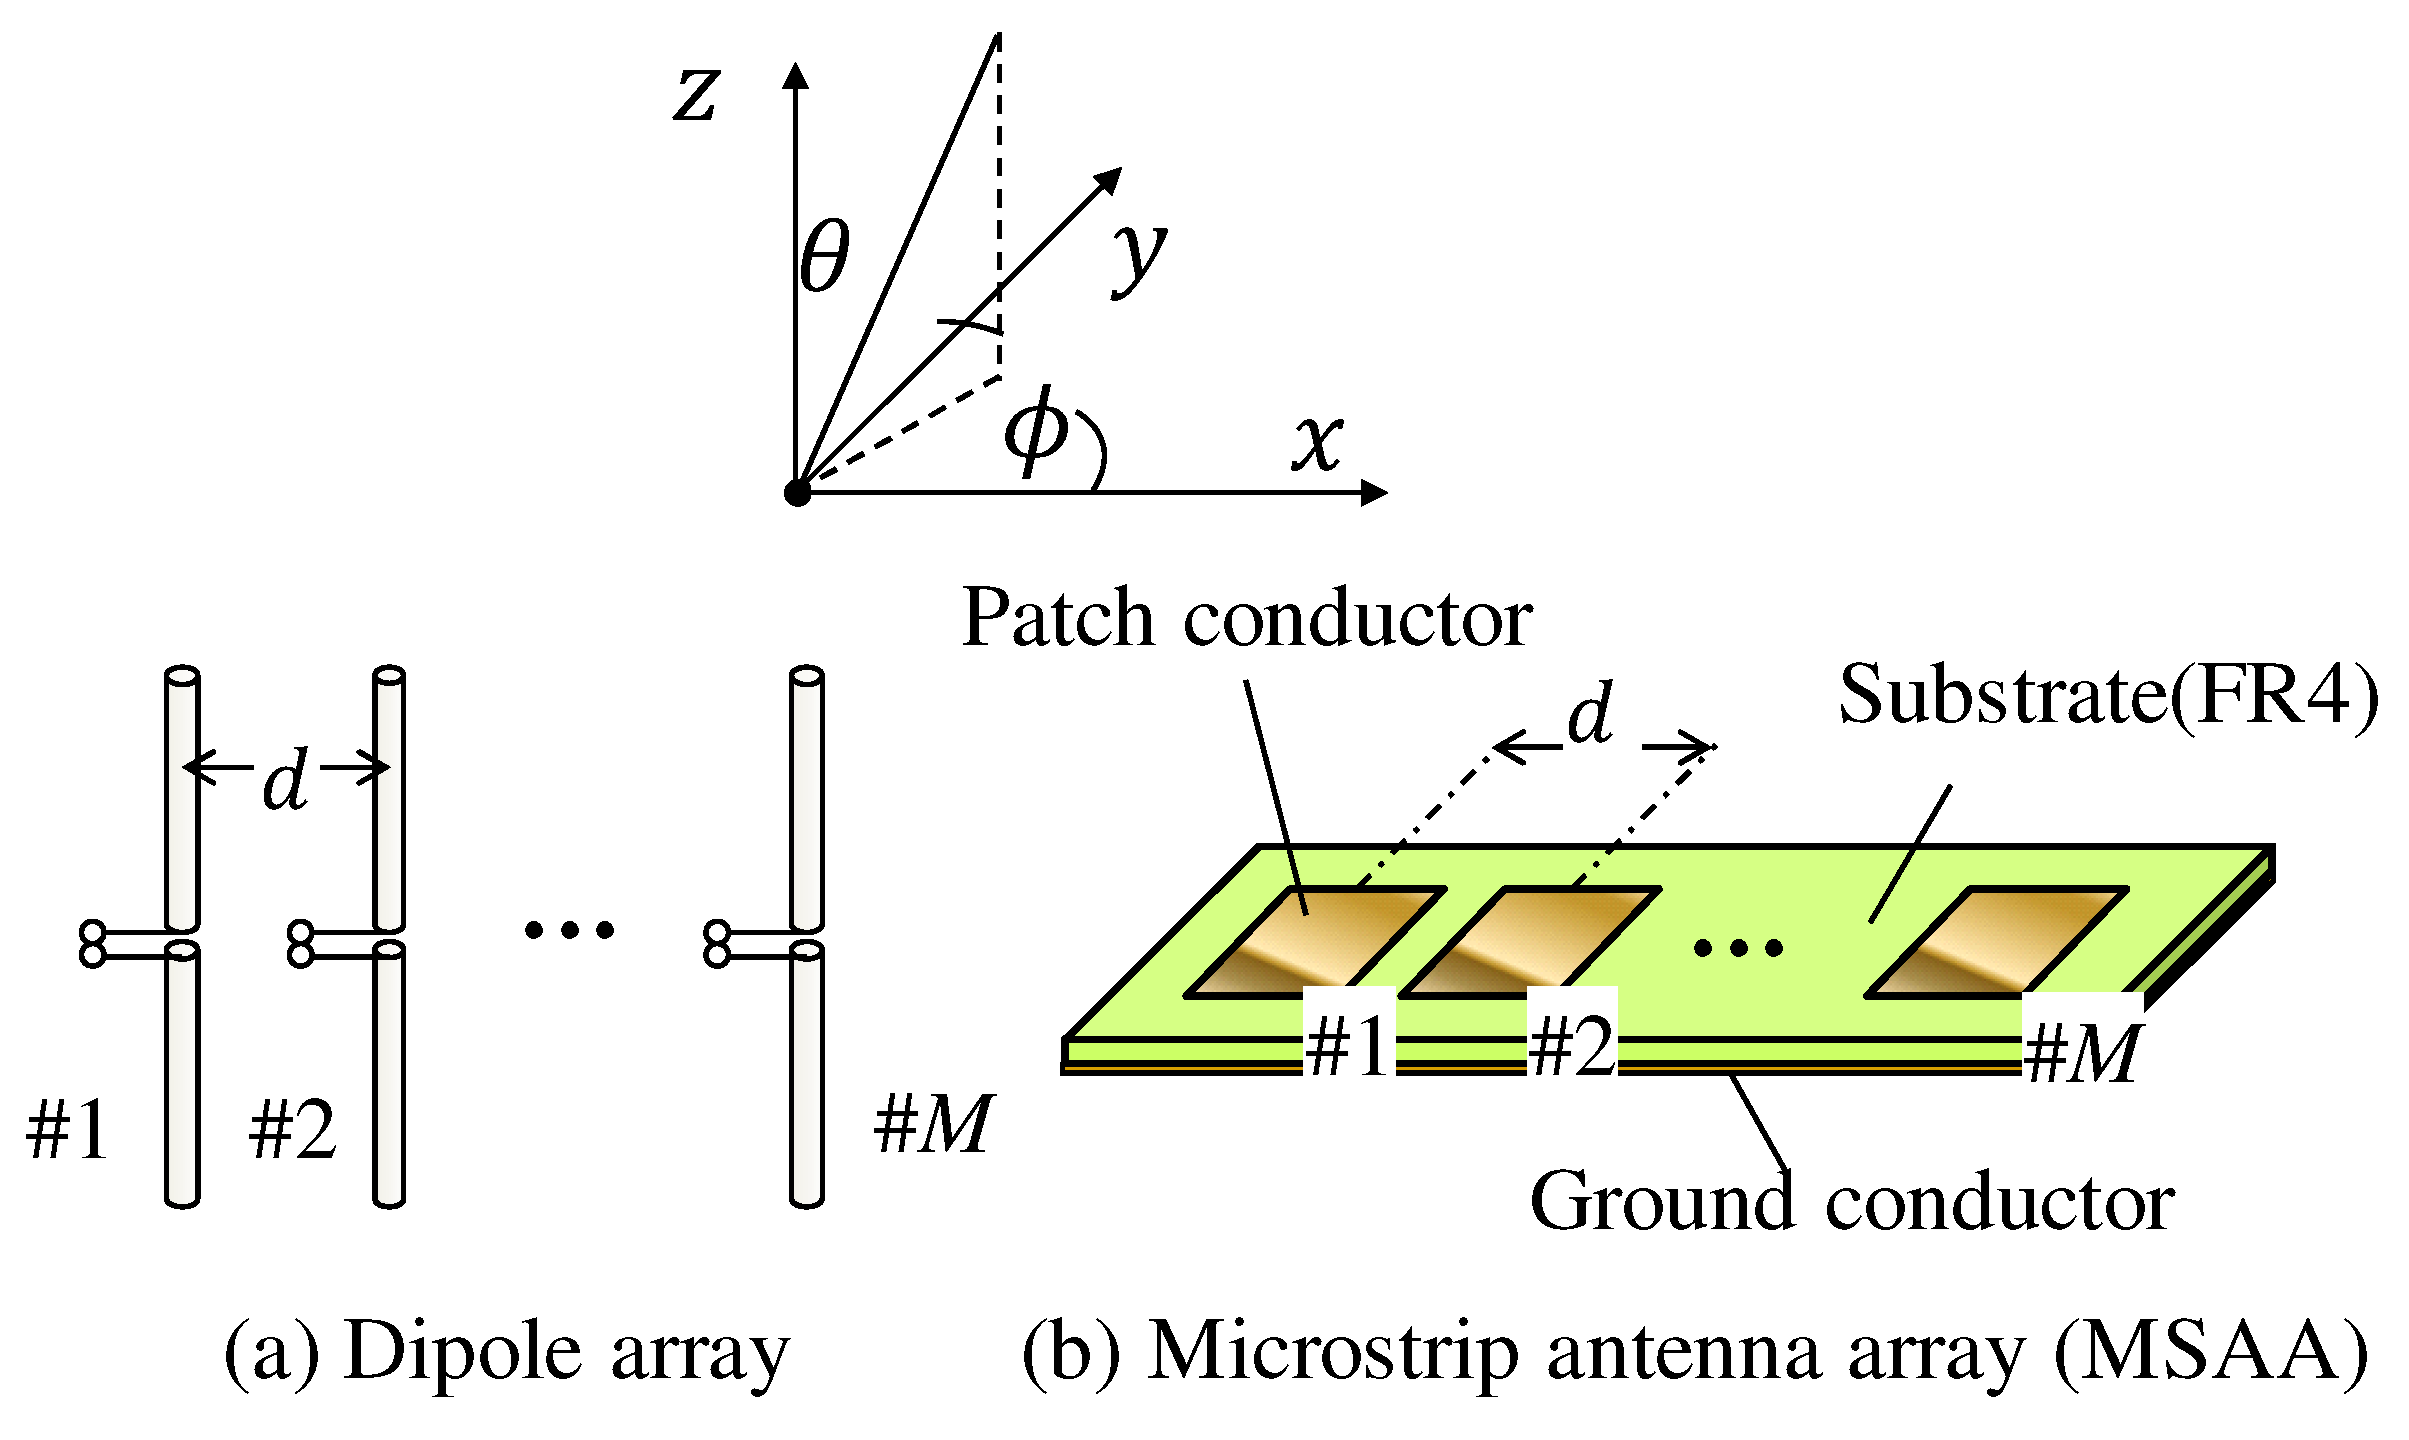
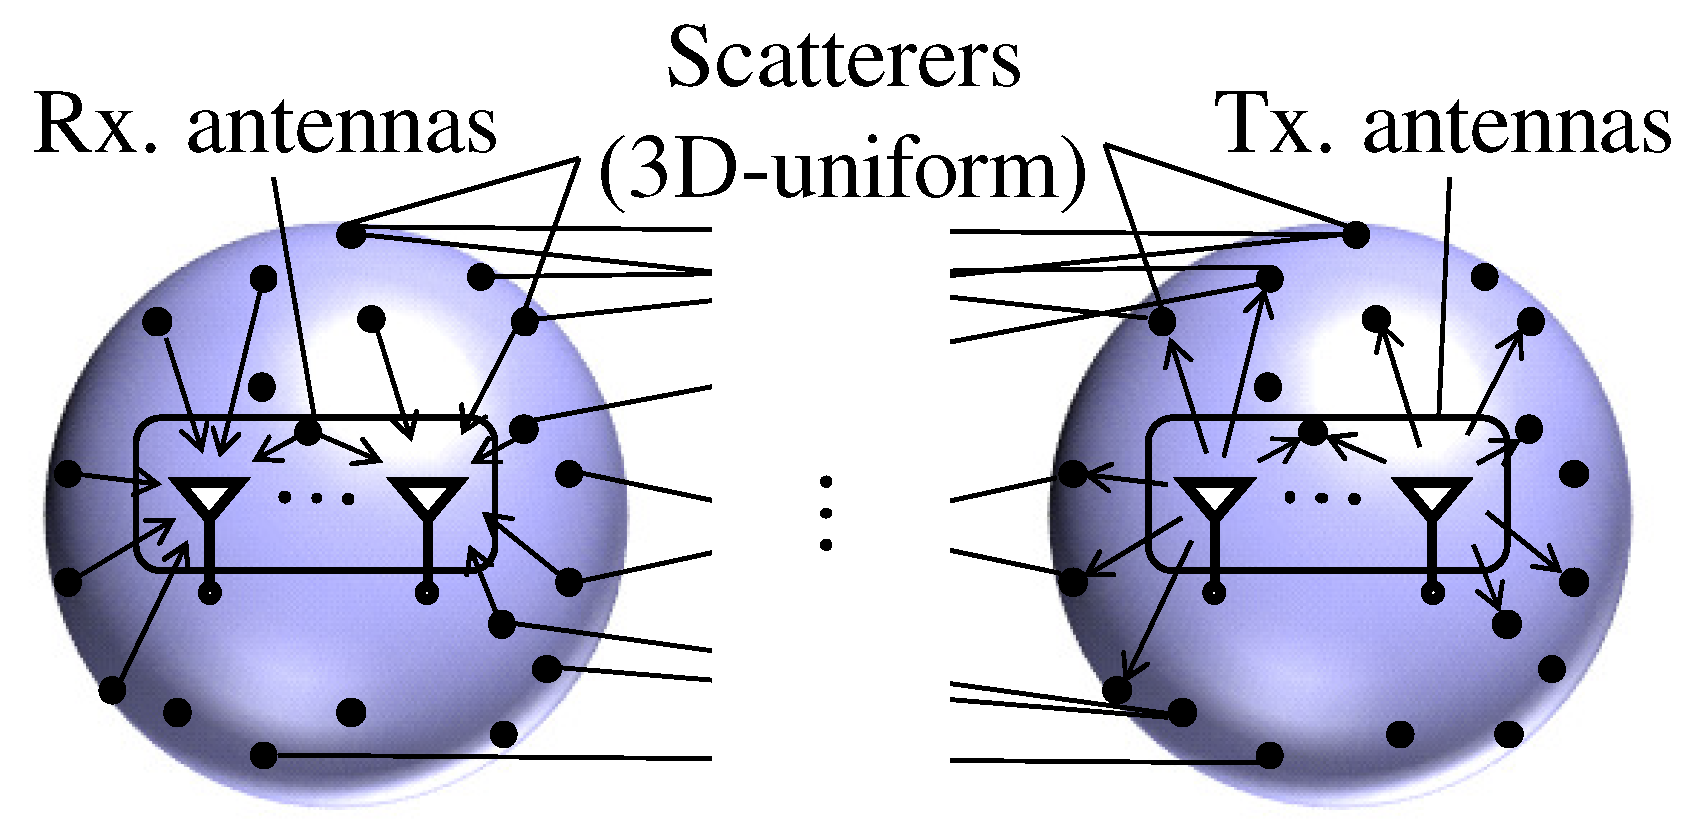
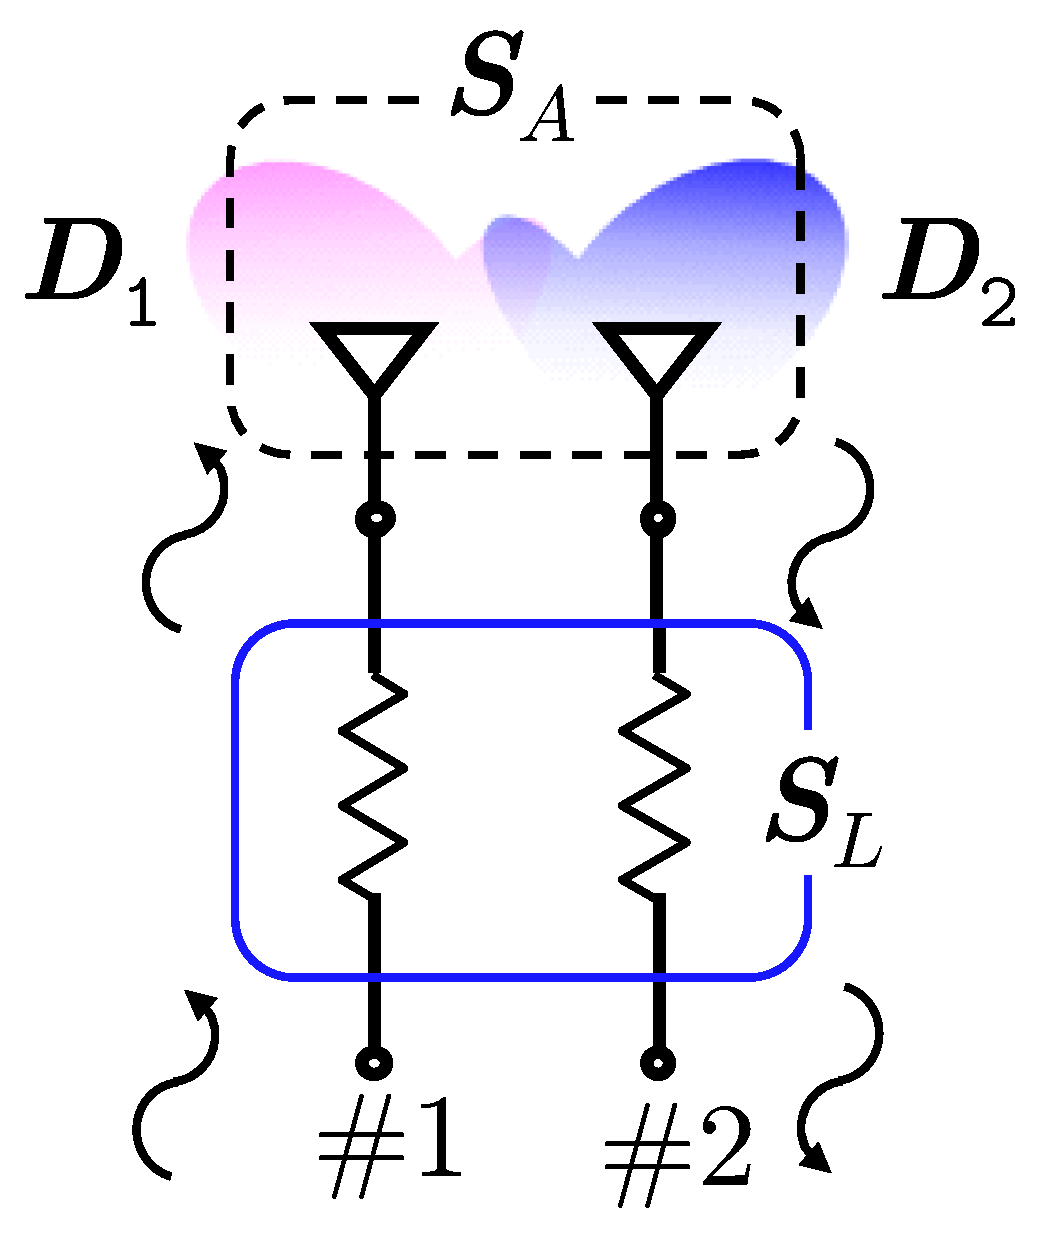
3.1. Antenna and Channel Models
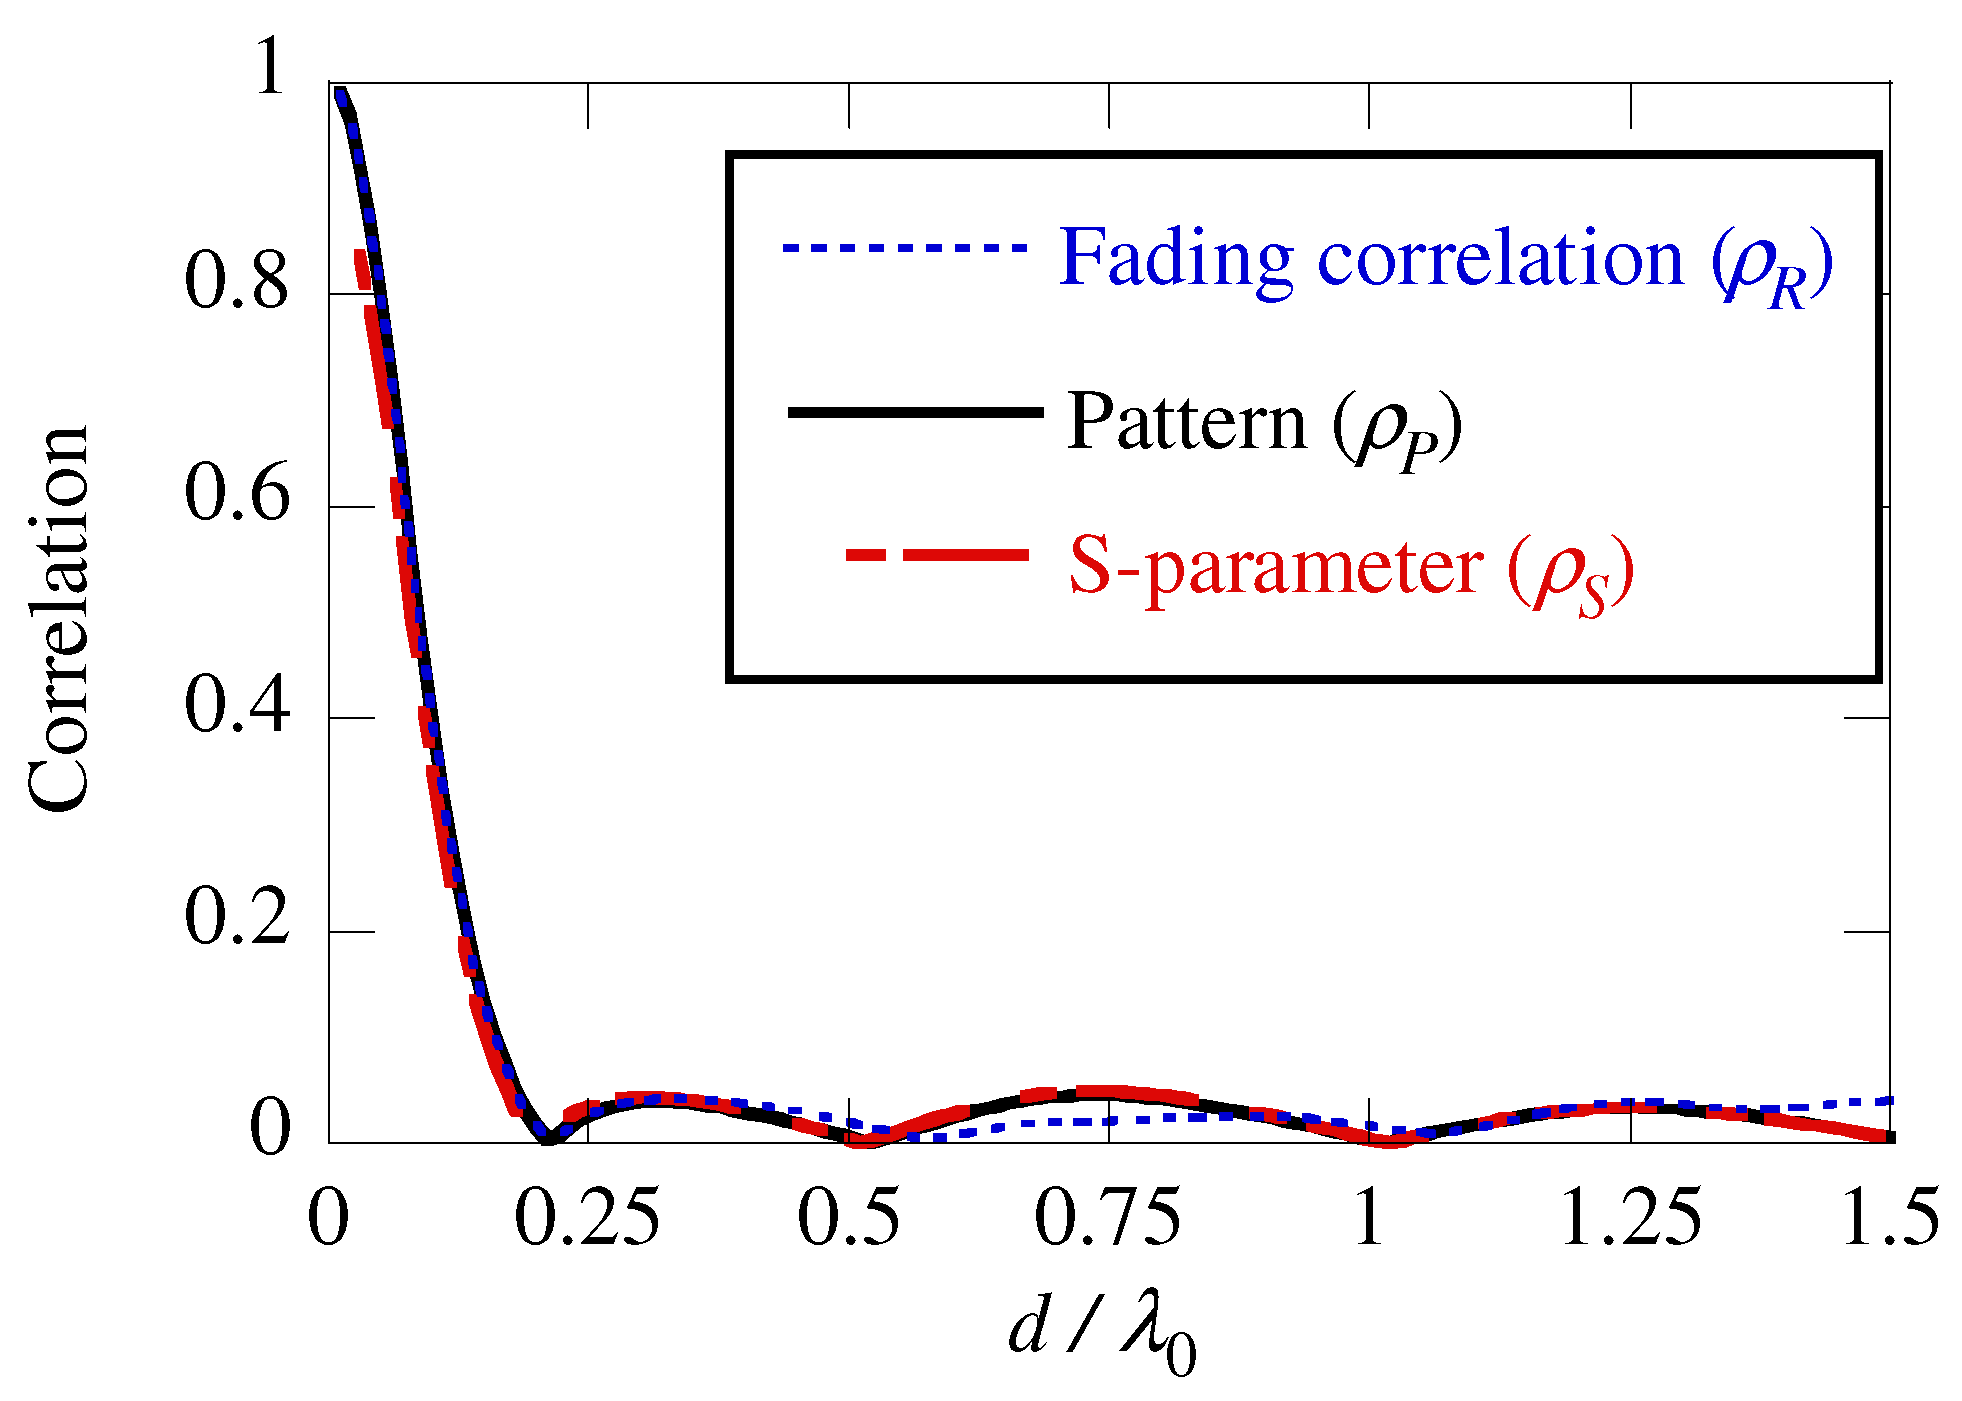
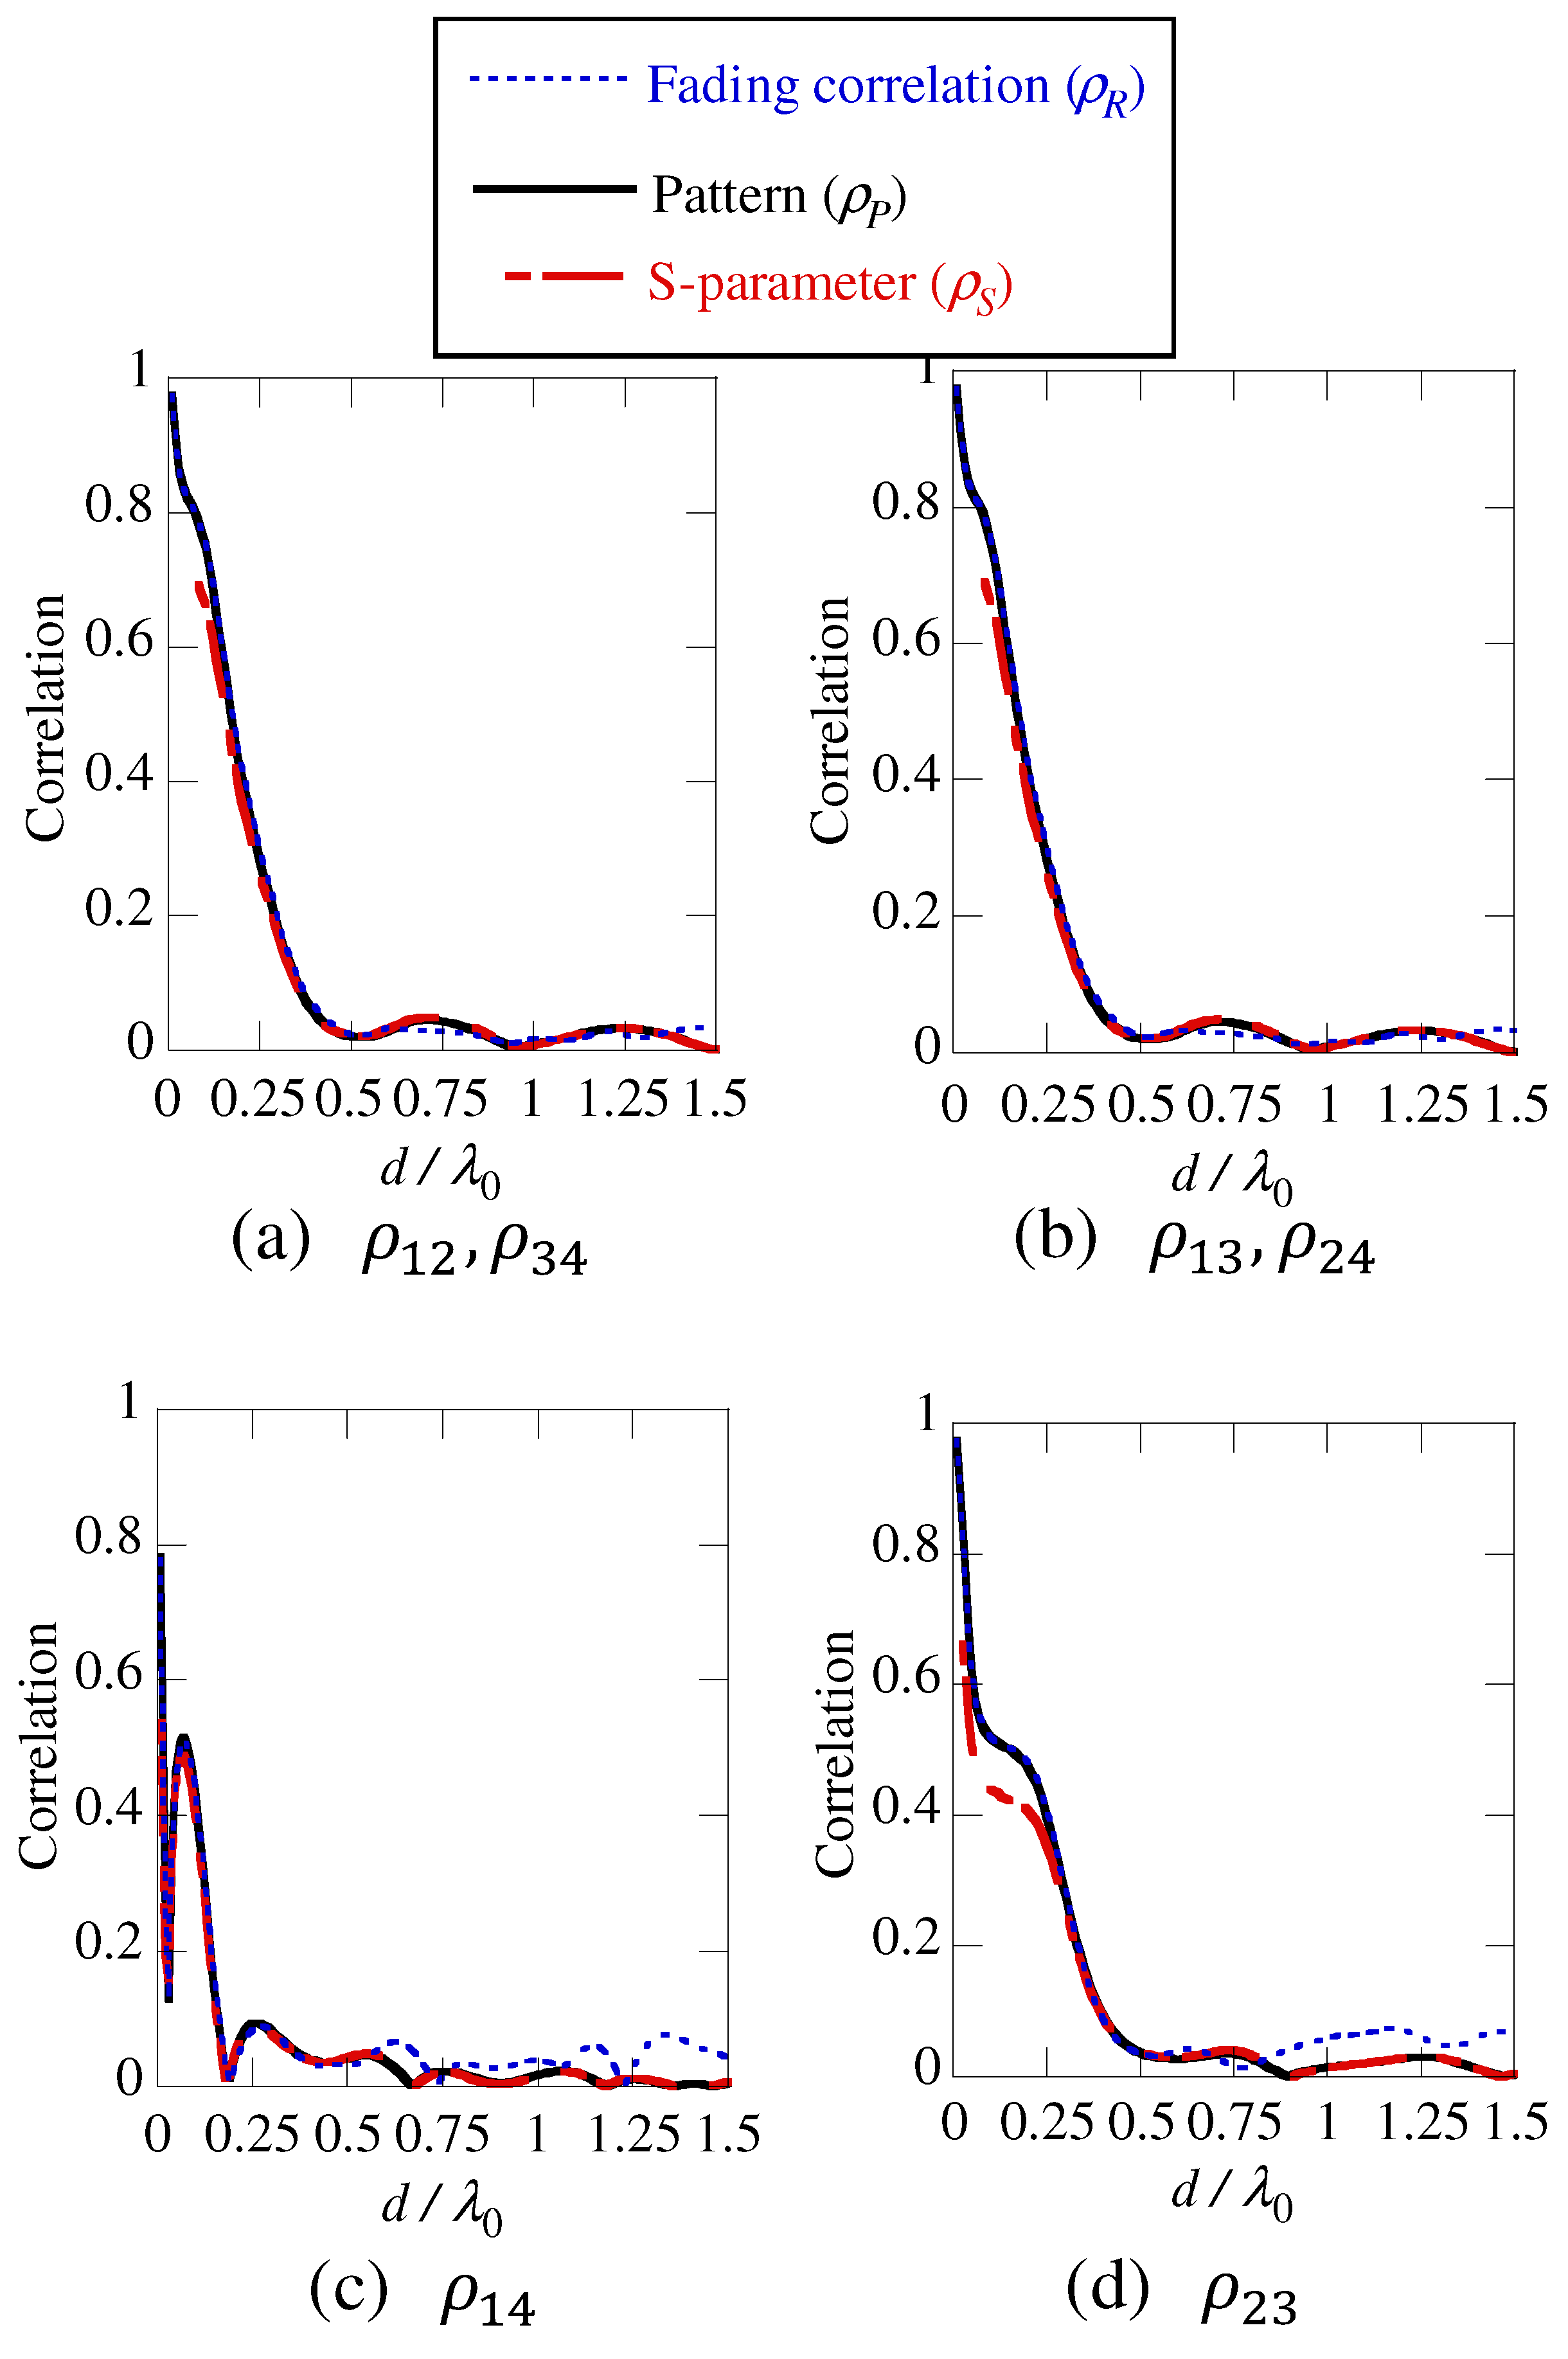
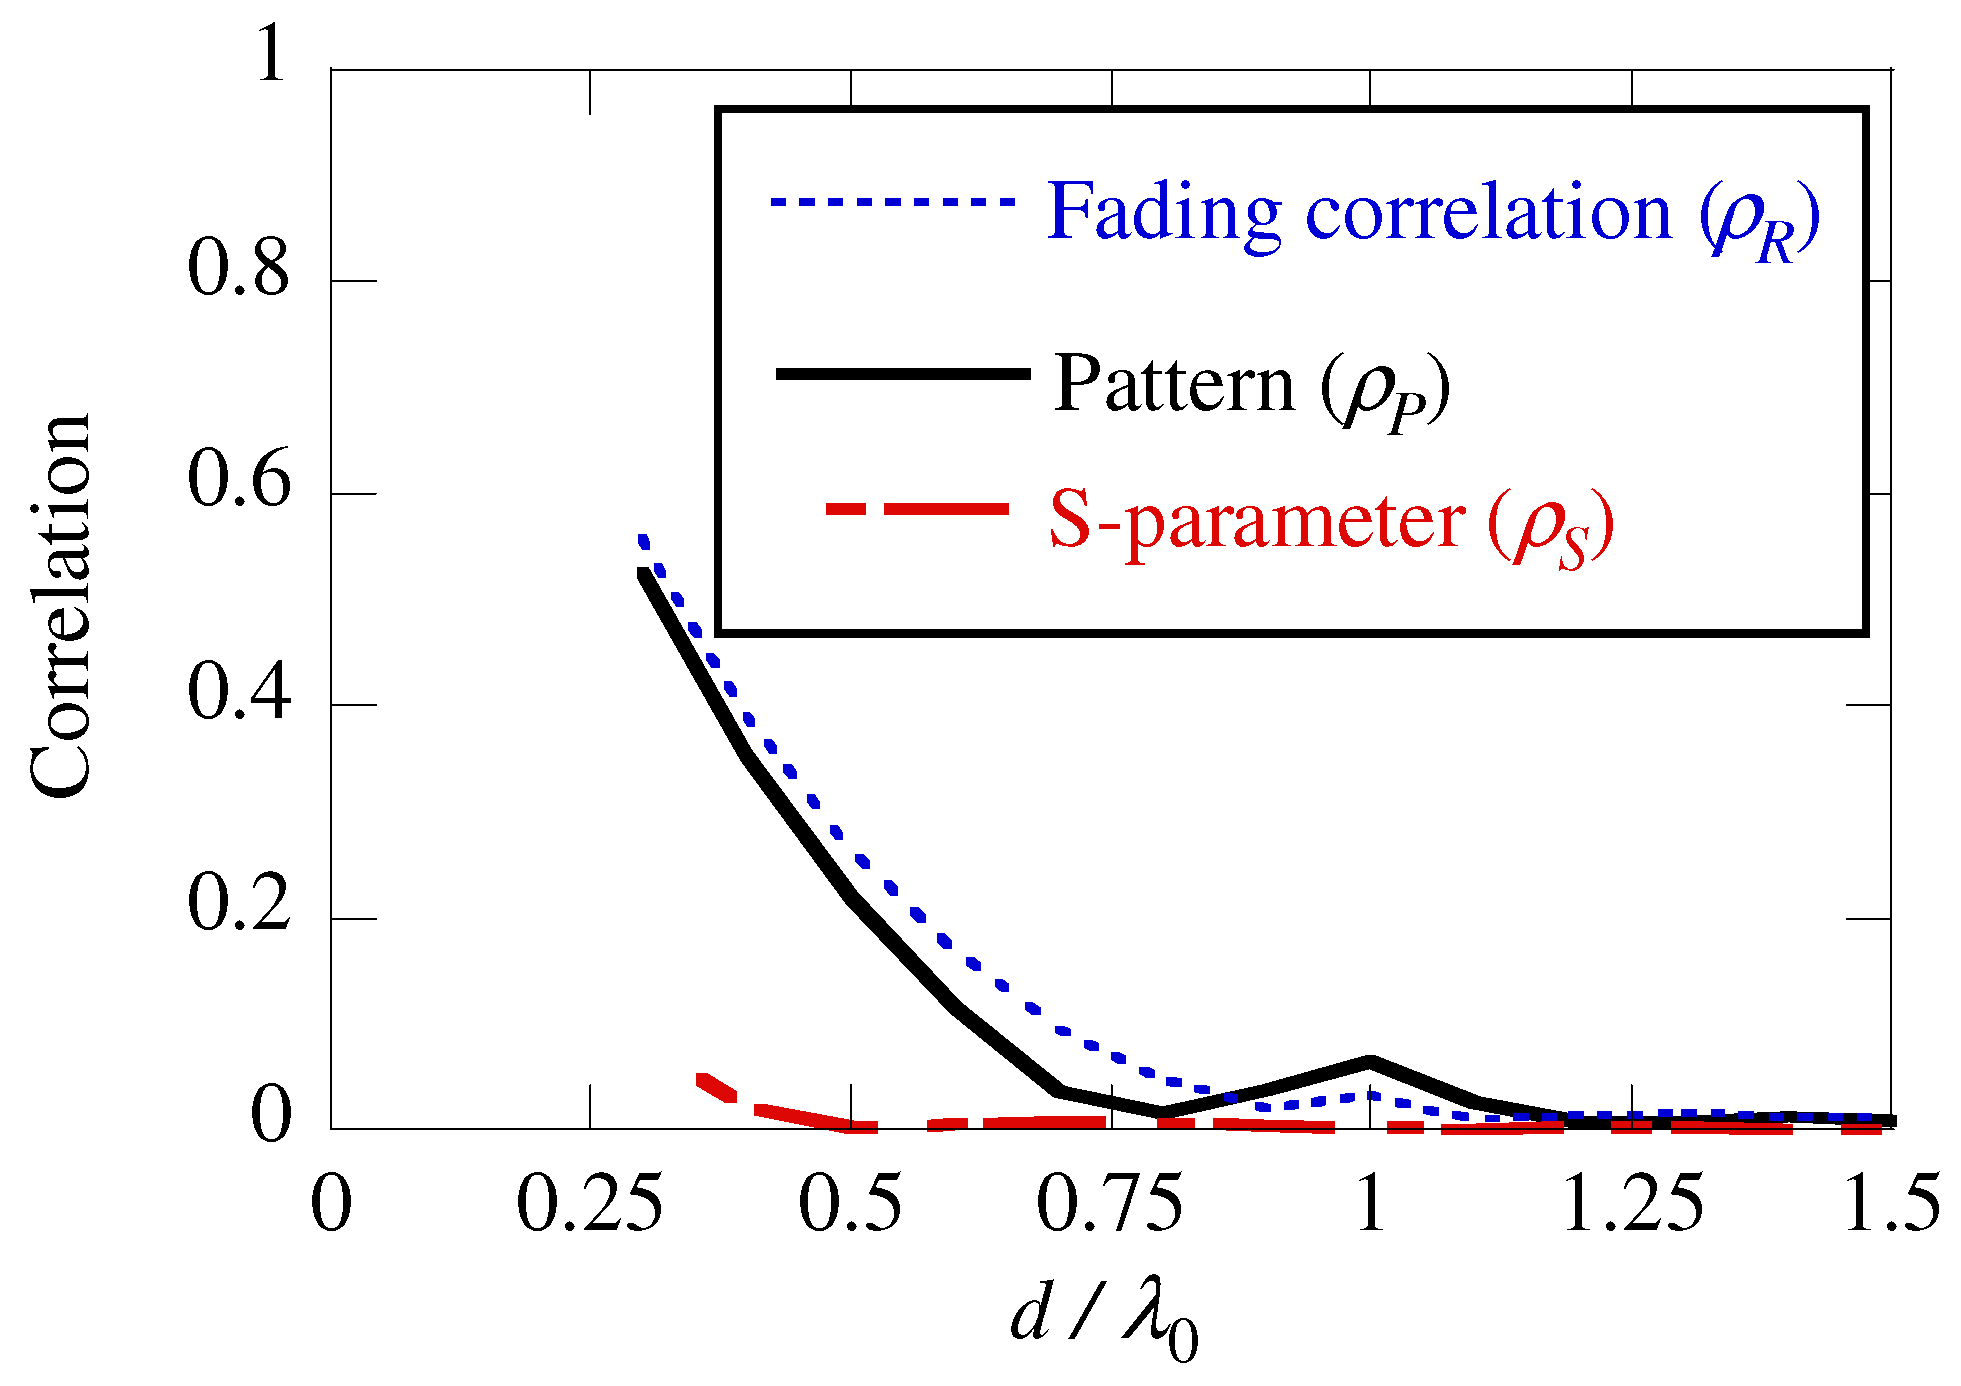
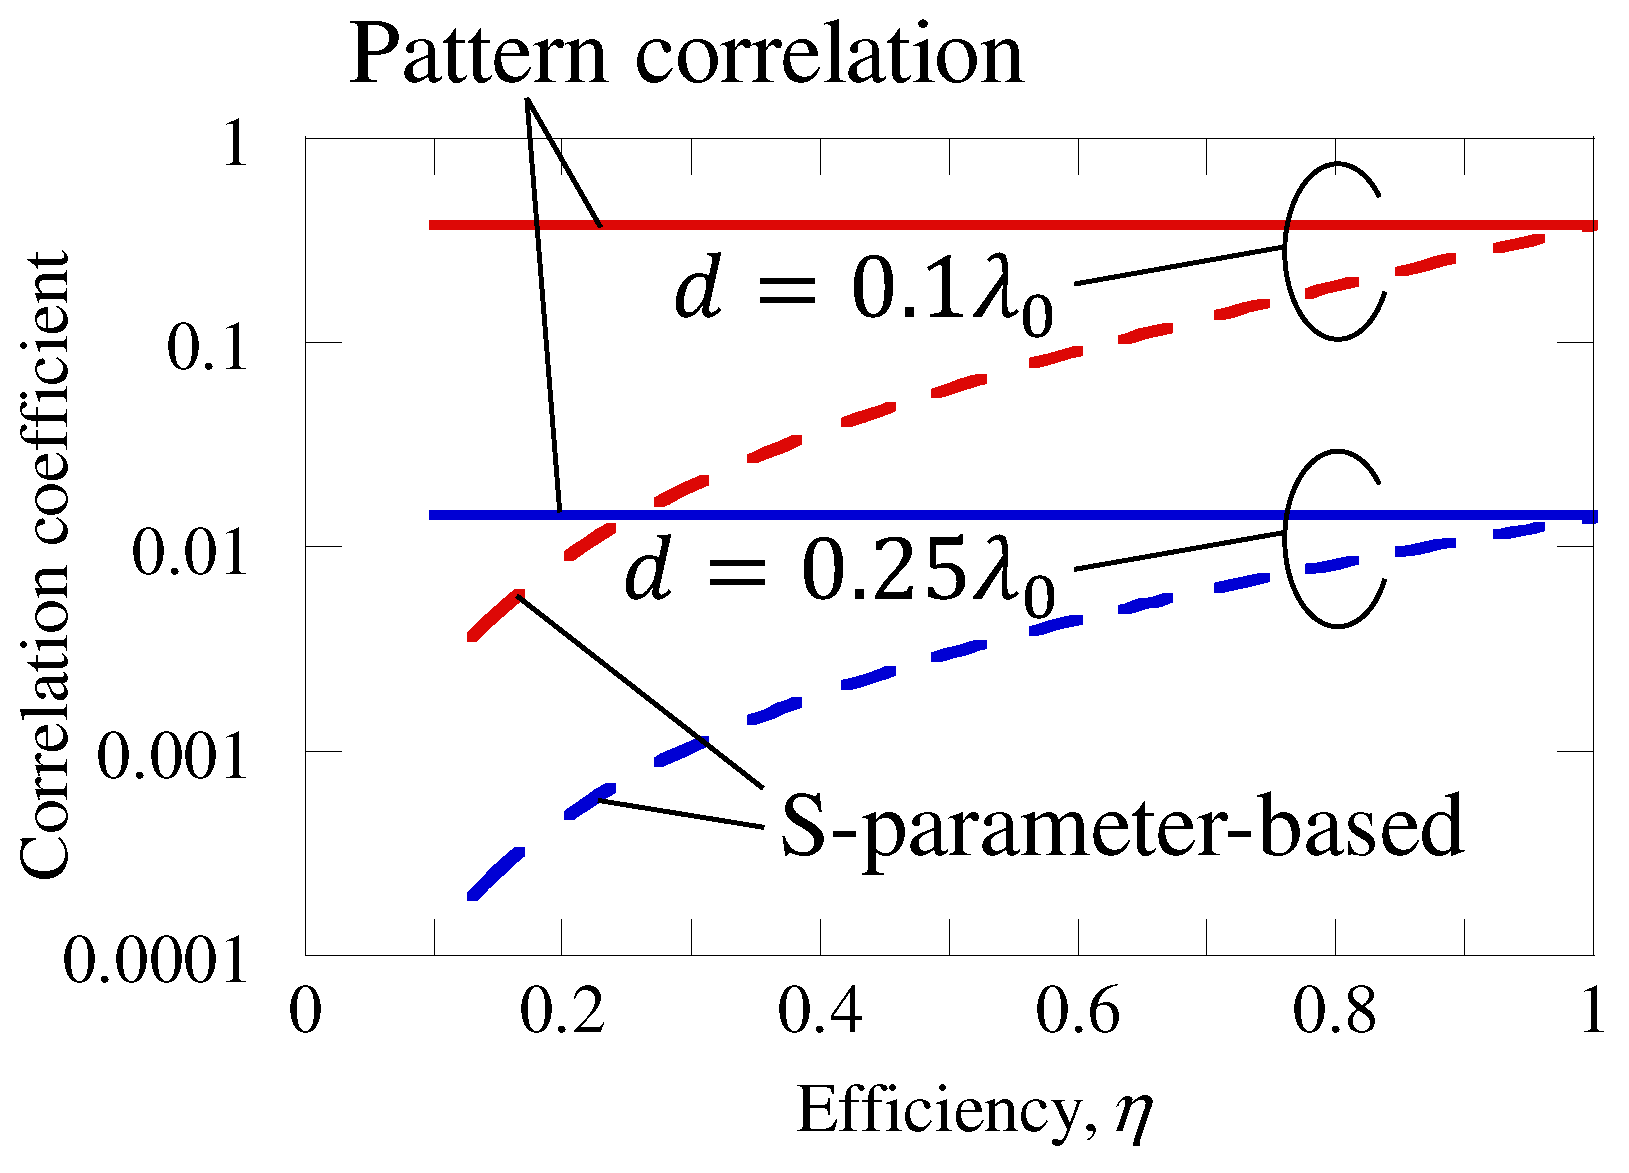
3.2. Results
4. Conclusions
Author Contributions
Funding
Conflicts of Interest
References
- Teletar, I.E. Capacity of Multi-Antenna Gaussian Channels; Tech. Rep.; AT&T-Bell Labs: Murray Hill, NJ, USA, 1995. [Google Scholar]
- Foschini, G.J.; Gans, M.J. Capacity when using diversity at transmit and receive sites and the Rayleigh-faded matrix channel is unknown at the transmitter. In Proceedings of the WINLAB Workshop on Wireless Information Network, New Brunswick, NJ, USA, 20–21 March 1996. [Google Scholar]
- Clarke, R. A statistical theory of mobile-radio reception. Bell Syst. Tech. J. 1968, 47, 957–1000. [Google Scholar] [CrossRef]
- Lee, W. Effects on correlation between two mobile radio base-station antennas. IEEE Trans. Commun. 1973, 21, 1214–1224. [Google Scholar] [CrossRef]
- Shiu, D.S.; Foschini, G.J.; Gans, M.J.; Kahn, J.M. Fading correlation and its effect on the capacity of multielement antenna systems. IEEE Trans. Commun. 2000, 48, 502–513. [Google Scholar] [CrossRef]
- Chizhik, D.; Rashid-Farrokhi, F.; Ling, J.; Lozano, A. Effect of antenna separation on the capacity of BLAST in correlated channels. IEEE Commun. Lett. 2000, 4, 337–339. [Google Scholar] [CrossRef]
- Molisch, A.F. A generic model for MIMO wireless propagation channels. IEEE Trans. Signal Process. 2004, 52, 61–71. [Google Scholar] [CrossRef]
- Blanch, S.; Romeu, J.; Corbella, I. Exact representation of antenna system diversity performance from input parameter description. Electron. Lett. 2003, 39, 705–707. [Google Scholar] [CrossRef]
- Nadeem, I.; Choi, D. Study on mutual coupling reduction technique for MIMO antennas. IEEE Access 2019, 7, 563–586. [Google Scholar] [CrossRef]
- Ludwig, A. Mutual coupling, gain and directivity of an array of two identical antennas. IEEE Trans. Antennas Propag. 1976, 24, 837–841. [Google Scholar] [CrossRef]
- Hallbjorner, P. The significance of radiation efficiencies when using S-parameters to calculate the received signal correlation from two antennas. IEEE Antennas Wirel. Propag. Lett. 2005, 4, 97–99. [Google Scholar] [CrossRef]
- Narbudowicz, A.; Ammann, M.J.; Heberling, D. Impact of lossy feed on S-parameter based envelope correlation coefficient. In Proceedings of the 2016 10th European Conference on Antennas and Propagation (EuCAP 2016), Davos, Switzerland, 10–15 April 2016. [Google Scholar]
- Li, H.; Lin, X.; Lau, B.K.; He, S. Equivalent circuit based calculation of signal correlation in lossy MIMO antennas. IEEE Trans. Antennas Propagat. 2013, 61, 5214–5222. [Google Scholar] [CrossRef]
- Sharawi, M.S.; Hassen, A.T.; Khan, M.U. Correlation coefficient calculations for MIMO antenna systems: A comparative study. Int. J. Microw. Wirel. Technol. 2017, 9, 1991–2004. [Google Scholar] [CrossRef]
- Kyritsi, P.; Chizhik, D. Capacity of multiple antenna systems in free space and above perfect ground. IEEE Commun. Lett. 2002, 6, 325–327. [Google Scholar] [CrossRef]
- Mao, C.; Chu, Q. Compact coradiator UWB-MIMO antenna with dual polarization. IEEE Trans. Antennas Propag. 2014, 62, 4474–4480. [Google Scholar] [CrossRef]
- Getu, B.; Andersen, J. The MIMO cube - a compact MIMO antenna. IEEE Trans. Wirel. Commun. 2005, 4, 1136–1141. [Google Scholar] [CrossRef]
- Das, N.K.; Inoue, T.; Taniguchi, T.; Karasawa, Y. An experiment on MIMO system having three orthogonal polarization diversity branches in multipath-rich environment. IEEE Veh. Technol. Conf. Fall 2004, 2, 1528–1532. [Google Scholar]
- Honma, N.; Nishimori, K.; Takatori, Y.; Ohta, A.; Tsunekawa, K. Proposal of compact three-port MIMO antenna employing modified inverted F antenna and notch antennas. In Proceedings of the 2006 IEEE International Symposium on Antennas and Propagation (AP-S 2006), Albuquerque, NM, USA, 9–14 July 2006; pp. 2613–2616. [Google Scholar]
- Wallace, J.W.; Jensen, M.A. Mutual coupling in MIMO wireless systems: A rigorous network theory analysis. IEEE Trans. Wirel. Commun. 2004, 3, 1317–1325. [Google Scholar] [CrossRef]
- Karlsson, A. On the efficiency and gain of antennas. Prog. Electromagn. Res. 2013, 136, 479–494. [Google Scholar] [CrossRef][Green Version]
- Singh, P.K.; Saini, J. Effect of superstrate on a cylindrical microstrip antenna. Prog. Electromagn. Res. Lett. 2018, 75, 83–89. [Google Scholar] [CrossRef]
- Ndip, I.; Lang, K.D.; Reichl, H.; Henke, H. On the radiation characteristics of full-Loop, half-loop, and quasi-half-loop bond wire antennas. IEEE Trans. Antennas Propag. 2018, 66, 5672–5686. [Google Scholar] [CrossRef]
- Ivrlac, M.T.; Utschick, W.; Nossek, J.A. Fading correlations in wireless MIMO communication systems. IEEE J. Sel. Areas Commun. 2003, 21, 819–828. [Google Scholar] [CrossRef]
- Nishimoto, H.; Ogawa, Y.; Nishimura, T.; Ohgane, T. Measurement-based performance evaluation of MIMO spatial multiplexing in a multipath-rich indoor environment. IEEE Trans. Antennas Propag. 2017, 55, 3677–3689. [Google Scholar] [CrossRef][Green Version]
- Nishimori, K.; Tachikawa, N.; Takatori, Y.; Kudo, R.; Tsunekawa, K. Frequency correlation characteristics due to antenna configurations in broadband MIMO transmission. IEICE Trans. Commun. 2005, E88-B, 2438–2445. [Google Scholar] [CrossRef]
- Oestges, C. Validity of the Kronecker model for MIMO correlated channels. In Proceedings of the 63rd IEEE Vehicular Technology Conference (VTC Spring), Melbourne, Australia, 7–10 May 2006; Volume 6, pp. 2818–2822. [Google Scholar]


| Definition | Meaning | |
|---|---|---|
| Signal correlation | Correlation characteristics of the complex signal vector, | |
| Channel correlation | ||
| Fading correlation | Statistical correlation of the certain environment | |
| Complex pattern correlation | Correlation computed from complex pattern functions | |
| S-parameter based correlation | (Valid only when Joule heat loss is 0) |
© 2020 by the authors. Licensee MDPI, Basel, Switzerland. This article is an open access article distributed under the terms and conditions of the Creative Commons Attribution (CC BY) license (http://creativecommons.org/licenses/by/4.0/).
Share and Cite
Honma, N.; Murata, K. Correlation in MIMO Antennas. Electronics 2020, 9, 651. https://doi.org/10.3390/electronics9040651
Honma N, Murata K. Correlation in MIMO Antennas. Electronics. 2020; 9(4):651. https://doi.org/10.3390/electronics9040651
Chicago/Turabian StyleHonma, Naoki, and Kentaro Murata. 2020. "Correlation in MIMO Antennas" Electronics 9, no. 4: 651. https://doi.org/10.3390/electronics9040651
APA StyleHonma, N., & Murata, K. (2020). Correlation in MIMO Antennas. Electronics, 9(4), 651. https://doi.org/10.3390/electronics9040651