Article

LoRaWAN Networking in Mobile Scenarios Using a WiFi Mesh of UAV Gateways

by
Marco Stellin
1,2,3,†,
Sérgio Sabino
1,2,4,† and
António Grilo
1,2,4,*,†
1
Instituto Superior Técnico, Universidade de Lisboa, Av. Rovisco Pais, no. 1, 1649-004 Lisbon, Portugal
2
INESC-ID, Rua Alves Redol, no. 9, 1049-001 Lisbon, Portugal
3
MobileKnowledge, Carrer de Roc Boronat, 117, 08018 Barcelona, Spain
4
INOV, Rua Alves Redol, no. 9, 1049-001 Lisbon, Portugal
*
Author to whom correspondence should be addressed.
These authors contributed equally to this work.
Electronics 2020, 9(4), 630; https://doi.org/10.3390/electronics9040630
Submission received: 15 March 2020 / Revised: 29 March 2020 / Accepted: 5 April 2020 / Published: 10 April 2020

Abstract

:
Immediately after a disaster, such as a flood, wildfire or earthquake, networks might be congested or disrupted and not suitable for supporting the traffic generated by rescuers. In these situations, the use of a traditional fixed-gateway approach would not be effective due to the mobility of the rescuers. In the present work, a double-layer network system named LoRaUAV has been designed and evaluated with the purpose of finding a solution to the aforementioned issues. LoRaUAV is based on a WiFi ad hoc network of Unmanned Aerial Vehicle (UAV) gateways acting as relays for the traffic generated between mobile LoRaWAN nodes and a remote Base Station (BS). The core of the system is a completely distributed mobility algorithm based on virtual spring forces that periodically updates the UAV topology to adapt to the movement of ground nodes. LoRaUAV has been successfully implemented in ns-3 and its performance has been comparatively evaluated in wild area firefighting scenarios, using Packet Reception Ratio (PRR) and end-to-end delay as the main performance metrics. It is observed that the Connection Recovery and Maintenance (CRM) and Movement Prediction (MP) mechanisms implemented in LoRaUAV effectively help improve the PRR, with the only disadvantage of a higher delay affecting a small percentage of packets caused by buffer delays and disconnections.

1. Introduction

Over the past few years, the ubiquity of the Internet and the miniaturization of computational devices created a new paradigm called Internet of Things (IoT). In many cases, IoT devices are subject to very strict power constraints. For this reason, a new range of low power wireless communication protocols has been developed in order to support Low Power Wide Area Networks (LPWANs) [1]. These networks are formed by simple devices that communicate infrequently over long distances at low bitrates. Long Range (LoRa) is one of the most promising and versatile technologies enabling LPWANs. LoRa [2] is a narrowband modulation technique based on Chirp Spread Spectrum (CSS) modulation, a technology that achieves high robustness against channel degradation factors, such as path loss, multipath fading, shadowing and Doppler shift. By taking advantage of Spread Spectrum (SS), chirp orthogonality and the good propagation properties of the sub-GHz spectrum, LoRa provides communication over long distances, at the expense of the bitrate and of the maximum time interval between transmissions due to duty cycle limitations in the bands used by the protocol. Air time, power consumption and data rates can be controlled by different Spreading Factors (SFs) (7 to 12) and bandwidth (125 kHz or 250 kHz) combinations. The LoRa modulation is the core of the PHY and MAC of LoRa Wide Area Networks Protocol (LoRaWAN) [3].
Unmanned Aerial Vehicles (UAVs), popularly called drones, are flying vehicles that work without a human pilot onboard. The exclusive prerogative of the military for many years, UAVs are now commercially available at low prices, thus making them appealing for a wide variety of applications. Drones come in different shapes, but the most common are quadrotors and fixed-wing drones. In case of a disaster, such as a flood or a wildfire, UAVs can be used to support the rescuers, to localize the victims and to create a backhaul network when communication facilities are disrupted. UAVs provide many advantages compared to other solutions: movement in an obstacle-free environment, better overview of the area, Line of Sight (LoS) with targets and faster data acquisition in large areas. However, UAVs still have a limited flying range, autonomy and flying time. UAV swarms are increasingly being considered as a possible solution to provide radio coverage in a target area. Integrating UAVs and LPWAN protocols in disaster scenarios may offer a new cost-effective and energy efficient way to solve problems arising during the operations of the rescuers. In this paper, a challenging scenario was selected: support of wildfire combat operations. Wildfires affect rural or suburban areas where the coverage of conventional networks (e.g., cellular networks) is weak or absent, or vulnerable to the fire itself. UAVs can therefore be used to establish a relay network between the command post managing the operations and the firefighters, therefore providing situational awareness to the rescuers.
The mobility of firefighters represents a big challenge, since the UAV swarm has to maintain both area coverage and end-to-end connectivity to the Base Station (BS) of the command post. LoRaUAV, an UAV system based on LoRaWAN and Wireless Fidelity (WiFi), is designed to tackle these problems. Figure 1 shows a representation of the system architecture.
In LoRaUAV, firefighters carry Global Positioning System (GPS) enabled LoRaWAN tags, which are used to transmit their position, as well as biometric data. They may also deploy tactical LoRaWAN sensors, which may detect when the fire has reached some selected locations. Firefighter tags and ground sensors will be henceforth designated Ground Nodes (GNs).
In the target scenario, the LoRaWAN radio range is likely affected by additional attenuation due to terrain features and foliage. In the LoRaUAV system, a WiFi mesh network of autonomous UAV LoRaWAN gateways is dynamically deployed to provide LoRaWAN coverage during firefighting operations. This mesh of flying LoRaWAN gateways will receive the data from the GNs and relay it through WiFi to the command post, where the LoRaWAN Network Server resides. Since the WiFi technology presents a higher data rate, it allows the aggregation of traffic originated from a high number of GNs. On the other hand, its shorter range is somewhat compensated by the fact that communication between UAVs takes place in LoS.
Since GNs are expected to move, the UAV mesh must adapt its position and topology according to the GN movement patterns. In LoRaUAV, this is addressed by a topology control algorithm based on Virtual Spring Forces (VSFs). In order to solve the problem of disconnections due to disruption caused by continuous movement of GNs and transient UAV topology adaptation, a Connection Recovery and Maintenance (CRM) extension is proposed. A Movement Prediction (MP) extension is also proposed in order to make it easier to recover isolated GNs based on a combination of movement prediction and VSFs.
LoRaUAV has been successfully implemented in ns-3and its performance has been evaluated and compared with an existing VSF proposal by Di Felice et al. [4]. Packet Reception Ratio (PRR) and end-to-end delay were used as the main performance metrics. From the results, it can be concluded that the CRM and MP mechanisms implemented in LoRaUAV effectively help improving the PRR, with the only disadvantage of a higher delay affecting a small percentage of packets, which is caused by buffer delays and disconnections.
The main contributions of this paper are the following.
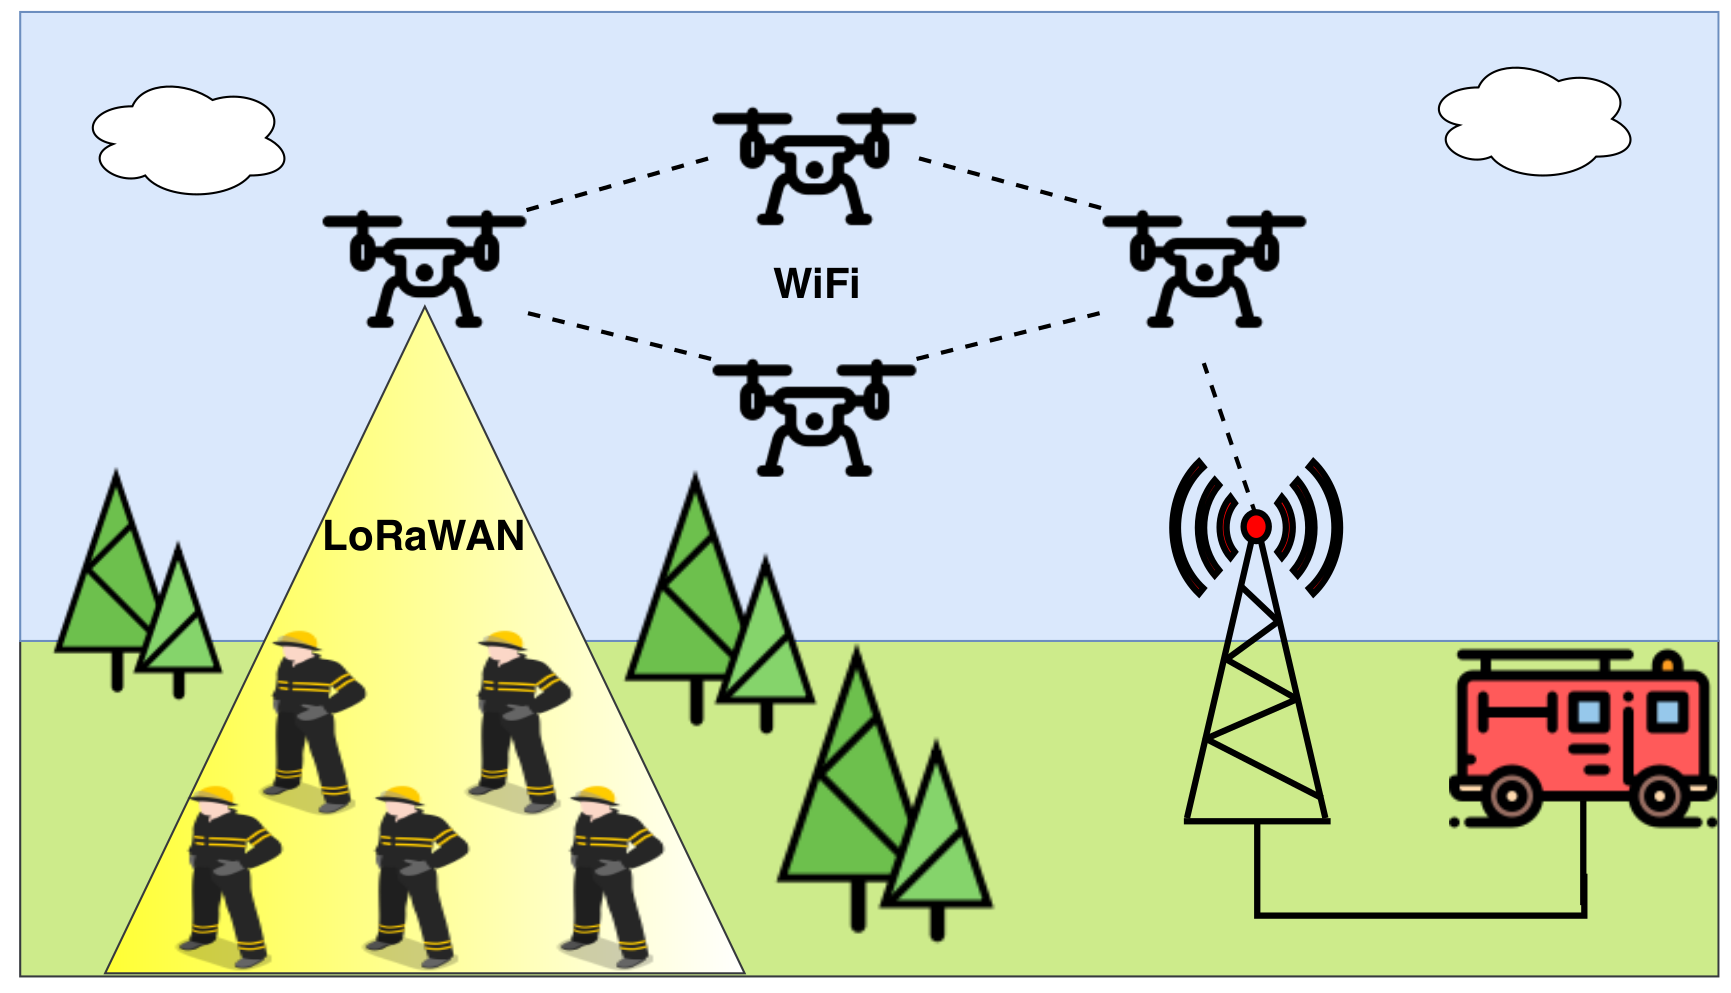
  • Proposal and comparative performance evaluation of a system providing LoRaWAN coverage in wild area firefighting operations by means of a WiFi mesh of UAV gateways.
  • Novel CRM and MP extensions to VSFs topology control, which are shown to significantly improve the performance of this kind of mechanism.
  • Novel mobility model of wild area firefighting scenarios considered in the performance evaluation.
The rest of this paper is organized as follows. Section 2 presents a review of the related works. Section 3 presents LoRaUAV and its main algorithms and explains the main design choices. Section 4 presents the developed simulation model. Section 5 presents the simulation results to evaluate all the algorithms. Finally, conclusions are reported in Section 6.

2. Related Work

Establishing a relay wireless ad hoc network of UAVs comes with a set of non trivial problems: how to optimally place the UAVs in a 3D environment, and how to plan the movement of UAVs to avoid collisions while reaching the target objective? A problem that frequently arises is the connectivity versus coverage problem. In an ideal situation, the mesh network should provide the maximum possible coverage, while at the same time it should maintain the connectivity between its members. Unfortunately, due to the limited available resources (i.e., number of UAVs), a compromise between both requirements is typically needed. The algorithms that have been developed to tackle the aforementioned problems fall in two main categories: centralized and distributed. Centralized algorithms rely on one single entity having full knowledge and control of the nodes forming the network. This approach typically produces close to optimal results when the location information is timely and reliable, but suffers from the single point of failure problem and, if the dimension of the problem is big enough, location information dissemination and the amount of computations can generate substantial delays. Mixed integer programming [5], evolutionary algorithms [6,7] or potential fields [8] are typically used. On the other hand, distributed algorithms provide less optimal solutions, but computations are typically simpler, based on local information distributed among the nodes, thus making the network more responsive and resilient in case of unexpected changes. Most of the existing distributed algorithms adapt concepts coming from physics or natural animal behavior. Such is the case of VSF approaches like the one presented in this paper. Consequently, this section will focus on distributed approaches proposed so far.
Basu et al. [9] propose a flocking based system, where UAVs self-organize to follow military units deployed and moving on the ground. The main purpose is to minimize the number of allocated UAVs in comparison with a full area coverage scheme. Fixed wing UAVs are assumed, with a constraint being considered on the maximum turn angle. A state machine with four states is proposed, which runs independently in each UAV, leading to an emergent flocking behavior. The state machine defines when the UAV should be repelled or attracted by its neighbors depending on mutual distance, when to approach the centroid of ground nodes within range, or when to randomly walk to find positions where more ground nodes are covered. The results show that the UAVs are able to follow and effectively cover the ground nodes when they move, though performance is clearly better when ground node movement is local and takes place within a constrained area.
Goddemeier et al. [10] consider a distributed decision approach to maintain a coherent mesh network of UAVs with the objective of exploring a 3D area. The swarm has also the additional requirement of keeping the connectivity to a ground base station. Two scenarios are studied by the authors: one in which the connectivity to the base station is permanent (Bounded Relaying) and one in which some disconnections are allowed for the purpose of extending the exploration (Release and Return). Each UAV in the network has the ability of self-selecting a different role, depending on the topology of the network: Scout Agents (SA) are assigned the task of exploration and sensing, Relay Nodes (RN) keep the communication between one or more UAVs and the base station, Articulation Points (AP) link two clusters that otherwise would be fragmented and Returnees (R) are drones that, in a Release and Return scenario, return to regain connectivity after being detached from the network. In order to maintain mesh connectivity, the authors propose a communication-aware algorithm based on virtual potential fields called Communication Aware Potential Fields (CAPF). According to this algorithm, each UAV is subject to a virtual force
F d i r = F c o n n + F A P + F C A ,
where F c o n n is the force that keeps a UAV connected to its neighbors, F A P is the force that keeps a SN in the range of an AP or a RN, and F C A is the repelling force that keeps the UAV away from obstacles (i.e., other UAVs). The magnitude and direction of each force are determined by the strength of the communication between each pair of UAVs, measured by the RSSI. F c o n n is calculated as follows:
F c o n n = k = 1 d F c o n n k ,
F c o n n k = q | Δ R S S I | d 0 k .
For each UAV, the d neighboring UAVs with the best connections are chosen. For each pair, F c o n n k is computed. Δ R S S I measures how far the current RSSI ( R S S I c u r r ) is from the maximum RSSI ( R S S I m a x ) or minimum RSSI ( R S S I m i n ) threshold, while d 0 k is the normalized directional vector between the two UAVs, and q determines if the force is attractive or repulsive. If R S S I c u r r is above R S S I m a x , the force is repulsive, while if it is below R S S I m i n , the force is attractive. The force is zero only when R S S I c u r r is between R S S I m i n and R S S I m a x . The resulting force F d i r gives the direction in which the UAV has to move in the current time step.
Di Felice et al. [4] propose a distributed algorithm based on VSFs to give coverage to a set of isolated GNs. The mobility of UAVs is subject to three rules: connectivity of the aerial mesh must be preserved, QoS of the links must be guaranteed and the covered GNs must be preserved. These requirements are obtained by moving each UAV according to a virtual force R given by the sum of the spring forces associated with each wireless link established by the UAV. Each force is computed as follows:
F = k · δ ,
where k is the stiffness of the spring and δ is its displacement, computed as a function of the link budget L B ( i , j ) measuring the quality of the wireless link ( i , j ) . For Air-to-Air (AtA) links, k is a fixed parameter. For Air-to-Ground (AtG) links, k is dynamic and defined as follows:
k A t G = n i m a x ( n j ) j N e i g h i .
UAVs connecting more GNs oppose more resistance to movements that might reduce the number of covered nodes. At each time step Δ T , the resulting force R is computed for each UAV and then, if the force magnitude is above a certain threshold, the UAV moves with constant speed in the new direction. An exploration phase is also triggered each T s c o u t seconds. All UAVs with no other UAV in their visibility zone become scout nodes with probability p S C O U T and an attractive spring force is computed between them and the center of the least visited cell. In [11], the authors perform a comparison with a centralized optimization scheme, which concludes that the distributed algorithm can achieve a performance that is similar to the centralized one.
Reynaud et al. [12] propose a virtual force based scheme in a scenario of detection and location of vespa velutina. As pursuit UAVs move away from the control node to pursue vespa velutina individuals, relay UAVs form a communication chain that provide multihop connectivity to pursuit nodes. Within a communication chain, distances between each two neighbors determine if the force between them is attractive, friction or repulsive, in order to keep the chain connected. A development of this scheme is proposed in [13] to provide area coverage in zones where the network infrastructure is damaged or non-existent. The concept of communication chain is now applied between a source and a destination of data. Besides the already mentioned attractive, friction and repulsive forces, relay UAVs are now subject to alignment forces, which seek to straighten the communication chains, making them as coincident as possible to the line segment that connects the source and the destination nodes. This will make the chain more efficient by minimizing the number of nodes. According to the proposed scheme, the UAVs that do not belong to a chain become survey UAVs moving randomly to locate potential source and destination nodes. The authors do not address the problem of topology management under multiple simultaneous source-destination pairs. For example, they do not consider fusing or gluing together closely located or crossed chains in order to minimize the overall number of relays. They also do not explain how relays are assigned to chains when there are multiple possibilities.

3. The LoRaUAV System

The objective of LoRaUAV is to provide coverage to mobile GNs using a fleet of UAVs, whose purpose is to relay the collected data to a BS through an ad hoc network established between its members. Each UAV must be able to adjust its position to reflect the changing topology of the GNs and, at the same time, maintain connectivity with the BS. Disconnections, although difficult to avoid, must be minimized, and recovery measures must be set up to recover the connectivity. LoRaUAV provides mechanisms to tackle all these problems. Some assumptions are made:
  • All UAVs fly at the same altitude in a 2D plane;
  • All UAVs can move with constant speed in any direction;
  • UAVs periodically exchange their position and the list of covered GNs with their neighbors;
  • UAVs have access to the received power of neighboring UAVs and GNs or can estimate it based on their position;
  • The position of the BS is known by all UAVs;
  • The minimum data rate (and hence maximum SF) acceptable for each LoRaWAN link is a configuration parameter.

3.1. Architecture

The architecture of LoRaUAV consists of a two-layer system: the first layer is composed of GNs that transmit data using LoRaWAN, while the second layer is composed of a swarm of relay drones communicating over an WiFi ad hoc network. LoRaUAV is composed of three entities: GNs, UAVs and a BS. GNs are equipped with devices that aggregate data coming from various sensors and transmit it using a LoRaWAN module. The UAVs must be equipped with all the necessary sensors, controls and software for navigation and stabilization, e.g., speed meters and accelerometers. We assume that drones already come with all the necessary components and with a software API to interact with them. The UAVs considered in this work are multi-rotors able to hover over a location or target. The UAVs carry a module that integrates a LoRaWAN Gateway (GW) chip and a WiFi chip supporting ad hoc communications. End-to-end packet delivery over WiFi is accomplished thanks to a traditional TCP/IP stack, with the assistance of a proactive MANET routing protocol. The module also contains a relay application, responsible for adapting LoRaWAN packets received by the GW, and sending them over the ad hoc network to the destination. The most important part of the system is the VSF distributed mobility algorithm, responsible for planning the movements of the drone according to virtual spring forces on the basis of parameters collected from the GPS, routing tables and messages exchanged with GNs and other UAVs. Therefore, the algorithm needs to interface with almost all UAV systems. The BS contains the same WiFi equipment as a UAV, runs the same MANET routing protocol and integrates a LoRaWAN Network Server (NS) to manage the network. Other LoRaWAN entities (Application Servers (ASs) and Join Server (JS)) can be placed anywhere provided that a form of network connectivity is available (e.g., satellite or terrestrial link).

3.2. VSF Mobility Algorithm

LoRaUAV implements a force-based distributed mobility algorithm that can push or pull an UAV closer or further from other UAVs or GNs. In this way, UAVs are kept within communication range of each other, collisions are avoided and the objective of covering the GNs is pursued. The implemented VSF algorithm is an adapted version of the algorithm described by Di Felice et al. in [4]. Modifications affect the weights of AtA and AtG forces. The algorithm runs at fixed regular intervals Δ T . At each time step, each UAV generates a set of virtual springs, having one end attached to the UAV that generated them, and the other end attached to either a GN (AtG spring) or another UAV (AtA spring). For each spring, the force F i j between node i and node j is calculated as follows:
F i j = K · ( L B i j L B r e q ) x ,
where K is a proportionality factor, L B i j is the real or estimated link budget between node i and node j, and L B r e q is the required link budget. Link budget measurements give a better indication of the quality of the link and allow to better select the parameters according to application-specific QoS requirements. The total force F t o t i applied to UAV i is:
F t o t i = j = 0 N F i j ,
where N is the number of springs originating from UAV i. AtG springs are established with all the GNs that have sent to the UAV at least one update in the last t A t G seconds. AtA springs, instead, are established with any one-hop neighboring UAV. AtA and AtG springs are only established with direct neighbors, thus lowering the computations and the complexity of the interactions. The K parameter is fundamental to determine the weight and priority of each spring force F i j . For AtA springs, K is updated according to the following expression:
K A t A = K p N n e i g h s m a x n n e i g h s ,
where K p > 0 is a scaling factor, N n e i g h s m a x is the maximum expected number of neighboring UAVs and n n e i g h s is the current number of neighboring UAVs. Equation (8) allows to scale the magnitude of the AtA forces on the basis of the relative number of neighboring UAVs. In this way, UAVs with few neighbors have a higher tendency to stick to the formation, while UAVs with many neighbors exhibit the opposite behavior, therefore assigning more relevance to AtG springs. A good value of N n e i g h s m a x typically resides in the interval [ 6 , 8 ] , since UAVs tend to arrange themselves in hexagonal grid formations when subject only to AtA forces. If the number of drones is small, N n e i g h s m a x can be approximated with the total number of UAVs. The K parameter takes a different value at each time step for each AtG spring attached to GN j:
K A t G j = u m a x u j ,
where u m a x is the highest number of neighboring UAVs sharing one or more covered GNs and u j is the current number of UAVs covering GN j. This relation gives more priority to the GNs that are covered by less UAVs, and drones are therefore expected to distribute themselves uniformly between the GNs that are in range.

3.3. Connection Recovery and Maintenance (CRM) Algorithm

In LoRaUAV, partitions of the UAVs are difficult to avoid. Disconnections might be caused by difficult environmental conditions or by one or more UAVs that go too far from nearby UAVs due to strong attractive forces. Some mechanisms are therefore integrated in the system to recover the connectivity with the UAV formation and with the BS. After the connection to the BS is recovered, a connection maintenance procedure is triggered. Figure 2 shows the developed CRM algorithm. The CRM algorithm has three mobility modes: the VSF mobility described in Section 3.2, the Network Recovery Mobility (NRM), which consists in moving the drone towards the BS to recover the connection, and the Stationary Mobility (SM), which forces the drone to hover over a location. The pause and persist parameters are used to select the mobility mode. The pause parameter is a positive integer that specifies for how many time intervals the UAV has to remain stationary. When a connection with the BS is recovered thanks to the NRM, the SM is activated and kept active for p a u s e × Δ T time intervals in order to avoid further disconnections. Every UAV sets pause according to the following expression:
p a u s e = P m a x R m a x D B S ,
where P m a x is the maximum number of pause intervals, R m a x is the maximum communication range and D B S is the current distance from the BS. R m a x is updated progressively thanks to the position information periodically exchanged with neighboring UAVs. Equation (10) assigns a more conservative behavior to drones that are closer to the BS and therefore more likely to cause the disconnection of a larger part of the network. On the contrary, peripheral UAVs can act more freely, since their temporary disconnection is less likely to cause the partition of other parts of the network. The pause parameter is ignored only when the load parameter is zero. This parameter measures the number of relayed packets during a time window of fixed length t l o a d and it can therefore be used to select inactive UAVs free to move without the constraints imposed by the CRM algorithm. The persist parameter is a positive integer that specifies for how many time intervals the UAV has to keep using the VSF mobility even without a connection to the BS, with the hope that a connection can be recovered thanks to the rearrangement of other UAVs. The persist parameter is set according to the following expression:
p e r s i s t = ( h o p s 1 ) D B S R m a x ,
where h o p s is the last recorded hop distance between the UAV and the BS. Equation (11) allows peripheral UAVs to be dragged by VSF forces for a longer time, even if they are isolated. On the contrary, UAVs closer to the BS are less tolerant to disconnections and try to recover a connection faster. It is possible that a group of UAVs, sharing some covered GNs, gets isolated from the swarm. In this case, the typical persist behavior would not exploit the redundant UAVs to recover the connectivity. Instead, all the UAVs would trigger the NRM at almost the same time and all would loose the connection with the covered GNs. To avoid this situation, UAVs that are covering a set of GNs determine, after loosing the connection, the neighboring UAV with which they share the highest percentage of GNs. If this percentage is above a certain threshold p s h a r e d , one of the two UAVs is redundant. Every UAV has a fixed ID that has been assigned before the operation. The UAV with the lowest ID among the two cuts by half its persist intervals, while the other UAV doubles those intervals. In the next time steps, the UAV with the lowest value of persist triggers the NRM before the others and repositions itself closer to the BS. This helps to recover a connection with the UAV swarm without loosing the GNs.

3.4. Movement Prediction (MP) Algorithm

The MP algorithm is a solution to recover isolated GNs based on a combination of movement prediction and virtual forces. This last characteristic allows to easily integrate the solution in the system and to preserve the simplicity of the LoRaUAV distributed approach. The algorithm is based on entities called holograms, whose purpose is to signal to UAVs the estimated position of isolated GNs. A hologram contains a pair of spatial coordinates that can be used to compute a virtual AtG force between the hologram itself and other UAVs. Since GNs are moving, the information about their last known position is not enough to create useful holograms. However, if GNs keep a regular direction and speed for some time, the future position of GNs can be predicted from previous recorded positions and the hologram location can be updated accordingly at each time step. In LoRaUAV, the prediction is based on simple kinematic rules. In order to estimate the kinematic rule parameters, the algorithm uses the GN position updates. The time must thus be treated as a sequence of discrete time steps. If we consider a GN i at time t, its future coordinate x i ( t + 1 ) is:
x i ( t + 1 ) = x i t + v i t x + 1 2 a ^ i t x · Δ t ,
where v i t and a ^ i t x are respectively the velocity at time t and the expected variation of velocity (acceleration) within the update time interval Δ t . The latter also corresponds to the interval between t and t + 1 . As will be seen in Equation (13), v i t is computed as the difference between x i t and x i ( t 1 ) . As such, it already corresponds to the displacement within Δ t . The computation of all the necessary variables is based on the finite difference method and only requires the knowledge of the three most recent positions of a node, so that:
v i t x = x i t x i ( t 1 ) v i ( t 1 ) x = x i ( t 1 ) x i ( t 2 ) v i ( t 2 ) x = x i ( t 2 ) x i ( t 3 ) ,
a ^ i t x = a i ( t 1 ) x + Δ a i ( t 1 ) x · Δ t Δ a i ( t 1 ) x = a i ( t 1 ) x a i ( t 2 ) x Δ t a i ( t 2 ) x = v i ( t 1 ) x v i ( t 2 ) x Δ t a i ( t 1 ) x = v i t x v i ( t 1 ) x Δ t ,
It should be noted that, as expected, velocity and acceleration are still related as follows:
v i ( t + 1 ) x = v i t x + a ^ i t x · Δ t ,
A similar reasoning applies to coordinate y i . In the current version, in order to simplify the problem, only GNs with constant velocity are considered, so that only the two latest positions, separated at most by t r seconds, are required. UAVs are responsible for keeping track of lost GNs (in the last t l o s t seconds) and for sending to other UAVs the information needed to predict the location of holograms: the last known position of a GN, its velocity vector and the time of its latest recorded position. This information is included in a message called token, sent in unicast to every UAV in the routing table. A hologram is created for each token and an expiration timer t e x p is attached to it. To avoid disruptions of AtA and AtG forces, only UAVs that are inactive ( l o a d = 0 ) are influenced by hologram forces. To reduce the amount of exchanged tokens, lost GNs can be first clustered in groups using a clustering algorithm. In LoRaUAV, k-means [14] is used for clustering and k-means++ [15] is used to initialize the centroids and speed up the convergence. The k-means algorithm is run multiple times with different values of k, with k ranging from 2 to k m a x , and the quality of the clustering is then assessed through the average silhouette index, a metric that measures the similarity among members of the same cluster and their dissimilarity from members of other clusters. The silhouette s ( i ) of the data point i is calculated as follows:
s ( i ) = b ( i ) a ( i ) max { a ( i ) , b i } ,
where a ( i ) is the average distance of i from the members of its own cluster and b ( i ) is the lowest average distance of i from the members of neighboring clusters. The index gets values in the interval [ 1 , 1 ] . Values closer to 1 indicates that the data point i belongs to a good cluster. Data points belonging to a cluster with only one point have a silhouette value of zero. The average s a v g of all s ( i ) is compared to the minimum threshold s t h r to assess the overall quality of the clustering. If no good clustering is found, all lost GNs are assigned to a single cluster. A token is created for each cluster and sent to the other UAVs. The token contains the center of mass, the average velocity and the time of the most recent update of each cluster.

4. Simulation Model

The LoRaUAV system was developed and evaluated using the ns-3 [16] network simulator. ns-3 has been chosen for its modular architecture, its speed and for its support of all the protocols that are part of LoRaUAV, including modules for simulating LoRaWAN networks. Of the available LoRaWAN modules for ns-3, the one developed by Magrin et al. [17] has been chosen. The main modeling choices are described in this section. The LoRaUAV model developed for this paper is available at the following link: https://github.com/marcostellin/ns3lorauav.

4.1. Channel Propagation Models

AtA links are modeled with a Friis propagation model. It is assumed that the monitored area is flat and no obstacles are present in the LoS of the UAVs at any moment. Since UAVs operate several meters above the ground, the LoS assumption is acceptable. Under these conditions, the Friis propagation model represents a reasonable choice [18]. The path loss P L in dB is therefore computed as follows:
P L = G t + G r 10 · log ( 4 π d ) 2 L λ 2 ,
where G t and G r are antenna gains in dBi, λ is the wavelength in meters, d is the distance between the transmitter and the receiver in meters and L is the system loss. G t and G r are set to 0 (omnidirectional antennas) and L is set to 1.
In the considered scenario, GNs move in an environment rich of vegetation. Under these conditions, the LoS between GNs and UAVs is not guaranteed at all times, and foliage and trunks produce considerable absorption, scattering and diffraction. In this work, the AtG channel is modeled with a Log Distance path loss model described by the following equation:
P L = L 0 + 10 · n · l o g 10 d d 0 ,
where n is the path loss exponent, d is the distance in meters from the receiver, and d 0 and L 0 are respectively the reference distance and the reference loss for d 0 . These parameters are estimated from the LoRaWAN RSSI measurements obtained in a forest environment and collected by Iova et al. in [19] ( L 0 = 32.22 dbm, n = 5.2 , d 0 = 1 m). The path loss exponent value abstracts the range limitations imposed by fading and shadowing effects. The authors show that a significant range drop is expected when LoRaWAN is used in environments with thick vegetation, even if high SFs are used. The implemented model gives a worst-case estimation of the LoRaWAN expected range that agrees with the real experimental measurements in [19].

4.2. Firefighters Mobility Model

The VSF algorithm adapts the topology of the UAV swarm according to the movements of GNs. To validate the performance of the developed algorithm, it is therefore necessary to assign a suitable mobility model to the GNs. Given the considered application, GNs must act similarly to firefighters during a wildfire operation. To the best of our knowledge, no mobility model has ever been created for this situation and therefore a new one has been developed based on information collected from [20] and [21]. An approximation of this behavior has been implemented. According to this model, each GN i is assigned to a team j, with j = 0 , 1 , 2 . . , N . Teams can be placed anywhere in the simulation area, which is assumed to be an S × S square. The whole area is divided vertically in N columns of equal width, one for each team, and each column is in turn split horizontally in R j equal width rows, with R j given by:
R j = S / d r j ,
where d r j is the retreat distance of team j. At this point, every team has an assigned vertical stripe with R j cells. At t = 0 , each team selects a random point in the furthest cell from the origin of the scenario in its assigned stripe and moves towards it with constant speed until the destination is reached. At this point, the team members start moving independently and randomly for a certain amount of time t r w (deterministic or random) in a rectangular s j x × s j y operation area. When time is over, teams select a new point in the second furthest cell and repeat the previously described process. Teams stop moving when the simulation is over or when they have visited all the cells in their column. This model tries to mimic the progress of a wildfire and the consequent retreat of firefighters to fallback areas where new attacks to the fire are attempted. A representation of the model is shown in Figure 3.

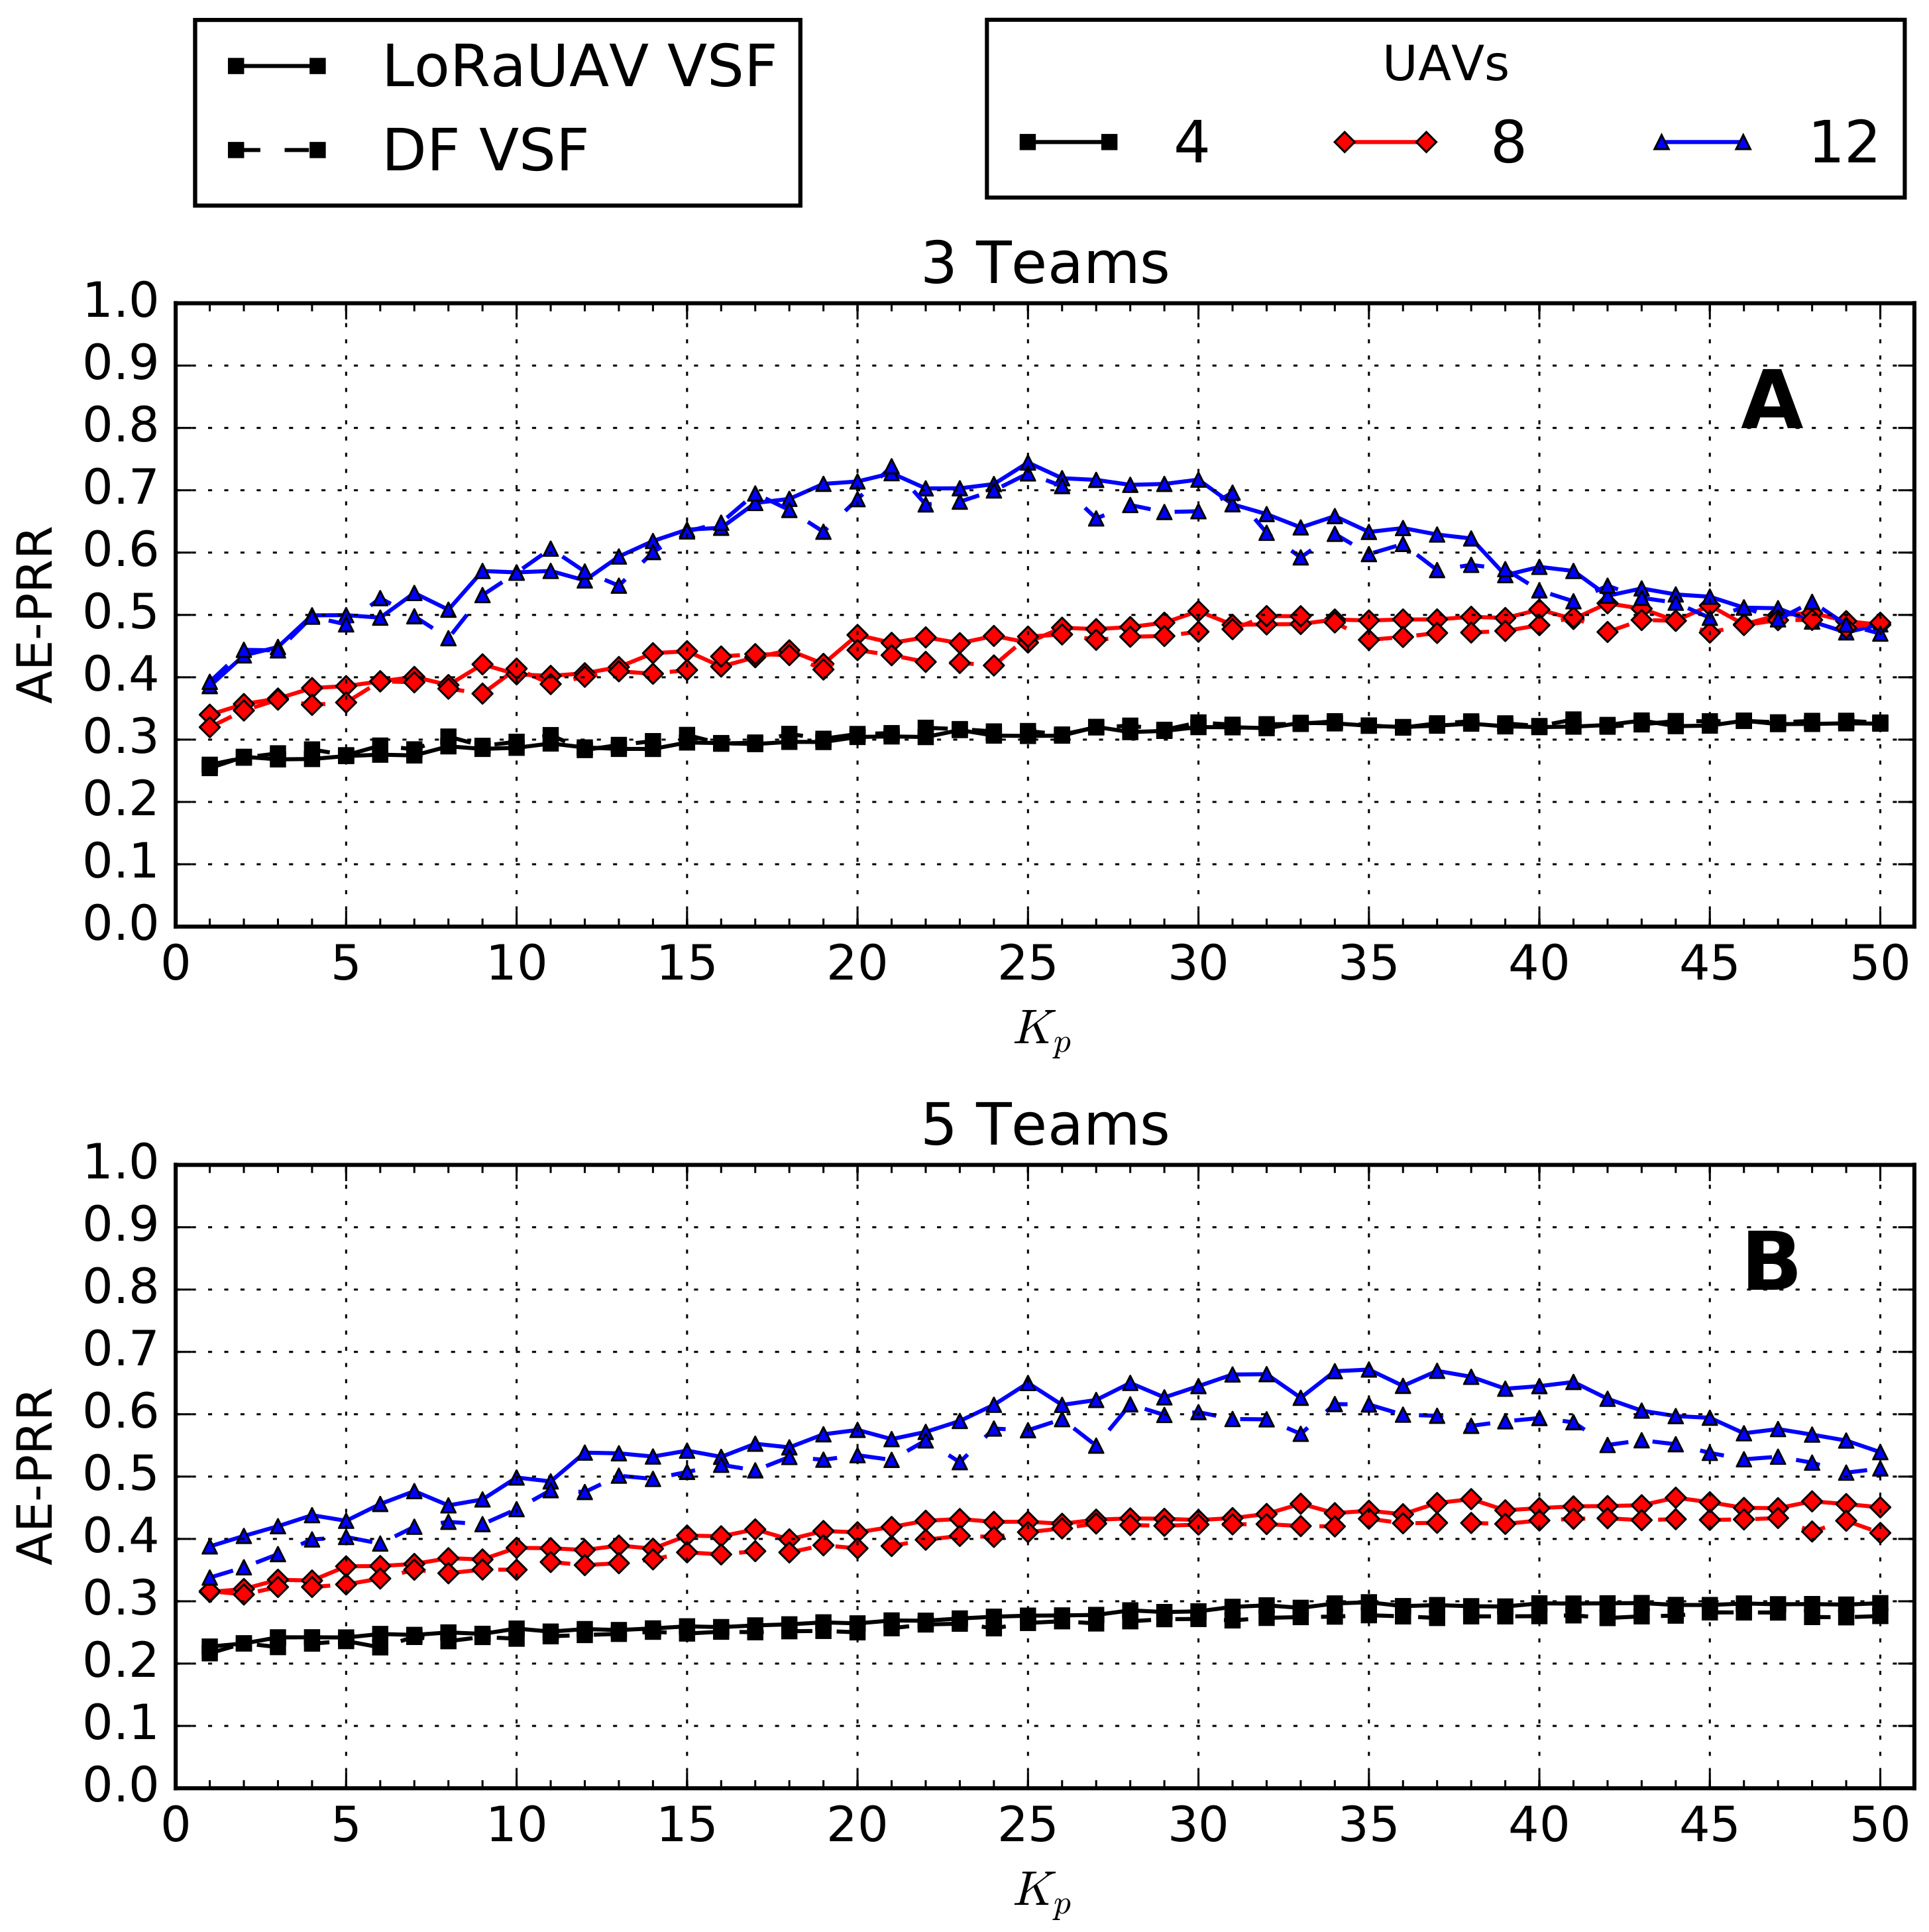
5. Simulation Results

An incremental evaluation of the algorithms has been made. All fixed parameters are reported in Table 1. As the objective is to evaluate the performance of the UAV topology control algorithms, the spreading factor of LoRaWAN was fixed to SF7, the worst case, resulting in the shortest AtG communication range. The routing algorithm used in the UAV mesh is Optimized Link State Routing Protocol (OLSR) [22]. The main evaluation metrics are the Average End-to-End Packet Reception Ratio (AE-PRR) and the Average Total Delay (ATD). The first metric measures the average PRR of unique packets at the BS, while the second metric measures the average end-to-end delay, including the buffer delay of uplink packets. Averages consider 100 runs of the same scenario (seed in [ 0 , 99 ] ). The 95% confidence interval is also computed assuming a Student’s t-distribution of the population. The default simulation parameters are reported in Table 2.
A higher value of the K p parameter favors the compactness of the aerial mesh, reducing the disconnections. However, it reduces the coverage. K p should therefore be optimized in each scenario to achieve the best compromise between the desired coverage and delay. This optimization is relegated to future work. In the presented simulation results, K p is treated as an independent variable.

5.1. Comparison of LoRaUAV VSF and DF VSF Algorithms

A comparison between the LoRaUAV VSF algorithm (see Section 3.2) without extensions, and the VSF algorithm described by Di Felice et al. [4] (DF algorithm) has been performed. Before starting the analysis, it must be clarified that the K p parameter coincides with the proportionality factor of K A t A in the LoRaUAV VSF algorithm and it coincides, instead, with K A t A itself in the DF VSF algorithm. An AE-PRR comparison between the two algorithms is shown in Figure 4 for a scenario with three and five teams of GNs. For clarity, the confidence interval is not shown. It is possible to notice that the AE-PRR of both algorithms follows approximately the same trend for all configurations, presenting the same regions of increase and decrease and the same range of optimal values. However, the AE-PRR produced by the LoRaUAV VSF algorithm seems slightly better than the one generated by the DF VSF algorithm for most K p values. To verify this hypothesis, the curves generated by the two algorithms have been compared by computing the point by point euclidean distance between them for each configuration. On average, LoRaUAV produces an AE-PRR increment which lies between 0.03% and 4.6% independently of the value of K p that is used. The developed VSF algorithm produces more benefits when a large number of teams is deployed (e.g., five teams). However, for most K p values, improvements fall inside the confidence interval of the DF VSF algorithm. It is therefore not possible to assert that the LoRaUAV VSF algorithm performs better in general. In fact, changing just the weights of the forces is not by itself sufficient to achieve a significant AE-PRR increase. Nevertheless, even if small and limited to particular configurations, the improvements introduced by the developed algorithm come at no significant additional cost, apart from a delay penalty affecting some packets and correlated with the higher PRR. As such, at this stage, basic LoRaUAV becomes at least validated in comparison with DF. Further comparison regarding the frequency and duration of disconnection times is provided in Section 5.4.

5.2. Study of the Impact of the CRM Algorithm

The CRM algorithm has been developed to increment the coverage provided by the UAV swarm, without adding more UAVs. In fact, the AE-PRR obtained with just the VSF algorithm is affected by a high percentage of lost packets. Depending on the application-specific QoS requirements, this might be a major drawback. It is shown that the CRM algorithm effectively improves the AE-PRR performance of the system in comparison with the basic LoRaUAV VSF algorithm operating alone.
In the first simulations, the size of the monitored area (2500 m of area side and 3000 s of simulation time) has been chosen specifically to favor CRM and hence to show its intent. A visual comparison of a sample scenario with three teams of GNs is plotted in Figure 5. In all the performed simulations, the CRM algorithm significantly improves the AE-PRR, with most of the increments lying between 14% and 26% (2–5 teams), but with peaks of more than 50% (one team). In absolute terms, the achieved AE-PRR is low. The ATD seems to be the QoS metric that is most negatively affected by the CRM algorithm, as shown in Figure 5B. However, a deeper analysis shows that the ATD metric is greatly influenced by a small number of packets with large delays. In fact, the CRM algorithm allows for more and longer disconnections in order to achieve a higher PRR. Some packets may therefore stay in the buffer for a long time before being sent. To prove this hypothesis, 10 individual simulations have been run for a scenario having 12 UAVs, three teams of GNs and K p = 25 . The total individual delays of all received packets have been recorded. The percentage of buffered packets more than doubles when the CRM algorithm is active (from ≈2–3% to ≈4–8%) and their permanence in the buffer increases drastically (from ≈15–34 s to ≈34–181 s). If buffered packets are not considered, the average experienced delay is ≈55 ms, a value that is far lower than the reported ATD values.
The second set of simulations has considered the more reasonable default settings in Table 2. The results are very encouraging, as concluded from the comparison between Figure 6A,B, where CRM significantly improves the performance of VSF, usually by more than 30%.

5.3. Study of the Impact of the MP Algorithm

The MP algorithm represents the last attempt of the system to recover a connection between the aerial mesh and the GNs that went out of range. For this reason, the PRR is used as the main evaluation metric. In order to increase the triggering chances of the MP algorithm, the firefighters mobility has been extended to support the splitting of teams. With this modification, a team can be configured to split in half during the simulation, so that an UAV that is covering alone a team of GNs is forced to create at least one hologram when half of the team eventually goes out of range. Given this modification, it is of particular interest to observe the behavior of the MP algorithm in two situations: a more conventional setting, where team splitting is not active, and in a more challenging setting where teams can split. The end-to-end PRR is collected individually for all the 100 runs of the same scenario and a direct comparison between corresponding runs of different scenarios is performed. The results of the comparison are reported in Table 3, considering three teams and 2500 m of area side and 3000 s of simulation time. The first observation is that the MP algorithm is not always beneficial to the system. In fact, a relevant number of runs shows a PRR that is, on average, even 7 % lower than the one achieved without the MP algorithm. The loss is more marked in scenarios in which teams do not split. This is caused by the fact that the strategy of recovering the connectivity with lost GNs is not always beneficial to the UAV formation since it does not follow any global optimality criteria. However, the simultaneous activation of the MP and CRM algorithms is beneficial in most of the situations. In fact, the average PRR undergoes a considerable increment in at least 66 % of the runs when teams do not split and 71 % of the runs when teams split. In some cases, the gain that is obtained is more than double of the loss observed in analogous scenarios without MP algorithm. When reverting to the default simulation parameters, the activation of the MP algorithm and of the CRM algorithm produces the results shown in Figure 6C. Even if small, the improvements allow to achieve AE-PRR levels above 0.9 with 12 UAVs and between 0.8 and 0.9 with 8 or 10 UAVs. Similar tests have been run for the VSF+MP configuration with no noticeable advantages.

5.4. Frequency and Duration of Disconnections

LoRaUAV is subject to the inevitable disconnection of some GNs. In this section, the frequency and duration of such disconnections is investigated and analyzed. The simulation parameters, which are reported in Table 4, were configured so that they fall within the default parameter ranges.
The simulation script has been adapted to periodically check the GNs that are covered by each UAV. This information is then used to compute, for each GN, the number and duration of disconnection periods. The results of 100 runs are aggregated and reported in this section. The total average disconnection time, computed as the average of the sums of all disconnection periods of all the performed runs, is reported in Table 5 for all the algorithms. It can be noted that, on average, the activation of the CRM and of the MP algorithms effectively reduces almost by half the total experienced disconnection time in comparison with both VSF algorithms. The VSF + CRM and the VSF + CRM + MP configurations perform almost identically. However, if we separate the total average disconnection times of the different teams, it can be seen that, while in the configuration with just the CRM, the average disconnection time is split almost equally among teams (≈4000 s), the configuration with the MP algorithm favors team 0 and team 1 (≈2200 s) at the expense of team 2 (≈7500 s ). A visual inspection of the runs where long disconnection periods are experienced showed that team 2 tends toward a region of the map that is more difficult to access for the aerial mesh. Disconnections of the other teams are solved earlier in the simulation, thanks to the MP algorithm. This leads the UAV mesh to steer towards the location of team 0 and team 1, thus making recovery of team 2 less likely. As already stated, the current version of the MP algorithm suffers from the lack of global optimality criteria that can better direct the connection recovery efforts.
The histogram of Figure 7 details the results for different combinations of algorithms. In order to better visualize the results, disconnection periods are grouped in bins of different lengths and colors are used to distinguish between different teams. The first observation that can be made is that all the algorithms are subject to partitions, so that GNs might get isolated even for long periods of time. This is particularly evident when the VSF algorithms are used alone. In fact, for both DF VSF and LoRaUAV VSF, the number of disconnections above 500 s constitutes a big share of the total experienced disconnections. In this regard, the DF VSF algorithm seems to experience less disconnections than the LoRaUAV VSF algorithm. This can be explained by the reduced coverage offered by the DF algorithm and the consequent presence of fewer but longer disconnection periods. In fact, a more in depth analysis of the disconnection periods larger than 500 s of the DF VSF algorithm reveals that several GNs remain isolated for more than 2500 s, while, with the LoRaUAV VSF, isolation periods are no longer than 2000 s, meaning that the mesh is able to cover the GNs for a longer time before loosing them definitely. Nonetheless, both VSF algorithms show low performances and a high chance of almost permanent isolation of GNs. This claim is supported by the low AE-PRR results obtained by the VSF algorithms in all the previous sections of this chapter. The CRM algorithm improves the situation. One first observation is that the algorithm is fairer towards teams. In fact, disconnection periods of the same duration are approximately uniformly distributed among teams. This is caused by a better average distribution of the UAV mesh. The second observation is that disconnections are more frequent if compared with the LoRaUAV VSF algorithm operating alone. However, disconnections are shorter and the number of disconnection periods above 500 s is reduced by ≈1000 units overall, with team 0 and team 1 experiencing the most marked improvements. This means that, albeit partitions are still possible, they either happen much later in the simulation or they are recovered sooner by the system. The introduction of the MP algorithm on top of the CRM algorithm gives some interesting results. First, the frequency of shorter disconnection periods increases in comparison with the results obtained with just the CRM algorithm, especially in the interval [ 0 , 30 ] seconds. This increase can be explained by the numerous connection recovery attempts, some of them successful, others only partially successful because the connection is lost again after some time. The disconnection periods above 500 s remains approximately the same obtained with the CRM algorithm, but with a huge disproportion towards team 2 members for the reasons already explained before in this section.

6. Conclusions

In this paper, a new system called LoRaUAV has been proposed. The objective of the system is to extend the coverage offered by a BS to a set of mobile GNs through UAV relay GWs. This is achieved thanks to a network that consists of a LoRaWAN segment for GNs-GW communications and a WiFi ad hoc network for GWs-BS communications. The core of the system is the distributed LoRaUAV mobility algorithm based on VSFs, designed to adapt the UAV swarm to the changing topology of GNs. The basic VSF mobility is expanded by the CRM and MP algorithms, designed, respectively, to increase the GN coverage through a better UAV distribution and to restore the connection of isolated GNs through movement prediction. The developed algorithms were evaluated through a ns-3 custom-built l o r a v s f module. Simulations were run on a model of a wildfire disaster scenario. The performance of each algorithm has been assessed through relevant QoS metrics: the average end-to-end PRR (AE-PRR) and the average delay (ATD). The LoRaUAV VSF algorithm has also been compared with another similar VSF algorithm proposed in the literature. It has been shown that basic LoRaUAV VSF achieves a small average AE-PRR improvement that affects only some values of K p , with more significant gains when 4 or 5 teams are deployed. The most significant AE-PRR improvements are obtained thanks to the CRM algorithm. In fact, the AE-PRR shows a double-digit increment in most of the tested configurations. The ATD is the metric that is more negatively affected, but long delays only affect a small percentage of packets. The synergy between the CRM and MP algorithms produces another AE-PRR improvement, particularly significant when teams split. The developed extensions to the basic VSF algorithm were also demonstrated to effectively help in reducing almost by half the isolation time of GNs.
Future evolutions of this work will consider the impact of LoRaUAV dynamics on the Adaptive Data Rate mechanism of LoRaWAN, dynamic K p optimization, more realistic UAV models, more sophisticated prediction algorithms (e.g., Kalman-based tracking), integration with centralized meta-heuristic optimization algorithms (e.g., [6]), downlink messages and the existence of multiple BSs.

Author Contributions

Conceptualization, M.S., A.G.; methodology, M.S., S.S., A.G.; software, M.S.; validation, M.S., S.S., A.G.; formal analysis, M.S., A.G.; investigation, M.S.; resources, A.G.; data curation, S.S., A.G.; writing–original draft preparation, M.S., S.S., A.G.; writing–review and editing, M.S., S.S., A.G.; visualization, M.S., S.S., A.G.; supervision, S.S., A.G.; project administration, A.G.; funding acquisition, A.G. All authors have read and agreed to the published version of the manuscript.

Funding

This work has been supported by Portuguese national funds through Fundação para a Ciência e Tecnologia (FCT) with reference UIDB/50021/2020, by Fundação Calouste Gulbenkian, and also by FITEC-Programa Interface, with reference CIT “INOV-INESC Inovação-Financiamento Base”.

Conflicts of Interest

The authors declare no conflict of interest.

References

  1. Raza, U.; Kulkarni, P.; Sooriyabandara, M. Low Power Wide Area Networks: An Overview. IEEE Commun. Surv. Tutor. 2017, 19, 855–873. [Google Scholar] [CrossRef] [Green Version]
  2. LoRa Modulation Basics. Available online: https://www.semtech.com/uploads/documents/an1200.22.pdf (accessed on 3 June 2018).
  3. LoRaWAN 1.1 Specification. Available online: https://lora-alliance.org/sites/default/files/2018-04/lorawantm_specification_-v1.1.pdf (accessed on 3 June 2018).
  4. Felice, M.D.; Trotta, A.; Bedogni, L.; Chowdhury, K.R.; Bononi, L. Self-organizing aerial mesh networks for emergency communication. In Proceedings of the 2014 IEEE 25th Annual International Symposium on Personal, Indoor and Mobile Radio Communication (PIMRC), Washington, DC, USA, 2–5 September 2014; pp. 1631–1636. [Google Scholar]
  5. Caillouet, C.; Razafindralambo, T. Efficient deployment of connected unmanned aerial vehicles for optimal target coverage. In Proceedings of the 2017 Global Information Infrastructure and Networking Symposium (GIIS), St. Pierre, France, 25–27 October 2017; pp. 1–8. [Google Scholar] [CrossRef] [Green Version]
  6. Sabino, S.; Horta, N.; Grilo, A. Centralized Unmanned Aerial Vehicle Mesh Network Placement Scheme: A Multi-Objective Evolutionary Algorithm Approach. Sensors 2018, 18, 4387. [Google Scholar] [CrossRef] [PubMed] [Green Version]
  7. Kim, D.; Lee, J. Integrated Topology Management in Flying Ad Hoc Networks: Topology Construction and Adjustment. IEEE Access 2018, 6, 61196–61211. [Google Scholar] [CrossRef]
  8. Almeida, E.N.; Campos, R.; Ricardo, M. Traffic-aware multi-tier flying network: Network planning for throughput improvement. In Proceedings of the 2018 IEEE Wireless Communications and Networking Conference (WCNC), Barcelona, Spain, 15–18 April 2018; pp. 1–6. [Google Scholar] [CrossRef]
  9. Basu, P.; Redi, J.; Shurbanov, V. Coordinated flocking of UAVs for improved connectivity of mobile ground nodes. In Proceedings of the IEEE Military Communications Conference (MILCOM), Monterey, CA, USA, 31 October–3 November 2004; pp. 1628–1634. [Google Scholar]
  10. Goddemeier, N.; Daniel, K.; Wietfeld, C. Role-Based Connectivity Management with Realistic Air-to-Ground Channels for Cooperative UAVs. IEEE J. Sel. Areas Commun. 2012, 30, 951–963. [Google Scholar] [CrossRef]
  11. Trotta, A.; Felice, M.D.; Bedogni, L.; Bononi, L.; Panzieri, F. Connectivity recovery in post-disaster scenarios through Cognitive Radio swarms. Comput. Netw. 2015, 91, 68–89. [Google Scholar] [CrossRef]
  12. Reynaud, L.; Guérin-Lassous, I. Design of a force-based controlled mobility on aerial vehicles for pest management. Ad Hoc Netw. 2016, 53, 41–52. [Google Scholar] [CrossRef]
  13. Reynaud, L.; Guérin-Lassous, I. Improving the Performance of Challenged Networks with Controlled Mobility. Mob. Netw. Appl. 2018, 23, 1270–1279. [Google Scholar] [CrossRef] [Green Version]
  14. Hartigan, J.A.; Wong, M.A. A k-means clustering algorithm. JSTOR Appl. Stat. 1979, 28, 100–108. [Google Scholar] [CrossRef]
  15. Arthur, D.; Vassilvitskii, S. K-means++: The Advantages of Careful Seeding. In Proceedings of the Eighteenth Annual ACM-SIAM Symposium on Discrete Algorithms, Society for Industrial and Applied Mathematics, Philadelphia, PA, USA, 7–9 January 2007; pp. 1027–1035. [Google Scholar]
  16. ns-3. Available online: https://www.nsnam.org/ (accessed on 21 September 2018).
  17. Magrin, D.; Centenaro, M.; Vangelista, L. Performance evaluation of LoRa networks in a smart city scenario. In Proceedings of the 2017 IEEE International Conference on Communications (ICC), Paris, France, 21–25 May 2017; pp. 1–7. [Google Scholar] [CrossRef]
  18. Khuwaja, A.; Chen, Y.; Zhao, N.; Alouini, M.S.; Dobbins, P. A Survey of Channel Modeling for UAV Communications. IEEE Commun. Surv. Tutor. 2018, 20, 2804–2821. [Google Scholar] [CrossRef] [Green Version]
  19. Iova, O.; Murphy, A.; Picco, G.; Ghiro, L.; Molteni, D.; Ossi, F.; Cagnacci, F. LoRa from the City to the Mountains: Exploration of Hardware and Environmental Factors. In Proceedings of the 2017 International Conference on Embedded Wireless Systems and Networks, Uppsala, Sweden, 20–22 February 2017; pp. 317–322. [Google Scholar]
  20. National Wildfire Coordinating Group. Wildland Fire Suppression Tactics Reference Guide; National Interagency Fire Center: Boise, ID, USA, 1996. [Google Scholar]
  21. Tymstra, C.; Flannigan, M. Living with Wildland Fire: What we Learned from the 2016 Horse River Wildfire. Available online: https://www.frames.gov/files/9615/1190/3222/2017_November_21_Alaska_Fire_Science_Consortium_webinar_Tymstra_Flannigan.pdf (accessed on 11 July 2018).
  22. Jacquet, P.; Muhlethaler, P.; Clausen, T.; Laouiti, A.; Qayyum, A.; Viennot, L. Optimized link state routing protocol for ad hoc networks. In Proceedings of the IEEE International Multi Topic Conference, Technology for the 21st Century, Lahore, Pakistan, 30 December 2001; pp. 62–68. [Google Scholar]
Figure 1. High level view of LoRaUAVsystem architecture.
Electronics 09 00630 g001
Figure 2. CRM algorithm.
Electronics 09 00630 g002
Figure 3. Firefighter team mobility model. Teams start from a starting point and go down to the furthest cell in their assigned column.
Electronics 09 00630 g003
Figure 4. Average End-to-End Packet Reception Ratio (AE-PRR) comparison when the LoRaUAV Virtual Spring Force (VSF) algorithm and the DF VSF algorithm are used in a scenario with three (A) and five (B) teams of 20 GNs.
Electronics 09 00630 g004
Figure 5. AE-PRR (A) and Average Total Delay (ATD) (B) comparison when the CRM algorithm is activated in a scenario with three teams of 20 GNs.
Electronics 09 00630 g005
Figure 6. AE-PRR with VSF (A), VSF+CRM (B) and VSF+CRM+MP (C) (no team splits) in scenario with the same parameters of Section 5.1.
Electronics 09 00630 g006
Figure 7. Frequency and duration of disconnections for DF VSF (A), LoRaUAV VSF (B), LoRaUAV VSF+CRM (C) and LoRaUAV VSF+CRM+MP (D).
Electronics 09 00630 g007
Table 1. List of fixed simulation parameters.
LoRaWANWiFi and Routing
GN Tx Power14 dBmPHY protocolIEEE 802.11g
ClassClass AModulationERP-OFDM
Bandwidth125 kHzFrequency2.4 GHz
Frequency868.1 MHzTx Power16.02 dBm
SF7Rx Sens.−99 dBm
GW Sens. (dBm)−124 (SF 7)Bitrate12 Mbps
Packet size10 bytesMANET protocolOLSR
Packet period30 s
VSF AlgorithmCRM Algorithm
Δ T 10 s P m a x 30
t A t G 40 s p s h a r e d 0.5
L B r e q 20 dbm t l o a d 3 min
MP AlgorithmFirefighter Mobility Model
t l o s t 3 min s j x j 300 m
t r 40 s s j y j 100 m
t e x p 10 min d r j U ( 50 , 250 ) m
k m a x 3 t r w 5 min
s t h r 0.6BS position ( S / 2 , 300 )
Table 2. Default simulation parameters.
N. of UAVs 4 , 8 , 12
N. of teams1-5
GNs per team20
Sim. Time2000 s
Area side2000 m
K p [ 1 , 50 ]
Table 3. Comparison between runs with VSF + CRM + MP and runs with only VSF + CRM.
No Split
UAVsRuns Avg MP PRR Gain/loss
Better w/ MPBetter w/o MP Better w/ MPBetter w/o MP
458%42% +2.1%−1.5%
653%47% +9.0%−7.1%
866%34% +13%−6.6%
1077%23% +15%−7.0%
1286%14% +18%−4.0%
Split
UAVsRuns Avg MP PRR Gain/loss
Better w/ MPBetter w/o MP Better w/ MPBetter w/o MP
478%22% +4.3%−2.4%
671%29% +8.9%−5.9%
869%31% +11%−5.8%
1078%22% +11%−5.2%
1291%9% +15%−1.9%
Table 4. Parameters used for testing the frequency and duration of Disconnections.
ParameterValues
Number of UAVs12
Number of teams3
GNs per team20
K p 25
Total simulation time3000 s
Simulation area 2000 × 2000 m
Table 5. Total average disconnection time and relative confidence interval obtained with different algorithm combinations.
AlgorithmTotal Average Disconnection Time (s)
DF VSF23,199 ± 3350
LoRaUAV VSF21,826 ± 2976
LoRaUAV VSF + CRM12,365 ± 2258
LoRaUAV VSF + CRM + MP11,876 ± 1600

