Article

A Simple Capillary Blood Cell Flow Monitoring System using Magnetic Micro-Sensor: A Simulation Study

Department of Electronics Engineering, Pusan National University, Busan 46241, Korea
*
Author to whom correspondence should be addressed.
Electronics 2020, 9(4), 618; https://doi.org/10.3390/electronics9040618
Submission received: 29 February 2020 / Revised: 28 March 2020 / Accepted: 3 April 2020 / Published: 6 April 2020

Abstract

:
Since blood flow is a physiologically important parameter in determining the state of the tissue (e.g., viability and activity), various blood flow measurement techniques have been developed. However, existing blood flow measurement methods require complex equipment to generate external energy sources to be applied onto the tissue. This paper describes a magnetic method for the simple and external source-free measurement of blood flowing throughout the capillary. A microcoil located near to the capillary captures the intrinsic magnetic field produced by flowing negatively charged blood cells (e.g., red blood cells and white blood cells) to induce the electromotive force (EMF). The velocity of blood cells is estimated using the time interval between adjacent peaks and the slope of the induced EMF. The direction of blood flow can also be determined based on the frequency shift of the induced EMF. When moving the microcoil in the same direction of the blood flow, the frequency of induced EMF decreases, whereas an increased frequency is observed when moving the microcoil in the opposite direction to the blood flow. Moreover, this method could detect and distinguish streams of red blood cells and white blood cells. These results support the feasibility of a non-invasive magnetic blood flow monitoring system that does not require any external power source applied to the blood stream and thereby alleviates the complexity of conventional blood flow monitoring systems.

1. Introduction

Since the blood contains nutrient, oxygen and other components for immune responses, blood flow reflects the physiological status of every cell affected by it. The measurement of blood flow provides important information when diagnosing diseases related to blood flow problems. Blood flow is also closely related to the neural activation, as the neuron demands oxygen when its activity increases [1]. Therefore, interest in blood flow measurement has evolved, and measurement techniques have been developed, which are classified by the type of energy source—for instance, optical, magnetic, and mechanical energy—applied to the blood vessel [2,3].
Measuring blood flow using optics has been widely employed due to its high spatial resolution [3]. Several measurement techniques have been developed, such as laser Doppler flowmetry and laser speckle contrast imaging. Laser Doppler flowmetry uses the frequency of light that has been scattered back from the blood stream to evaluate the flow of blood [4]. Incident light strikes the red blood cell (RBC) and is reflected back, undergoing a Doppler shift. Stationary surrounding tissue also reflects the incident light, but the reflected light does not undergo a Doppler shift. After extracting the Doppler shifted light, the intensity and the frequency shifts are used to estimate the number of moving cells and their velocity, respectively. Laser Doppler flowmetry, however, necessitates a scanner to get a full-field image [5]. On the other hand, laser speckle contrast imaging requires no scanner for the full-field imaging of blood flow, due to analyzing the full-field interference pattern reflected from the object [3]. Coherent light illuminates the medium and creates a random interference pattern called speckle. The movement of blood cells causes the speckle pattern to fluctuate in time, whereas the stationary medium preserves the original speckle pattern [6]. When the camera exposure time is longer than the speckle intensity fluctuation, vibrating speckle patterns are summed over time at the camera, resulting in the blurring of the speckle pattern. Hence, the degree of blurring of speckle patterns reflects the motion of the medium (e.g., blood) [7,8]. However, quantitative analysis of the velocity of the blood stream is very challenging for this technique [7].
Faraday’s law of induction states that electric charge exerts an electromotive force (EMF) when it moves along the direction perpendicular to the external magnetic field. Since blood is composed of electrically charged components, EMF is induced when an external magnetic field is applied to the blood vessel. Induced EMF is detected by the two electrodes located perpendicular to the applied magnetic field [9,10,11]. However, this method requires a magnetic coil that generates the magnetic field exerted on the blood vessel.
Two types of ultrasound-based blood flow measurement methodology have been developed. The first type measures the time required for the ultrasound wave to travel from the emitter to the receiver sensor [2]. Transit time increases as the ultrasound travels against the blood flow, whereas it decreases as the ultrasound travels with the blood flow. The second type is based on the flow-mediated Doppler shift in the vessel [12,13]. Ultrasound at a specific frequency traveling through the blood vessels undergoes a frequency shift depending on the velocity and the direction of flow.
Though they differ in detail, currently developed blood flowmetries monitor the blood flow response after applying external energy sources (e.g., mechanical, optical, and magnetic energy) requiring additional equipment to produce them. Hence, it would be ideal to remove the external energy source when measuring the blood flow. In this work, we measured the flow of individual blood cells (e.g., RBCs and white blood cells (WBCs)) without any externally applied source. Since blood cells have their own net electric charges, blood cells produce a magnetic field as they flow along the vessel. When placing a microcoil in such a way that the intrinsically generated time-varying magnetic field enters the microsensor, an EMF is induced at the microsensor. We modeled the microcoil and blood to analytically calculate the induced EMF at the microcoil. We also determined the direction of the blood stream by monitoring the frequency shift while moving the microcoil along the vessel. This work demonstrates a novel non-invasive magnetic method for microscopic blood flow monitoring without any applied source and would be an alternative simple tool for monitoring blood cell flow.

2. Modeling and Simulation

2.1. Analysis of the Magnetic Field Generated by Flowing Blood Cells

Blood contains blood cells and blood plasma. Blood cells can be classified as RBCs carrying oxygen and WBCs acting as a result of the immune response. Blood plasma, on the other hand, is a liquid component that carries and delivers blood cells and nutrients throughout the body. Since blood components are each comprised of their own electrically charged ions, blood cells and blood plasma have their own distinctive net ion charges and volume charge densities, respectively.
Based on the Biot-Savart law, a moving charged particle produces a magnetic field whose magnitude is proportional to the absolute electric charge of the particle and inversely proportional to the square of the distance between the point of measurement and the particle. Supposing that an electric charge of an RBC concentrates in the center of the RBC and moves along z-axis, the magnetic field produced at x and y is determined according to the following equation:
B ¯ ( x , y ) = ( 1 + χ m ) μ o 4 π q v ¯ × r ¯ r 2 = μ o 4 π q v × ( x x r b c ) 2 + ( y y r b c ) 2 × sin ( tan 1 ( y y r b c ) ( x x r b c ) ) ( x x r b c ) 2 + ( y y r b c ) 2 ,
where, μ o is the permeability in vacuum, v is the velocity of the RBC, q is the net charge of the RBC, χ m is the magnetic susceptibility, and x r b c and y r b c are the x and y locations of the RBC, respectively. All the simulations were implemented using MATLAB (MathWorks, USA).

2.2. Modeling of Capillary and Blood Components

We first calculated the net charge of RBCs and WBCs, specifically the lymphocyte. The cell is modeled as three serially connected capacitors C b i , C i , and C o reflecting a lipid bilayer and electrical double layers of intracellular and extracellular regions, respectively, which are connected to an equivalent resistor ( R E q ) and a voltage source ( V E q ) in parallel [14,15,16]. Since three serially connected capacitors are simplified as an equivalent membrane capacitance ( C R B C / W B C ), the net charge stored inside the cell is calculated by multiplying the C R B C / W B C and the transmembrane potential ( V R B C / W B C ) (Table 1). We found that the RBCs and WBCs have net charges of 1.5 × 10 11 [C] and 2.8 × 10 10 [C], respectively, which are stored inside the small cell volumes. For every ion of which the blood plasma is composed, valance ( z i o n ) and molar concentration ( c i o n ) were multiplied and summed to find the volume charge density. We found that blood plasma and RBCs have 2.1 × 10 3   [C/L] and 7.5 × 10 7   [C/L] volume charge densities, respectively (Table 1).
We modeled the blood vessel and blood cells flowing inside, whose dimensions are described in Table 1. We limited the blood vessel type to the capillary, so that blood cells flow one by one through it. We also assumed the shape of a blood cell to be a sphere (Figure 1a). We divided the capillary into series of base volumes, each having a thickness of 1 μm, and the electric charge inside the base volume was calculated. As seen in the Figure 1b, blood plasma exhibits a base charge of 1.2 × 10 10 [C], while the electric charge decreases to 3.3 × 10 11 [C] when it reaches RBCs.

2.3. Modeling of the Microcoil

We designed a coil to have a diameter and number of turns of 25 μm and 50, respectively. An iron core whose relative permeability is 2 × 10 5 is located at the center of the microcoil. Since the magnetic field is generated in a circular direction from the capillary, the microcoil is located perpendicular to the capillary in such a way that the microcoil receives the maximum magnetic field (Figure 1c). Due to the time-varying magnetic field produced by the moving blood cells, an EMF is induced at the microcoil, whose magnitude is described as:
ε = N d Φ B d t = N d ( B × A ) d t ,
where N is the number of turns of the microcoil, Φ B is a total magnetic flux entering the microcoil, B is the magnetic field, A is the area of coil opening, and t is the time.

3. Results

3.1. Blood Flow Measurement

3.1.1. An Inductively Coupled Magnetic Sensor for Velocity Measurement

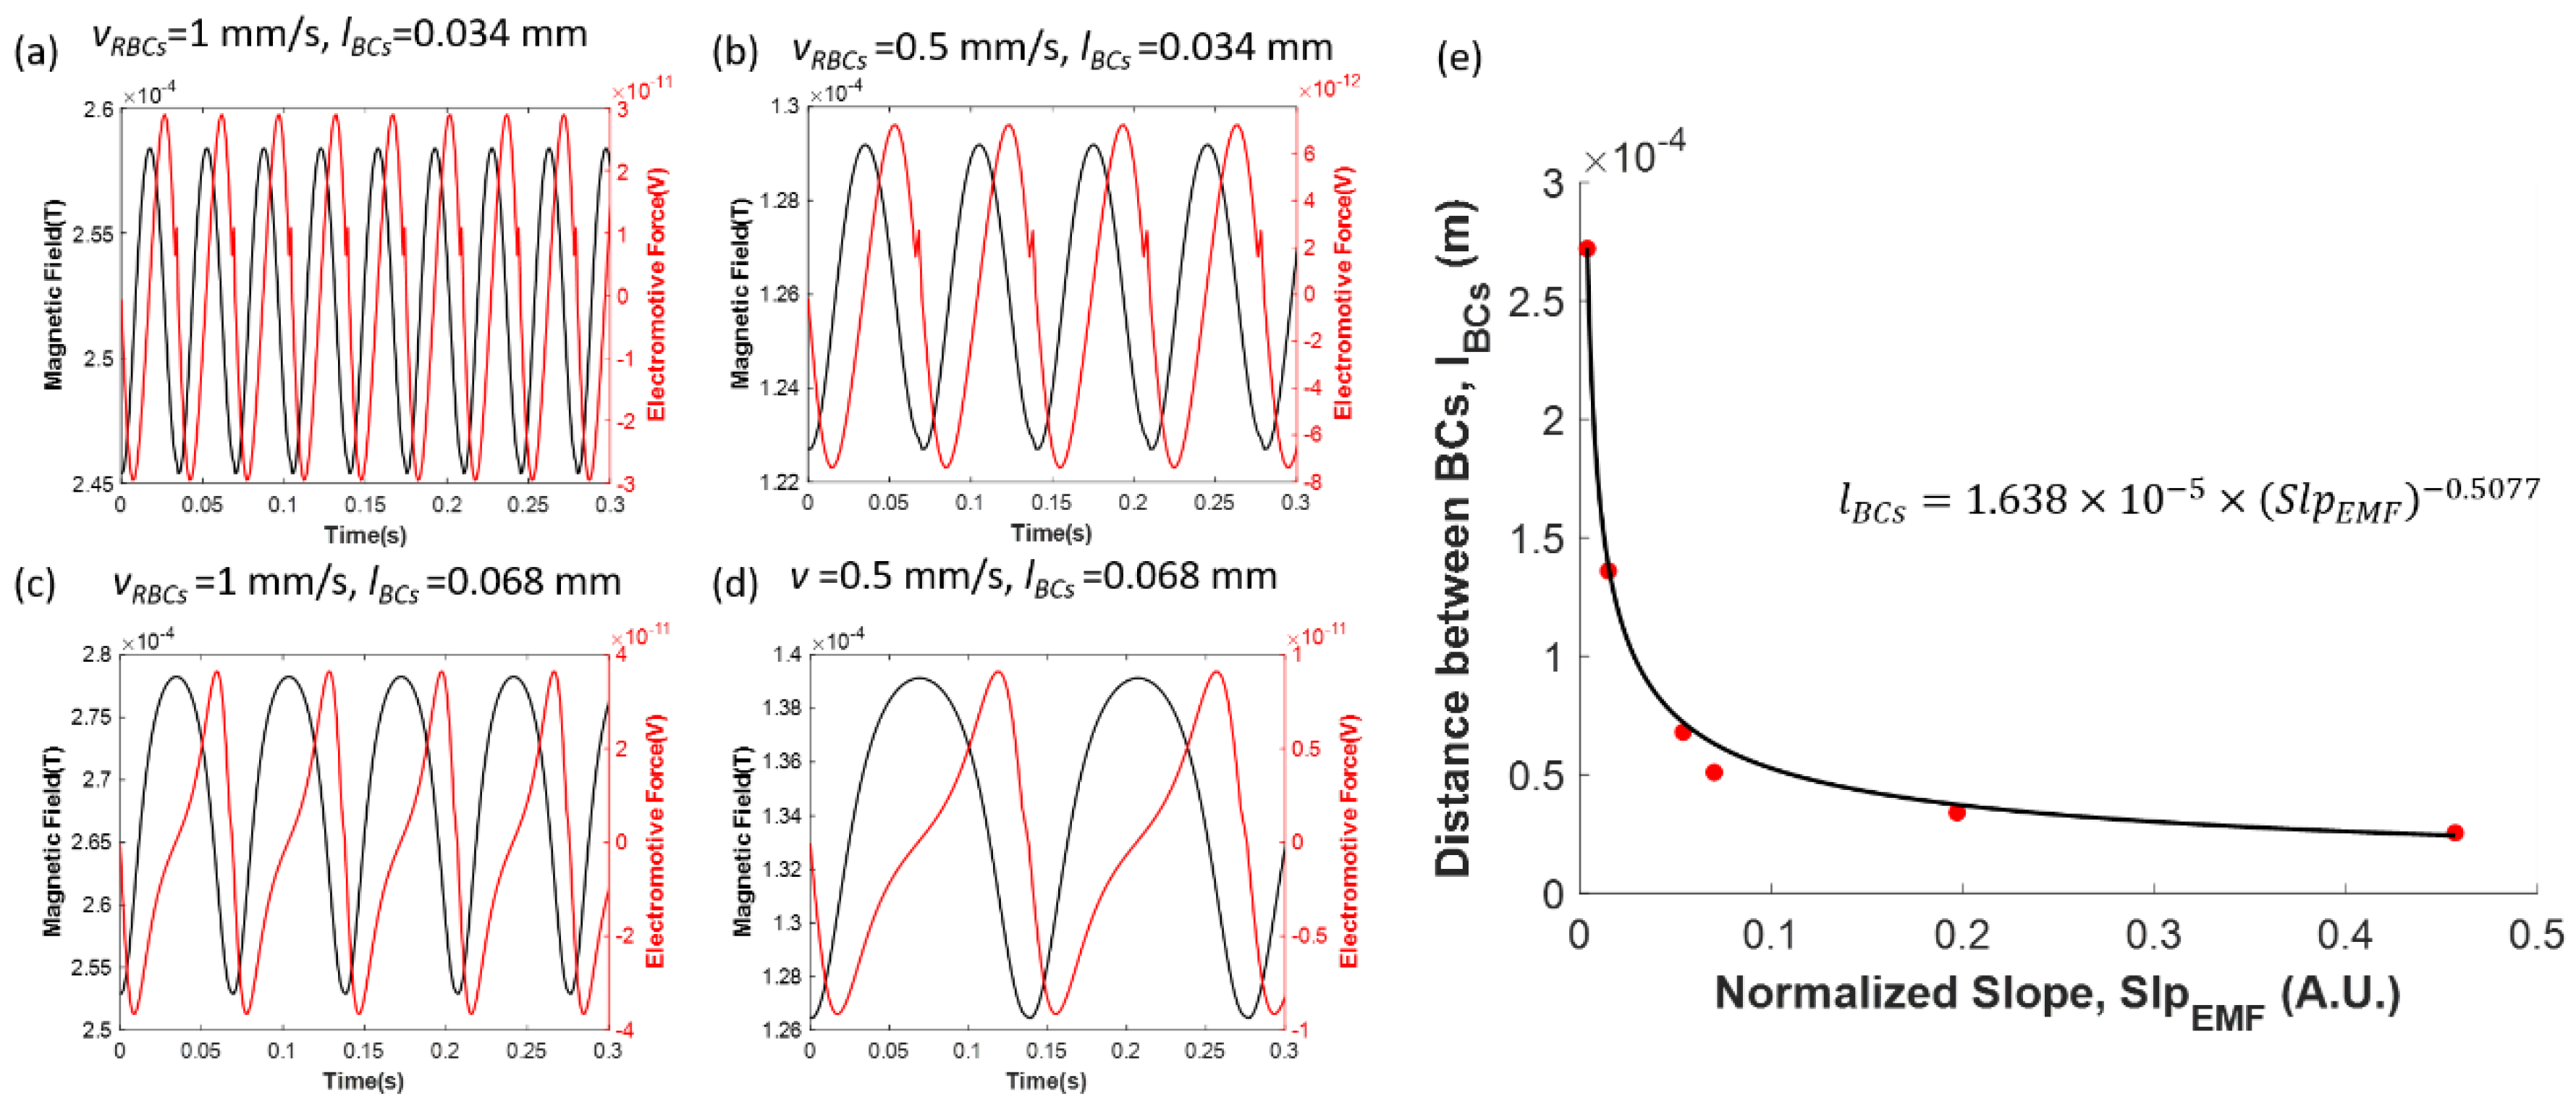
We first measured the time-course of the magnetic field at the magnetic coil located just above the capillary. As a proof-of-concept, we assumed that the RBCs were equidistantly spaced, with an interval of 3.4 × 10 5 [m] float in the blood plasma, with a velocity of 1 [mm/s] (Table 1). At the moment when the microcoil sensor is located at the mid-point of the two adjacent RBCs in the y-axis, 2.6 × 10 4 [T] is generated, which is mainly attributed to the magnetic field produced by the blood plasma (Figure 2a). The magnetic field, however, decreases to 2.5 × 10 4 [T] when the RBC is just below the microcoil and bounces back to 2.6 × 10 4 [T] when the RBC moves away from the microcoil. Based on Faraday’s law of induction (Equation (2)), an EMF is generated at the microcoil. We found that the EMF generated at the microcoil whose rotation angle ( θ ) is 0° lags 90° behind the magnetic field (Figure 2a).
Though we know the periods of the induced EMF ( T B C s ), the velocity of RBCs ( v ) cannot be determined, since the distances between each adjacent RBC ( l B C s ) are usually unknown (Figure 1a). Interestingly, we found that the magnetic field profile depends on the l R B C s . As can be seen in Figure 2a–d, the shape of the magnetic field, as well as the induced EMF detected at the microcoil, changes, depending on the l B C s . This is because the magnetic field produced by RBCs affects the adjacent area more as they get closer. We also found that the normalized slope of the EMF ( S l p E M F ) is independent of the blood velocity of which the S l p E M F is defined as
S l p E M F = E M F ( t 1 + Δ t ) E M F ( t 1 ) E M F m a x i m u m   p e a k E M F m i n i m u m   p e a k ,
where t 1 is the time when the RBC passes just below the microcoil, and Δ t is 1 ms. These findings assert the possibility of estimating l B C s using one of the pieces of information regarding the shape of the EMF, the S l p E M F . We determined the l B C s with respect to the S l p E M F , as shown in Figure 2e. We found that the graph can be fitted using a power function ( l B C s = 1.638 × 10 5 × ( S l p E M F ) 0.5077 ) with 95% confidence bounds. Based on this acquired fitting function, once we monitored the EMF and acquired the S l p E M F , we could then estimate l B C s . Therefore, we could estimate the velocity of RBCs ( v ) as l B C s T B C s . It is worth noting that the v is determined by the normalized EMF difference ( S l p E M F ), not the absolute amplitude of the EMF.

3.1.2. Magnetic Sensor for Directional Flow Measurement

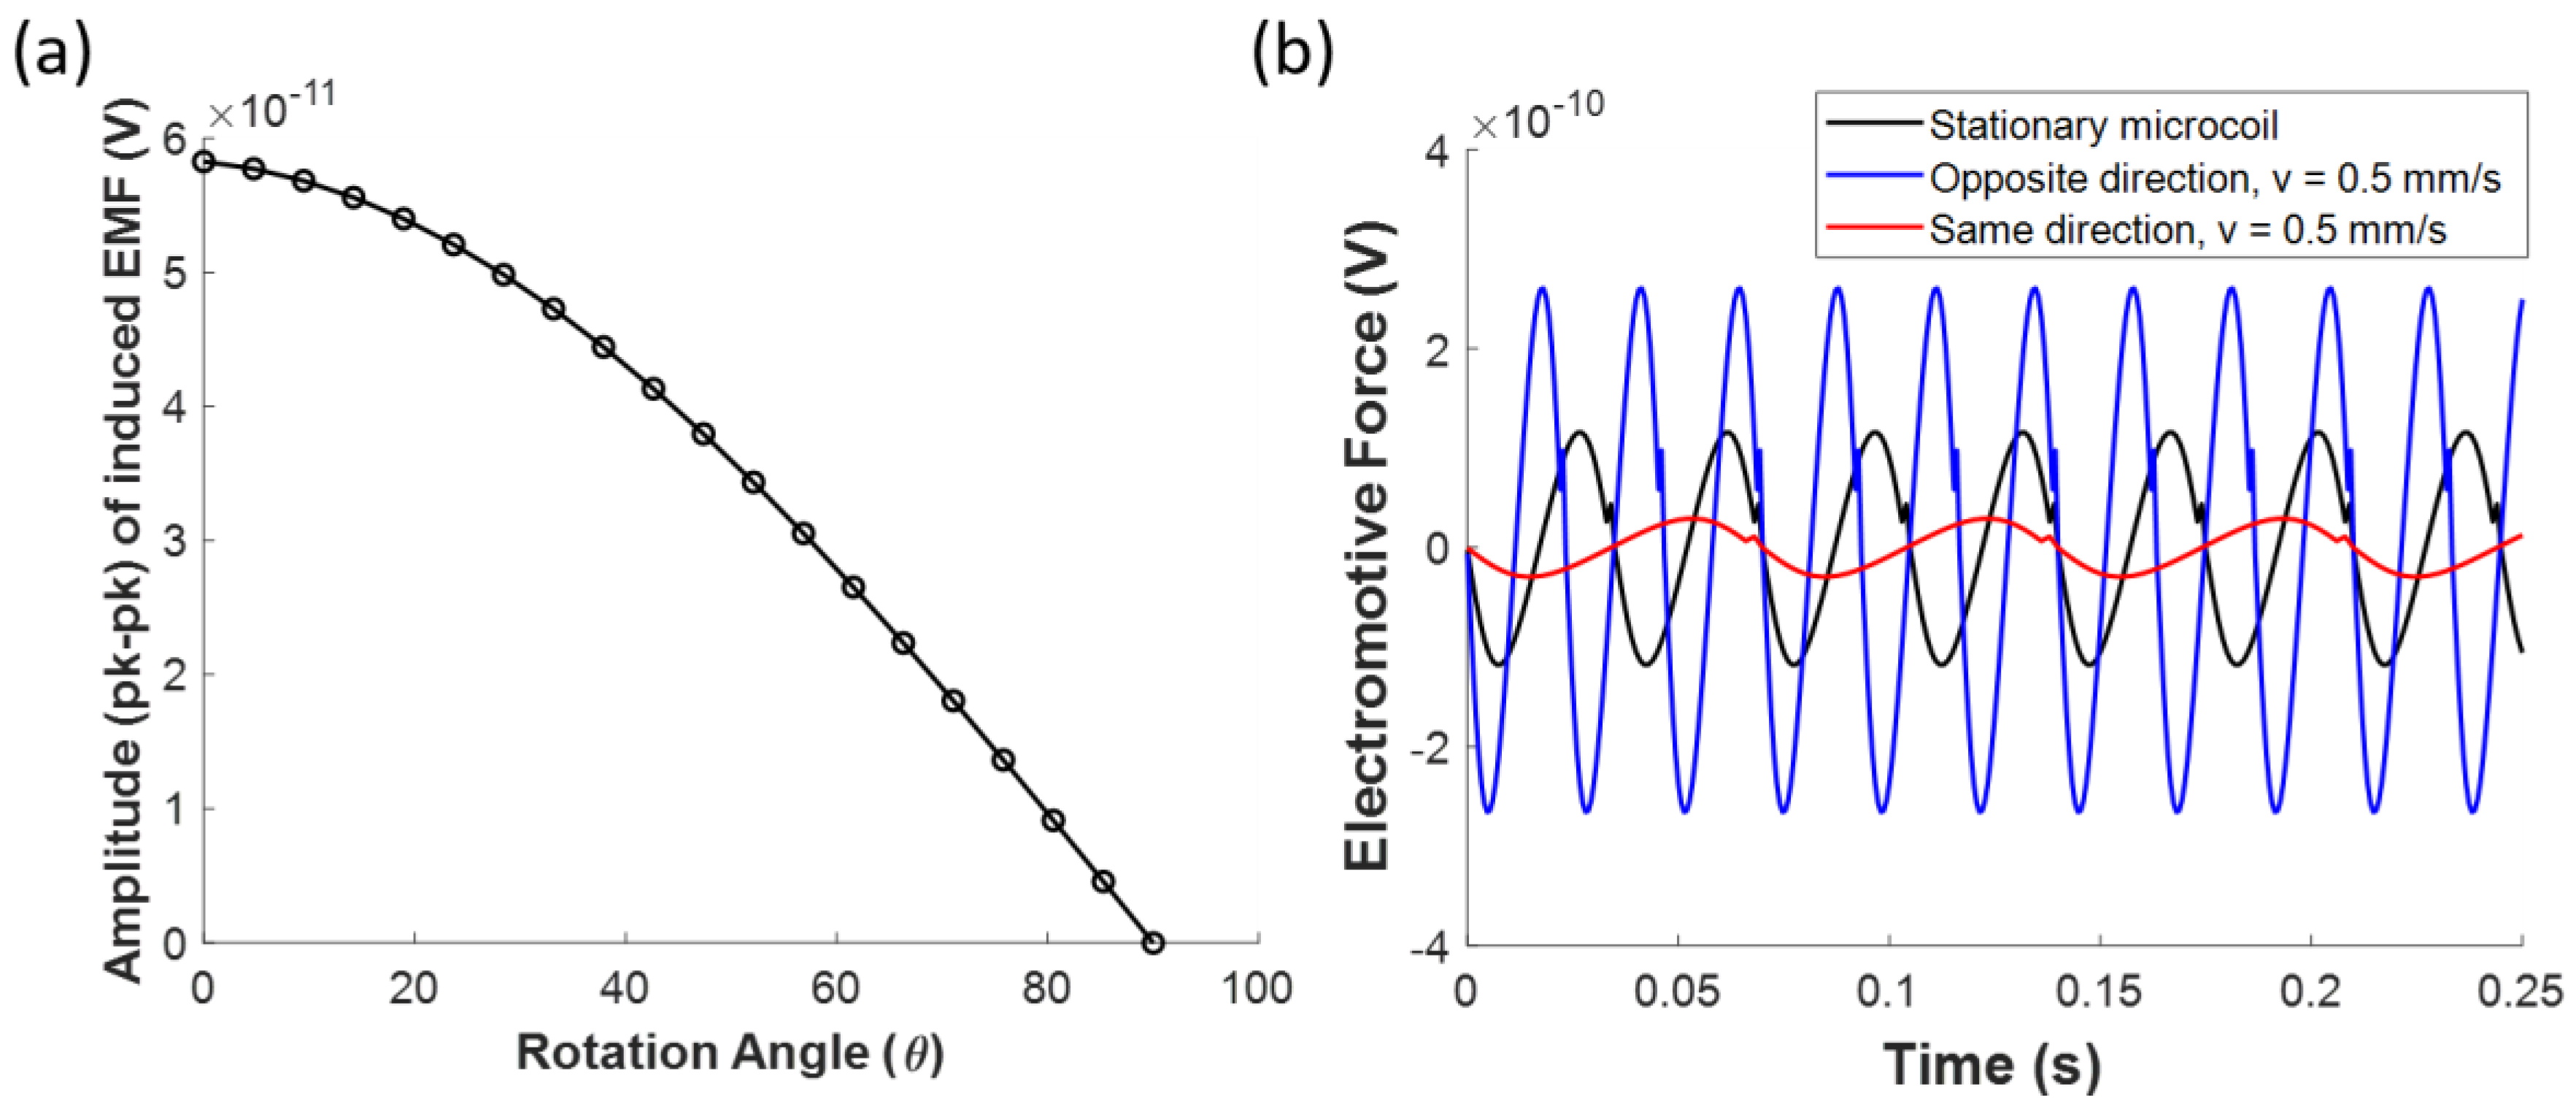
Prior to determining the direction of blood flow, we first determined how the capillary is aligned in the xy-plane (Figure 1c). The induced EMF was monitored while rotating the microcoil in the z-axis. We found that the induced EMF is maximized when the microcoil is perpendicularly aligned with the capillary, having θ of 0° (Figure 3a). Once we found how the capillary was aligned, we could determine the direction of blood stream. The change in the induced EMF frequency, while moving the microcoil along the capillary at a velocity of 0.5 mm/s, was monitored. During the microcoil movement, the rotation angle θ is kept constant, at 0°. Here the EMF frequency is defined as the frequency of the local maximum points of the EMF. We found that the EMF frequency decreases when the microcoil moves along the blood flow, whereas an increase in the EMF frequency was observed when the microcoil moved in a direction opposite to the blood flow, resembling the Doppler effect (Figure 3b).

3.2. Other Variations

3.2.1. Effects of White Blood Cells on the Induced Electromotive Force

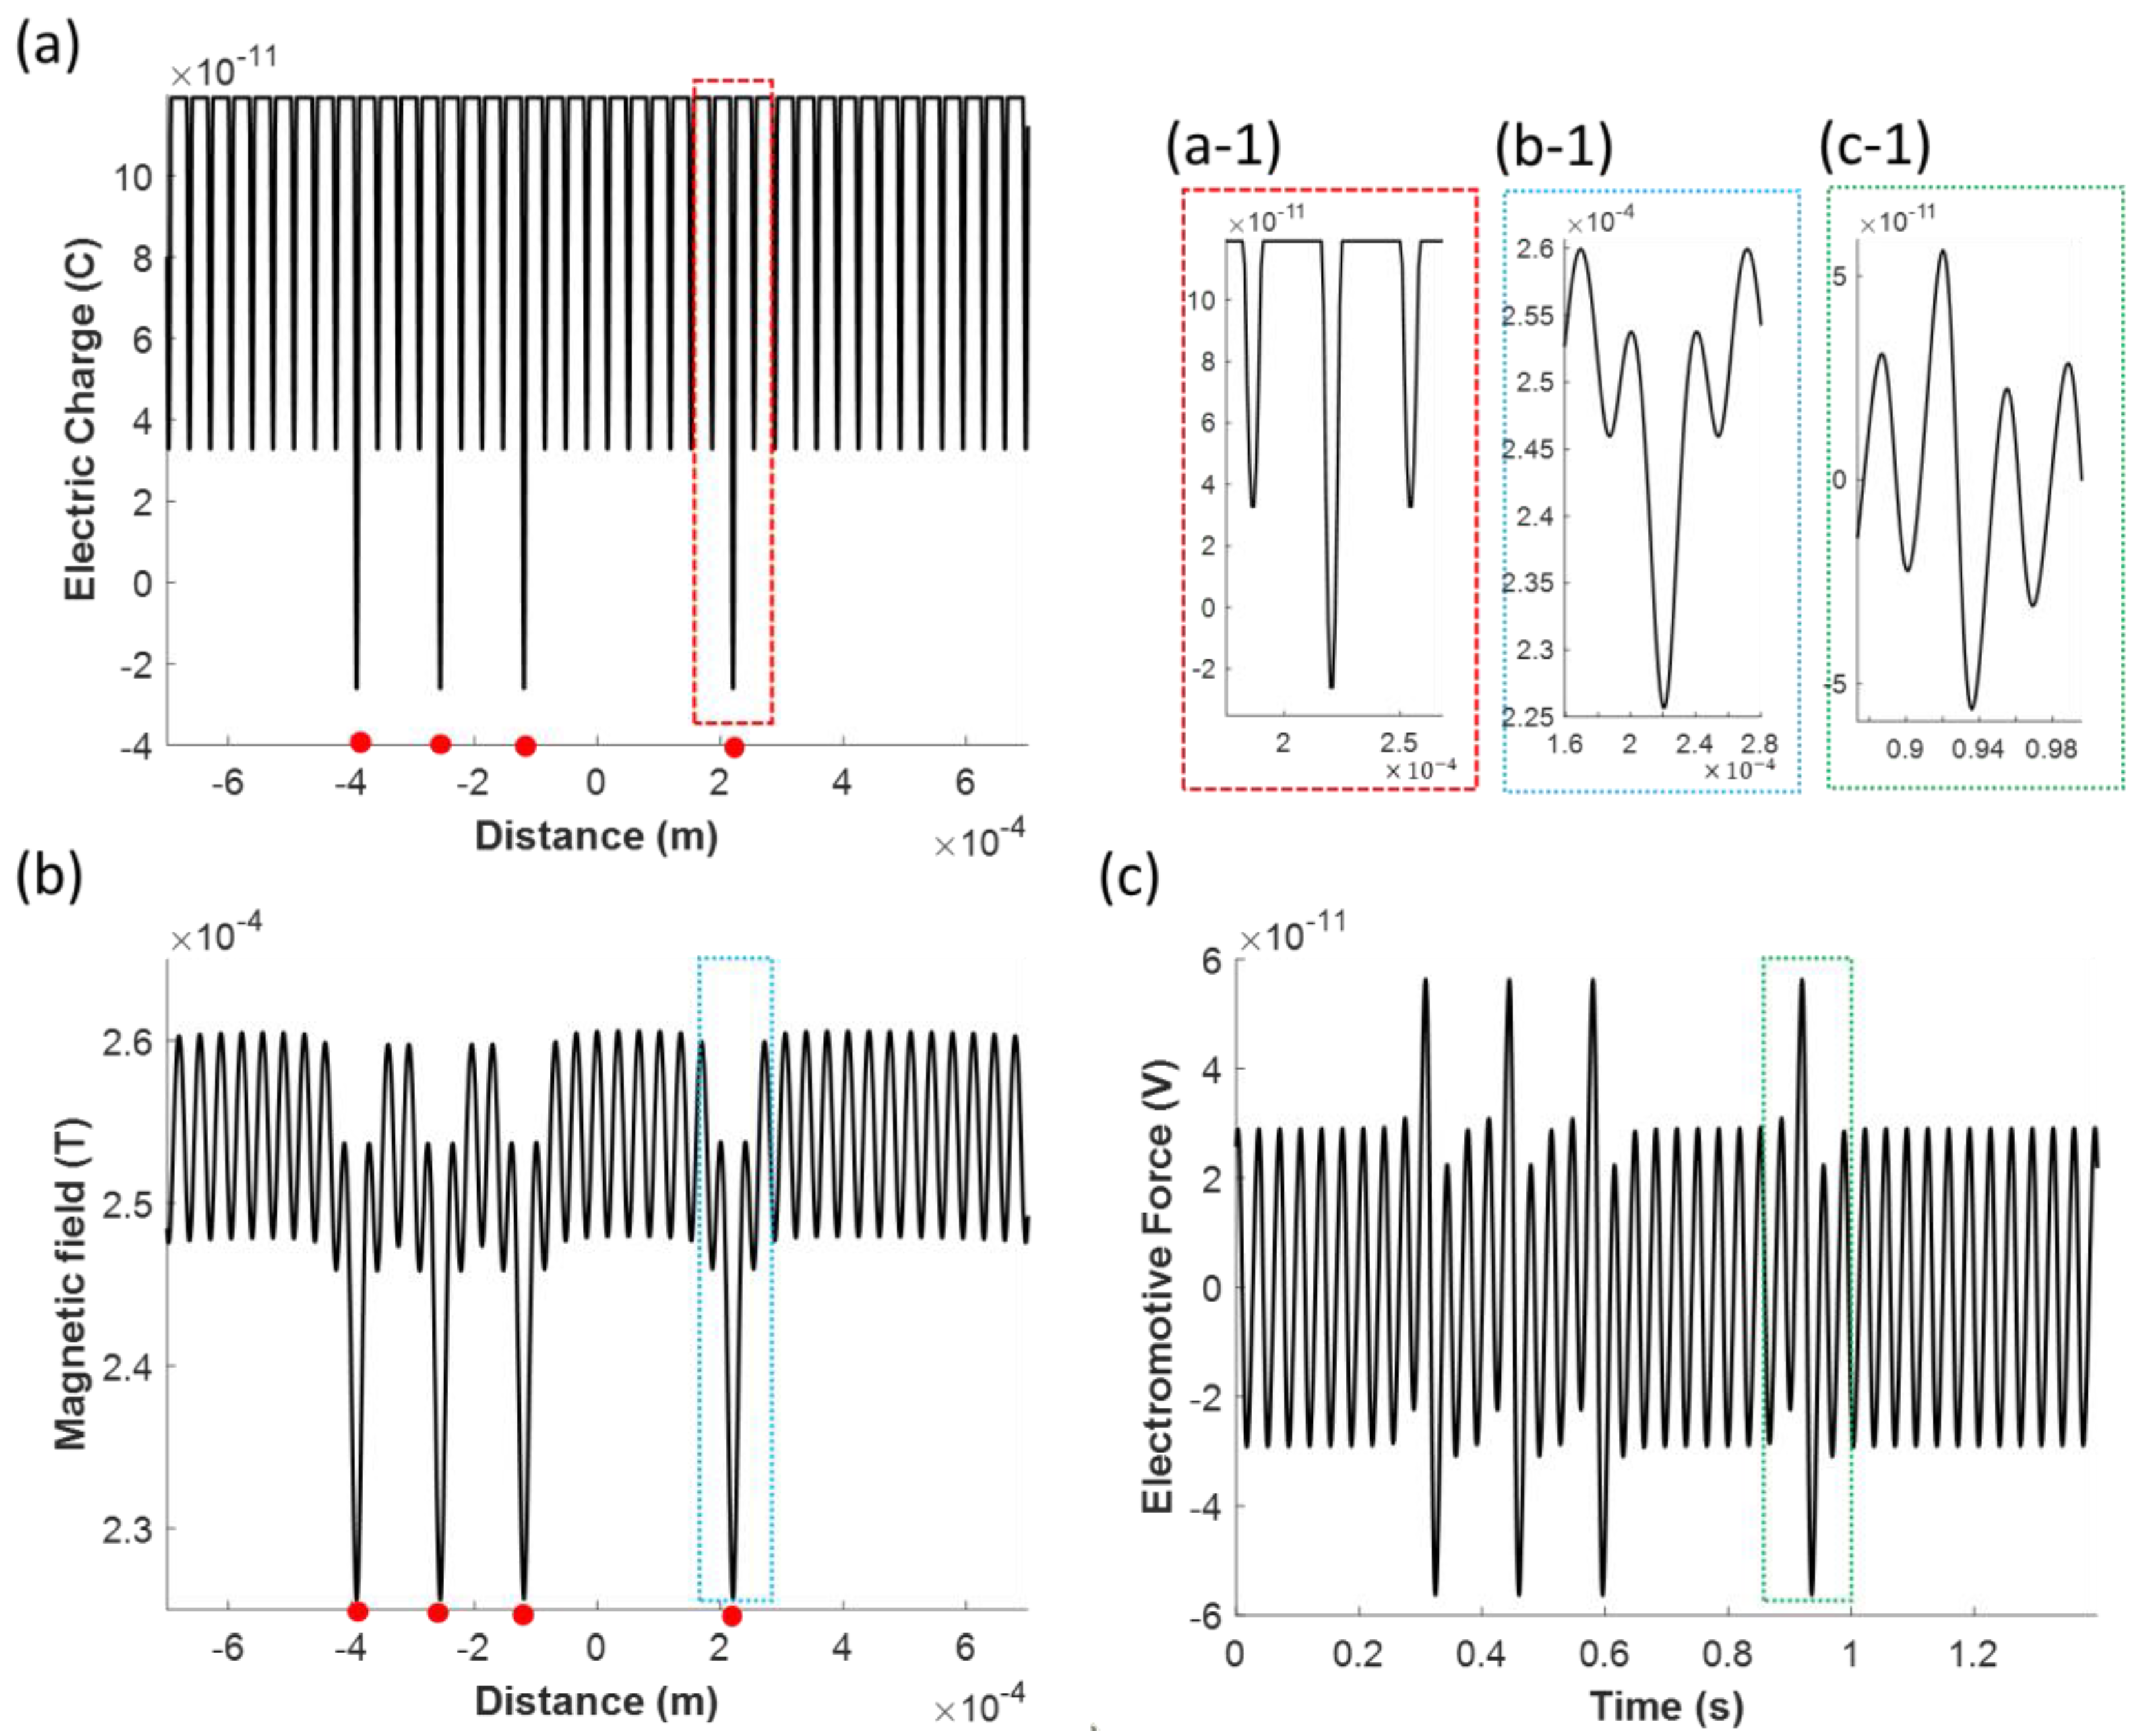
We investigate whether WBCs are detected and distinguished by the magnetic sensor. As noted above in Section 2.2, the electric charge and the dimension of a WBC are taken into account when modeling WBCs (Table 1). WBCs are randomly distributed, having a WBC to RBC ratio of 0.1, while l B C s is kept constant throughout the capillary. The peak electric charges of 2.6 × 10 11 [C] and 3.3 × 10 11 [C] were monitored where the WBCs and RBCs are located, respectively, while blood plasma has a base electric charge of 1.2 × 10 10 [C] (Figure 4a). Moving electric charges collectively produce a time-varying magnetic field (Figure 4b) and generate an induced EMF at the microcoil. We found that an EMF with a greater amplitude was generated when the WBC passed just below the microcoil, while a smaller amplitude was generated for the RBC (Figure 4c), indicating that microcoil sensor can distinguish between the WBCs and RBCs. This EMF result indicates that the location of blood cell and corresponding blood cell type can be determined by the amplitude of EMF.

3.2.2. Effects of the Capillary Diameter and the Coil to Capillary Distance on the Induced Electromotive Force

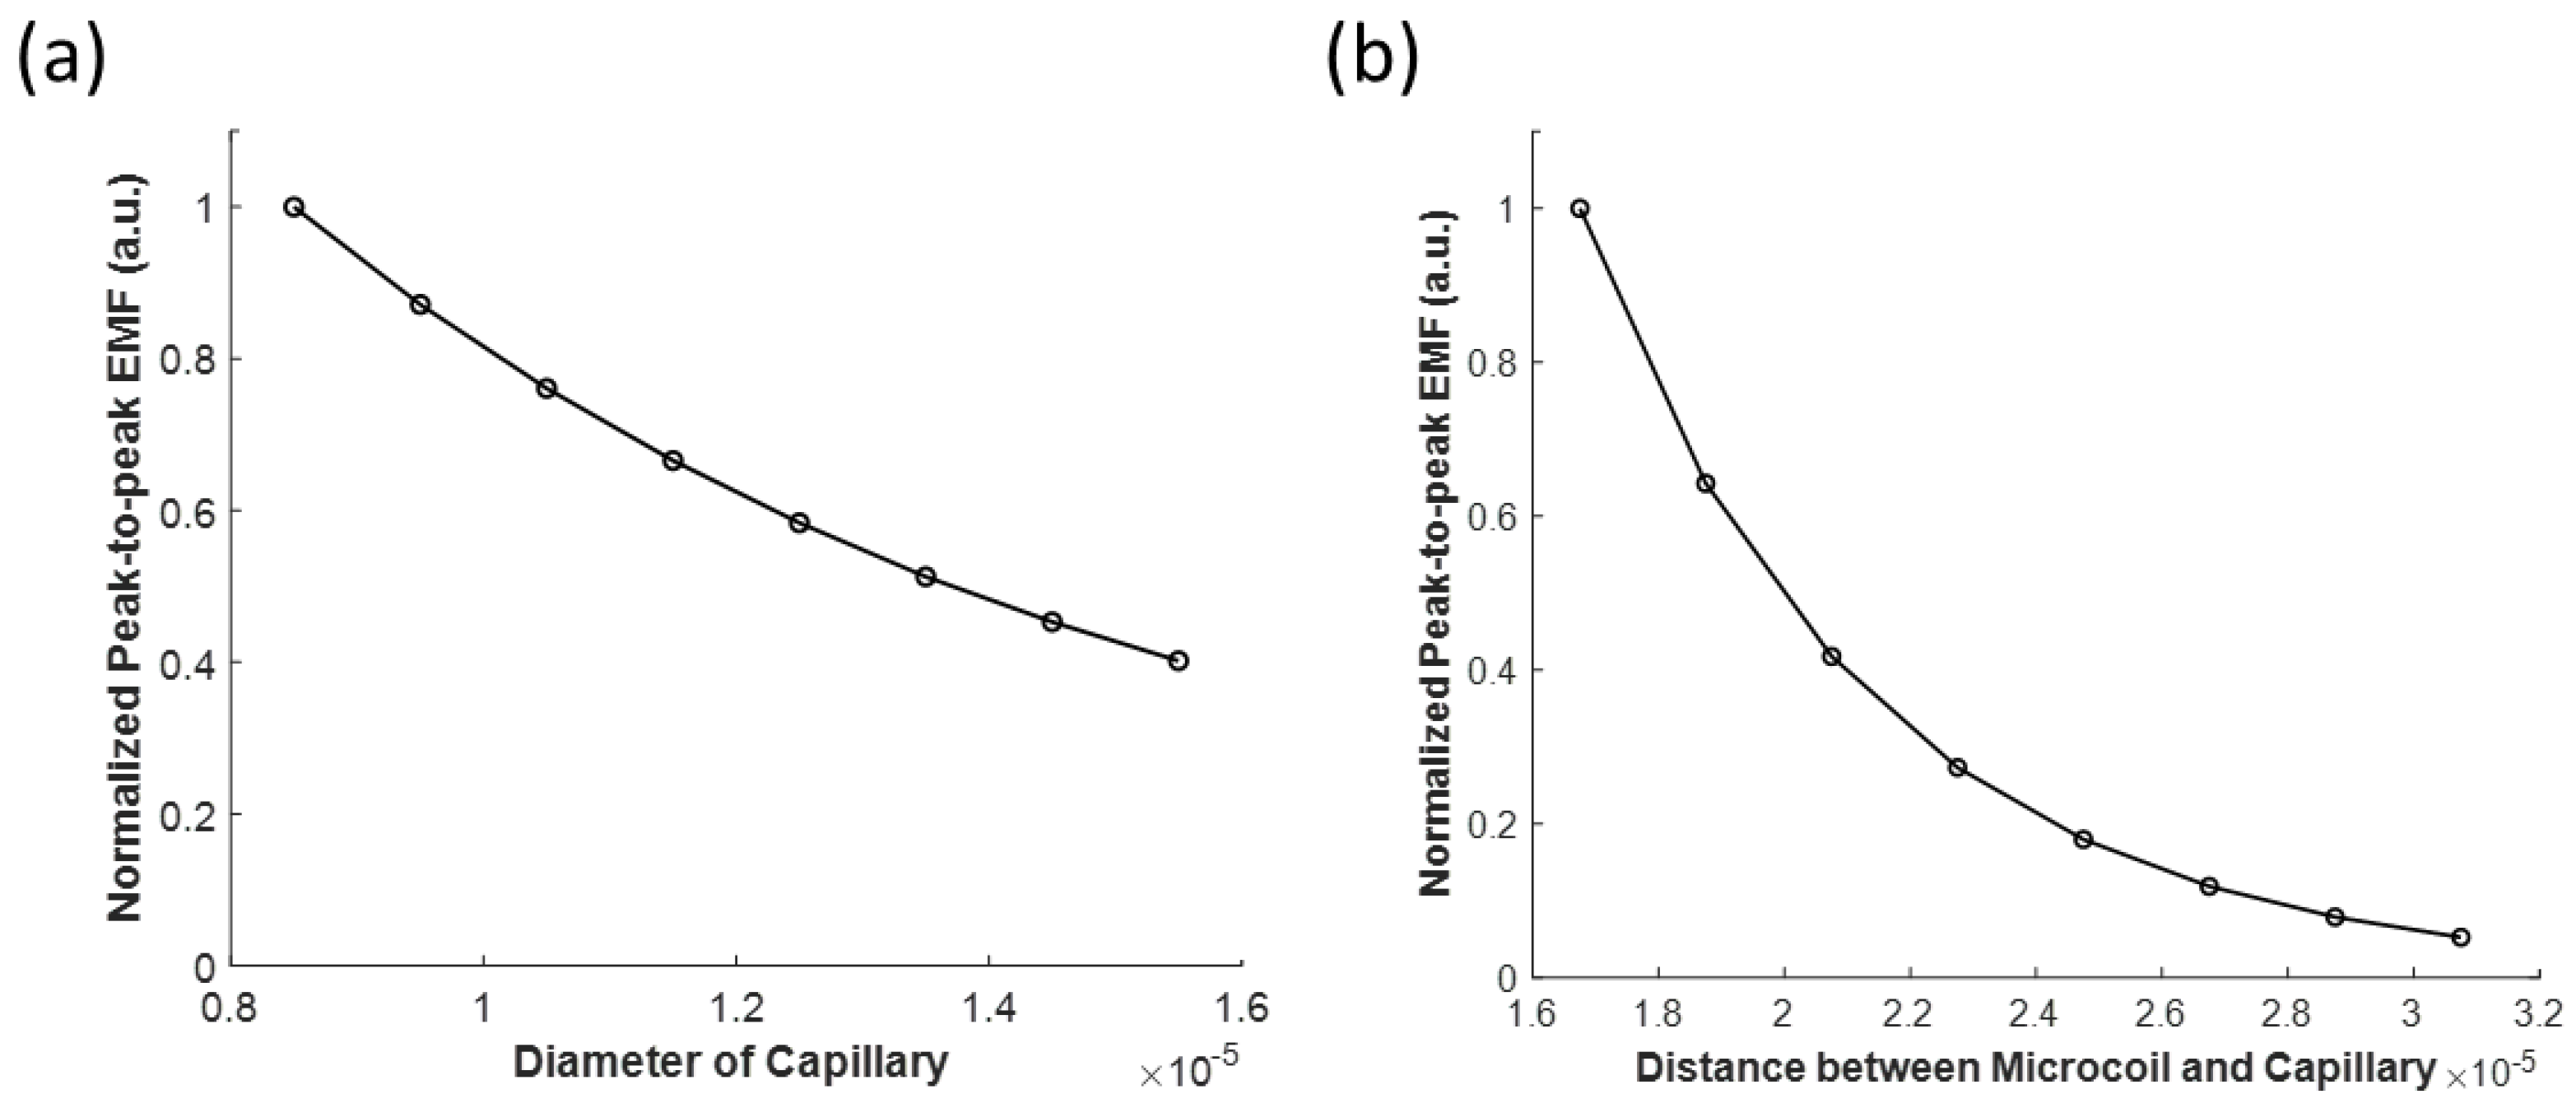
We also determined the effect of the capillary diameter on the induced EMF detected at the microcoil. We found that the normalized peak-to-peak amplitude of induced EMF decreases while increasing the diameter of the capillary (Figure 5a). We speculate that the decrease in the induced EMF is due to the masking of the electric charges of blood cells by the increased electric charge of the blood plasma. The normalized peak-to-peak EMF decreases when the distance between the microcoil and capillary increases, as the magnetic field is inversely proportional to the distance (Figure 5b).

4. Conclusions and Discussion

Blood flow measurement has long been investigated, and its feasibility has been demonstrated by numerous studies, but their methods all require external energy sources for blood detection. In this study, we have developed a novel blood cell flowmetry approach using a micro-magnetic sensor without an external energy source being applied. Since blood cells, as well as blood plasma, have distinguishable electric charges, they generate magnetic fields upon blood flow. A microcoil is placed just above the capillary and aligned, in order to allow the magnetic flux to pass through the microcoil. As the blood components, generating different magnitudes of magnetic field, run into the capillary, the microcoil experiences a time-varying magnetic field and thereby produces an EMF. Here, we employ the EMF to estimate the velocity of the blood cell stream. We also determine the direction in which the blood flows throughout the capillary by monitoring the EMF frequency shift when moving the microcoil along the capillary. Finally, this method could detect WBC flow by monitoring the induced EMF, which is distinguishable from that of RBC flow.
As noted, the proposed micro-magnetic sensor captures the magnetic field generated by the blood, whereas the currently developed blood flowmetry approach requires an external energy source to be applied for measurement. This interesting feature enables the real time monitoring of blood flow and may be superior, in terms of temporal resolution, to conventional blood flowmetry. However, this method is limited to the point-wise detection of blood flow, while optical blood flowmetry can produce a full-field image of blood flow. Regarding the resolution, the optical methods are better, as their diffraction limit lies within a range of several micrometers, depending on the light wavelength. The proposed micro-magnetic sensor could distinguish the blood streams based on the relative amplitude of induced EMF, as the EMF depends on the distance between the coil and the sensor (Figure 5b). Hence, the resolution of the microcoil system would be determined by the signal-to-noise ratio of the system.
Since it has only been validated by computational analysis, several technical challenges should be considered to bring it into the clinic. First, EMF signal amplification is required, due to the low EMF signal. Next, to bring the coil close to the capillary, a small coil is required for magnetic blood flowmetry. Here, we designed the coil with a diameter of 50 μm, and the fabrication of such a small coil requires further study. Moreover, three-dimensional modeling and simulation should give more accurate profiles of the magnetic field and the corresponding induced electromotive force. In addition, the distribution of ions at the ionic double layer located in the vicinity of the cell membrane should give a more precise estimation of the electrical charge density at the blood plasma and the blood cell membrane. Despite its technical challenges, this novel method allows non-invasive external source-free blood flow detection based on the magnetic field generated by the blood stream.

Author Contributions

Conceptualization, K.E.; methodology, K.E. and S.J.; modeling and simulation, K.E. and S.J.; analysis, K.E. and S.J.; writing, K.E. All authors have read and agreed to the published version of the manuscript.

Funding

This work was supported by National Research Foundation of Korea (NRF) grant funded by the Korea government (MSIT) (2020R1C1C1010505), Pusan National University Research Grant, 2020, and by BK21PLUS, Creative Human Resource Development Program for IT Convergence.

Conflicts of Interest

The authors declare no conflict of interest.

References

  1. Hall, C.N.; Reynell, C.; Gesslein, B.; Hamilton, N.B.; Mishra, A.; Sutherland, B.A.; O’Farrell, F.M.; Buchan, A.M.; Lauritzen, M.; Attwell, D. Capillary pericytes regulate cerebral blood flow in health and disease. Nature 2014, 508, 55–60. [Google Scholar] [CrossRef] [PubMed] [Green Version]
  2. Tabrizchi, R.; Pugsley, M.K. Methods of blood flow measurement in the arterial circulatory system. J. Pharmacol. Toxicol. Methods 2000, 44, 375–384. [Google Scholar] [CrossRef]
  3. Jayanthy, A.K.; Sujatha, N.; Ramasubba Reddy, M. Measuring blood flow: Techniques and applications. Int. J. Res. Rev. Appl. Sci. 2011, 6, 203–216. [Google Scholar]
  4. Micheels, J.; Aisbjorn, B.; Sorensen, B. Laser doppler flowmetry. A new non-invasive measurement of microcirculation in intensive care? Resuscitation 1984, 12, 31–39. [Google Scholar] [CrossRef]
  5. Essex, T.J.H.; Byrne, P.O. A laser Doppler scanner for imaging blood flow in skin. J. Biomed. Eng. 1991, 13, 189–194. [Google Scholar] [CrossRef]
  6. Briers, D.; Duncan, D.D.; Hirst, E.R.; Kirkpatrick, S.J.; Larsson, M.; Steenbergen, W.; Stromberg, T.; Thompson, O.B. Laser speckle contrast imaging: Theoretical and practical limitations. J. Biomed. Opt. 2013, 18, 1–10. [Google Scholar] [CrossRef] [Green Version]
  7. Dunn, A.K. Laser Speckle Contrast Imaging of Cerebral Blood Flow. Ann. Biomed. Eng. 2012, 40, 367–377. [Google Scholar] [CrossRef] [Green Version]
  8. Boas, D.A.; Dunn, A.K. Laser speckle contrast imaging in biomedical optics. J. Biomed. Opt. 2010, 15, 011109. [Google Scholar] [CrossRef] [Green Version]
  9. Jochim, K.E. The Development of the Electro-Magnetic Blood Flowmeter. IRE Trans. Biomed. Electron. 1962, 9, 228–235. [Google Scholar] [CrossRef]
  10. Wyatt, D.G. The electromagnetic blood flowmeter. J. Phys. E. 1968, 1, 1146–1152. [Google Scholar] [CrossRef]
  11. Teferra, M.N. Electromagnetic Blood Flow meter: Review. Int. J. Latest Res. Eng. Technol. 2017, 3, 21–26. [Google Scholar]
  12. Raunig, D.L.; Fox, M.D. Doppler ultrasound determination of capillary blood flow. In Proceedings of the IEEE 23rd Northeast Bioengineering Conference, Durham, NH, USA, 21–22 May 1997; pp. 1–2. [Google Scholar]
  13. Azran, A.; Hirao, Y.; Kinouchi, Y.; Yamaguchi, H.; Yoshizaki, K. Variations of the Maximum Blood Flow Velocity in the Carotid, Brachial and Femoral Arteries in a Passive Postural Changes by a Doppler Ultrasound Method. In Proceedings of the The 26th Annual International Conference of the IEEE Engineering in Medicine and Biology Society, San Francisco, CA, USA, 1–5 September 2004; pp. 3708–3711. [Google Scholar]
  14. Shapiro, M.G.; Homma, K.; Villarreal, S.; Richter, C.-P.; Bezanilla, F. Infrared light excites cells by changing their electrical capacitance. Nat. Commun. 2012, 3, 736. [Google Scholar] [CrossRef]
  15. Hodgkin, A.L.; Huxley, A.F. A quantitative description of membrane current and its application to conduction and excitation in nerve. J. Physiol. 1952, 117, 500–544. [Google Scholar] [CrossRef] [PubMed]
  16. Eom, K.; Byun, K.M.; Jun, S.B.; Kim, S.J.; Lee, J. Theoretical Study on Gold-Nanorod-Enhanced Near-Infrared Neural Stimulation. Biophys. J. 2018, 115, 1481–1497. [Google Scholar] [CrossRef] [PubMed] [Green Version]
  17. Turgeon, M.L. Clinical Hematology: Theory and Procedures, 4th ed.; Lippincott Williams & Wilkinsa: Philadelphia, PA, USA, 2005; ISBN 0781750075. [Google Scholar]
  18. Rodighiero, S.; De Simoni, A.; Formenti, A. The voltage-dependent nonselective cation current in human red blood cells studied by means of whole-cell and nystatin-perforated patch-clamp techniques. Biochim. Biophys. Acta Biomembr. 2004, 1660, 164–170. [Google Scholar] [CrossRef] [PubMed] [Green Version]
  19. Wang, K.; Chang, C.-C.; Chiu, T.-K.; Zhao, X.; Chen, D.; Chou, W.-P.; Zhao, Y.; Wang, H.-M.; Wang, J.; Wu, M.-H.; et al. Membrane capacitance of thousands of single white blood cells. J. R. Soc. Interface 2017, 14, 20170717. [Google Scholar] [CrossRef]
  20. Zavodnik, I.B.; Piasecka, A.; Szosland, K.; Bryszewska, M. Human red blood cell membrane potential and fluidity in glucose solutions. Scand. J. Clin. Lab. Invest. 1997, 57, 59–63. [Google Scholar] [CrossRef]
  21. Whitin, J.C.; Clark, R.A.; Simons, E.R.; Cohen, H.J. Effects of the myeloperoxidase system on fluorescent probes of granulocyte membrane potential. J. Biol. Chem. 1981, 256, 8904–8906. [Google Scholar]
  22. Baran, U.; Shi, L.; Wang, R.K. Capillary blood flow imaging within human finger cuticle using optical microangiography. J. Biophotonics 2015, 8, 46–51. [Google Scholar] [CrossRef] [Green Version]
  23. Lee, J.; Wu, W.; Lesage, F.; Boas, D.A. Multiple-capillary measurement of RBC speed, flux, and density with optical coherence tomography. J. Cereb. Blood Flow Metab. 2013, 33, 1707–1710. [Google Scholar] [CrossRef] [Green Version]
  24. Nezafati, N.; Moztarzadeh, F.; Hesaraki, S. Surface reactivity and in vitro biological evaluation of sol gel derived silver/calcium silicophosphate bioactive glass. Biotechnol. Bioprocess Eng. 2012, 17, 746–754. [Google Scholar] [CrossRef]
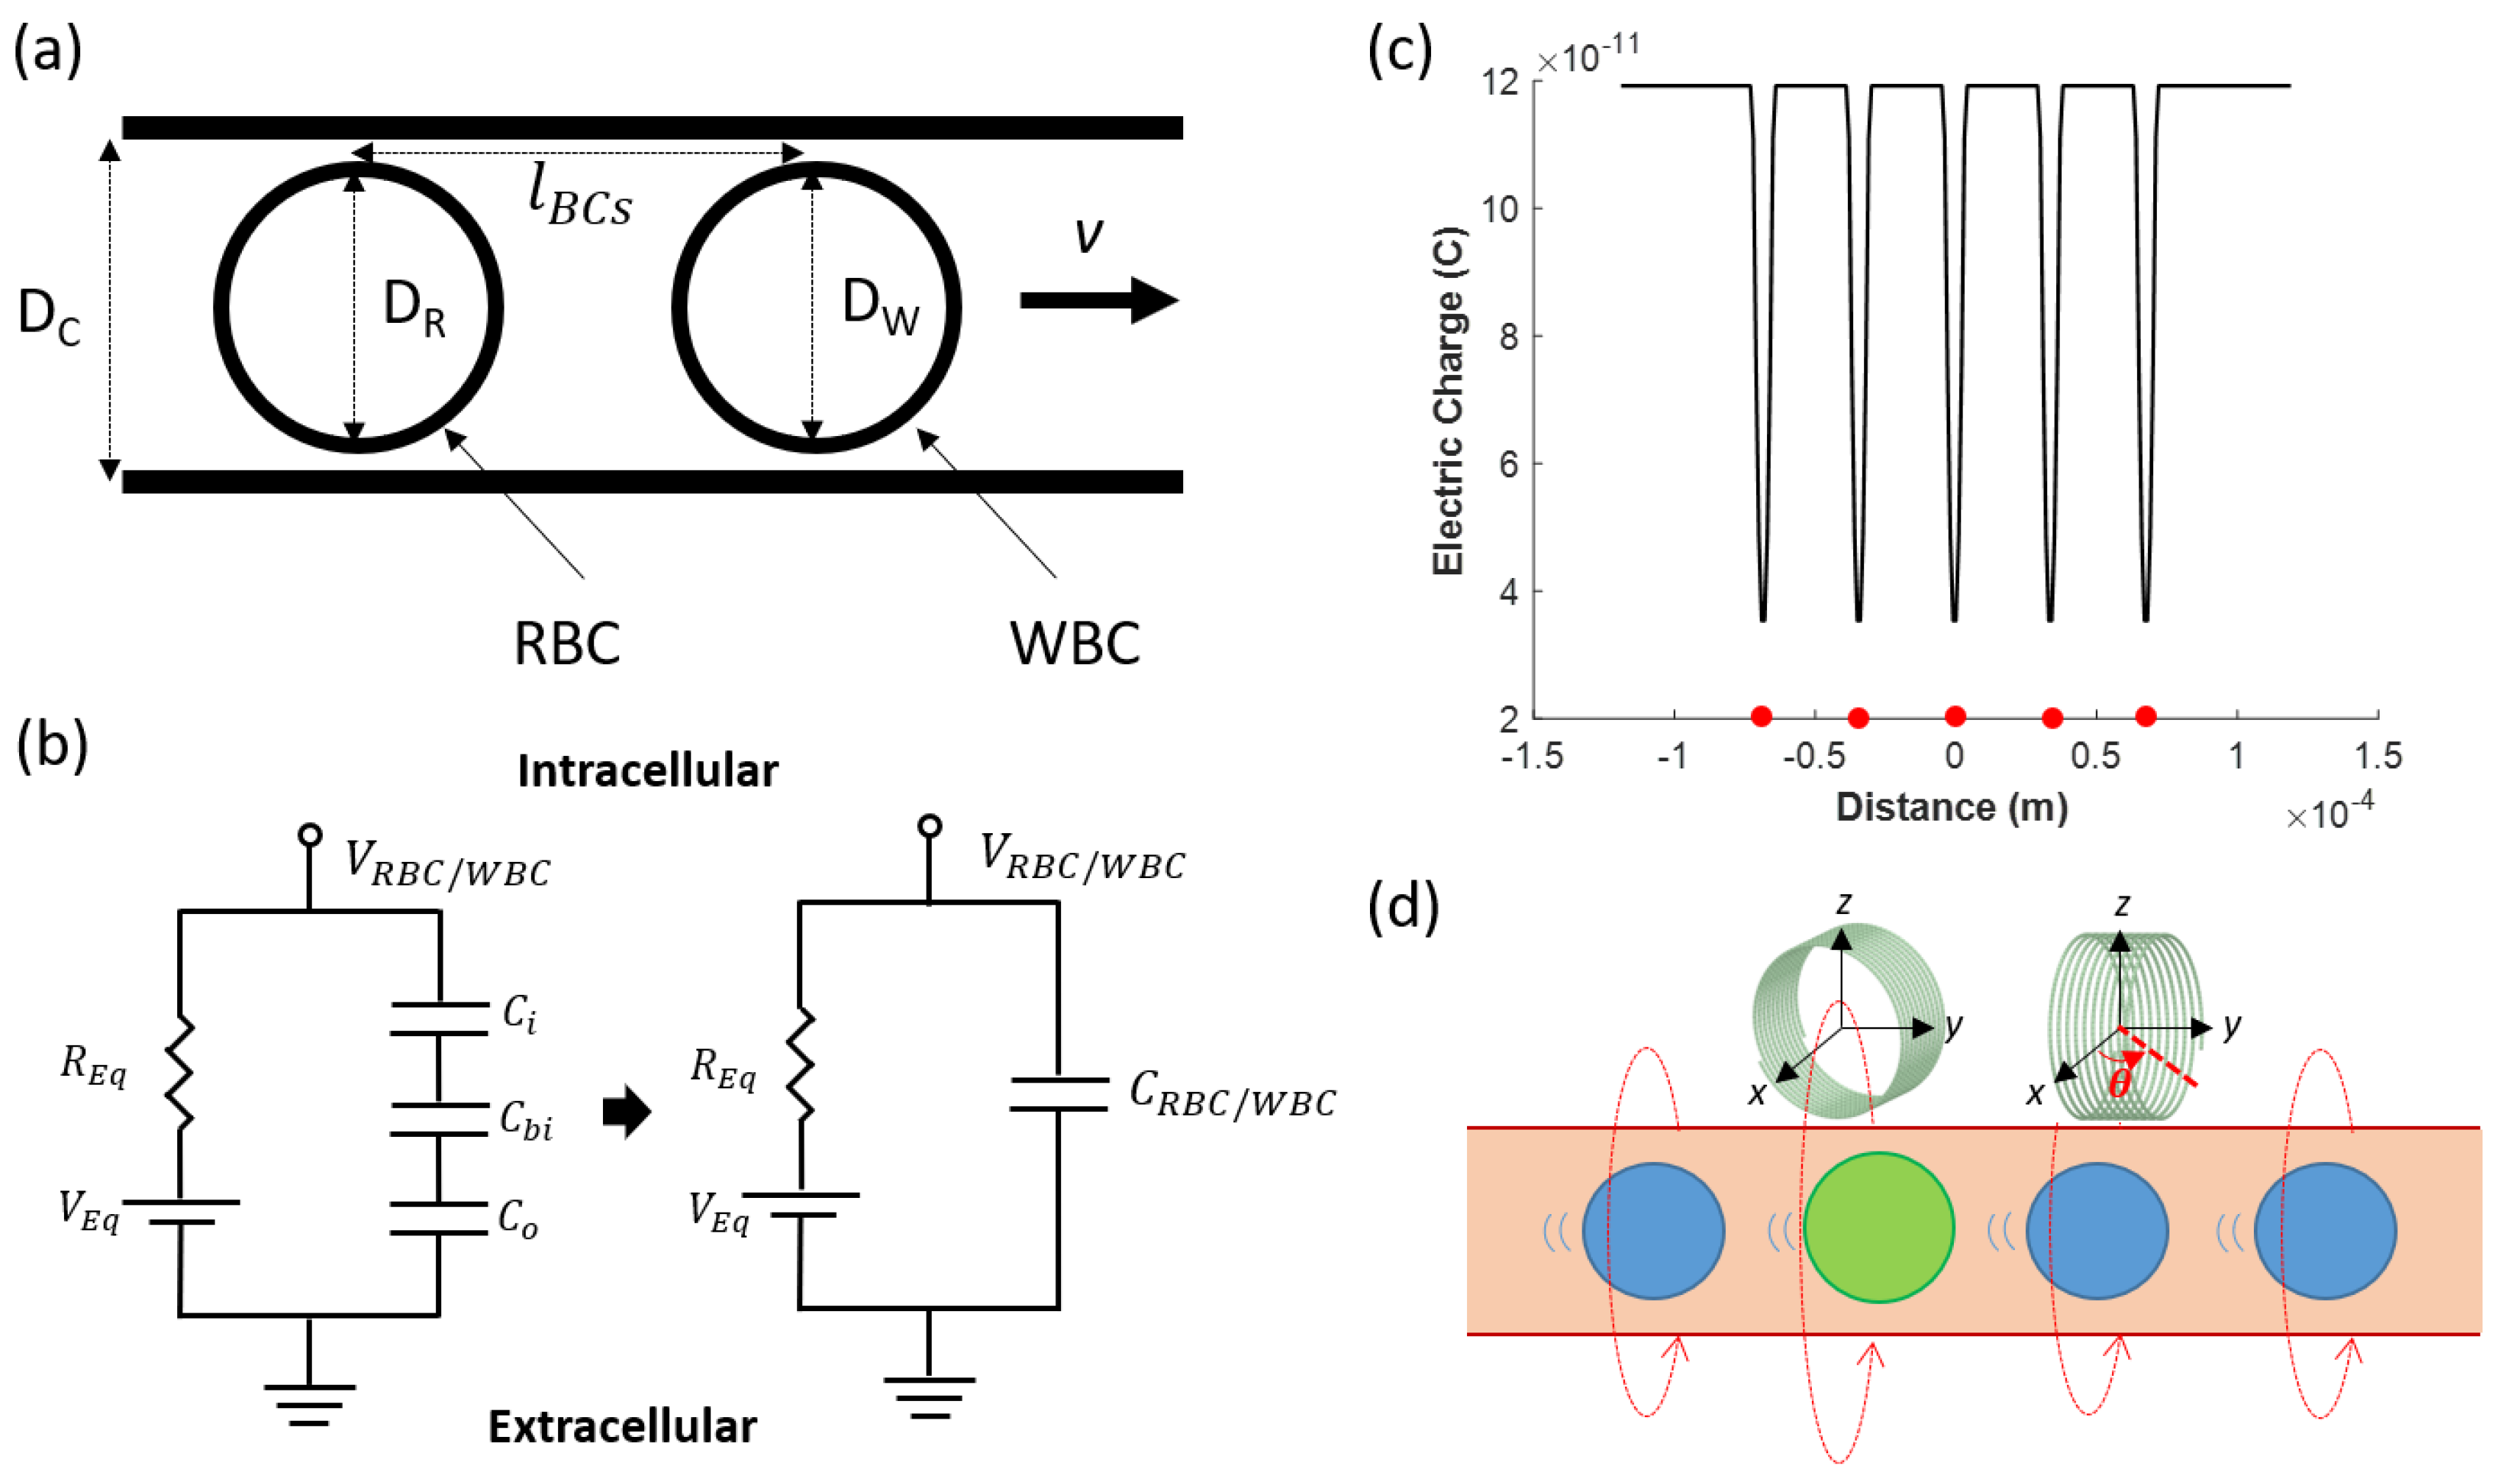
Figure 1. The blood stream and the generation of a magnetic field produced by the electrically charged blood. (a) Schematics of blood cells consisting of red blood cells (RBCs) and white blood cells (WBCs) flowing along the capillary with a speed of v. The diameters of the RBC and the WBC are DR and DW, respectively, and each adjacent blood cell is separated by l B C s . (b) A cell is modeled as three serially connected capacitors C i , C o , and C b i , reflecting an electrical double layer of intracellular and extracellular regions, and a lipid bilayer, respectively. Capacitors are connected to a resistor ( R E q ) and a voltage source ( V E q ), each reflecting ion channels and the equilibrium potential of ions. (c) Electric charge along the capillary when RBCs are located at −68, −34, 0, 34, and 68 μm (red-filled circle). The base volume is defined as the volume of the capillary with a 1 μm thickness along the y-axis. All the charges inside the base volume are summed to determine the electric charge for each point. (d) When blood flows in the y-direction, the magnetic field is generated in a counter-clockwise direction in the xz-plane. Among the two microcoils located above the capillary, the left one is aligned to capture the maximum magnetic field (rotation angle ( θ ) of 0°), whereas the microcoil on the right is rotated by θ about the rotation axis of z.
Electronics 09 00618 g001
Figure 2. Measurement of the blood velocity using the induced electromotive force (EMF) generated at the microcoil. (ad) The magnetic field generated by the flowing blood (black line), and the induced EMF measured at the microcoil (red line) when the blood velocity ( v ) and inter-RBC distance ( l B C s ) become 1 mm/s and 0.034 mm for (a), 0.5 mm/s and 0.034 mm for (b), 1 mm/s and 0.068 mm for (c), and 0.5 mm/s and 0.068 mm for (d). (e) The distance between adjacent RBCs ( l R B C s ) is plotted as a function of the normalized slope of induced EMF ( S l p E M F = E M F ( t 1 + Δ t ) E M F ( t 1 ) E M F m a x i m u m   p e a k E M F m i n i m u m   p e a k ) where t 1 is the time when the RBC passes just below the microcoil and Δ t is 1 ms.
Electronics 09 00618 g002
Figure 3. Measurement of the direction of blood flow by moving the microcoil along the capillary. (a) A graph depicting the peak-to-peak amplitude of the induced electromotive force (EMF) with respect to the rotation angle ( θ ) of the microcoil in the z-axis. (b) The trajectories of the EMF when the microcoil moves in the opposite direction to (blue line) and same direction as (red line) the blood flow, at a velocity of 0.5 mm/s, whereas the EMF with the black curve is that generated at the stationary microcoil.
Electronics 09 00618 g003
Figure 4. The microcoil can detect and distinguish between RBCs and WBCs. (a) Electric charge along the capillary when the WBCs are located at the points indicated by red-filled circles. RBCs are located at the other points along the capillary, while maintaining a constant distance between blood cells ( l B C s ) of 0.034 mm. All the charges inside the base volume, in a capillary with a 1 μm thickness, are summed to determine the electric charge for each point. (b) The magnetic field generated by the moving RBCs and WBCs when the WBCs are located at points indicated by red circles. (c) The electromotive force (EMF) measured at the microcoil sensor located just above the capillary. Among peaks, those of greater amplitude are attributed mainly to WBCs, while the smaller peaks are mainly generated by moving RBCs. The electric charge, magnetic field, and EMF are zoomed in to, as depicted in (a-1), (b-1), and (c-1), respectively.
Electronics 09 00618 g004
Figure 5. The normalized peak-to-peak induced EMF measured at the microcoil located just above the capillary when changing (a) the capillary diameter and (b) the distance between the microcoil and the capillary.
Electronics 09 00618 g005
Table 1. Definitions of variables and values used in the magnetic microcoil for blood cell flowmetery.
VariableDefinitionValueUnit
D R Diameter of red blood cell7.2 [17][μm]
D W Diameter of white blood cell7.5 [μm]
C R B C Membrane capacitance of red blood cell1.5 [18][pF]
C W B C Membrane capacitance of white blood cell4.6 [19][pF]
V R B C Transmembrane potential of red blood cell−10 [20][mV]
V W B C Transmembrane potential of white blood cell−60 [21][mV]
v Velocity of blood1 [22][mm/s]
l B C s Distance between adjacent blood cells 3.4 × 10 2 [23][mm]
D c Diameter of capillary7.5[μm]
c N a + Concentration of N a + in blood plasma142 [24][mmol/L]
c K + Concentration of K + in blood plasma5 [24][mmol/L]
c M g + Concentration of M g + in blood plasma1.5 [24][mmol/L]
c C a 2 + Concentration of C a 2 + in blood plasma2.5 [24][mmol/L]
c C l Concentration of C l in blood plasma103 [24][mmol/L]
c H C O 3 Concentration of H C O 3 in blood plasma27 [24][mmol/L]
c H P O 4 2 Concentration of H P O 4 2 in blood plasma1 [24][mmol/L]
c S O 4 2 Concentration of S O 4 2 in blood plasma0.5 [24][mmol/L]
z N a + Valence of N a + 1N.A.
z K + Valence of K + 1N.A.
z M g 2 + Valence of M g 2 + 2N.A.
z C a 2 + Valence of C a 2 + 2N.A.
z C l Valence of C l −2N.A.
z H C O 3 Valence of H C O 3 −1N.A.
z H P O 4 2 Valence of H P O 4 2 −2N.A.
z S O 4 2 Valence of S O 4 2 −2N.A.