Article

Hardware in the Loop Implementation of the Oscillator-based Heart Model: A Framework for Testing Medical Devices

by
Chiara Di Mascio
and
Giambattista Gruosso
*
Dipartimento di Elettronica Informazione e Bioingegneria, Politecnico di Milano, I-20135 Milano, Italy
*
Author to whom correspondence should be addressed.
Electronics 2020, 9(4), 571; https://doi.org/10.3390/electronics9040571
Submission received: 28 February 2020 / Revised: 24 March 2020 / Accepted: 27 March 2020 / Published: 28 March 2020

Abstract

:
The hardware in the loop technologies allow to simulate physical models in combination with real devices in order to validate the behavior of the latter under different conditions, not easily reproducible in the real world. They are widely used in various industrial applications. In this work we want to extend the methodology to medical devices. These must interact with the patient to obtain the desired clinical result, however, during the development and validation phase of medical devices, the patient cannot be involved in the testing process. In this article the hardware in the loop methodology is proposed starting from a mathematical model of the heart, based on oscillators, that can be used to validate pacemakers or other medical devices.

1. Introduction

The development and validation of electronic devices, requires to perform a series of tests organized to solicit inputs and outputs with signals very similar to those of the real world. In recent years, hardware in the loop (HIL) [1,2,3,4] methodologies have been added to traditional testing technologies. These are based on the joint simulation of a physical model with a real device through appropriate interfaces [4,5]. The idea is to have a model of the real world or part of it that is simulated in real time by appropriate hardware simulators that interact with the system under test through analog or digital peripherals. These methodologies, born mainly for the aerospace and power electronics sector, are also extending to other electronic devices, especially for critical applications. Think for example of medical therapy devices that must interact with a person or part of a person [6,7,8]. During the development and validation phase of medical devices, the patient cannot be involved in the design process for several reasons including the fact that the pathology to be resolved must be induced in the patient just when the device is being tested, which is not easy to implement. Having a model that allows to simulate the desired pathologies when and how you want is of great support to the developer of the biomedical device control system. The original contribution of this paper is (in Figure 1 the main architecture of the paper is shown) to create a framework for the automatic testing of biomedical devices that must interact with the human heart (pacemakers, ECG analyzers, etc.) and be able to implement different models of heart. The method presented here, of the hardware in the loop to simulate a biological mechanism such as the human heart, is effective and innovative. In fact, it allows the close-to-reality reproduction of various conditions, without the involvement of the human being. The result is a powerful simulator, which is easy to utilize and user friendly, that, at the same time, is able to replay various situations, both physiological and pathological, thanks to the possibility of variation of the parameters in the simulation. The advantages of this in the clinical field are, due to the safety of this method; the ability to reproduce human functions without the involvement of humans and animals, the possibility of repeating the trial an infinite amount of times, the excellent cost–result compromise and the immediacy of real-time simulations that allows the reproduction of many conditions in a short amount of time. We started implementing several heart models taken from literature, as realistically as possible, on which some pathologies can be reproduced. Most of the models considered are based on oscillators that act as variable speed biomechanical pumps, such as those largely discussed in [9,10,11,12,13,14]. In this paper we decided to show only one of this based on implementation of a set equations originally developped by E. Ryzhii and M. Ryzhii in [14] and rearranged to be implemented in a Hardware in the Loop simulator Acting on the parameters of the oscillator it is possible to change the characteristic of the generated signal, enabling the simulation of different heart conditions (it could be controlled to exhibit tachycardia, bradycardia and atrial fibrillation) and also to take into account the variability due to the population characteristics [15]. The used model [14] is structured in two different parts: the first one describes the electrical conduction system of the heart, through the sino-atrial node (SN), the atrioventricular node (AV) and the His–Purkinje fibers (HP), the second part is focused on the resulting ECG. The electrical conduction system of the heart is described using the delay differential equations, where the time derivatives at the current time depend on the solution and possibly its derivatives at previous times. In our simulation, we did not use a delayed differential equation, and we instead had a delay in the zeta domain, which is typical of the block implementation inside the HIL simulator. The value of the variables of the equations will determine four currents, that will be added in the equations of the four waves constituting the ECG, that is described using complex ordinary differential equations (ODEs). Then, the parameters were varied to reproduce some cardiac diseases, in particular tachycardia, bradycardia and atrial fibrillation, as well as others. This part of the the model is constituted by an experimental work: an accurate analysis of the individual parameters in the electrical conduction system of the heart is done, to understand how they affect the shape of the ECG . The main findings are used to reproduce atrial fibrillation, tachycardia and bradycardia. The experimental setup has been implemented by means of a HIL simulator, to run both the physiological and pathological condition. The main application of this model is the validation of the pacemakers. Pacemakers normally have sensors to detect events directly in the heart tissue, such as atrial sense and ventricular sense. Using the information from the sensor, the pacemaker decides whether and when to generate a stimulus to the heart [16,17]. The test of device is done in physiological and pathological conditions: if the heart is simulated affected by bradycardia, the pacemaker produces the spikes and restores the normal rhythm; otherwise, if the rhythm of the simulated heart is physiological, the pacemaker is silent. This implementation has been proposed by us for the first time and allows the coding of two models (heart and pacemaker), taken from the literature for two real-time simulators, which are then connected and used to test the control algorithms present in the pacemaker. This last step allows one to verify the effectiveness of the model and to show a concrete application: in fact, the test of a pacemaker before its use is a crucial step that must be carried out for the safety of the patient and, thanks to the use of a HIL simulator, both safety and speed can be assured. The adopted model of the pacemaker, implemented on an embedded system (Figure 1), becomes an integrant part of the HIL framework. In this way, it is possible to create a system heart and pacemaker combination, presented for the first time, that can be tested under many different conditions, and effectively test the functionality and safety of an invasive tool such as this pacemaker. This paper is original as it proposes a model that can demonstrate the effectiveness of the HIL simulator and the innovation and the benefits that its use would bring to the biomedical sector.
The paper is organized as follows: in Section 2 the physiology of the heart is described and the main equations taken from [14] are reported; in Section 3 an analysis of the effect of the model parameters on reproducing the diseases and our interpretation are presented; in the Section 4 our original hardware in the loop implementation is described, and it is applied, in Section 5 to the validation of a pacemaker closing the loop, in what is an original and unpublished approach. Finally, the conclusions are synthesized in Section 6 .

2. Physiology of the Heart: The State of the Art of the Mathematical Model

The heart is one of the most important organs of the body and it is one of the most studied ones. Its behaviour is the result of a smart electrical conduction system: in fact, it is usually able to guarantee a mechanical operation during all life of the individual. It can be compared to an oscillator that acts as a biomechanical pump. The process of electrical signal’s conduction starts in the Sino-Atrial (SN) node, that is placed in the right atrium at the superior vena cava. When the signal propagates through the atria, it produces a contraction. Then, the electrical pulse reaches the atrioventricular node (AV), that sends the impulse down to the lower heart’s chambers, the ventricles. The ventricles, in turn, contract and pump the blood. At the end of this process, the SN node sends another signal to the atria, and the cycle starts again.
The process over described is the generation of a heartbeat. The propagation of the pulse from the AV node to the ventricles is guaranteed by His Purkinje complex [18], which divides the signal in two branches: one branch goes to the left ventricle, and the other one goes to the right. After each electrical excitation (depolarization), the cardiac tissue starts a process of recovery (repolarization), to prepare the cardiac muscle for the next electrical stimulation. The development of dynamical models to produce ECG signals has been the subject of many research efforts. In this work, the method of FitzHugh–Nagumo [19] improved by E. Ryzhii and M. Ryzhii in [14] will be used. The reason for this choice is that the latter approach is one of the most complete and detailed available. It is structured in two parts: the first considers the main pacemakers, SN node, AV node and HP system and the second one describes both the atrial and ventricular muscles, through a system of eight unknowns that contribute to represent the main waves of ECG. A more detailed model gives a higher possibility to identify the parameters that are present in the main diseases and to understand their origin and their localization. The model consists of:
  • A voltage variable that allows regenerative self-excitation through a positive feedback. It is a cubic term and it represents the non linearity of the system;
  • A recovery variable, that provides a negative feedback. It is slower and it is the linear part of the system.
The mathematical model of the electrical conduction system of the heart describes all three natural pacemakers by a system of modified van der Pol’s equations with unidirectional time-delay velocity coupling as described in [11,12,13,14].
The first system represents the electrical activity of SN:
x 1 ˙ = y 1 y 1 ˙ = a 1 y 1 ( x 1 u 11 ) ( x 1 u 12 ) f 1 x 1 ( x 1 + d 1 ) ( x 1 + e 1 )
The second system represents the electrical activity of AV:
x 2 ˙ = y 2 y 2 ˙ = a 2 y 2 ( x 2 u 21 ) ( x 2 u 22 ) f 2 x 2 ( x 2 + d 2 ) ( x 2 + e 2 ) + K S A A V ( y 1 τ S A A V y 2 )
The third system represents the electrical activity of HP:
The parameters present in the equations are:
  • Damping coefficients for the pacemaker, a 1 = 40 , a 2 = 50 , a 3 = 50 ;
  • Parameters defining the amplitude of a pulse, f 1 = 22 , f 2 = 8.4 , f 3 = 1.5 ;
  • Parameters changing the rest state and dynamics, d 1 = 3.0 , d 2 = 3.0 , d 3 = 3.0 ;
  • Parameters controlling the hyper-polarization of the excitation variable, e 1 = 3.5 , e 2 = 5.0 , e 3 = 12.0 ;
  • Parameters controlling excitation threshold, u 11 = 0.83 , u 21 = 0.83 , u 31 = 0.83 ;
  • Parameters controlling excited state, u 12 = 0.83 , u 22 = 0.83 , u 32 = 0.83
  • Coupling coefficients K S A A V = 22 , K A V H P = 22 .
The equations are delayed differential equations (DDEs) with constant delays. The initial conditions are set equal zero; the delay is τ S A A V = τ A V H P = 0.092 for the normal rhythm.
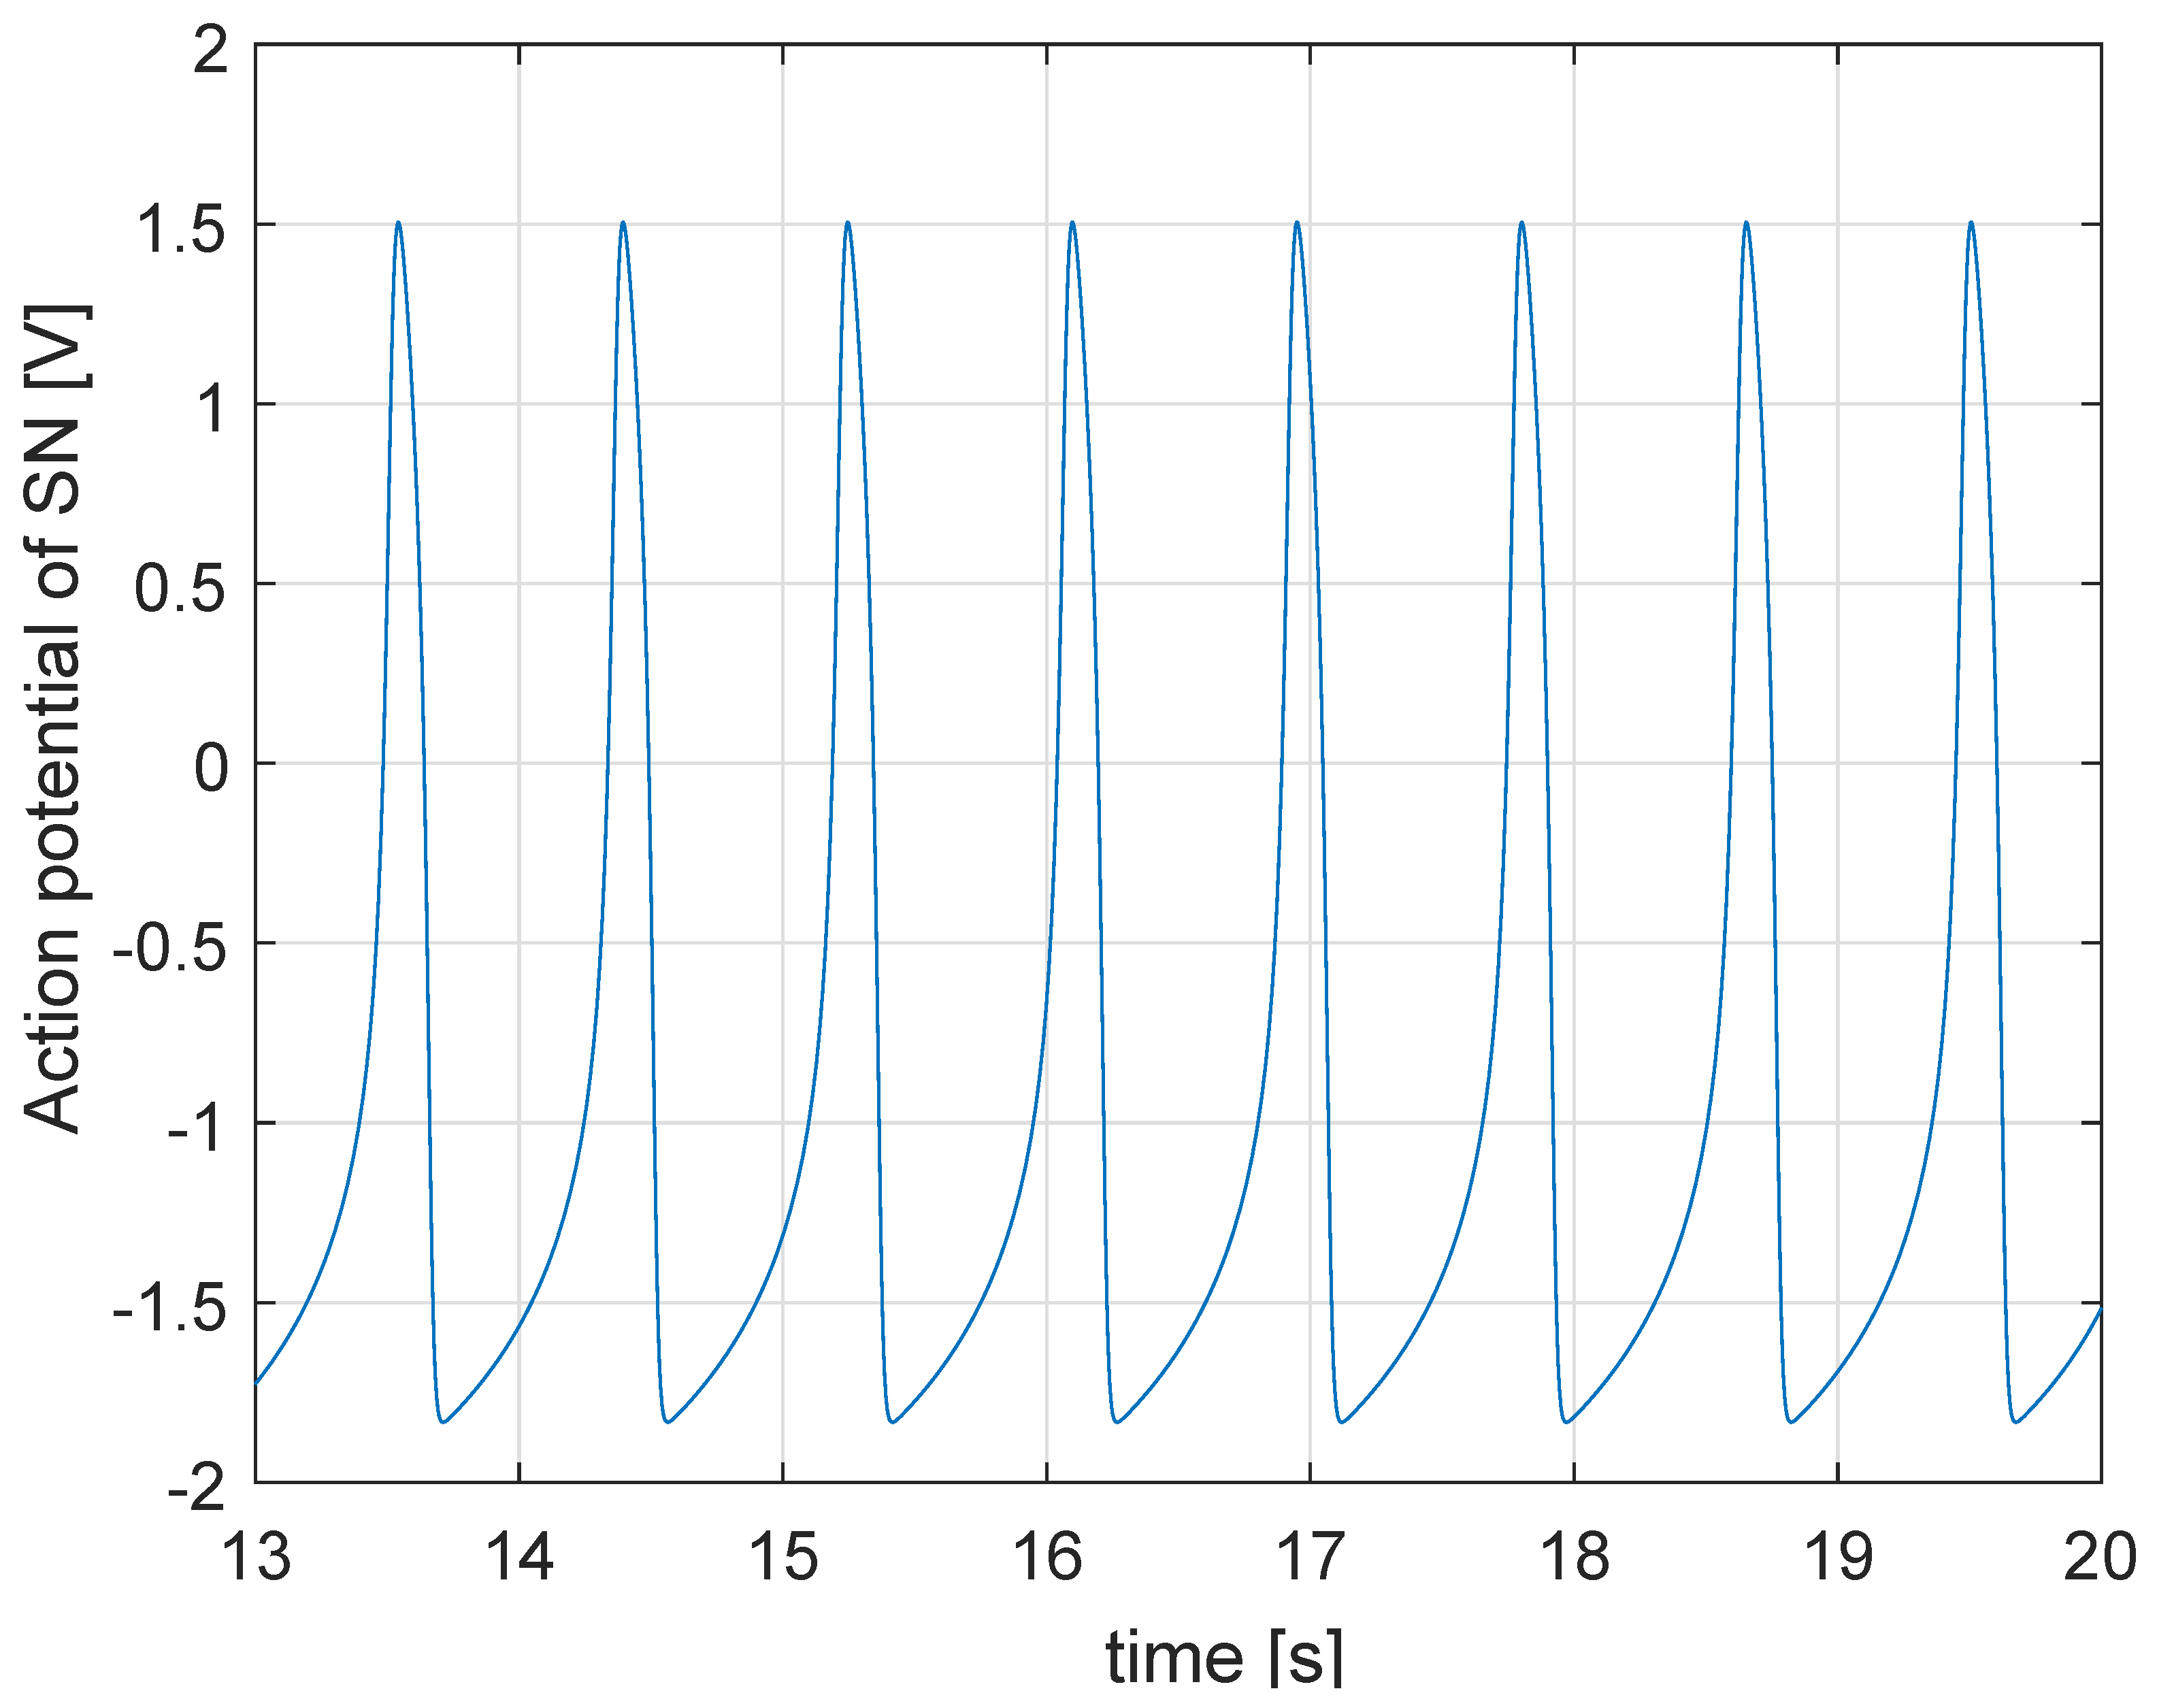
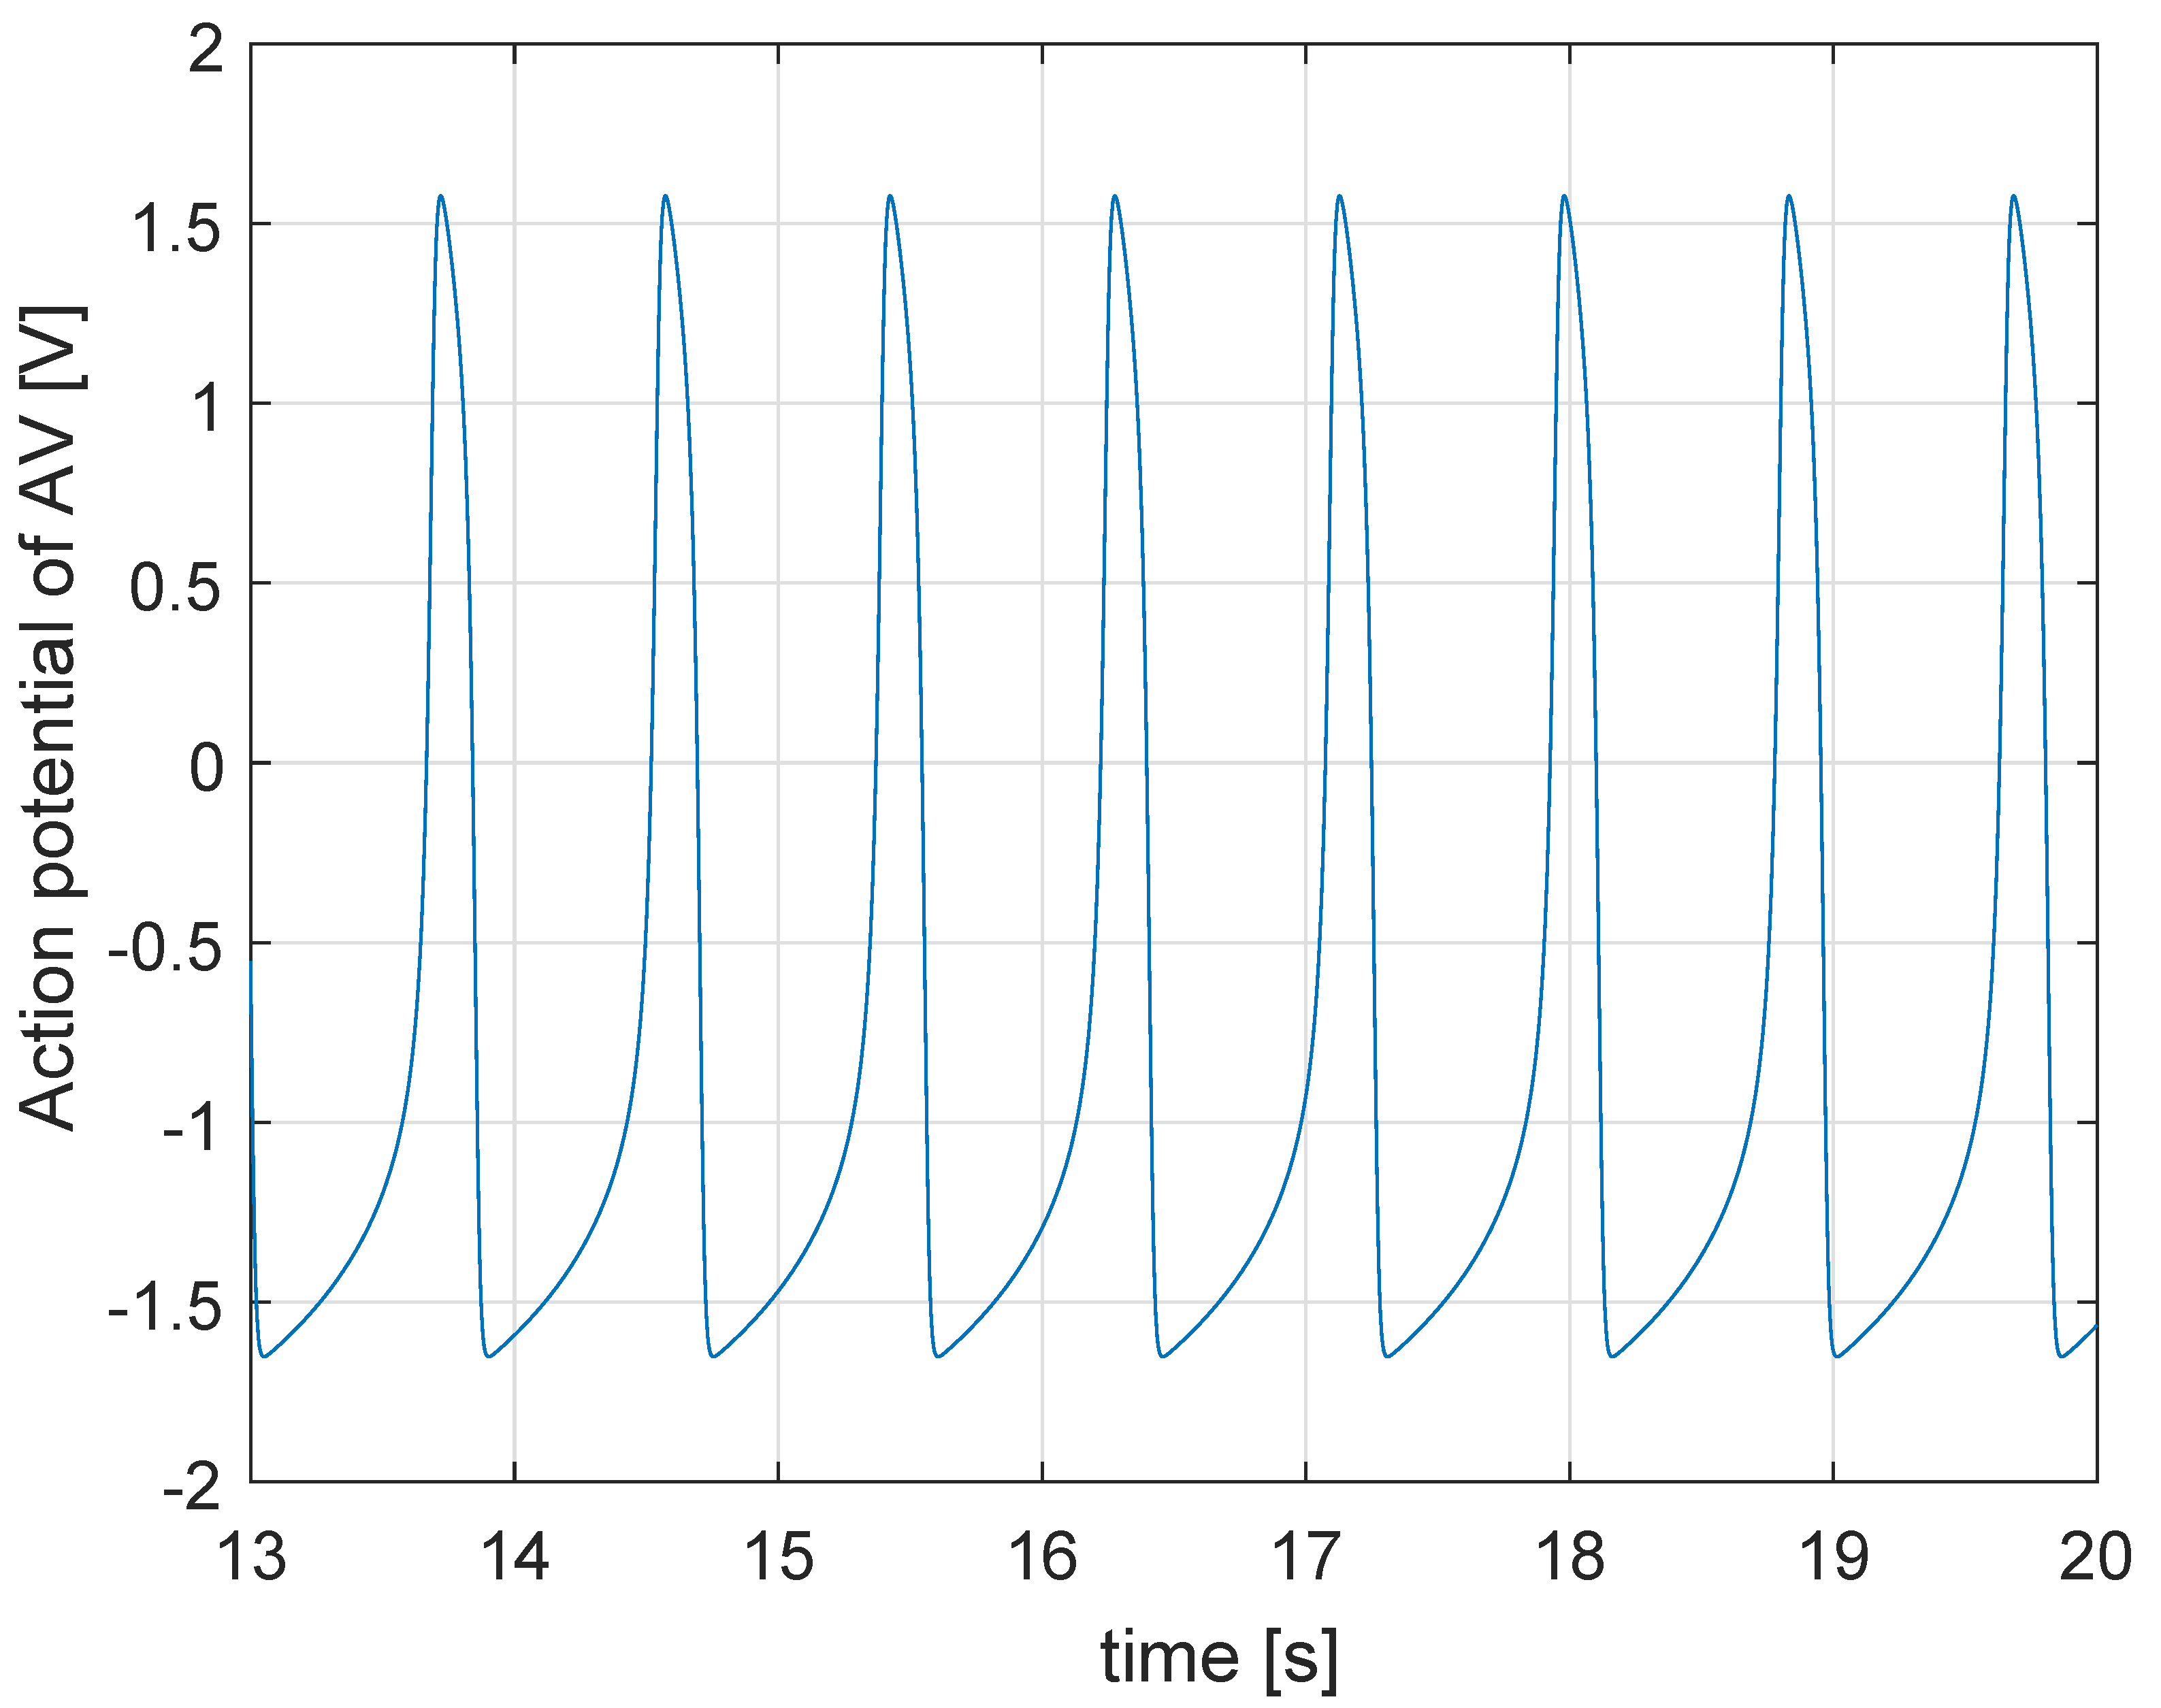
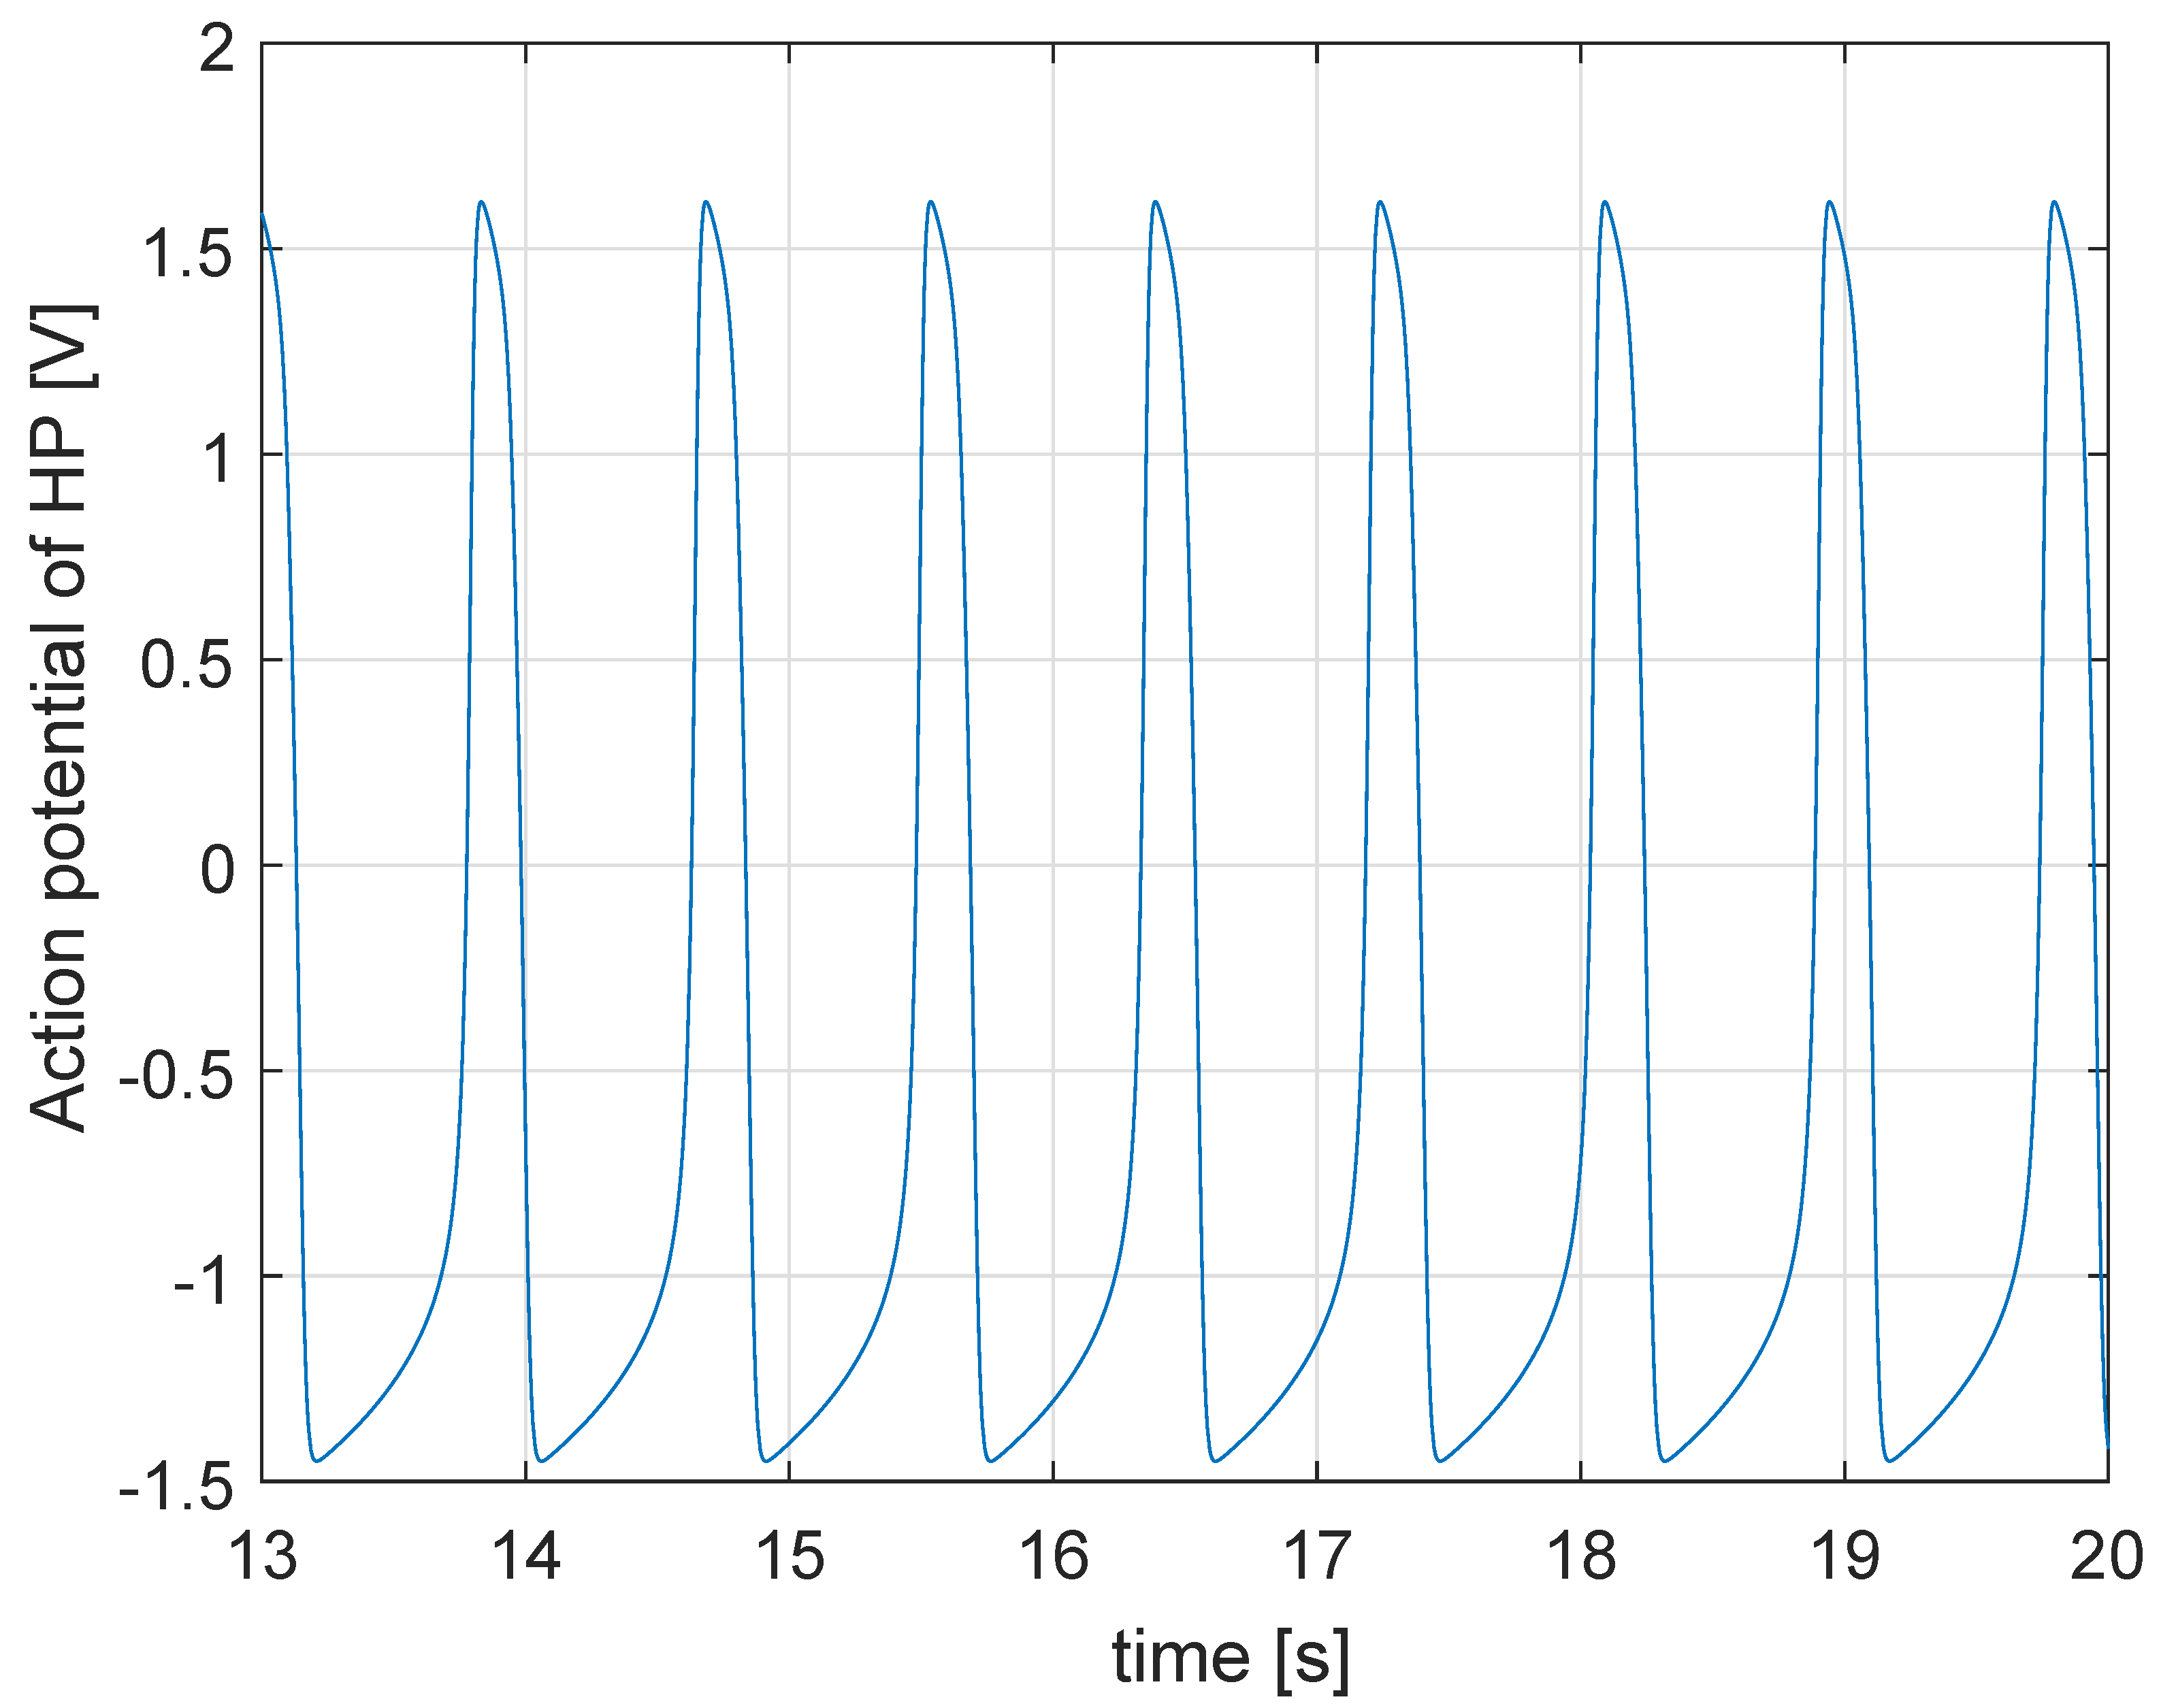
The representation of action potentials of the uncoupled pacemakers firing at their intrinsic rates is shown in the following figures: Figure 2 represents the action potential in sinoatrial node, Figure 3 in atrioventricular node and Figure 4 in His–Purkinje.
The second system of equations represents the ECG’s waves.Using the quiescent excitable FHN model [14], the depolarization and repolarization processes in cardiac muscles are described as a system of four sets of ordinary differential equations.
x 3 ˙ = y 3 y 3 ˙ = a 3 y 3 ( x 3 u 31 ) ( x 3 u 32 ) f 3 x 3 ( x 3 + d 3 ) ( x 3 + e 3 ) + K A V H P ( y 2 τ A V H P y 3 )
  • P wave:
    z 1 ˙ = k 1 ( c 1 z 1 ( z 1 w 11 ) ( z 1 w 12 ) b 1 v 1 d 1 v 1 z 1 + I A T D e ) v 1 ˙ = k 1 h 1 ( z 1 g 1 v 1 )
  • Ta wave:
    z 2 ˙ = k 2 ( c 2 z 2 ( z 2 w 21 ) ( z 2 w 22 ) b 2 v 2 d 2 v 2 z 2 + I A T R e ) v 2 ˙ = k 2 h 2 ( z 2 g 2 v 2 )
  • QRS complex:
    z 3 ˙ = k 3 ( c 3 z 3 ( z 3 w 31 ) ( z 3 w 32 ) b 3 v 3 d 3 v 3 z 3 + I V N D e ) v 3 ˙ = k 3 h 3 ( z 3 g 3 v 3 )
  • T wave
    z 4 ˙ = k 4 ( c 4 z 4 ( z 4 w 41 ) ( z 4 w 42 ) b 4 v 4 d 4 v 4 z 4 + I V N R e ) v 4 ˙ = k 4 h 4 ( z 4 g 4 v 4 )
The parameters that are used in the equations of ECG waves are taken from [14] and reported in the following:
  • Scaling coefficients: k 1 = 2 x 10 3 , k 2 = 4 x 10 2 , k 3 = 10 4 , k 4 = 2 x 10 3 ;
  • Parameters defining the amplitude of a pulse: c 1 = 0.26 , c 2 = 0.26 , c 3 = 0.12 , c 4 = 0.1 ;
  • Parameters changing the rest state and dynamics: b 1 = 0.0 , b 2 = 0.0 , b 3 = 0.015 , b 4 = 0.0 ;
  • Parameters controlling the hyperpolarization of the excitation variable: d 1 = 0.4 , d 2 = 0.4 , d 3 = 0.09 , d 4 = 0.1 ;
  • Parameters representing excitability and controlling the abruptness of activation and the duration of the action potential: h 1 = 0.04 , h 2 = 0.04 , h 3 = 0.08 , h 4 = 0.08 ;
  • Parameters changing the rest state and dynamics: g 1 = 1.0 , g 2 = 1.0 , g 3 = 1.0 , g 4 = 1.0 ;
  • Parameters controlling excitation threshold: w 11 = 0.13 , w 21 = 0.19 , w 31 = 0.12 , w 41 = 0.22 ;
  • Parameters controlling excited state: w 12 = 1.0 , w 22 = 1.0 , w 32 = 1.1 , w 42 = 0.8 ;
  • Coupling coefficient for P wave: K A T D e = 4 x 10 5 ;
  • Coupling coefficient for Ta wave: K A T R e = 4 x 10 5 ;
  • Coupling coefficient for QRS complex: K V N D e = 9 x 10 5 ;
  • Coupling coefficient for T wave: K V N R e = 6 x 10 5 .
The link between the two parts of the mathematical model is constituted by the terms I A T D e , I A T R e , I V N D e and I V N R e , that represent the ionic currents. In fact, in the second system, they assume different values depending on the signs of the unknowns of the first system.
The values of currents are:
  • I A T D e :
    0 , f o r y 1 0 K A T D e y 1 , f o r y 1 > 0
  • I A T R e :
    K A T R e y 1 , f o r y 1 0 0 f o r y 1 > 0
  • I V N D e :
    0 , f o r y 3 0 K V N D e y 3 , f o r y 3 > 0
  • I V N R e :
    K V N R e y 3 , f o r y 3 0 0 f o r y 3 > 0
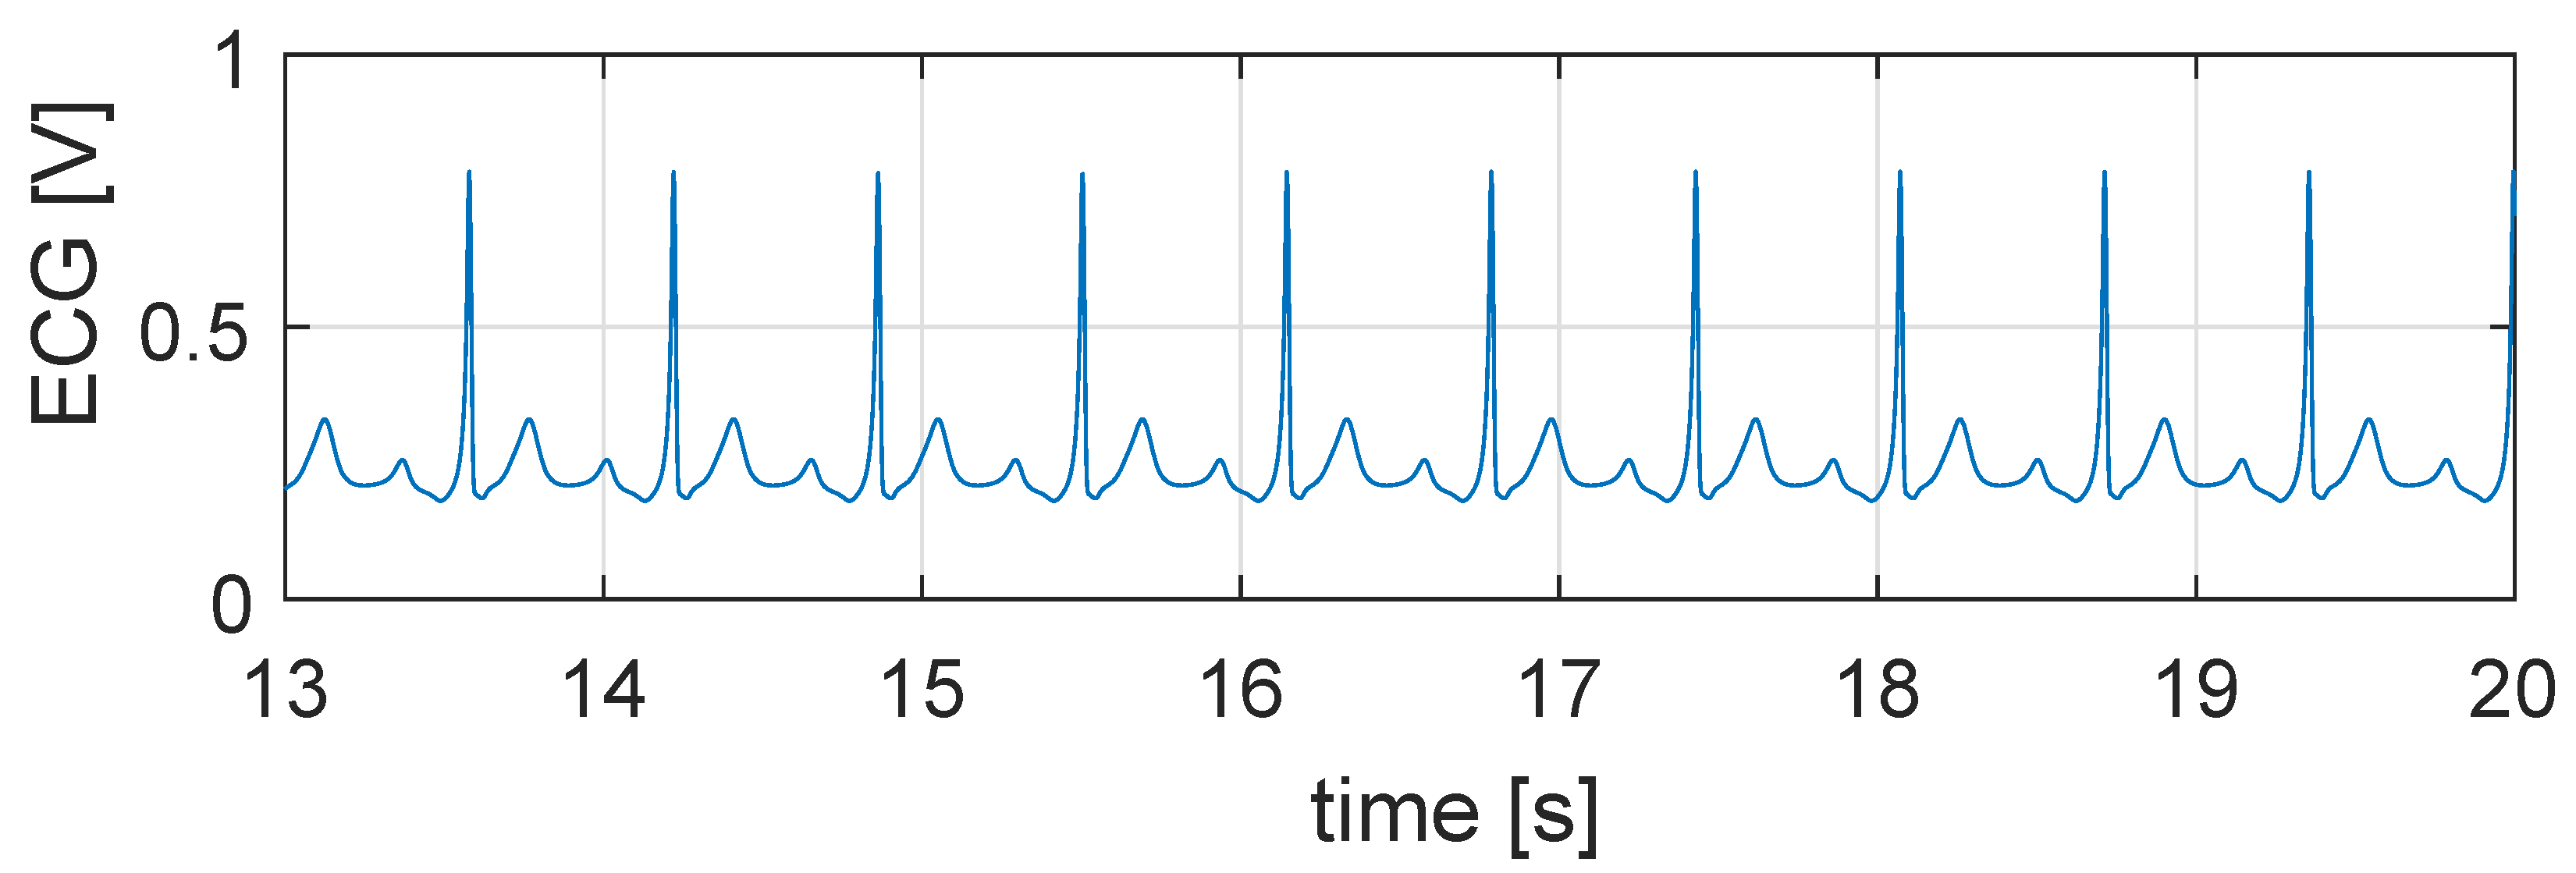
Total ECG is computed by combining the results of AT and VN muscles, described in the Equation (12)
E C G = z 0 + z 1 z 2 + z 3 + z 4
where z 0 is a constant value, equal, in this case, to 0.2 .
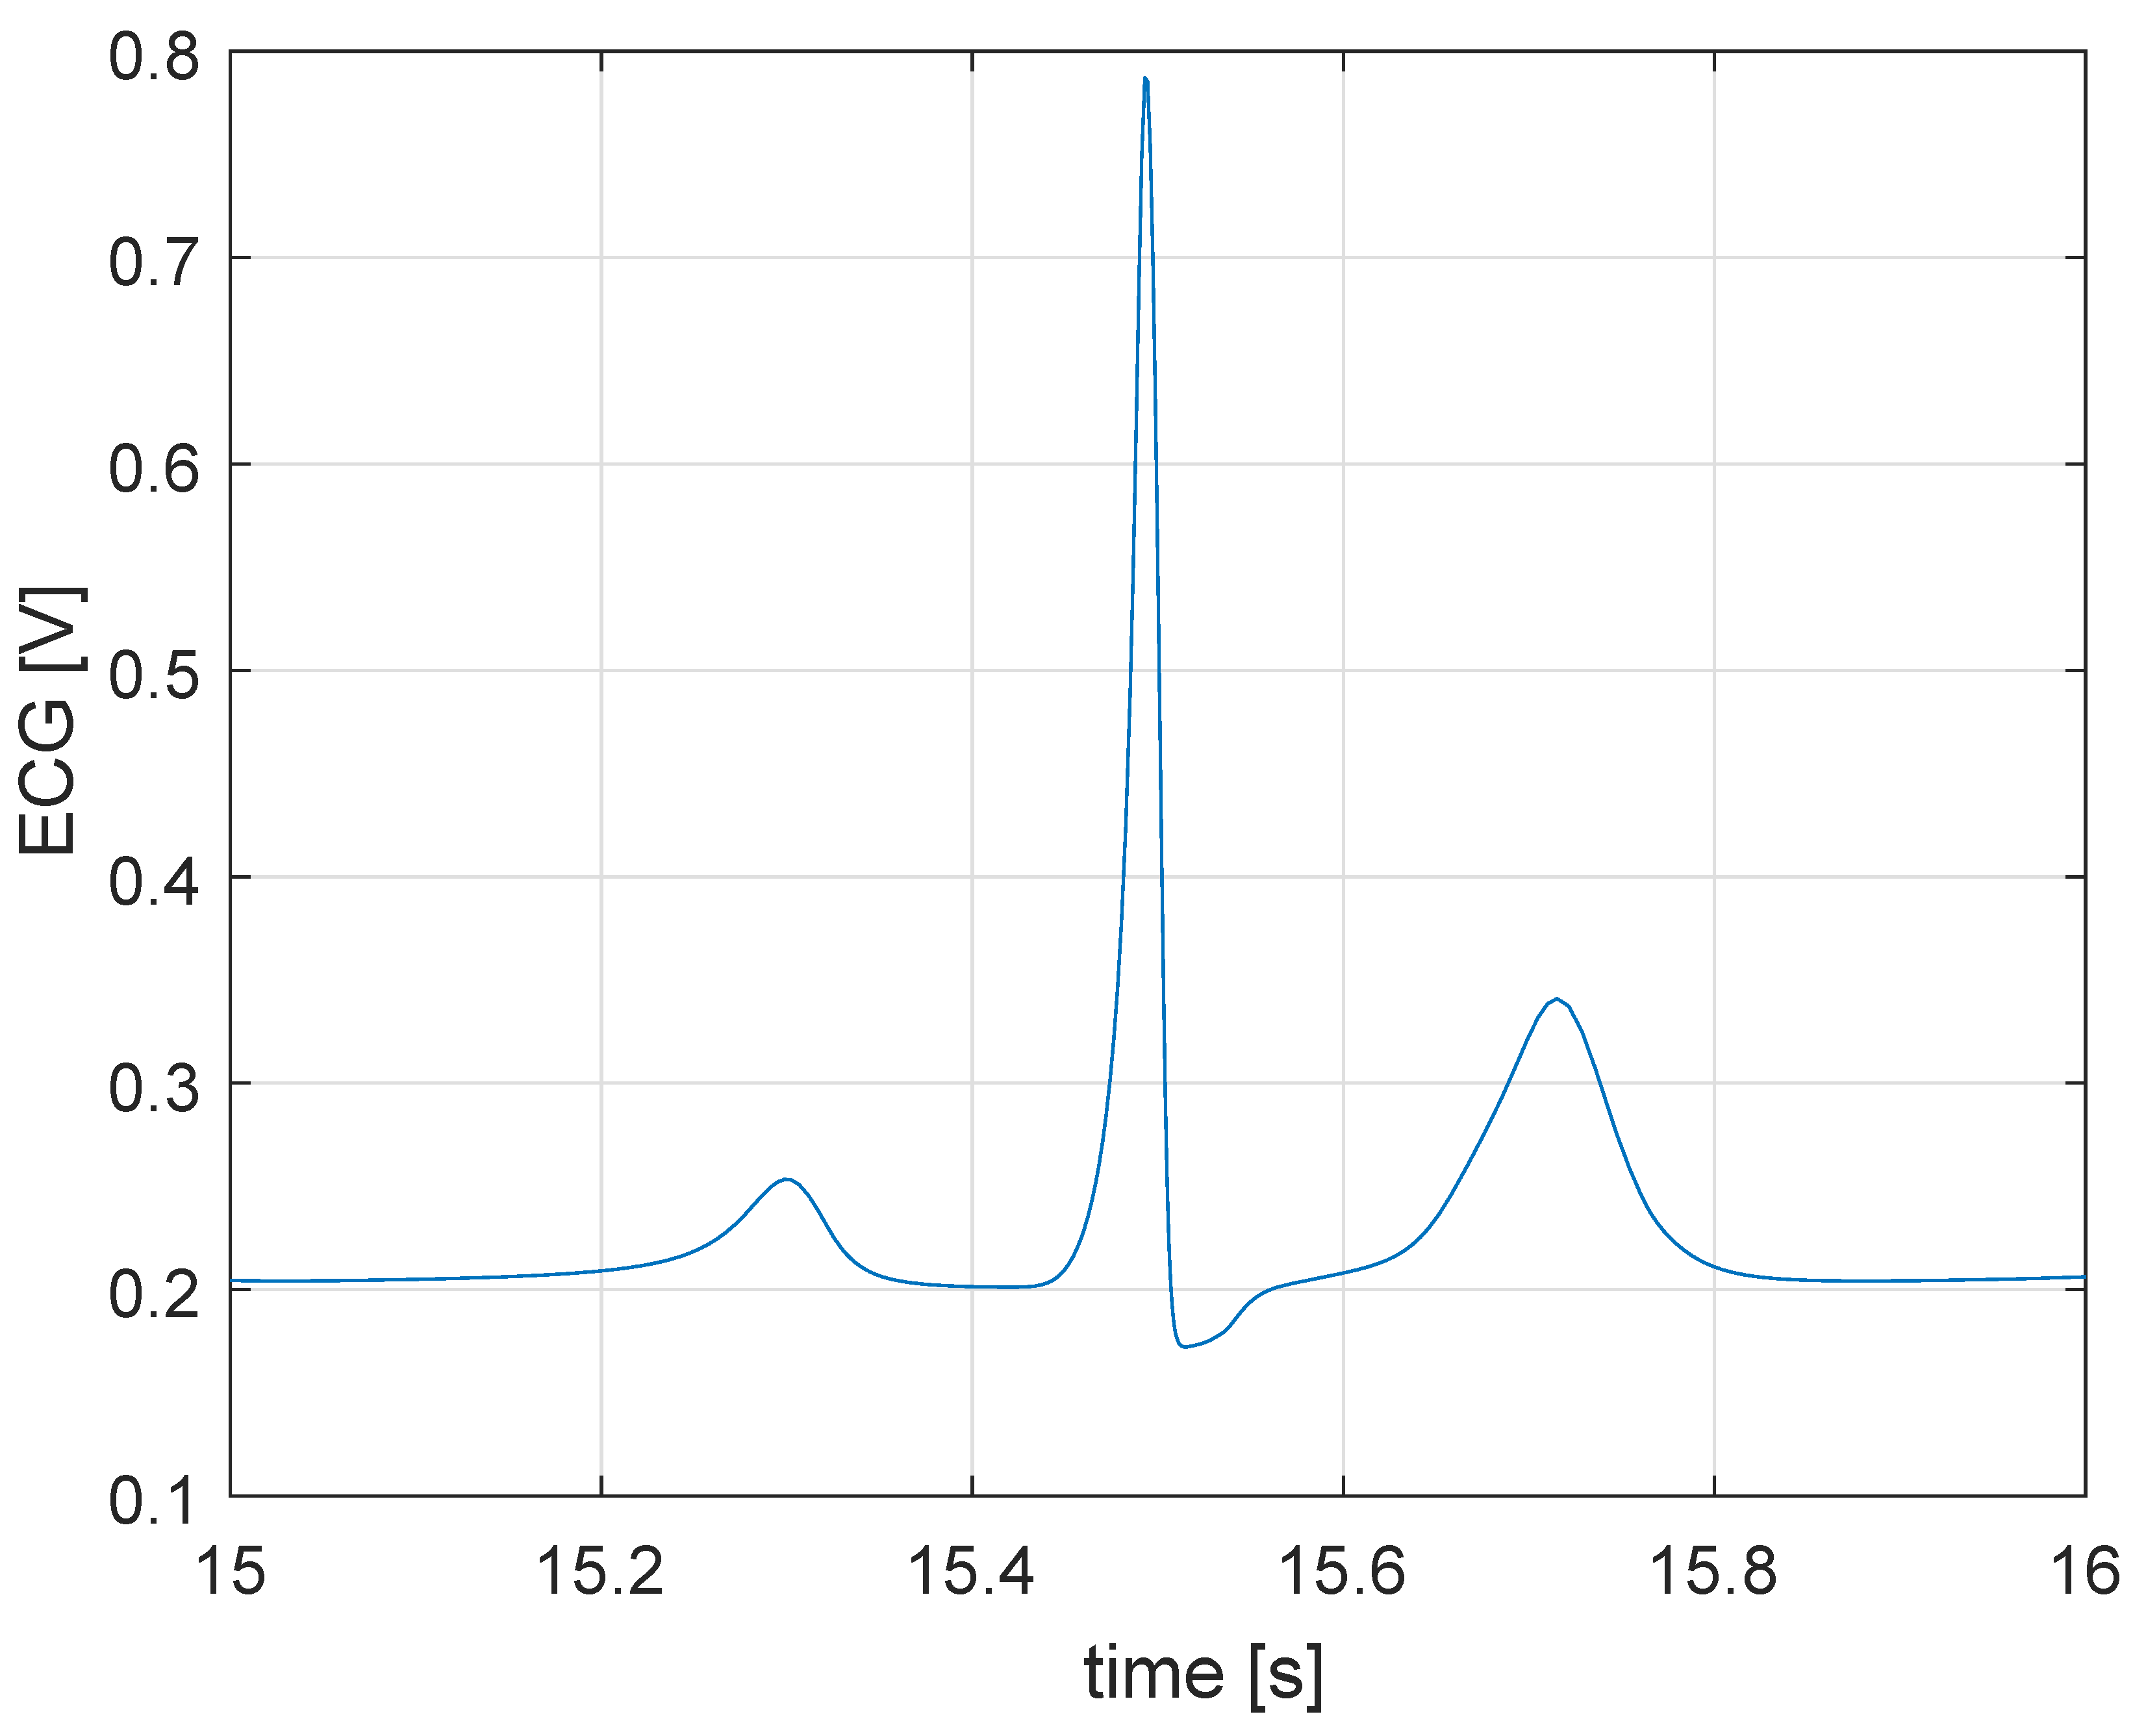
The resulting graph is shown in Figure 5: the value on x-axis indicates the time, expressed in seconds, while the value on y-axis indicates the voltage, expressed in voltss.

3. Analysis of the Diseases Detectable by an ECG

Testing a biomedical device mainly means testing its behaviour under physiological and pathological conditions. The model must be able to reproduce all these conditions by acting on appropriate parameters. At the same time these conditions do not happen in all people in the same way, so it is important to be able to vary the parameters according to this variability. The purpose of this section is to highlight the effect of the model’s parameters on certain pathologies, chosen as examples only. Future developments may extend the study to other pathologies. The data used in the simulation are obtained by a dataset available online [20,21]. It should be noted that although it is possible to reproduce exactly a certain pathology from the point of view of his ECG, we have taken care of reproducing its “rhythm”. As the device you want to validate is a pacemaker whose task is to recognize the distance between peaks. In future developments you will be able to identify exactly the parameters to reproduce a certain waveform to test other types of devices. Future studies must make an accurate analysis of the individual parameters in the electrical conduction system of the hehart, and understand how they affect the shape of the ECG; this is instrumental to understanding the pathology from a medical point of view.
The simulation is done for the unknows y 1 (action potentil of SN) y 2 (action potential of AV) and y 3 (action potential of HP) in the electrical conduction system of the heart.Thanks to this parameter’s analysis, it is possible to reproduce the tachycardia, the bradicardya and the atrial fibrillation.

3.1. Tachycardia

Tachycardia is a common type of heart rhythm disorder (arrhythmia) in which the heartbeats are faster than normal while at rest. Typically, a beat is around 70–80 beats per minute (bpm) in physiological rest condition becomes higher than 100 bpm (at rest) for sinus tachycardia or bigger 200–300 bpm (at rest) in other pathological conditions. To represent sinus tachycardia on the ECG, the main parameter that has to change is the parameter that controls the rate of pulses in SN node—the parameter f 1 . The higher this parameter, the higher the frequency of heartbeats.
The simulation (Figure 6) occurs considering f 1 = 35 without any other variations to the other parameters. The resulting ECG is faster than ECG in physiological condition, but it has, however, a regular rhythm; P waves are upright, consistent, and normal in morphology.

3.2. Bradycardia

Sinus bradycardia is a regular but unusually slow heart beat (50 beats/minute or less at rest). To simulate the effect that bradycardia has on an ECG, the parameter that has to be modified is f 1 , that controls the rate of pulses in SN node: lower it will be, slower will be the trend of ECG.
The simulation (Figure 7) occurs considering f 1 = 18 without any other variations to other parameters.

3.3. Atrial Fibrillation

Atrial fibrillation (AF) is an abnormal and irregular heart rhythm in which the electrical signals are generated chaotically throughout the upper atria (chambers) of the heart: in presence of AF, the sinoatrial node in the right atrium produces impulses that are disorganized, causing a irregular conduction of ventricular impulses that generate the heartbeat.
The record of ECG of a patient affected by AF is recognizable and it has particular differences from a physiological ECG. The main sign of atrial fibrillation is the absence of P waves in the ECG: they are replaced with the so called F waves, small irregular undulations that demonstrate the alteration of the beat. The irregular conduction of impulses to the ventricles causes irregular R–R intervals.
In the proposed model, to reproduce AF, P wave is deleted. As consequence, in the system of eight equations that describes ECG, the system of P wave is composed by two zeros ( z 1 ˙ = 0 , v 1 ˙ = 0 in the system 4).
The second thing to do is to make the horizontal tract irregular: f 3 , that controls the amplitude of pulsation in HP fiber, is reduced ( f 3 = 1) and the parameter a 3 , that is the damping coefficient for the pacemaker, is reduced too ( a 3 = 45), to prolong the swing. The last parameter modified is k 4 = 100 , to reduce the amplitude of T wave in the ECG. The result of these modification is shown in Figure 8.

4. Hardware in the Loop Model

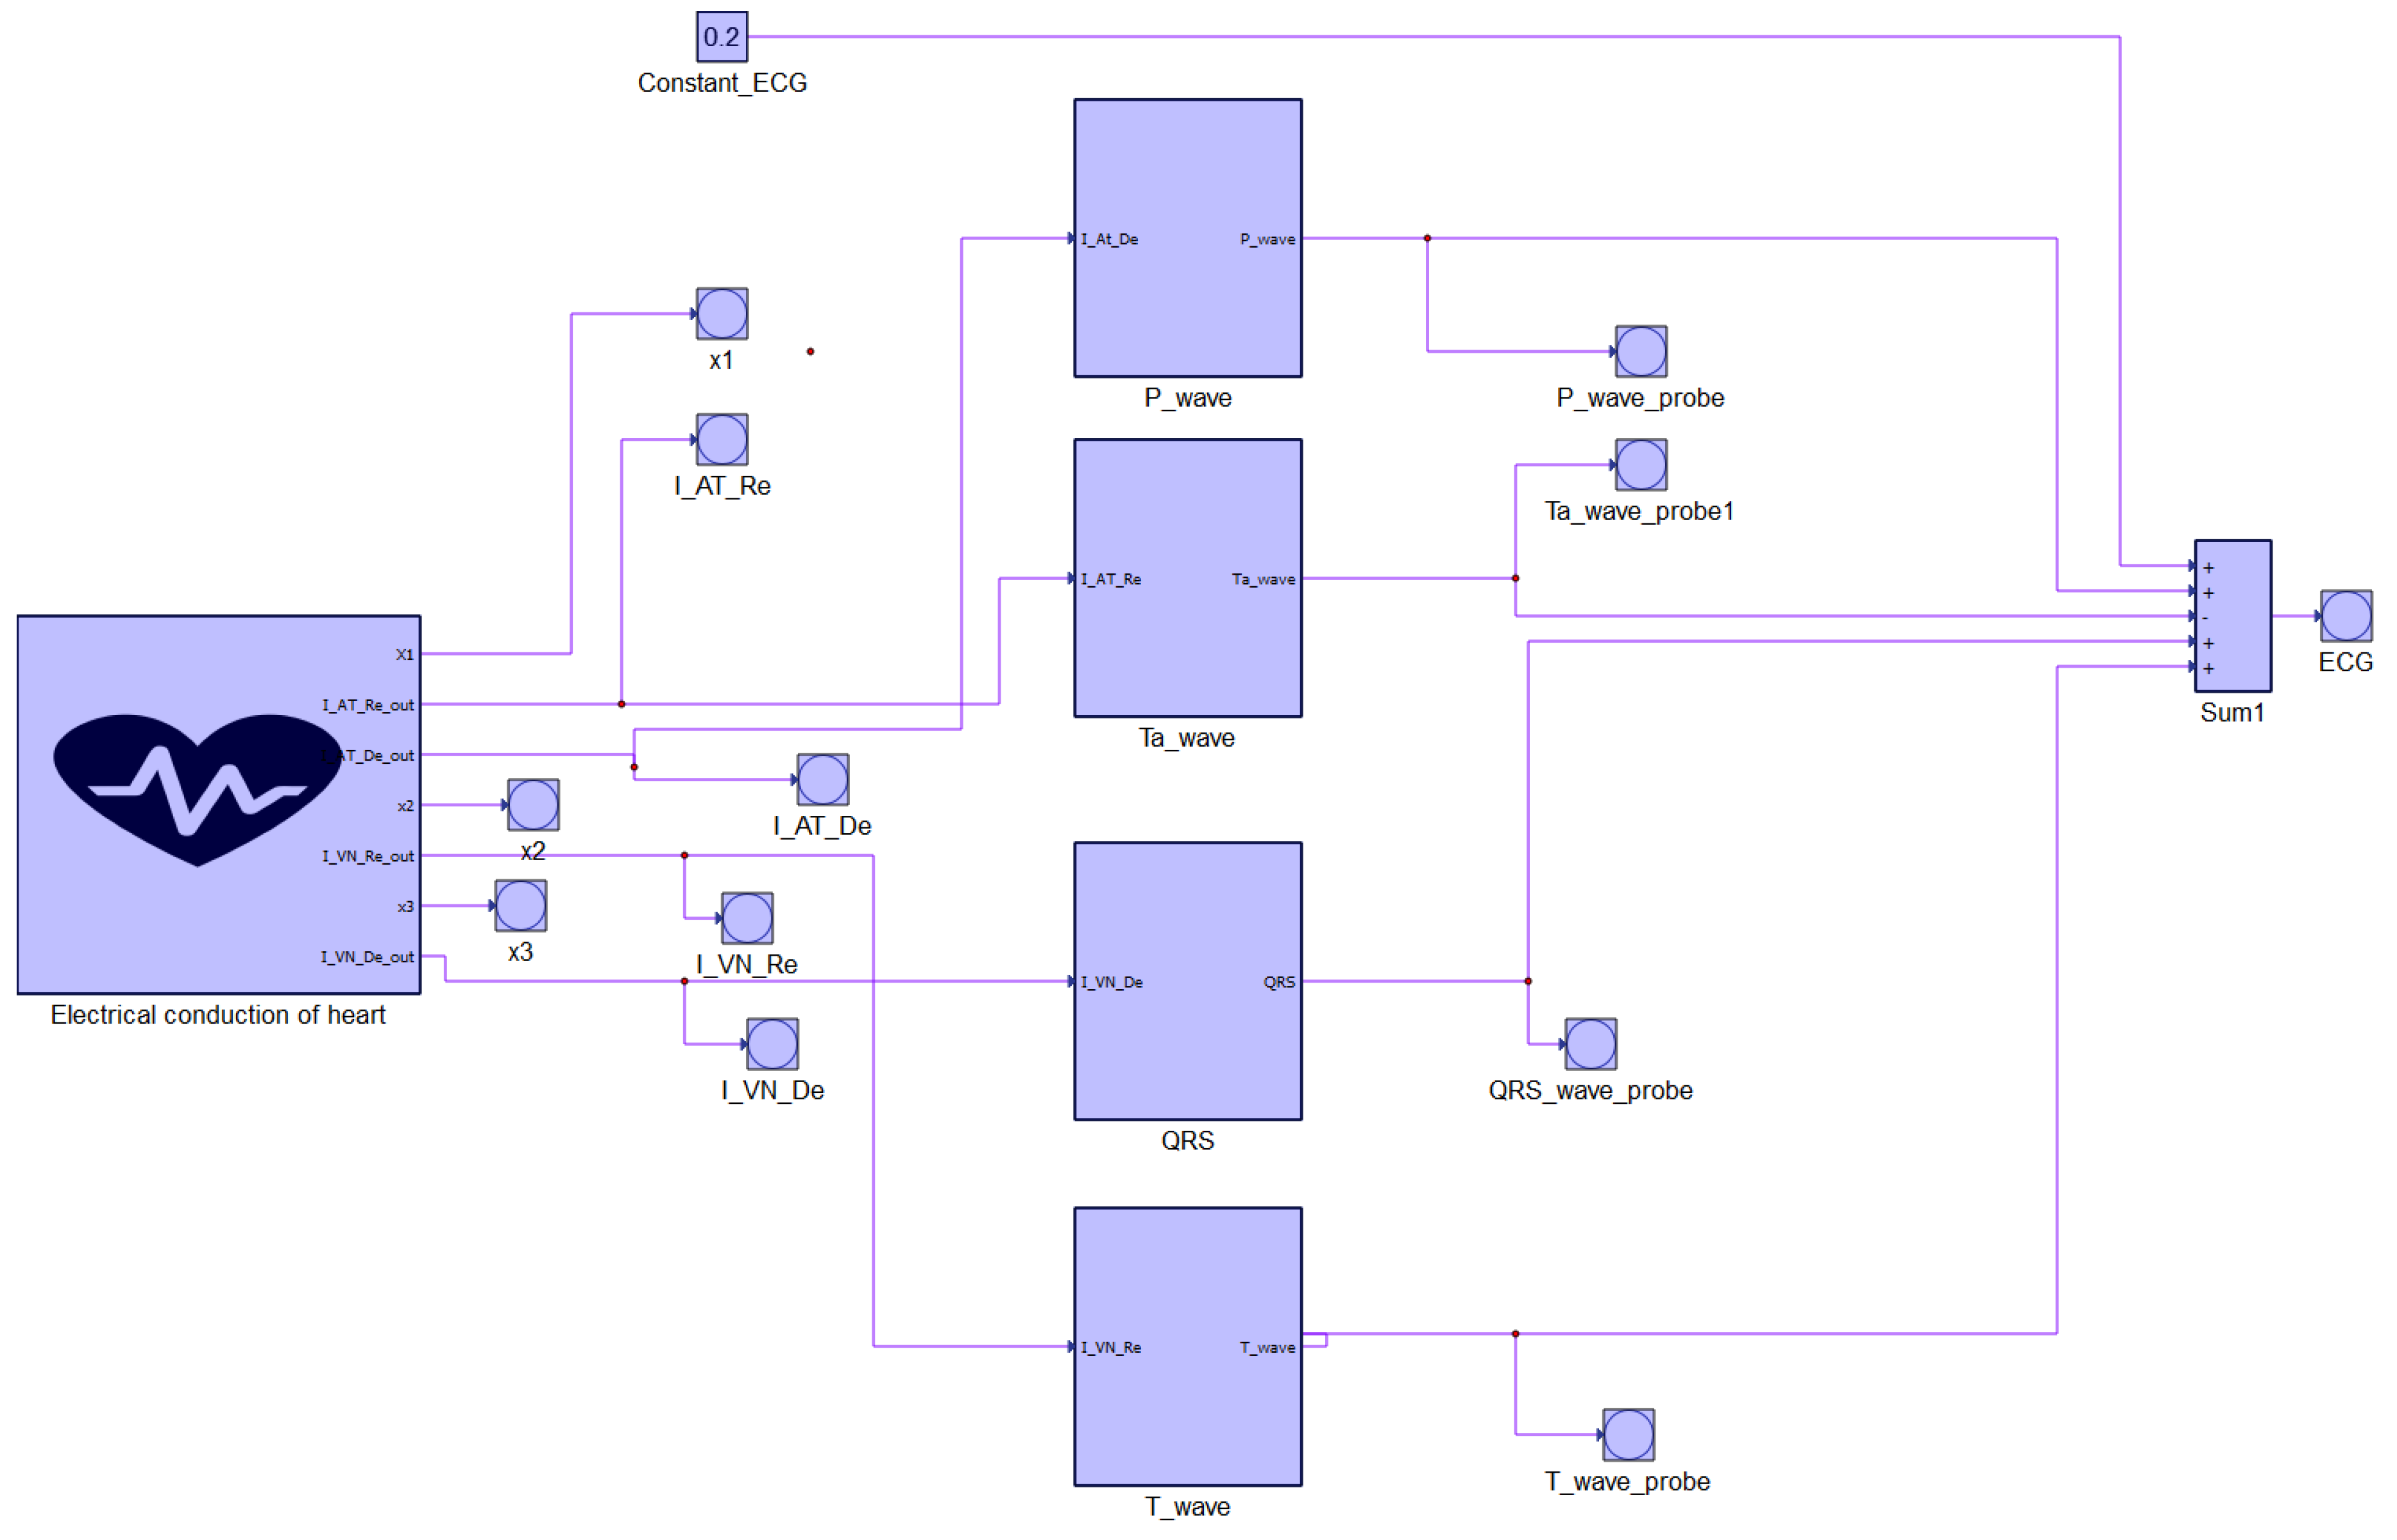
Finally the model obtained and described above can be implemented in a hardware in the loop simulator. These simulators consist of a software model of the simulated process and a physical interface to the therapy device. Hardware-in-the-loop configuration would guarantee the veracity of the simulation thanks to an interfacing with the real world [22]. The model is based on two part: the equations and a SCADA interface for varying the disease to be reproduced. The general model is shown in Figure 9. It is possible to divide the model in two main parts: the block on the left, that represents the electrical conduction system of the heart, and four blocks on the right, that are the waves of ECG. Every part has inside other blocks which interact among them to reproduce the equations of the model. Figure 10 shows a particular of the implementation of the dalayed equations.
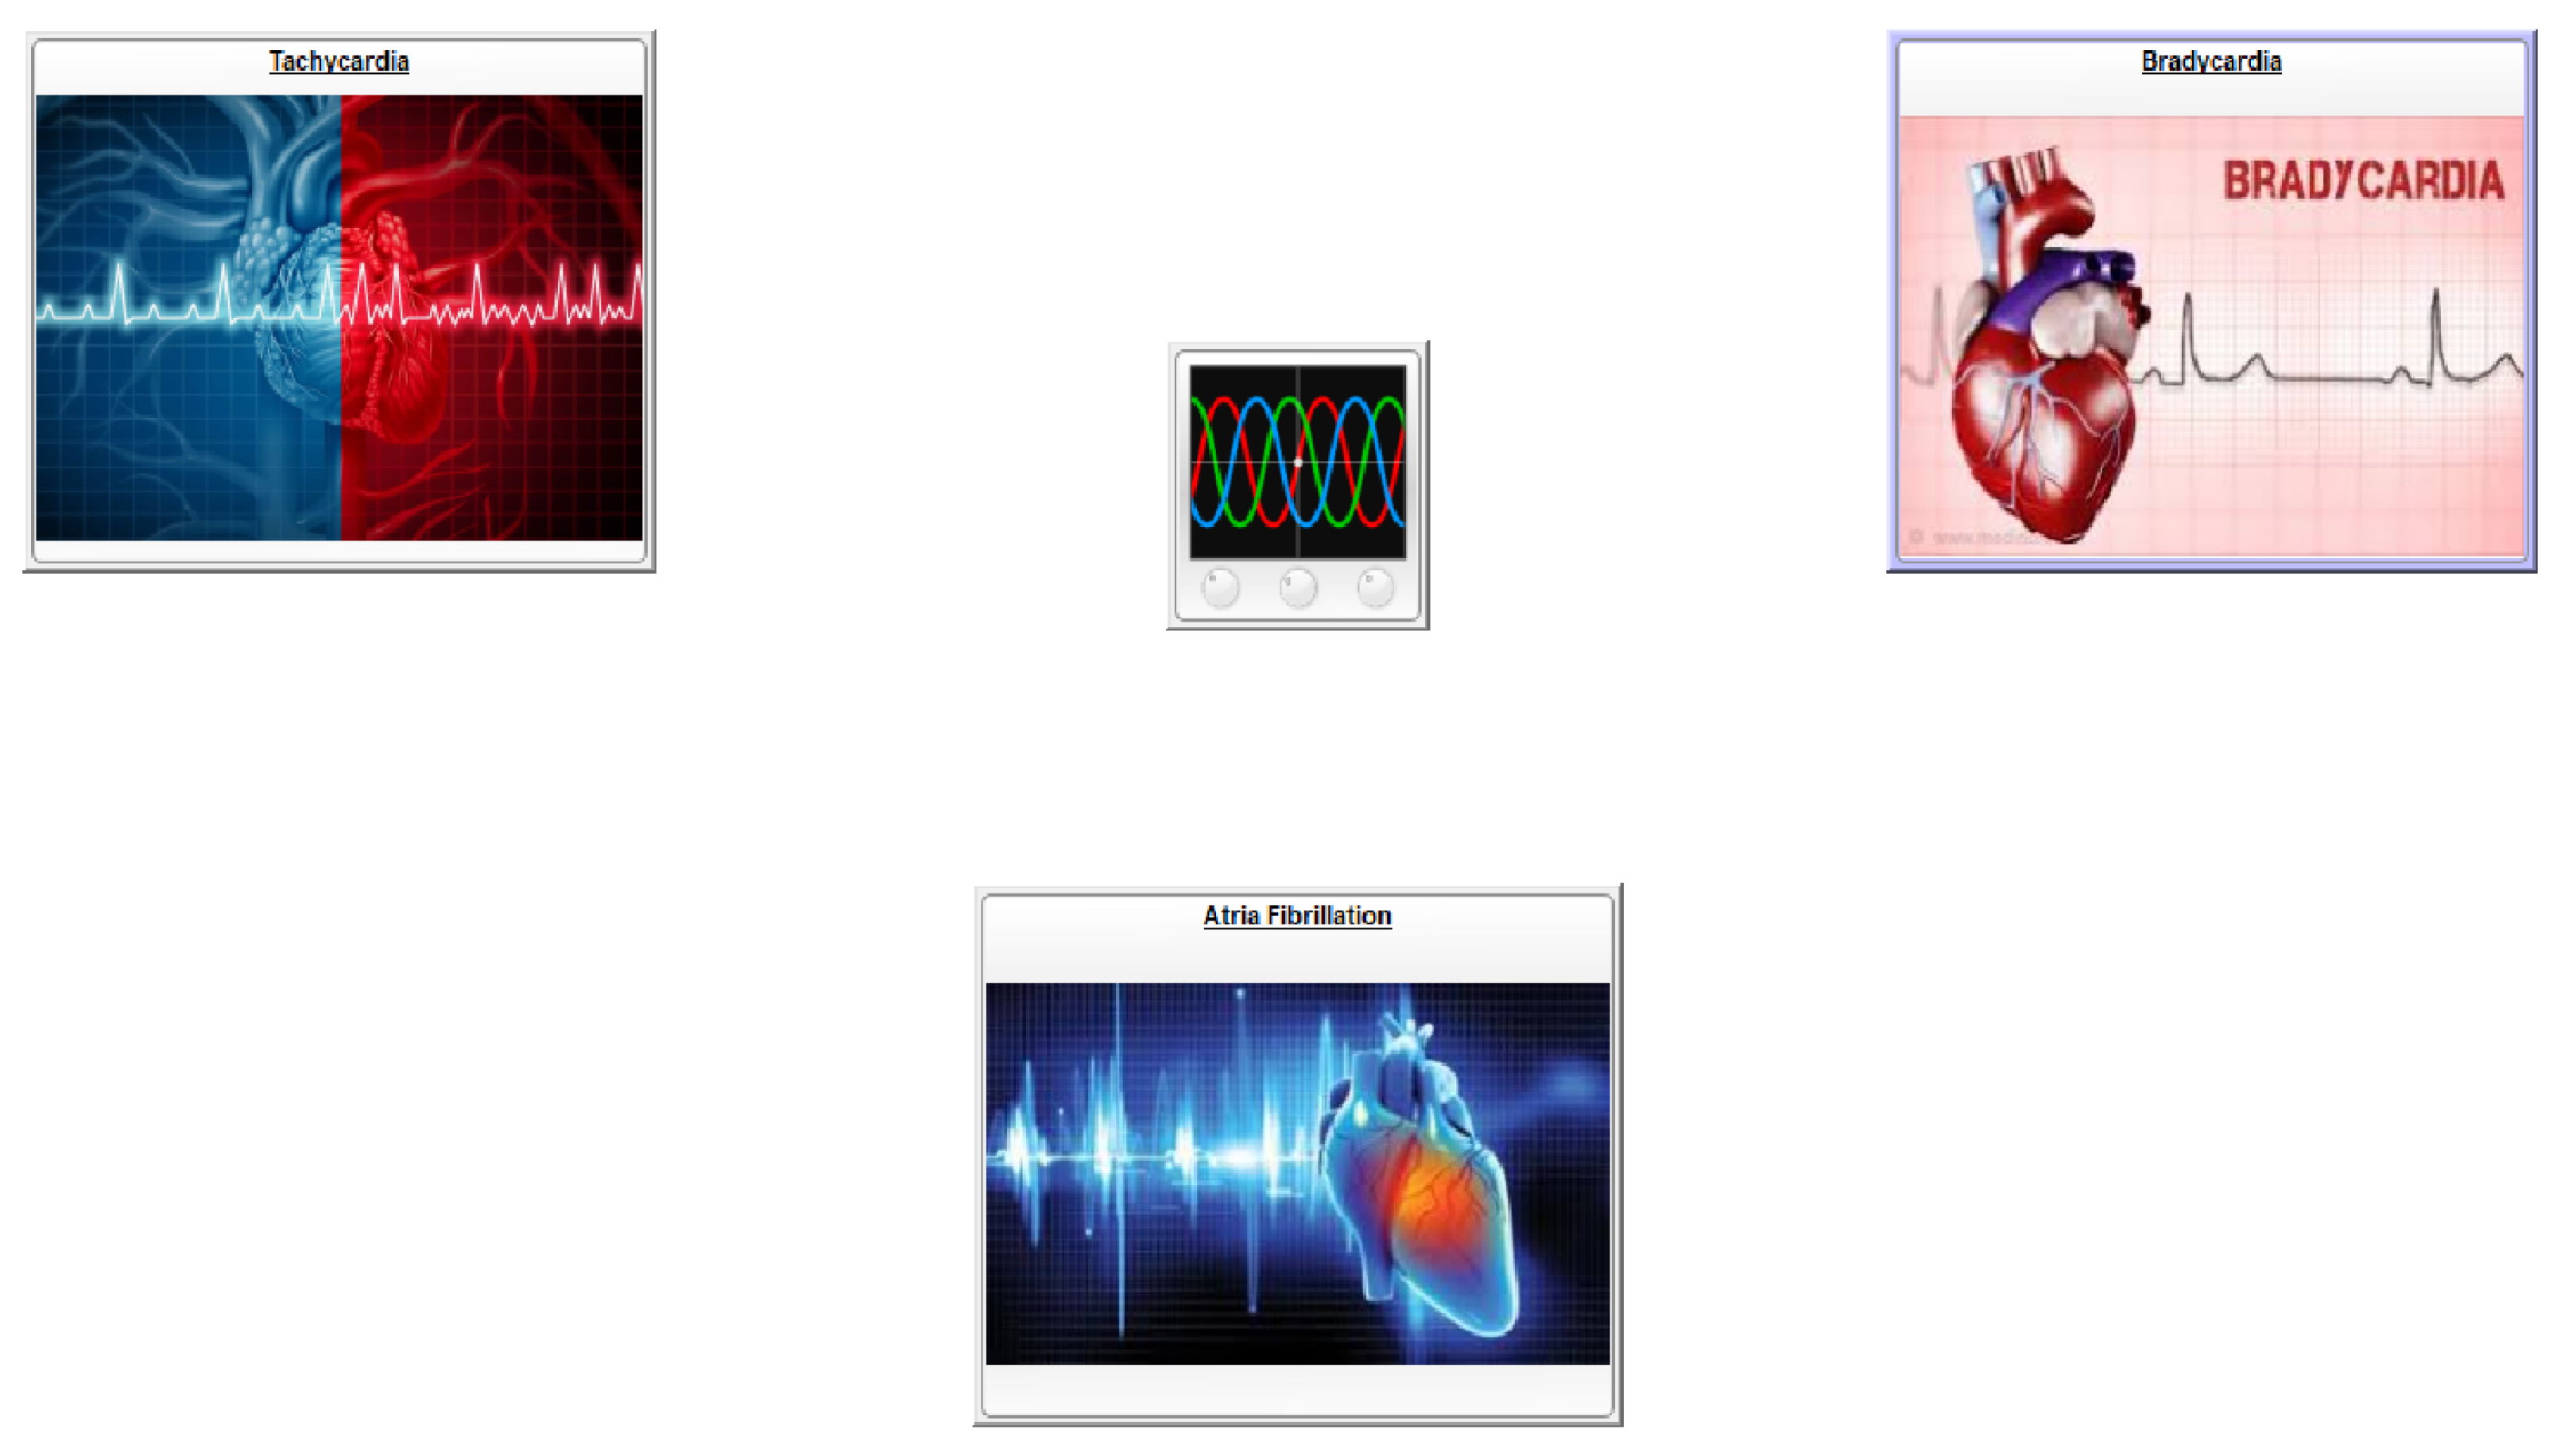
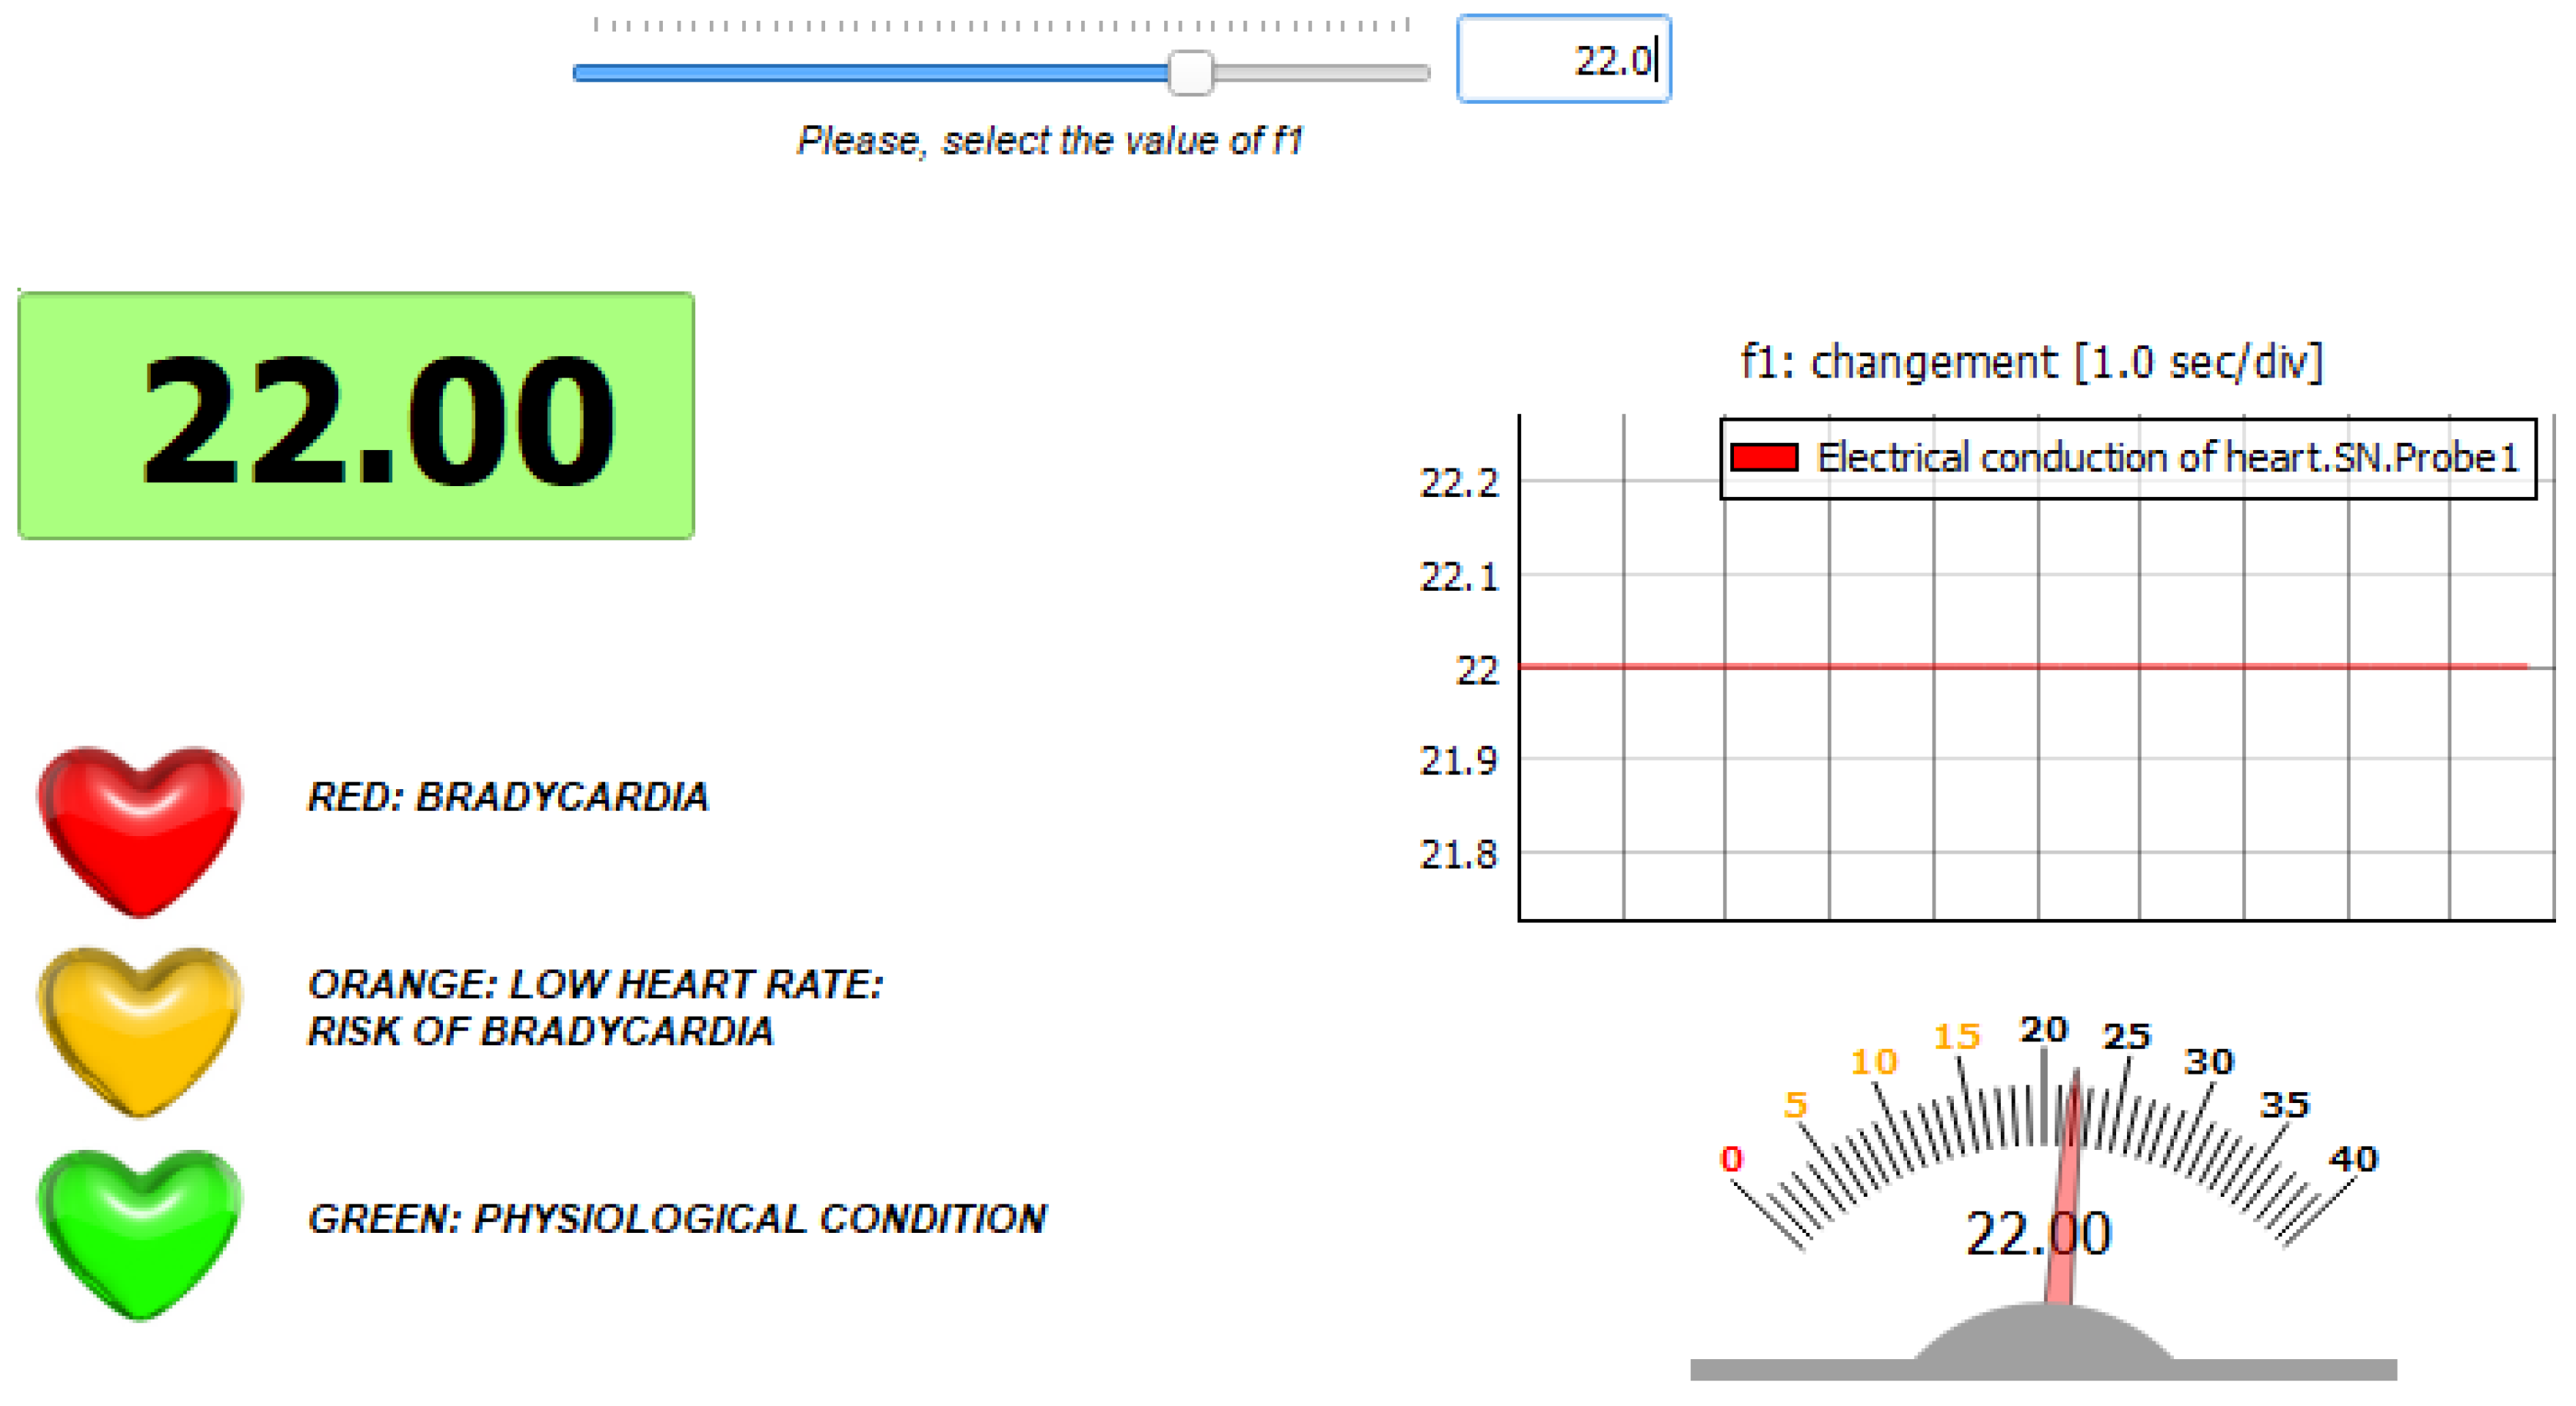
The model is linked to an external interface that allows to change the parameters reproducing heart’s diseases as output signals. Every input is linked to a probe, to record the changes in the wanted parameter and to make them immediately detectable from the user. The graphical interface (GI) is needful to introduce the diseases in the simulated ECG and it allows to the operator to modulate the parameters that cause the alterations in ECG’ s shape. In fact, the GI is organized in a central panel that allows to control the trend of ECG, and in three icons that constitute the possibility to introduce the three explored diseases: tachycardia, bradycardia and atrial fibrillation (Figure 11).
At the center of the interface there is a scope that allows to monitor the trend of ECG: the operator, with a simple click, can control the track and find the presence or absence of some diseases. The user can, moreover, choose the time of record before enabling the trigger. In fact, after the simulation starts running, the operator can select when to start to explore the resulting ECG and the duration of the record.
There are three panels around the scope: if the user clicks on a panel, they enter the model of the selected disease and can make some variations to the parameters to accentuate or diminish the state of disease.
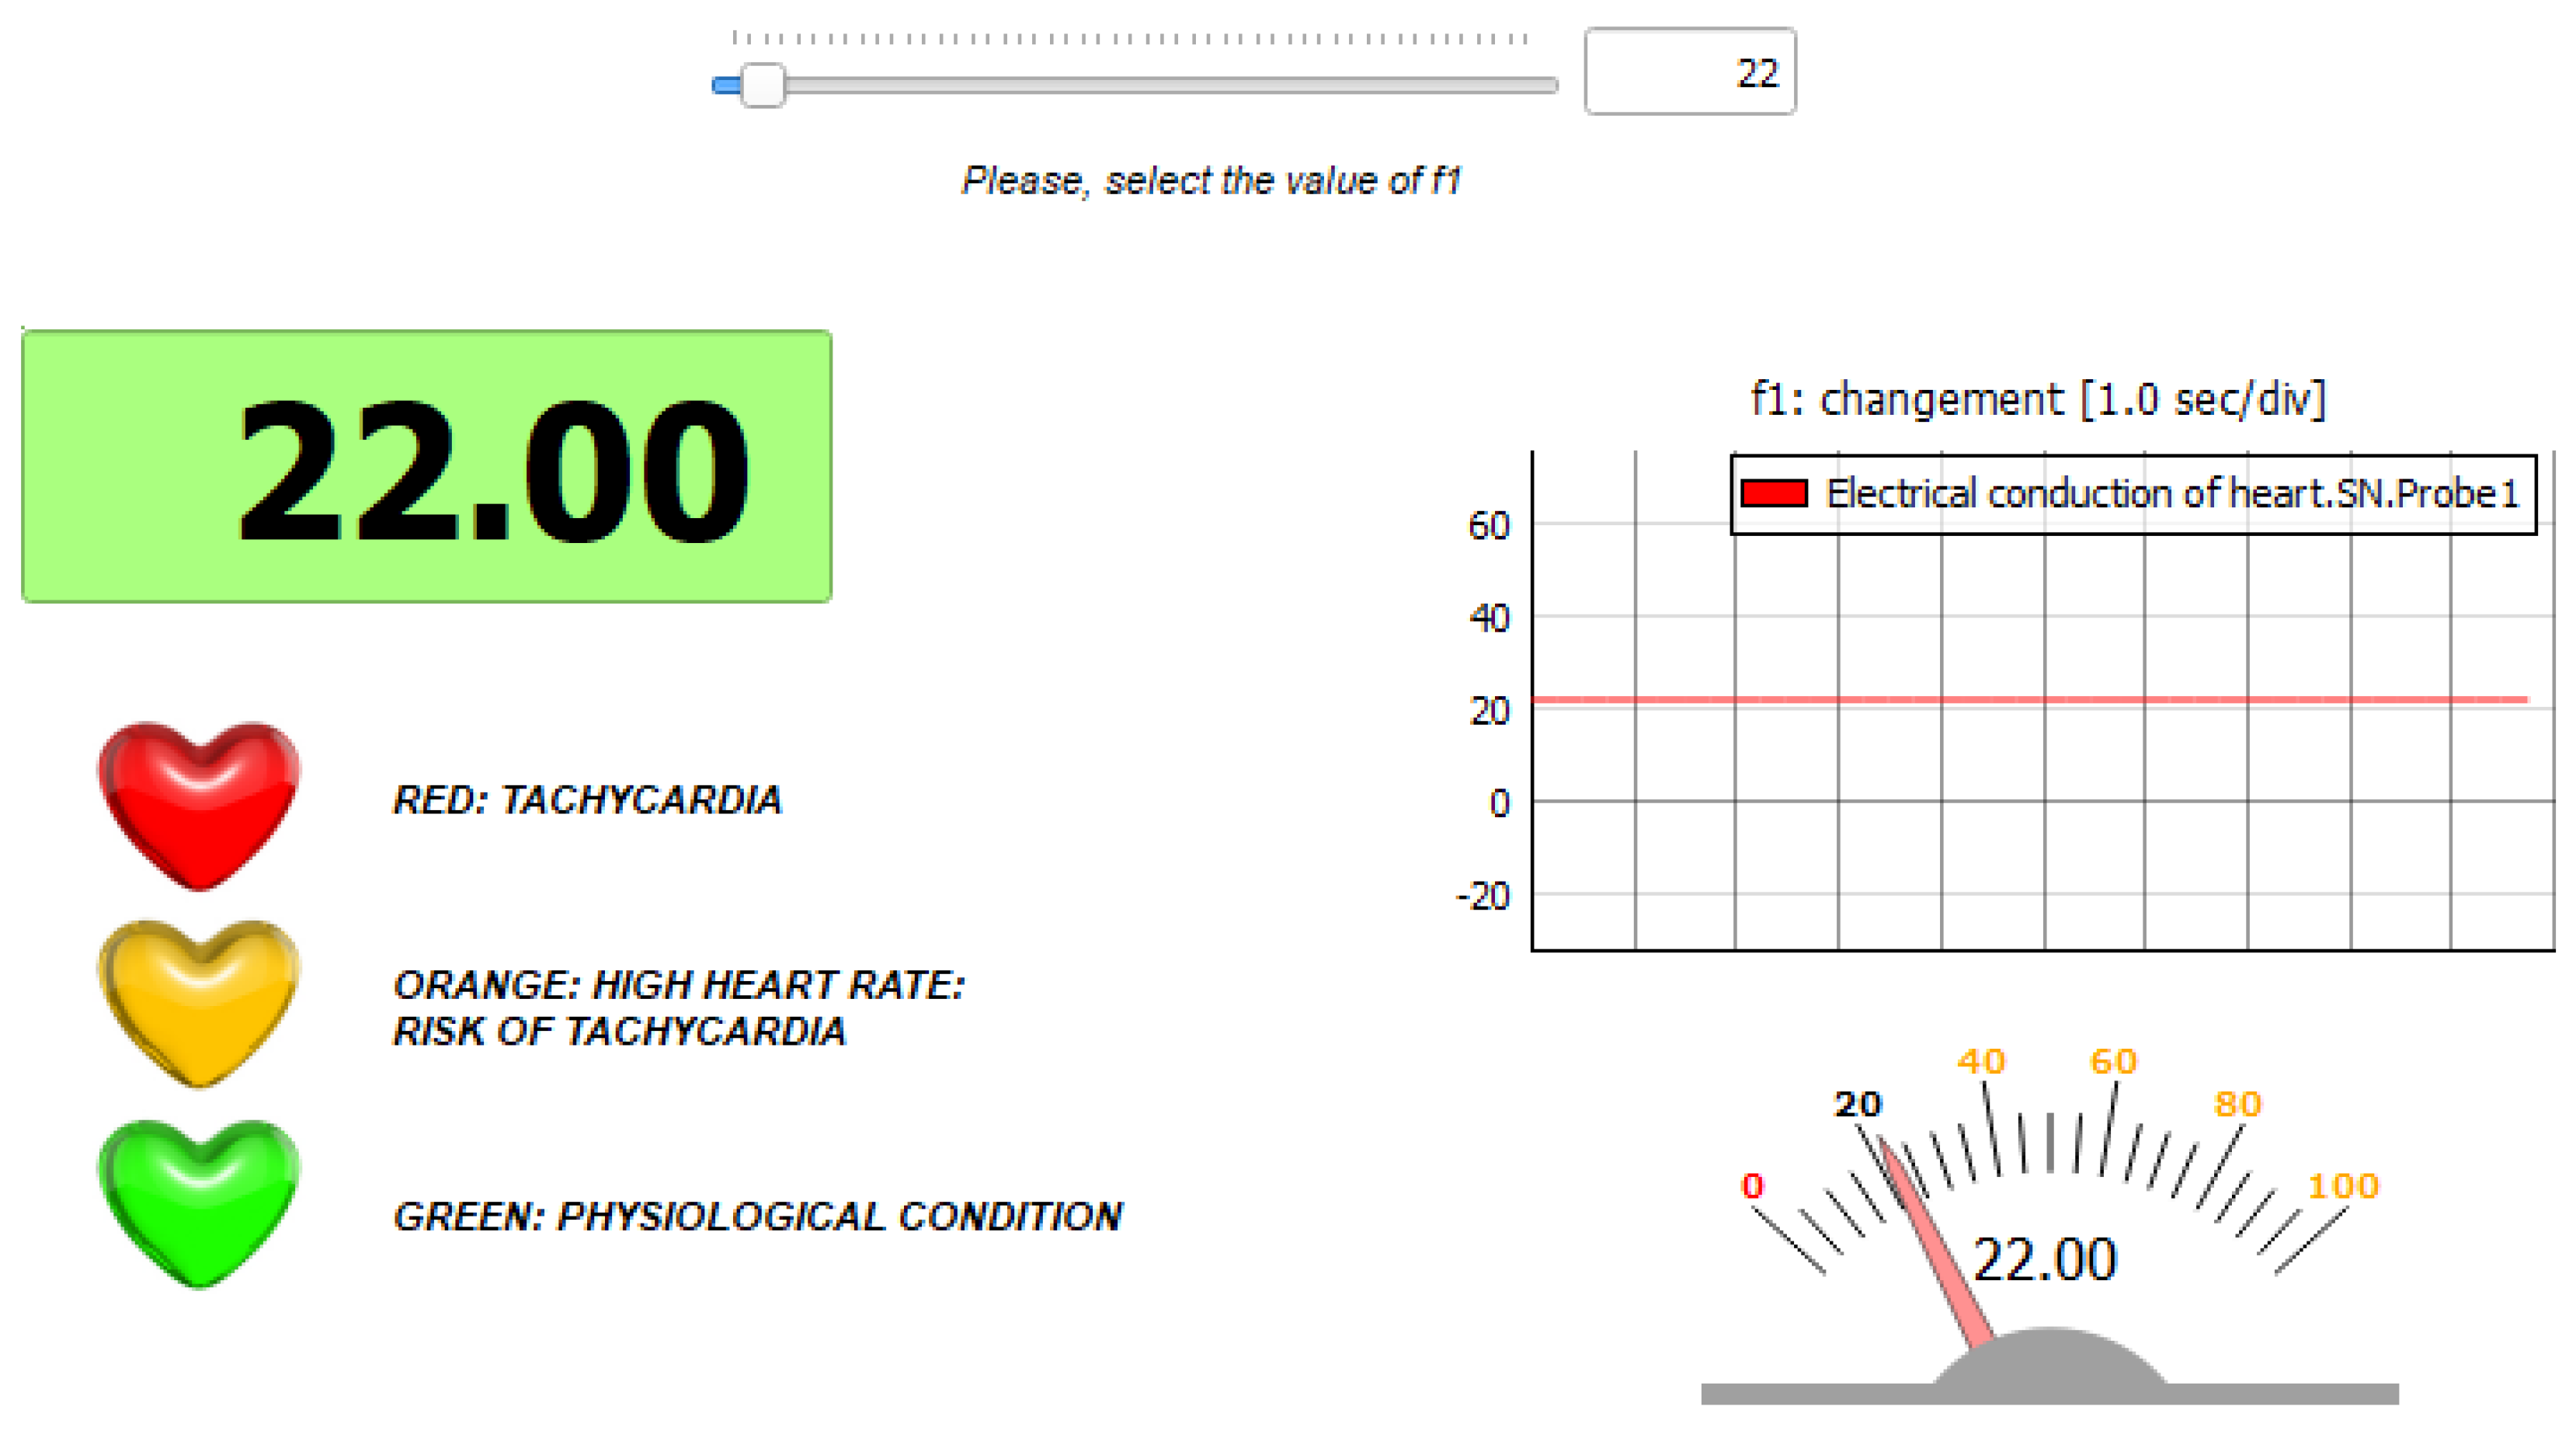
On the top left there is the panel of tachycardia (Figure 12): entering in this sub-block it is possible, through a slider to regulate the value of f 1 to increment the rhythm of heartbeat.
On the top right there is the panel of bradycardia (Figure 13): as the previous panel it offers the possibility to modify the parameter f 1 , but this time the value can be decremented to makes slower the rhythm of heartbeats.
On the bottom center there is the panel of atrial fibrillation (Figure 14), that contains the parameters coeff _ Pwave , a 3 , f 3 and k 4 . The user can choose which parameters modify and can see in real time, through the scope, the effect of the made modification on the ECG’s trend.
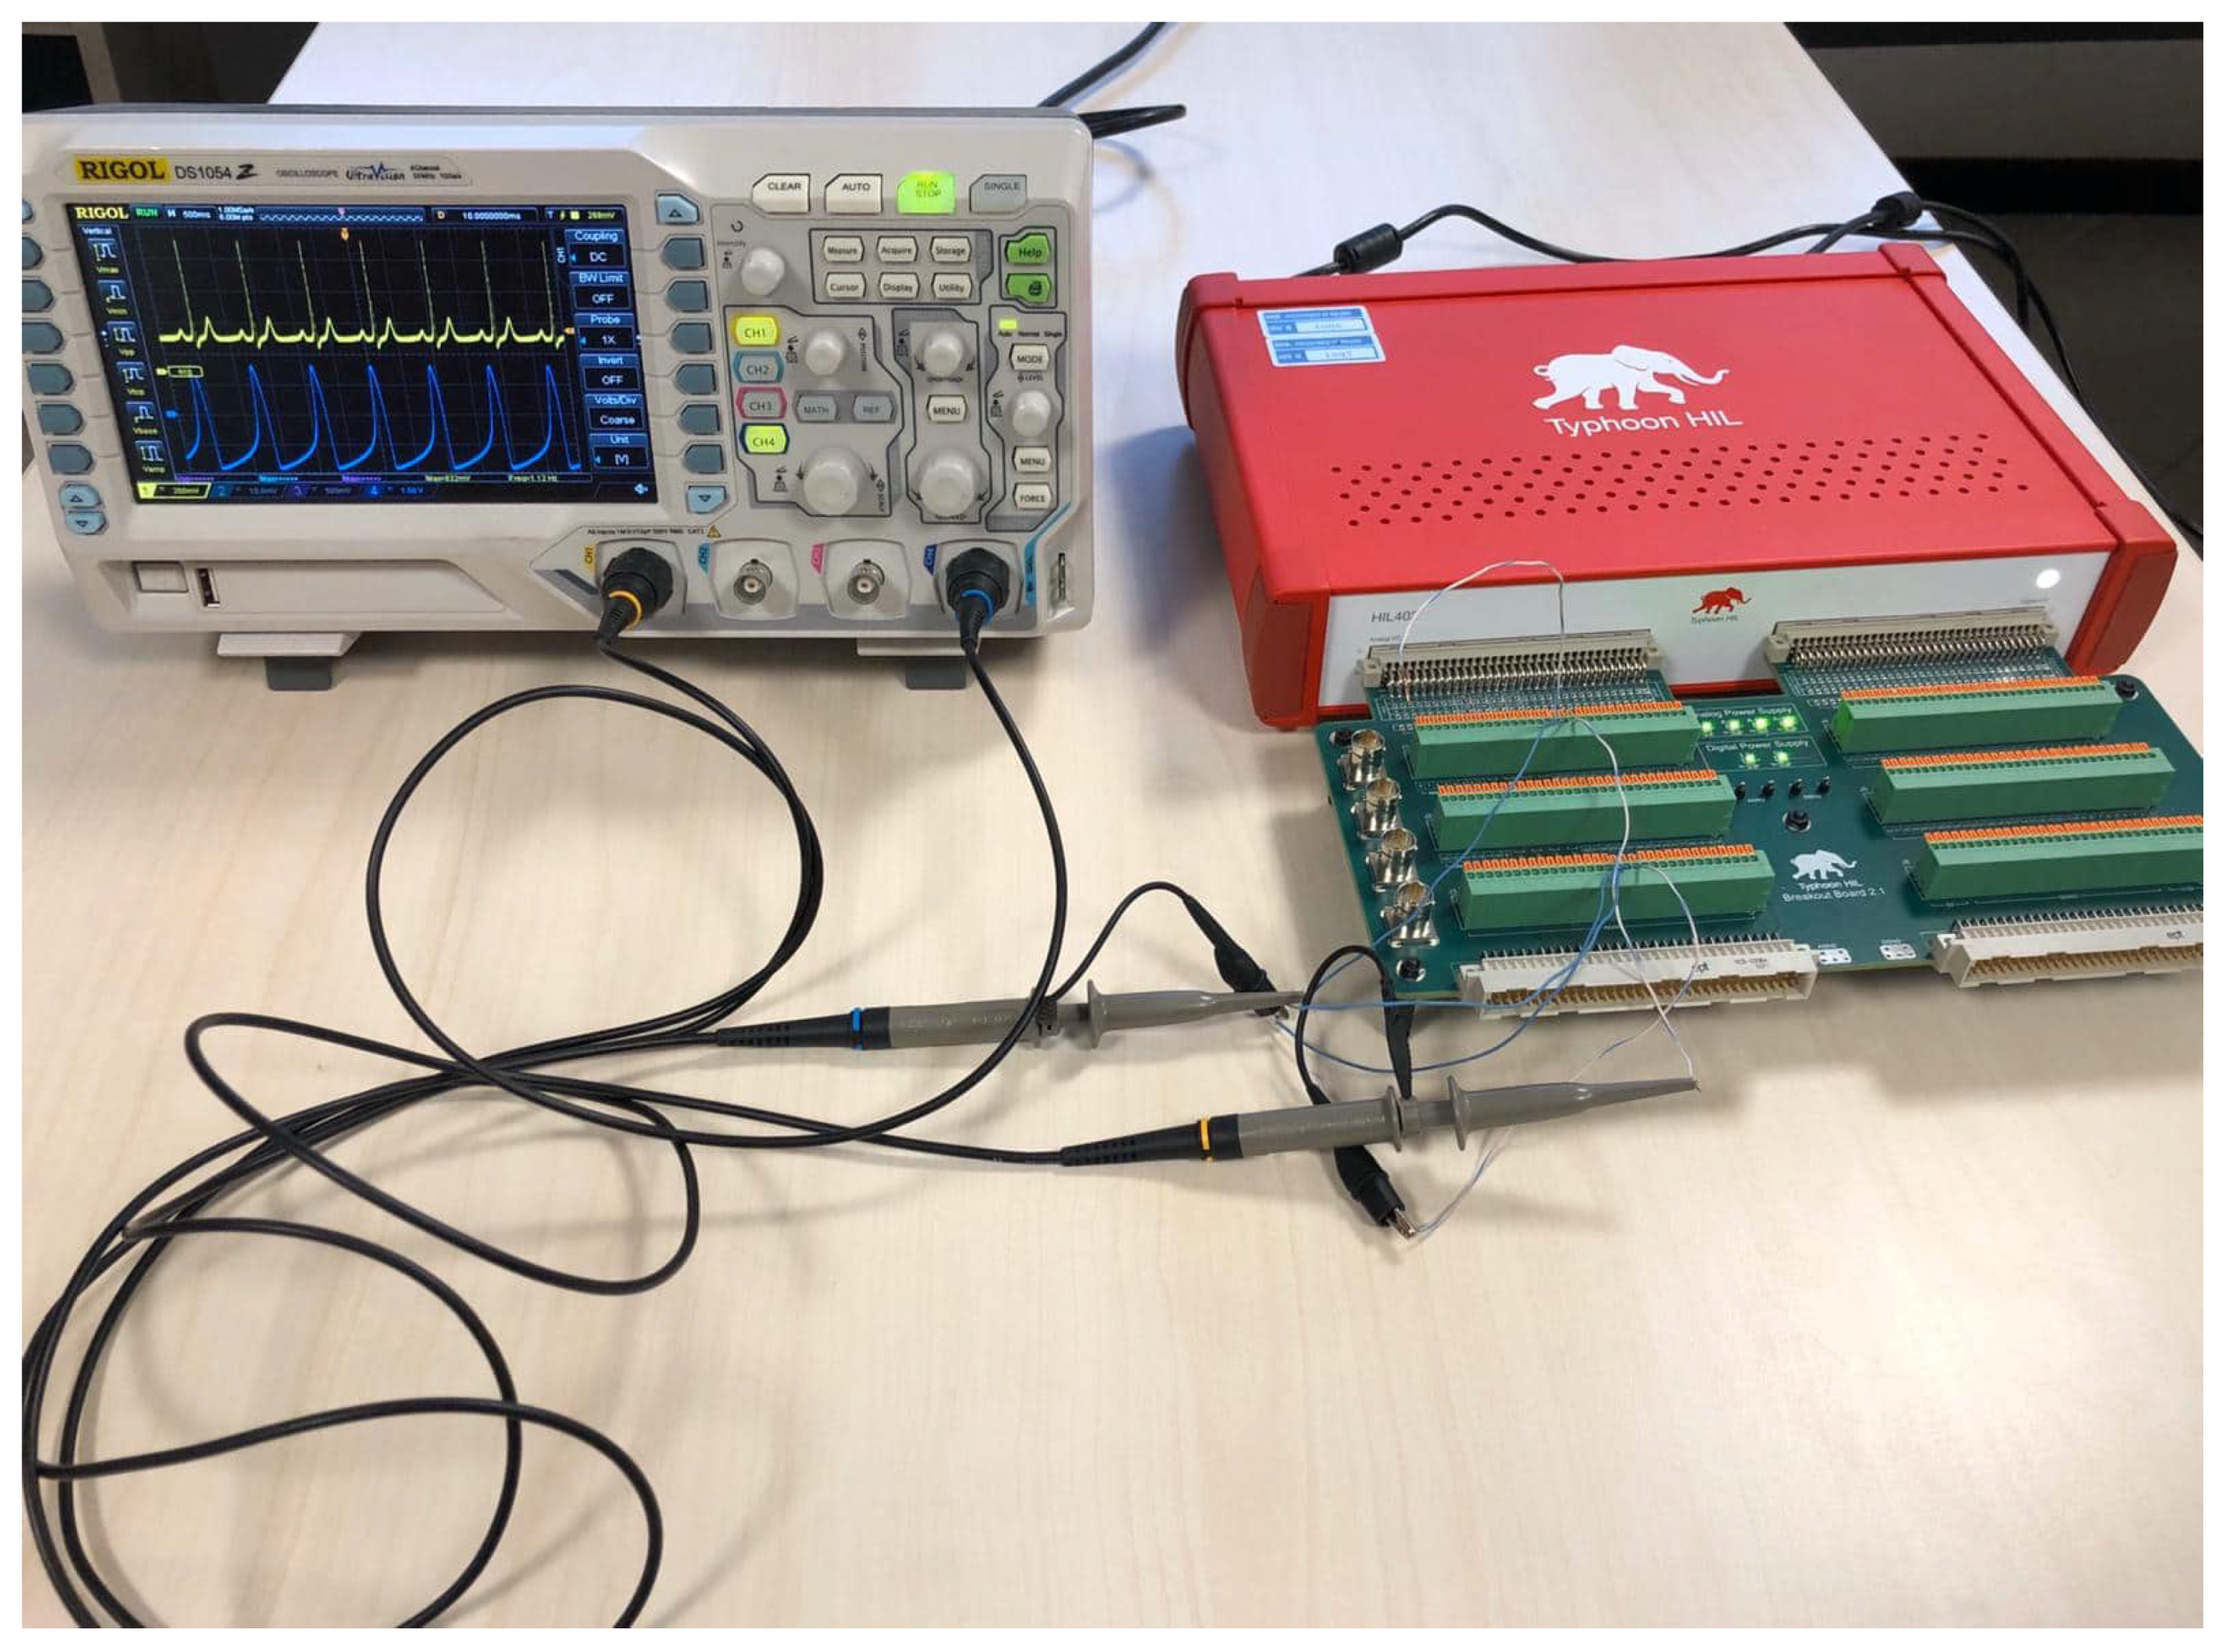
The oscilloscope (and the devices in general) is linked to the hardware simulator by means of interfaces.
The waveform of the electrical signal it is visualized in the oscilloscope (Figure 15).
The result is a waveform associated with the beating of the heart, with an important diagnostic value.

5. Application: Test of a Pacemaker

An important application of the realized project is to replace the human heart in the validation of the pacemakers.
A pacemaker is a small device that is placed in the chest or abdomen to help control abnormal heart rhythms. It is inserted in the patient through an invasive procedure, so it is very important to test it before the operation. The simulation of the heart here proposed can be a valid instrument for the test.
The model of pacemaker that will be described is the dual chambers pacemaker DDD that paces both the atrium and the ventricle, senses both chambers, and sensing can both activate or inhibit further pacing [17].
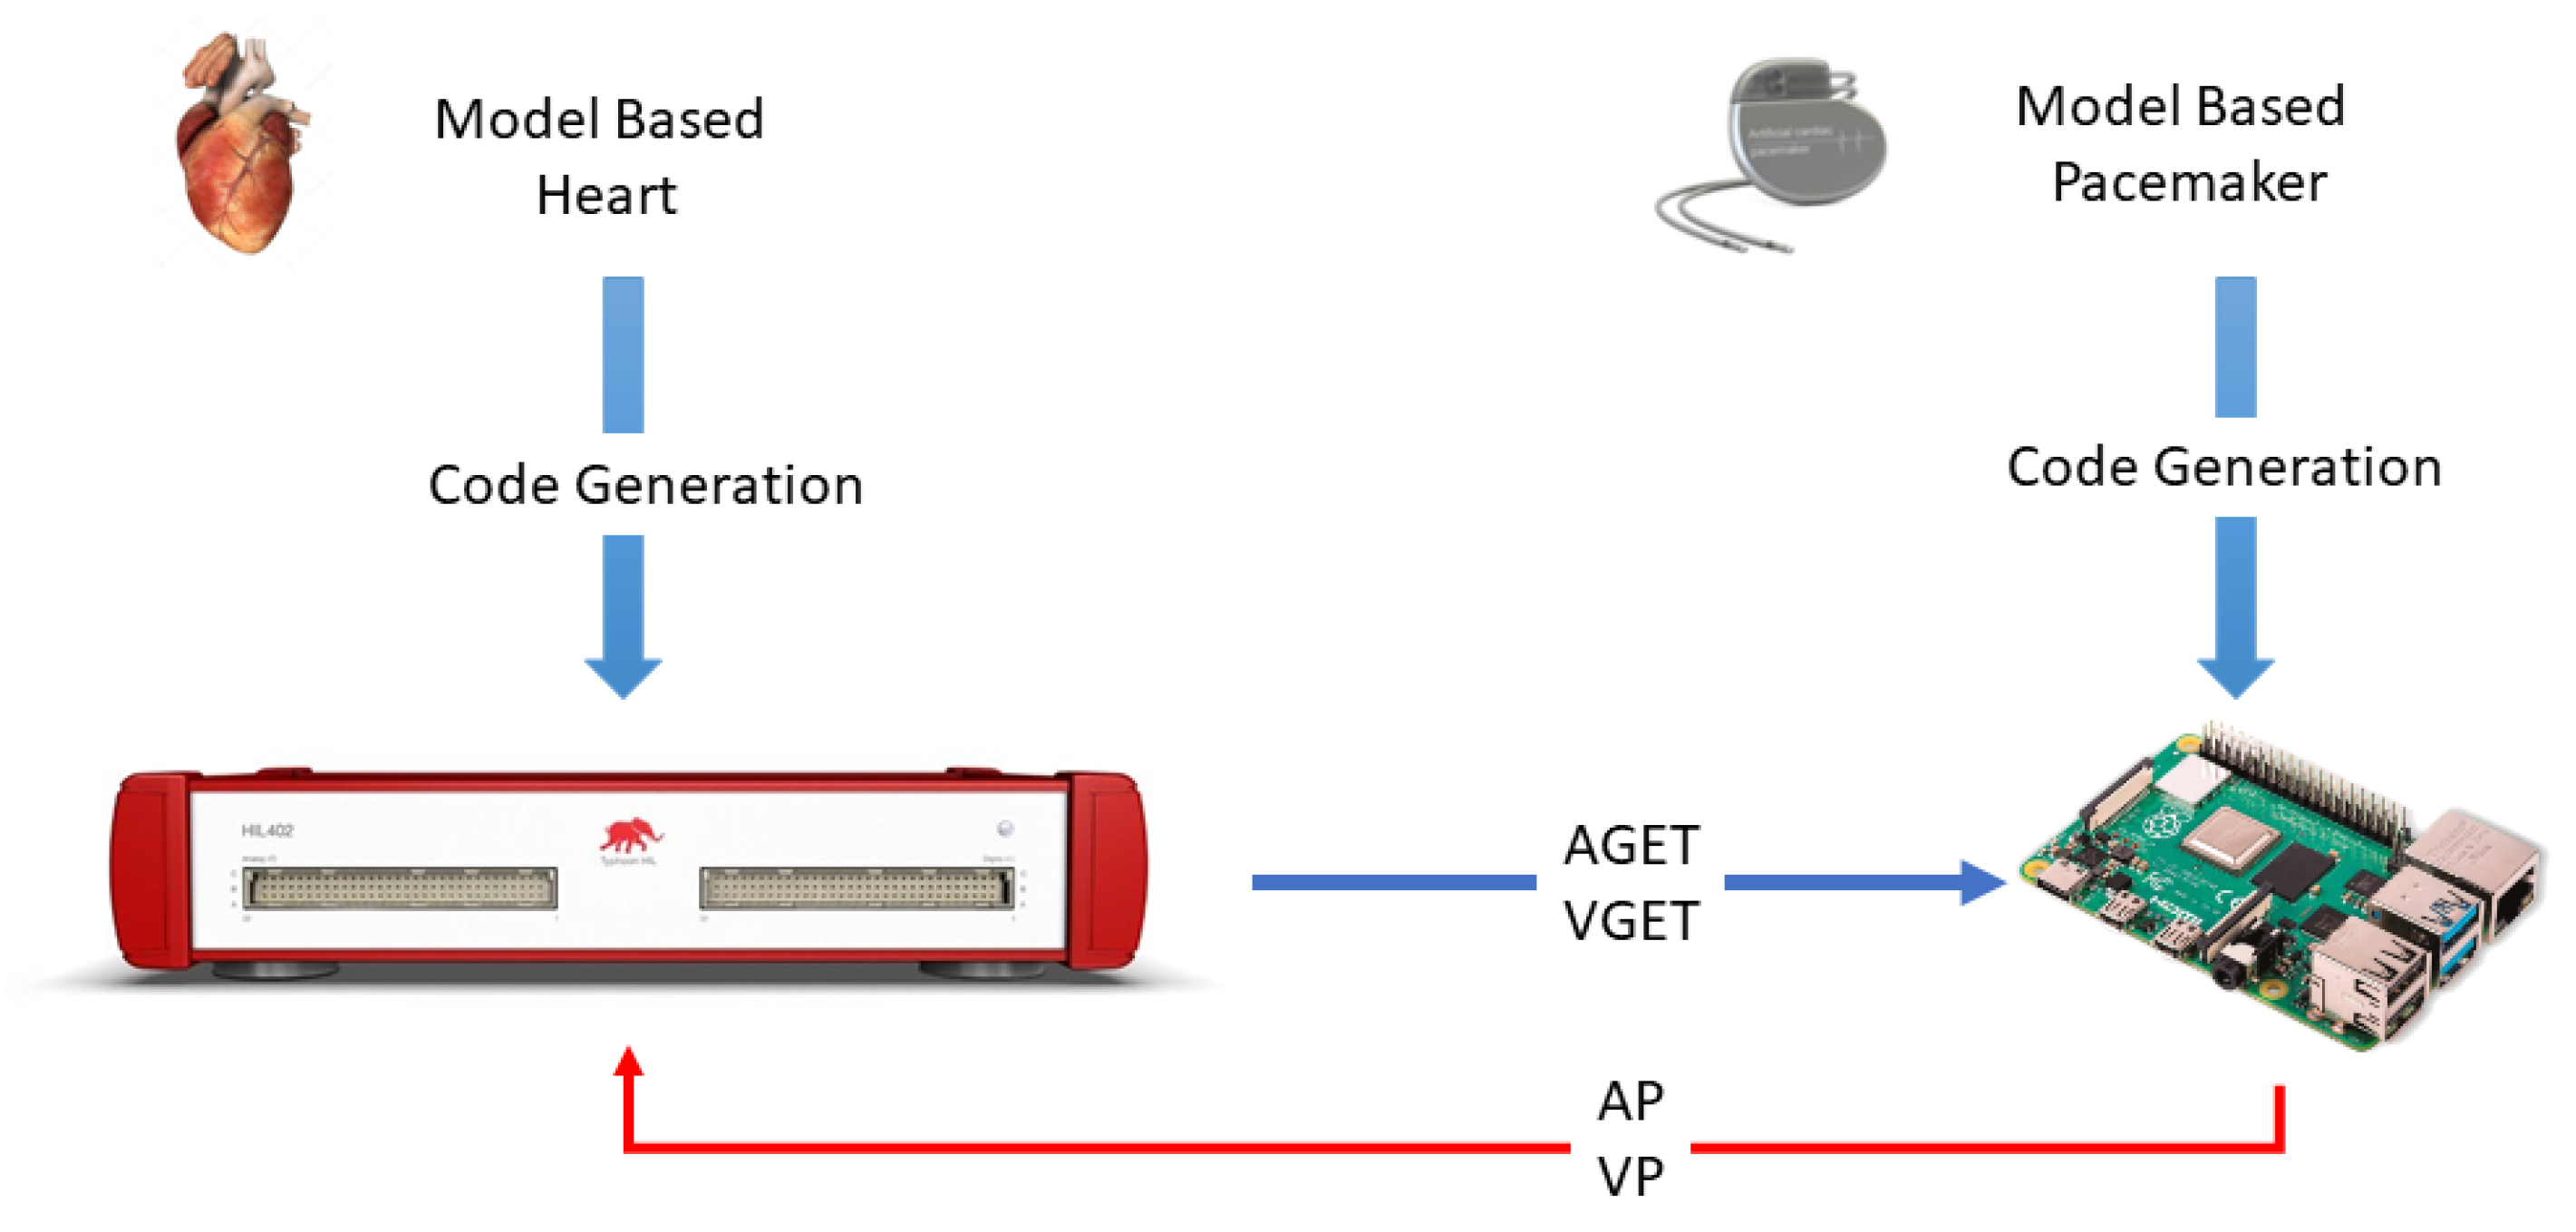
The system is projected as a close loop system. The heart and the pacemaker communicate with each other using broadcast channels. The heart generates Aget and Vget actions, representing atrial and ventricular events that the pacemaker takes as inputs (Figure 16). The pacemaker processes the signals and generates pacing actions AP and VP to the corresponding components in the heart [17].
The described model is connected to the simulated heart, considering as “Aget” the variable x 1 , one of the output of the system of SN conduction, and x 2 , the variable output of the block of AV conduction, as “Vget”.
The components present inside the model are [17]:
  • Lower Rate Interval (LRI): This component keeps the heart rate above a minimum value.
  • Atrio-Ventricular Interval (AVI): The function of the AVI component is to maintain the appropriate delay between the atria and the ventricles.
  • Post Ventricular Atrial Refractory Period (PVARP), to filter noise, and Post Ventricular Atrial Blanking (PVAB): the PVARP and the PVAB are initialized by ventricular events.
  • Ventricular Refractory Period (VRP): Along with the PVARP and PVAB, the VRP is used to filter noise and early events which could otherwise cause undesired pacemaker behavior.
The simulation is done in two conditions:
  • Physiological condition: the parameter f 1 is set to its original value ( f 1 = 22 );
  • Condition of bradycardia: the parameter f 1 is set to a value different from the original one ( f 1 = 8 ).

5.1. Simulation in Physiological Condition

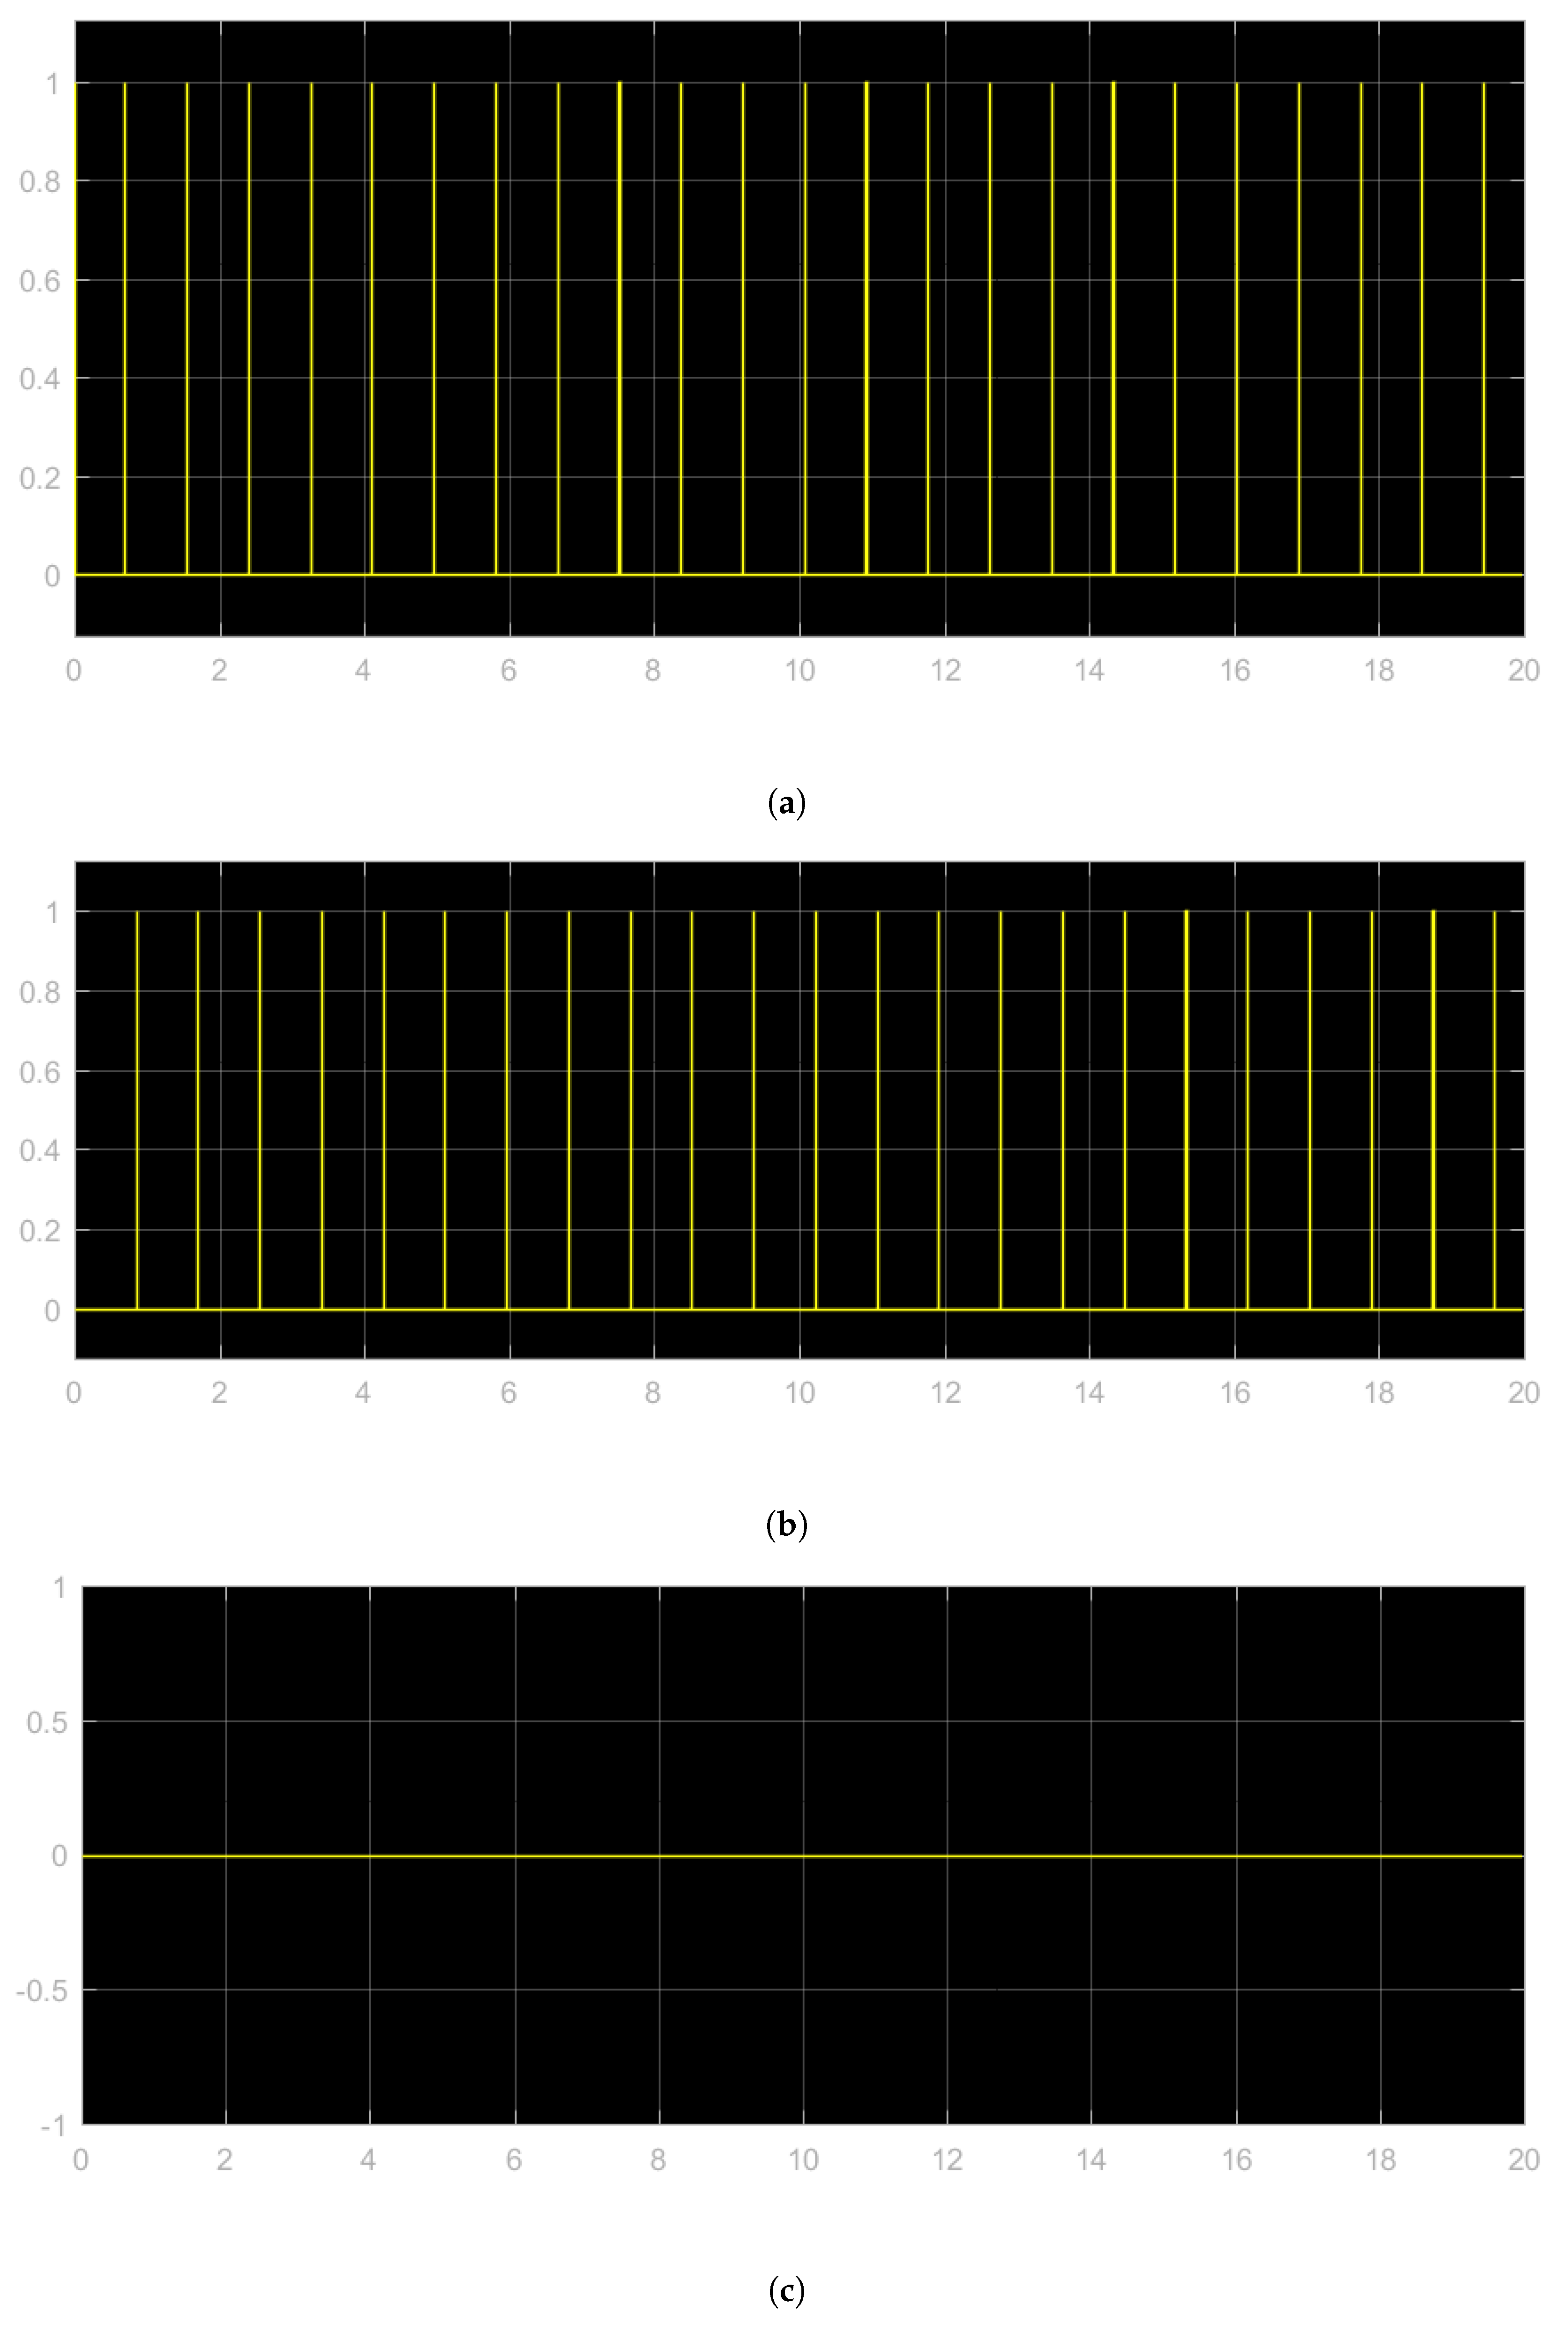
The pacemaker is connected to a model of physiological electrical conduction system of the heart ( f 1 = 22 ). The output parameters are the atrial events A s , the ventricular events V s , the atrial pacing A p and the ventricular pacing V p .
The atrial events (Figure 17a) follow the events of physiological electrical conduction system of the heart in SN: there is a spike for every waveform present in the original graph; also, ventricular events reproduce the waveform of the original simulation, with a spike for every waves present in the graph of AV (Figure 17b). The delay between SN and AV is respected, as the two results can attest. The atrial pacing, A p , is silent (Figure 17c). This happens because in physiological conditions, the heart rate respects the minimum value imposed by LRI: the atrial events are detected inside this interval and the pacing is not necessary.

5.2. Simulation in Case of Bradycardia

The simulation in condition of disease is done in a situation of bradycardia: the parameter f 1 is set at a value lower than physiological one to make slower the rhythm of the heart.
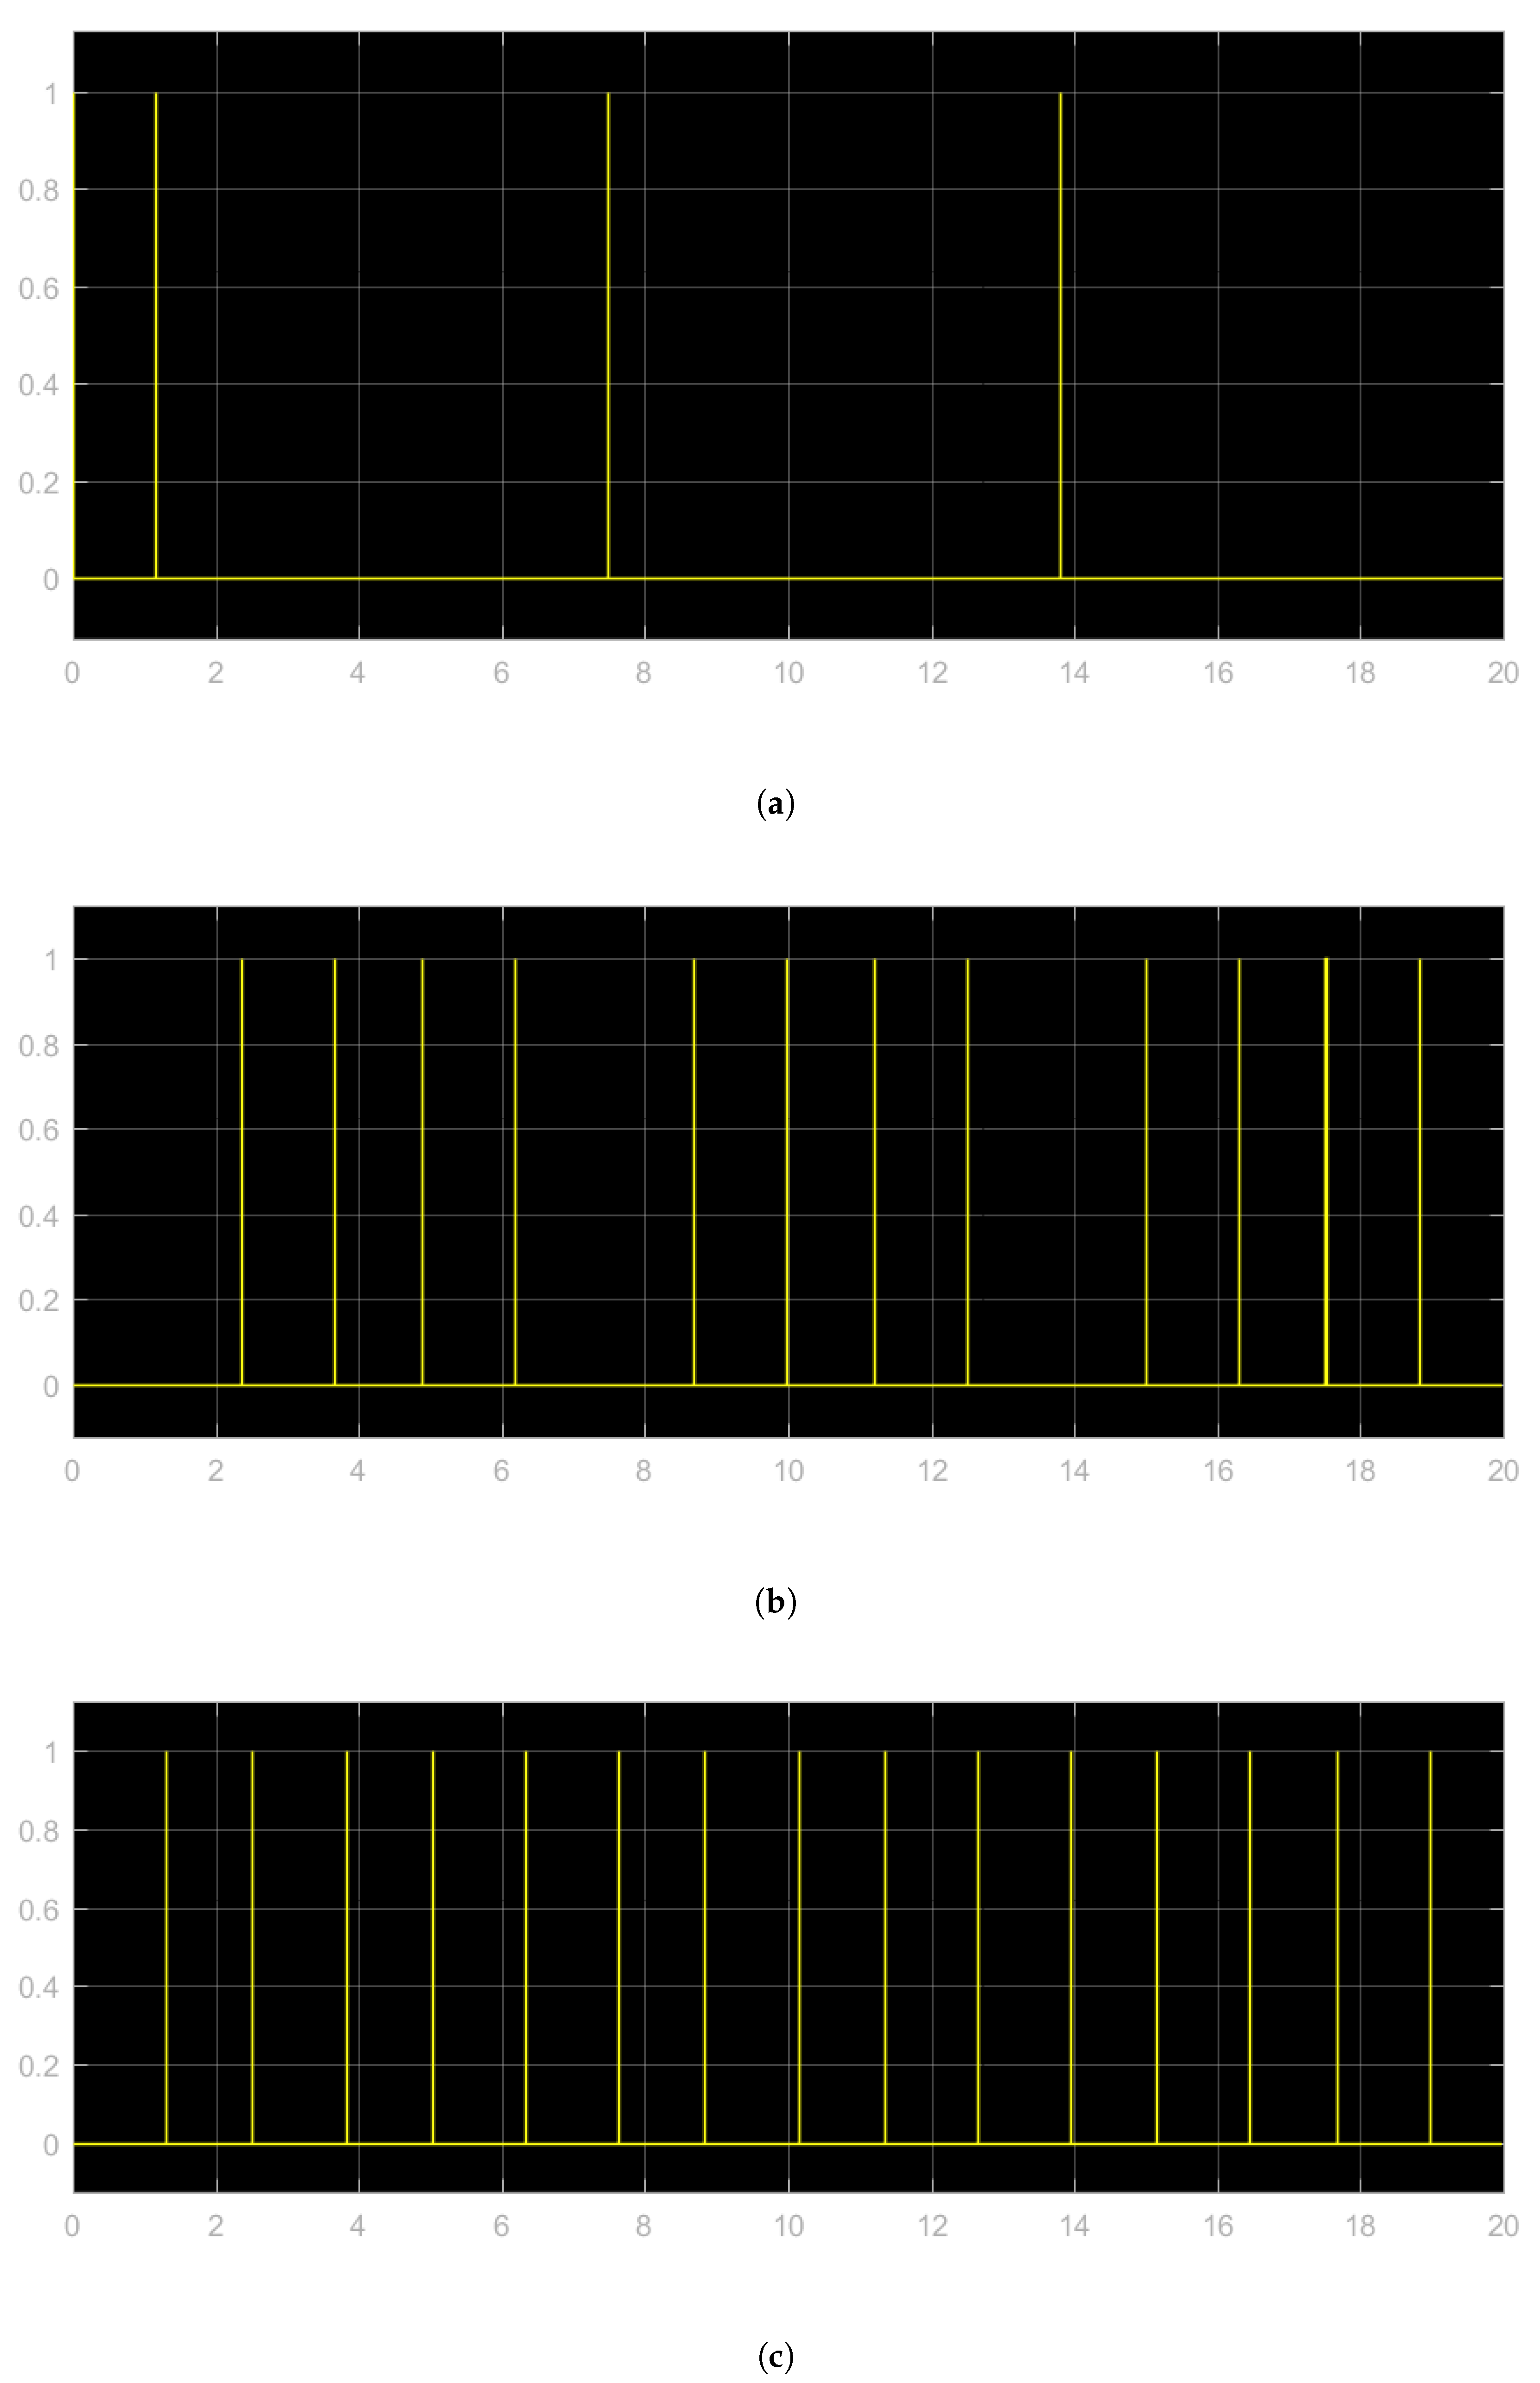
The test is done setting the value of f 1 equal to 8. Figure 18a–c are the outcomes detectable through the scopes.
Figure 18a shows the atrial events sensed by the pacemaker, that follow the waveform of the result in the electrical conduction system of the heart affected by bradycardia. The outcome present in Figure 18a shows as the events are less than these of Figure 17a: the frequency is lower and reproduces the lower trend of the result. The heart rate is insufficient for maintain alive the patient, that needs the application of the pacemaker. Figure 18b shows the contribute of pacing from the pacemaker, that restores the physiological rhythm. Making a comparison between the spikes that represent atrial events produced by the electrical conduction system of the heart and the atrial pacing, is possible to see how these two components are complementary: when an atrial event is present, the atrial pace is silent, while when atrial event is not sensed in LRI interval, the atrial pacing is activated.
In agreement with A p , the ventricular pacing V p respects the delay determined from the AVI: the spikes follow the events in A p with a little delay representing the time of conduction from the SN to the AV.

5.3. Closed Loop Simulation

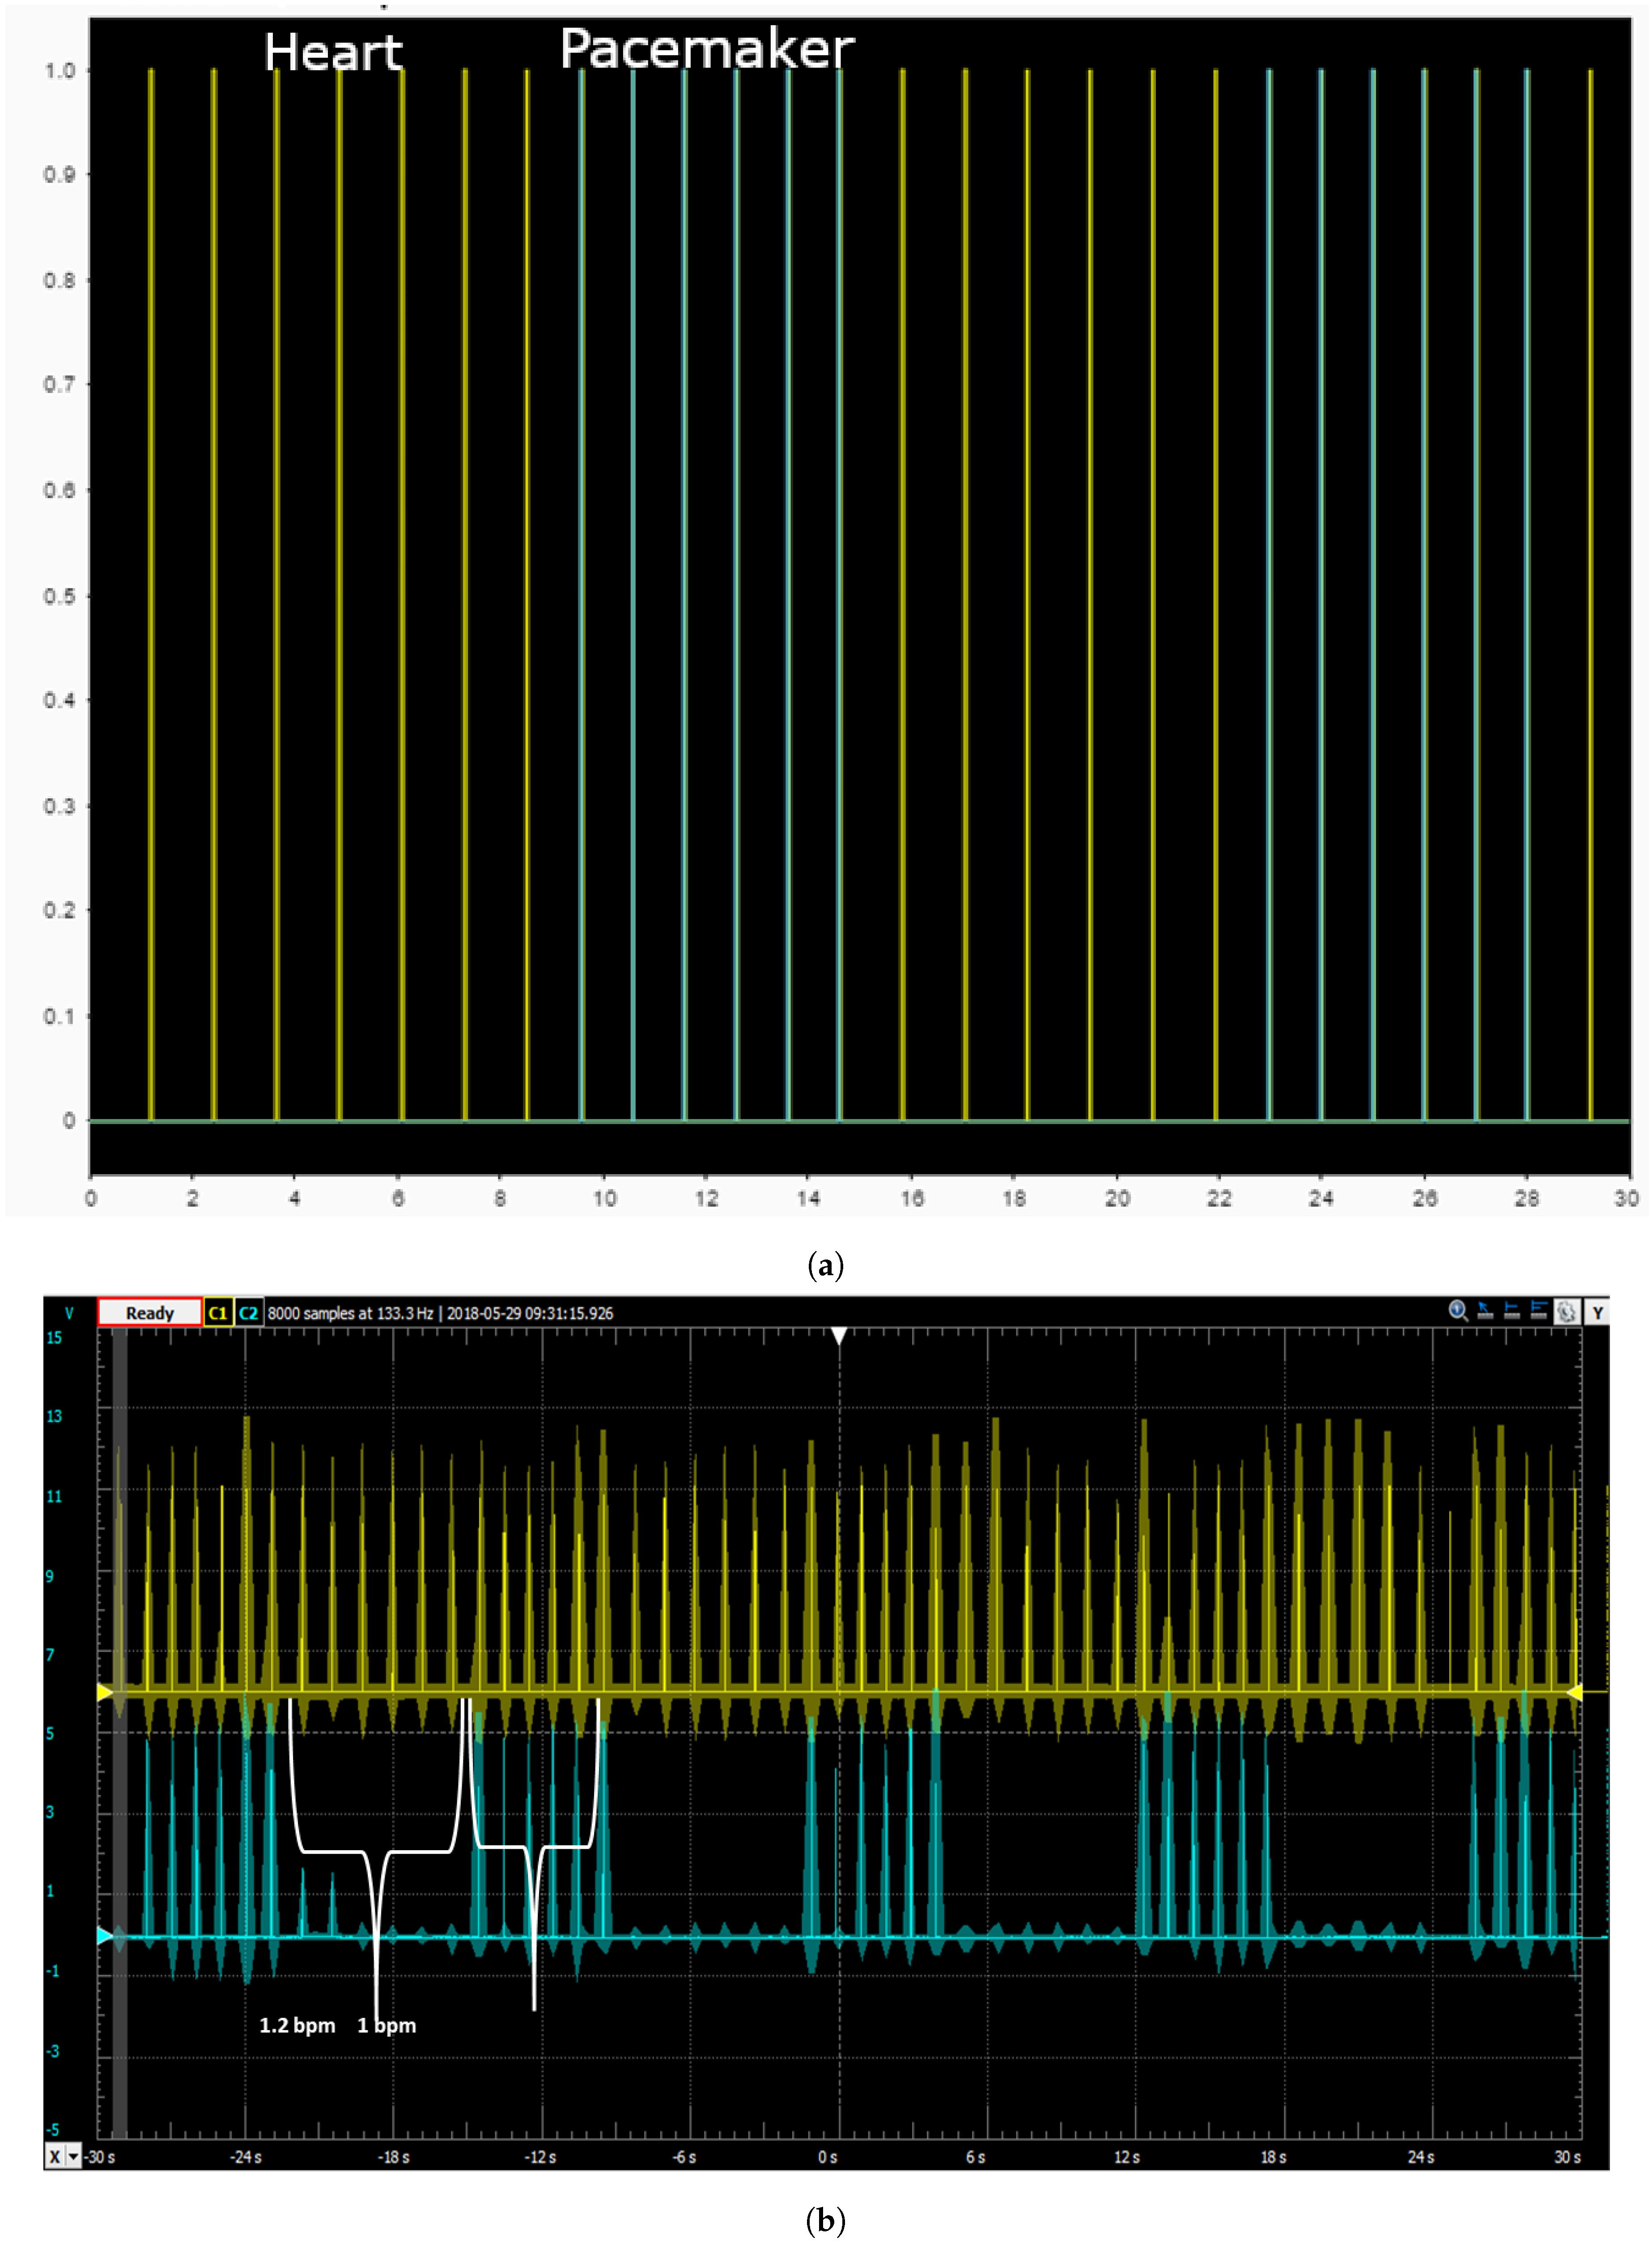
For device testing purposes, open loop configuration would be more than sufficient. In this case, the signals are generated and it is verified that the device responds within times defined by the project specification. However, for the completeness of this work a closed loop simulation is presented. In this case, the signals generated by the pacemaker closed on the model of the heart, restarting the physiological beat. The real pacemaker detects a pathological condition and generates a signal that acts on the sino-atrial node, restoring natural peace. So it happens in the model, where the signal introduce a correction to the set of Equations (8)–(11), resetting the initial conditions of the controlling equations and restarting the simulation with the right pace. An example is show in Figure 19a, where the heart beat combined with artificial pacing generated by the device.
Finally in Figure 19b a closed loop simulation is shown. the pacemaker detect a condition of delayed heartbeat and generate a response to accelerate the heartbeat and make the condition physiological.

6. Conclusions

This project is focused on the importance of have a complete model of the heart to test and validate new cardiac medical devices before they enter in the market, as they have become more and more critical for the patient safety. The innovation present in the realized model, respect to the previous simulators of the heart, is the use of hardware-in-the-loop systems for testing and design of control systems.
The advantages of using HIL simulator is that the resulting simulation will be simple, because of the graphical logic of the schematic and because of the simple design of SCADA interface, usable for physical tested thanks to its capacity to simulate signals both in physiological and pathological conditions.
The resulting model respects the requirements as it can be used to test new devices. Moreover, it verifies all requirements for modeling simpleness, fidelity and physical testbed. It is possible to consider this model a good alternative to the clinical trials and to the tests on the animals thanks to its veracity, its design user-friendly and its capacity to be personalized from the user to reproduce different heart conditions, as tachycardia, bradycardia and atrial fibrillation.

Author Contributions

Conceptualization, C.D.M. and G.G.; methodology, G.G.; software, C.D.M.; validation, C.D.M., G.G.; formal analysis, C.D.M.; investigation, C.D.M.; resources, G.G.; writing–original draft preparation, C.D.M.; writing–review and editing, G.G. All authors have read and agreed to the published version of the manuscript.

Funding

This research received no external funding.

Conflicts of Interest

The authors declare no conflict of interest.

References

  1. Friedenthal, S.; Moore, A.; Steiner, R. Chapter 18—Integrating SysML into a Systems Development Environment. In A Practical Guide to SysML, 3rd ed.; Steiner, R., Moore, A., Friedenthal, S., Eds.; Morgan Kaufmann Publishers: Burlington, MA, USA, 2014; pp. 507–541. [Google Scholar]
  2. Ellis, G. Chapter 13—Model Development and Verification. In Control System Design Guide, 4th ed.; Ellis, G., Ed.; Butterworth-Heinemann: Oxford, UK, 2012; pp. 261–282. [Google Scholar]
  3. Mai, X.H.; Kwak, S.-K.; Jung, J.-H.; Kim, K.A. Comprehensive Electric-Thermal Photovoltaic Modeling for Power-Hardware-in-the-Loop Simulation (PHILS) Applications. IEEE Trans. Ind. Electron. 2017, 64, 6255–6264. [Google Scholar] [CrossRef]
  4. Lauss, G.; Strunz, K. Multirate Partitioning Interface for Enhanced Stability of Power Hardware-in-the-Loop Real-Time Simulation. IEEE Trans. Ind. Electron. 2019, 66, 595–605. [Google Scholar] [CrossRef]
  5. Schlager, M.; Elmenreich, W.; Wenzel, I. Interface Design for Hardware-in-the-Loop Simulation. In Proceedings of the 2006 IEEE International Symposium on Industrial Electronics, Montreal, QC, Canada, 9–13 July 2006; pp. 1554–1559. [Google Scholar]
  6. Walter, M.; Eisenbrand, S.; Kopp, R.; Leonhardt, S. Hardware-in-the-loop test bench for artificial lungs. In Proceedings of the XIV RUSSIAN-GERMANY CONFERENCE ON BIOMEDICAL ENGINEERING (RGC-2019), St. Petersburg, Russia, 3–6 July 2019; Potrakhov, N.N., Gryaznov, A.Y., Kostrin, D.K., Eds.; American Institute of Physics: College Park, MD, USA, 2019; Volume 2140, p. 020078. [Google Scholar] [CrossRef] [Green Version]
  7. Kung, E.; Farahmand, M.; Gupta, A. A Hybrid ExperimentalComputational Modeling Framework for Cardiovascular Device Testing. J. Biomech. Eng. 2019, 141. [Google Scholar] [CrossRef] [PubMed] [Green Version]
  8. Justino da Silva, S.; Scardovelli, T.; Boschi, S.; Rodrigues, S.; Silva, A. Simple adaptive PI controller development and evaluation for mean arterial pressure regulation. Res. Biomed. Eng. 2019, 35, 157–165. [Google Scholar] [CrossRef]
  9. Di Bernardo, D.; Signorini, M. A model of two nonlinear coupled oscillators for the study of heartbeat dynamics. Int. J. Bifurcation Chaos 1998, 8, 1975–1985. [Google Scholar] [CrossRef] [Green Version]
  10. Signorini, M.G.; di Bernardo, D. Simulation of heartbeat dynamics: A nonlinear model. Int. J. Bifurc. Chaos 1998, 8, 1725–1731. [Google Scholar] [CrossRef]
  11. Ryzhii, M.; Ryzhii, E. Simulink heart model for simulation of the effect of external signals. In Proceedings of the 2016 IEEE Conference on Computational Intelligence in Bioinformatics and Computational Biology (CIBCB), Chiang Mai, Thailand, 5–7 October 2016; pp. 1–5. [Google Scholar]
  12. Ryzhii, E.; Ryzhii, M. Formation of second-degree atrioventricular blocks in the cardiac heterogeneous oscillator model. In Proceedings of the 2015 37th Annual International Conference of the IEEE Engineering in Medicine and Biology Society (EMBC), Milan, Italy, 25–29 August 2015; p. 15585163. [Google Scholar]
  13. Ryzhii, E.; Ryzhii, M. Modeling of Heartbeat Dynamics with a System of Coupled Nonlinear Oscillators. In Biomedical Informatics and Technology, Proceedings of First International Conference, ACBIT 2013, Aizu-Wakamatsu, Japan, 16–17 September 2013; Pham, T.D., Ichikawa, K., Oyama-Higa, M., Coomans, D., Jiang, X., Eds.; Springer: Berlin/Heidelberg, Germany, 2014; pp. 67–75. [Google Scholar]
  14. Ryzhii, E.; Ryzhii, M. A heterogeneous coupled oscillator model for simulation of ECG signals. Comput. Methods Programs Biomed. 2014, 117, 40–49. [Google Scholar]
  15. Andalam, S.; Roop, P.; Malik, A.; Trew, M. Rethinking the Validation Process for Medical Devices: A Cardiac Pacemaker Case Study. In Proceedings of the 2018 IEEE 21st International Symposium on Real-Time Distributed Computing (ISORC), Singapore, 29–31 May 2018; p. 17962934. [Google Scholar]
  16. Barker, C.; Kwiatkowska, M.; Mereacre, A.; Paoletti, N.; Patanè, A. Hardware-in-the-loop simulation and energy optimization of cardiac pacemakers. In Proceedings of the 2015 37th Annual International Conference of the IEEE Engineering in Medicine and Biology Society (EMBC), Milan, Italy, 25–29 August 2015; p. 15585183. [Google Scholar]
  17. Jiang, Z.; Pajic, M.; Moarref, S.; Alur, R.; Mangharam, R. Modeling and Verification of a Dual Chamber Implantable Pacemaker. In Tools and Algorithms for the Construction and Analysis of Systems, Proceedings of the 18th International Conference, TACAS 2012, Held as Part of the European Joint Conferences on Theory and Practice of Software, ETAPS 2012, Tallinn, Estonia, 24 March–1 April, 2012; Flanagan, C., König, B., Eds.; Springer: Berlin/Heidelberg, Germany, 2012; pp. 188–203. [Google Scholar]
  18. Quiroz-Juárez, M.; Jiménez-Ramírez, O.; Aragón, J.; Del Río-Correa, J.L.; Vázquez-Medina, R. Periodically kicked network of RLC oscillators to produce ECG signals. Comput. Biol. Med. 2019, 104, 87–96. [Google Scholar] [CrossRef] [PubMed]
  19. Xu, B.; Binczak, S.; Jacquir, S.; Pont, O.; Yahia, H. Parameters analysis of FitzHugh-Nagumo model for a reliable simulation. In Proceedings of the 2014 36th Annual International Conference of the IEEE Engineering in Medicine and Biology Society, Chicago, IL, USA, 26–30 August 2014; pp. 4334–4337. [Google Scholar]
  20. Burns, E. ECG Library. Available online: http://lifeinthefastlane.com/ecg-library (accessed on 20 February 2020).
  21. PhysioNet: The Research Resource for Complex Physiologic Signals. Available online: https://physionet.org/ (accessed on 20 February 2020).
  22. Typhoon Hil Documentation. Available online: https://www.typhoon-hil.com/ (accessed on 25 February 2020).
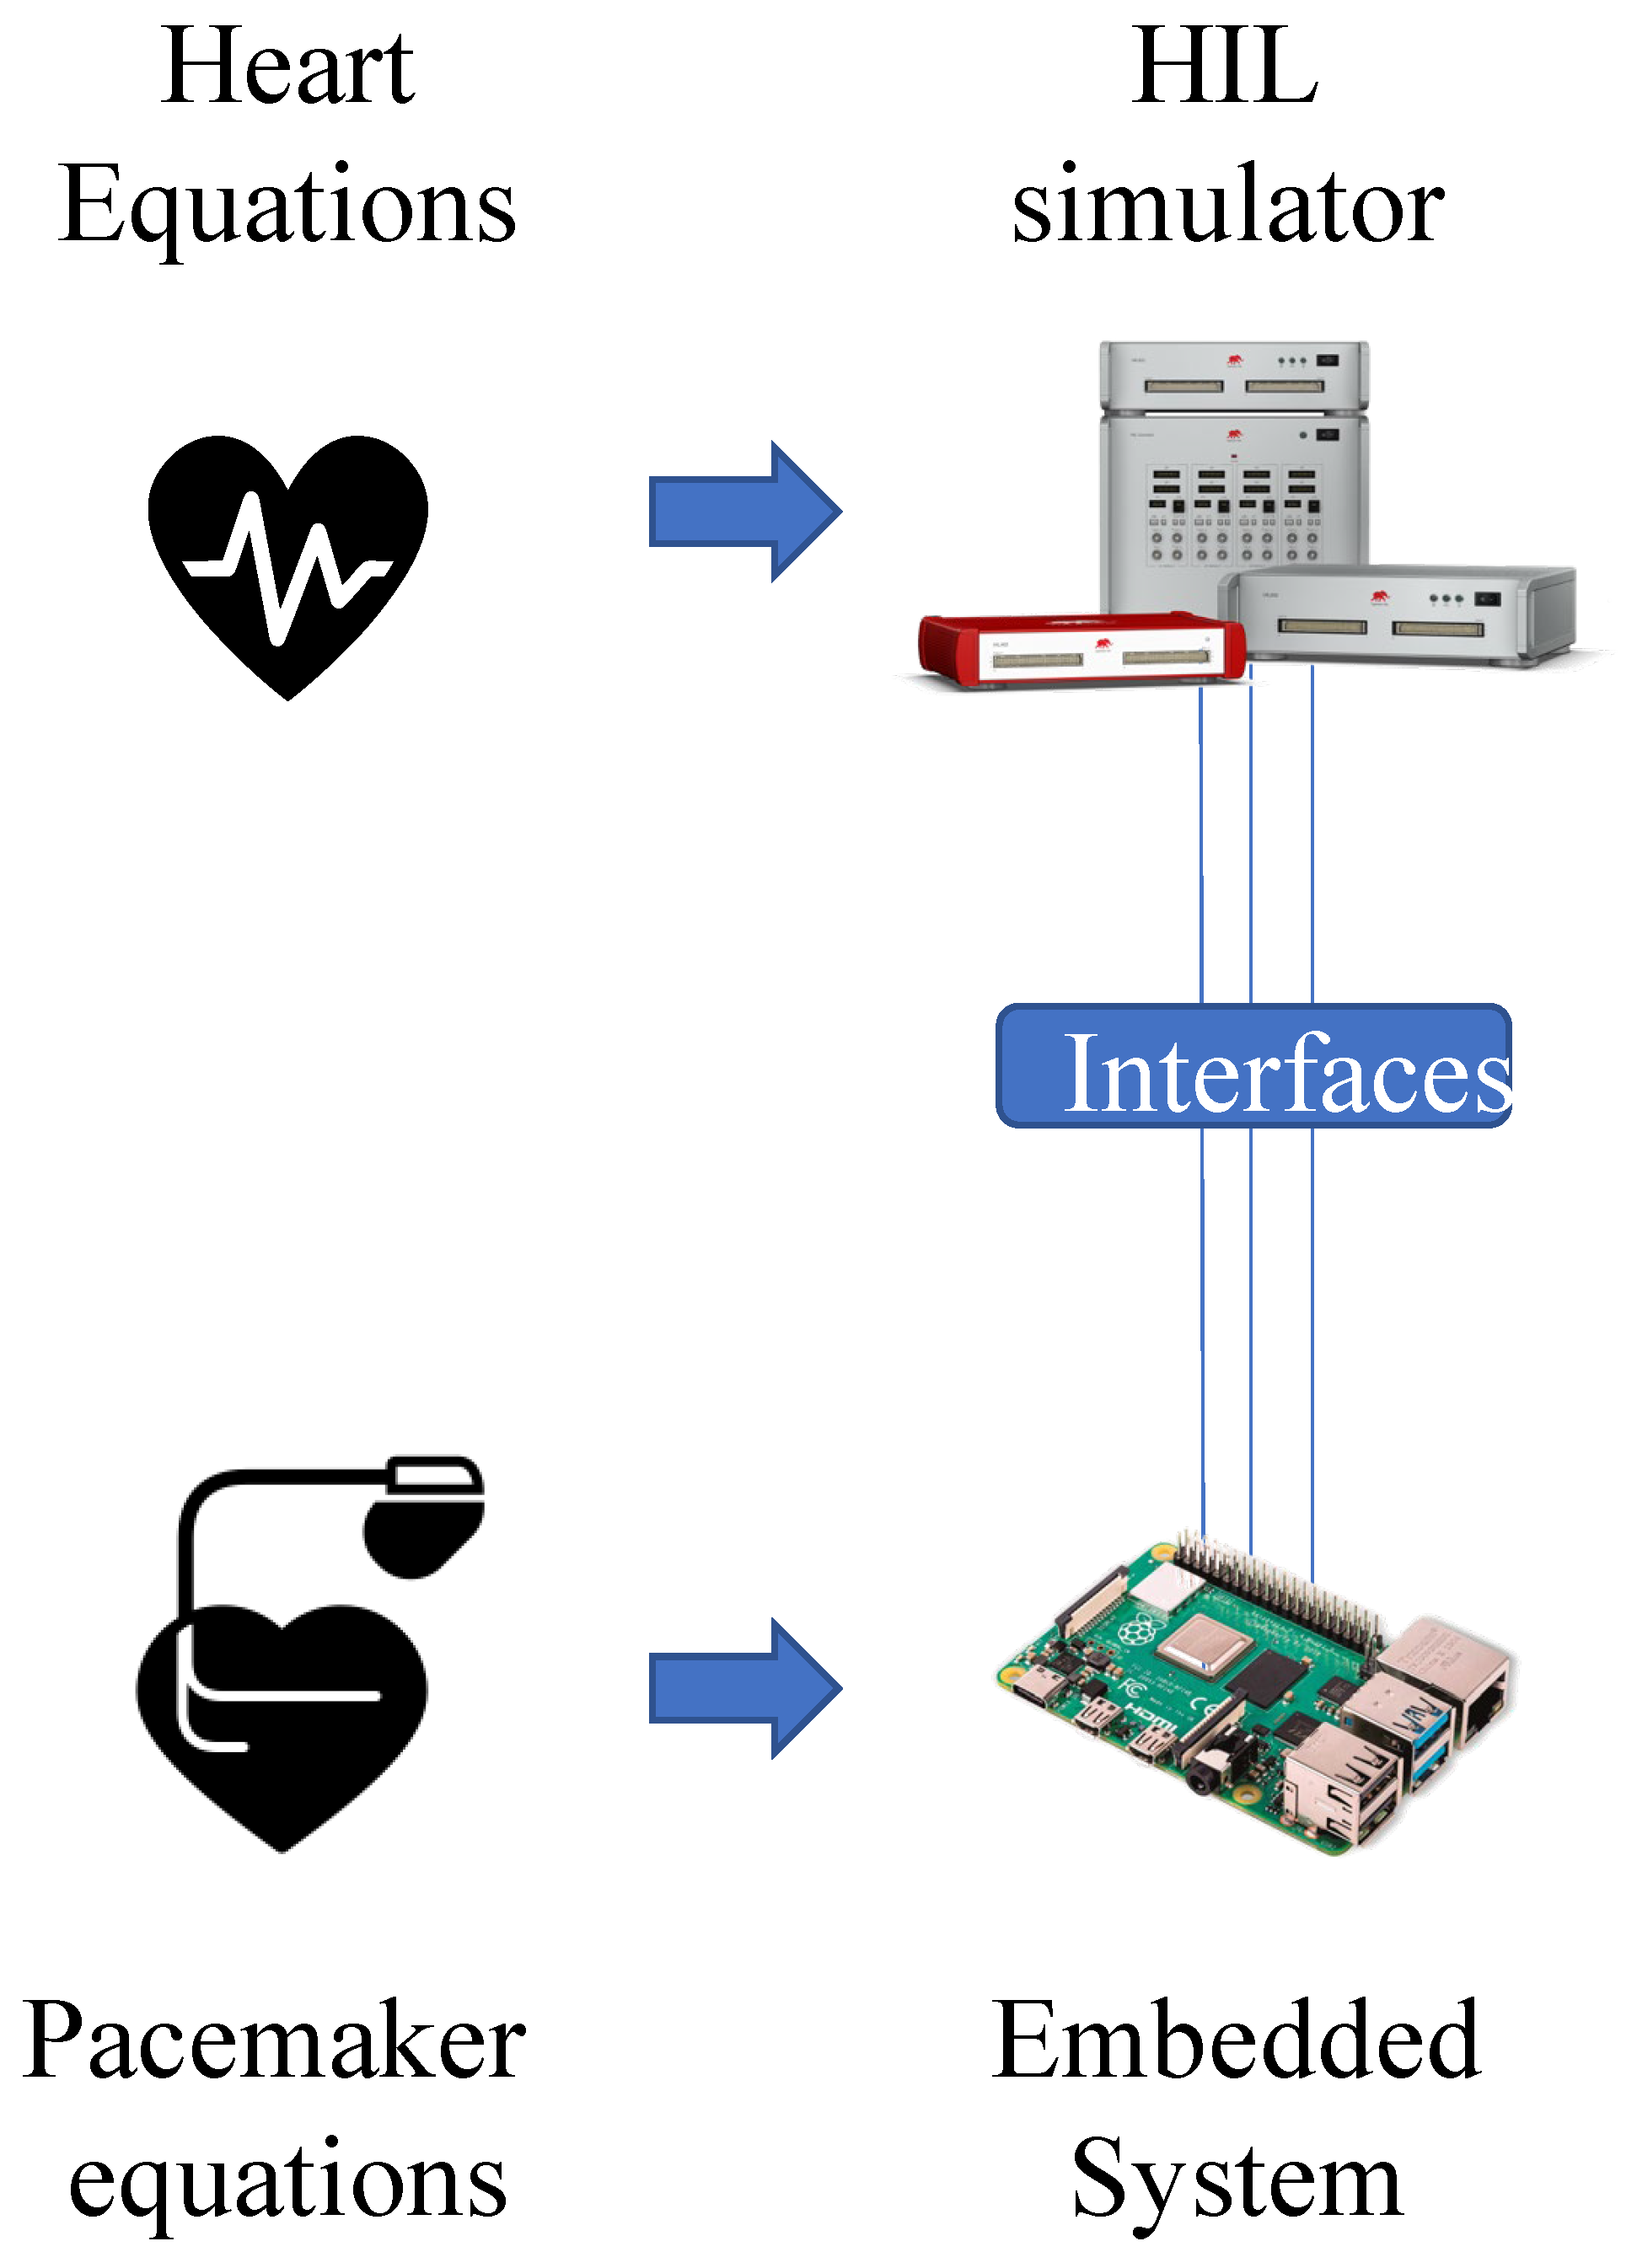
Figure 1. Main features of the proposed methodology.
Electronics 09 00571 g001
Figure 2. Simulation of the action potential of Sino-Atrial node SN.
Electronics 09 00571 g002
Figure 3. Simulation of action potential of AV (atrioventricular node).
Electronics 09 00571 g003
Figure 4. Simulation of action potential of HP (His–Purkinje fibers).
Electronics 09 00571 g004
Figure 5. Simulation of ECG through FitzHugh–Nagumo model.
Electronics 09 00571 g005
Figure 6. Simulation of sinus tachycardia through FitzHugh–Nagumo model.
Electronics 09 00571 g006
Figure 7. Representation of sinus bradycardia through FitzHugh–Nagumo model.
Electronics 09 00571 g007
Figure 8. Simulation of atrial fibrillation replaced through FitzHugh–Nagumo model.
Electronics 09 00571 g008
Figure 9. General model of the Heart implemented in the hardware simulator [22].
Electronics 09 00571 g009
Figure 10. Implementation of the delayed equations: inside the electrical conduction block.
Electronics 09 00571 g010
Figure 11. HIL SCADA: general model.
Electronics 09 00571 g011
Figure 12. Panel to set the tachycardia in the ECG. Physiological condition.
Electronics 09 00571 g012
Figure 13. Panel to set the bradycardia in the ECG. Physiological condition.
Electronics 09 00571 g013
Figure 14. Panel to set the AF in the ECG. Physiological condition.
Electronics 09 00571 g014
Figure 15. Experiment with the oscilloscope.
Electronics 09 00571 g015
Figure 16. System of heart and pacemaker implemented.
Electronics 09 00571 g016
Figure 17. (a) Atrial events sensed by the pacemaker in physiological case. (b) Ventricular events sensed by the pacemaker in physiological case. (c) Atrial pacing in physiological conditions. For all the graphs the x-scale represents the time in seconds, while the y-scale the signal in volts.
Electronics 09 00571 g017
Figure 18. (a) Atrial events recorded in pathological conditions T. (b) Atrial pacing in pathological conditions. (c) Ventricular pacing in pathological conditions For all the graphs the x-scale represents the time in seconds, while the y-scale the signal in volts.
Electronics 09 00571 g018
Figure 19. (a) The beat of the heart (yellow) and the response of the pacemaker (cyan) on the same graph. It is possible to see as the pacemaker replace perfectly the missing beats in the case of low rhythm the x-scale represents the time in seconds, while the y-scale the signal in volts. (b) As for (a) but the signal measured in output of HIL hardware.
Electronics 09 00571 g019