1. Introduction
In the 1980s, laser-levelling technology was extensively used in the United States, the former Soviet Union, Germany, and Japan [
1]. Laser land-levelling technology can effectively improve the levelling of farmlands, ensure that the distribution of irrigation water is more homogeneous, increase the irrigation efficiency by 10%–15%, and save irrigation water by more than 10%. Moreover, it can ensure that the fertilizer is evenly distributed on the roots of the crops, can effectively improve the utilization rate of the fertilizer, reduce the trench area in the field, and increase the cultivated land area by 3%–5%. It can also improve the growth environment of the crops, and increase the survival rate and crop yield by more than 20%. Furthermore, it can improve the efficiency of agricultural mechanization and lay the foundation for precise seeding and fertilization [
2,
3,
4,
5,
6,
7,
8,
9,
10,
11,
12,
13,
14]. The laser level control system is mainly composed of a laser transmitter, laser receiver, controller, hydraulic system, and a scraper. A laser receiver installed on the scraper’s mast is used to detect the deviation of the actual elevation of the rotating laser from the expected elevation, and the elevation deviation information is then used to control the hydraulic system to drive the scraper to achieve automatic lifting, thereby achieving accurate farmland levelling [
15]. Owing to uneven farmland surfaces [
16], some graders are designed with inclination detection and automatic levelling control functions to further improve the levelling of the farmland [
17,
18,
19].
The laser receiver is an important part of the laser levelling control system, and a variety of laser receivers have been researched and developed. Liu et al. [
20] used a red plexiglass to filter background light bands, and then used an interference filter for the second filtering stage, to reduce the interference of natural light on silicon photovoltaic cells. Xie et al. [
21] designed an electrical signal amplification circuit for silicon photocells, with the use of integrated operational amplifiers. The laser receiver had a resolution of ±11 mm and a working range of 150 m. Ke et al. [
22] studied the photoelectric conversion characteristics of silicon photovoltaic cells, and optimized the parameters of the photoelectric conversion circuit and amplifier circuit. Based on correlation tests, the factors that affected the amplitude of the photoelectric conversion signal of the laser receiver were analyzed, such as the receiving distance, solar irradiance noise, vibration noise, and effective laser signal amplitude frequency. Accordingly, the laser receiver had a resolution of ±11 mm and a working range of 250 m. The American Trimble company developed the LS908 laser receiver, and it selected a silicon photocell as the photodetector (photosensitive surface size of 5 mm × 20 mm). They also designed an efficient operational amplifier circuit and signal processing circuit, with an elevation detection accuracy of ±10 mm [
23]. With the development of laser levelling technology, the requirements for precision have increased, and many companies have developed high-precision laser receivers. One example is the LR40 laser receiver that was developed by Trimble in the United States; it selected a small silicon photocell as the photodetector (photosensitive surface size of 3 mm × 5 mm) and the operational amplifier circuit and the signal processing circuit were optimized, of which the elevation detection accuracy could be set to ±3 mm, ±6 mm, ±9 mm [
23]. By contrast, the MLS700 laser receiver developed by Leica in Switzerland, and the LS-B110 laser receiver developed by Topcon in the United States, selected photodiode as the photodetector (photosensitive surface size of 3 mm × 5 mm) and designed a fast and stable signal modulation circuit, with elevation detection accuracies of ±3 mm [
24,
25]. In addition, the LR-8 laser receiver developed by BOSCH in Germany selected a CCD image sensor as the photodetector (photosensitive surface size of 2.5 mm × 34 mm) and has an elevation detection accuracy of ±3 mm [
26]. All the aforementioned laser receivers use photocells and photodiodes as photodetectors, and can achieve multilevel adjustable elevation detection accuracy, with a maximum value of ±3 mm. However, the aforementioned laser receivers did not explore the diffusion characteristics of different laser beam transmission distances or the influence on the accuracy of the elevation detection during the development of the laser receiver, and were not used to conduct systematic tests and regular analyses.
Therefore, in this study, the law of laser beam spot diameter transmission and diffusion is studied by testing. Optimization designed a new type of laser receiver, and a calculation method of elevation deviation of a rotating laser is proposed, through densely arranged photoelectric conversion arrays and rotating laser elevation deviation calculation methods, which accurately obtain the geometric center elevation position of the laser beam spot image, and detection accuracy of elevation deviation can be adjusted in multi-level (that could be set to ±3 mm, ±6 mm, ±9 mm, ±12 mm, and ±15 mm). Based on the tests and analyses, the change rule of the elevation detection accuracy of the laser receiver on the transmission distance was also evaluated. The laser receiver designed in this article can be shared with agricultural laser graders and concrete levelers to meet the farmland construction requirements and the construction requirements of the concrete industry, which are of a high standard.
2. Laser Receiver Design
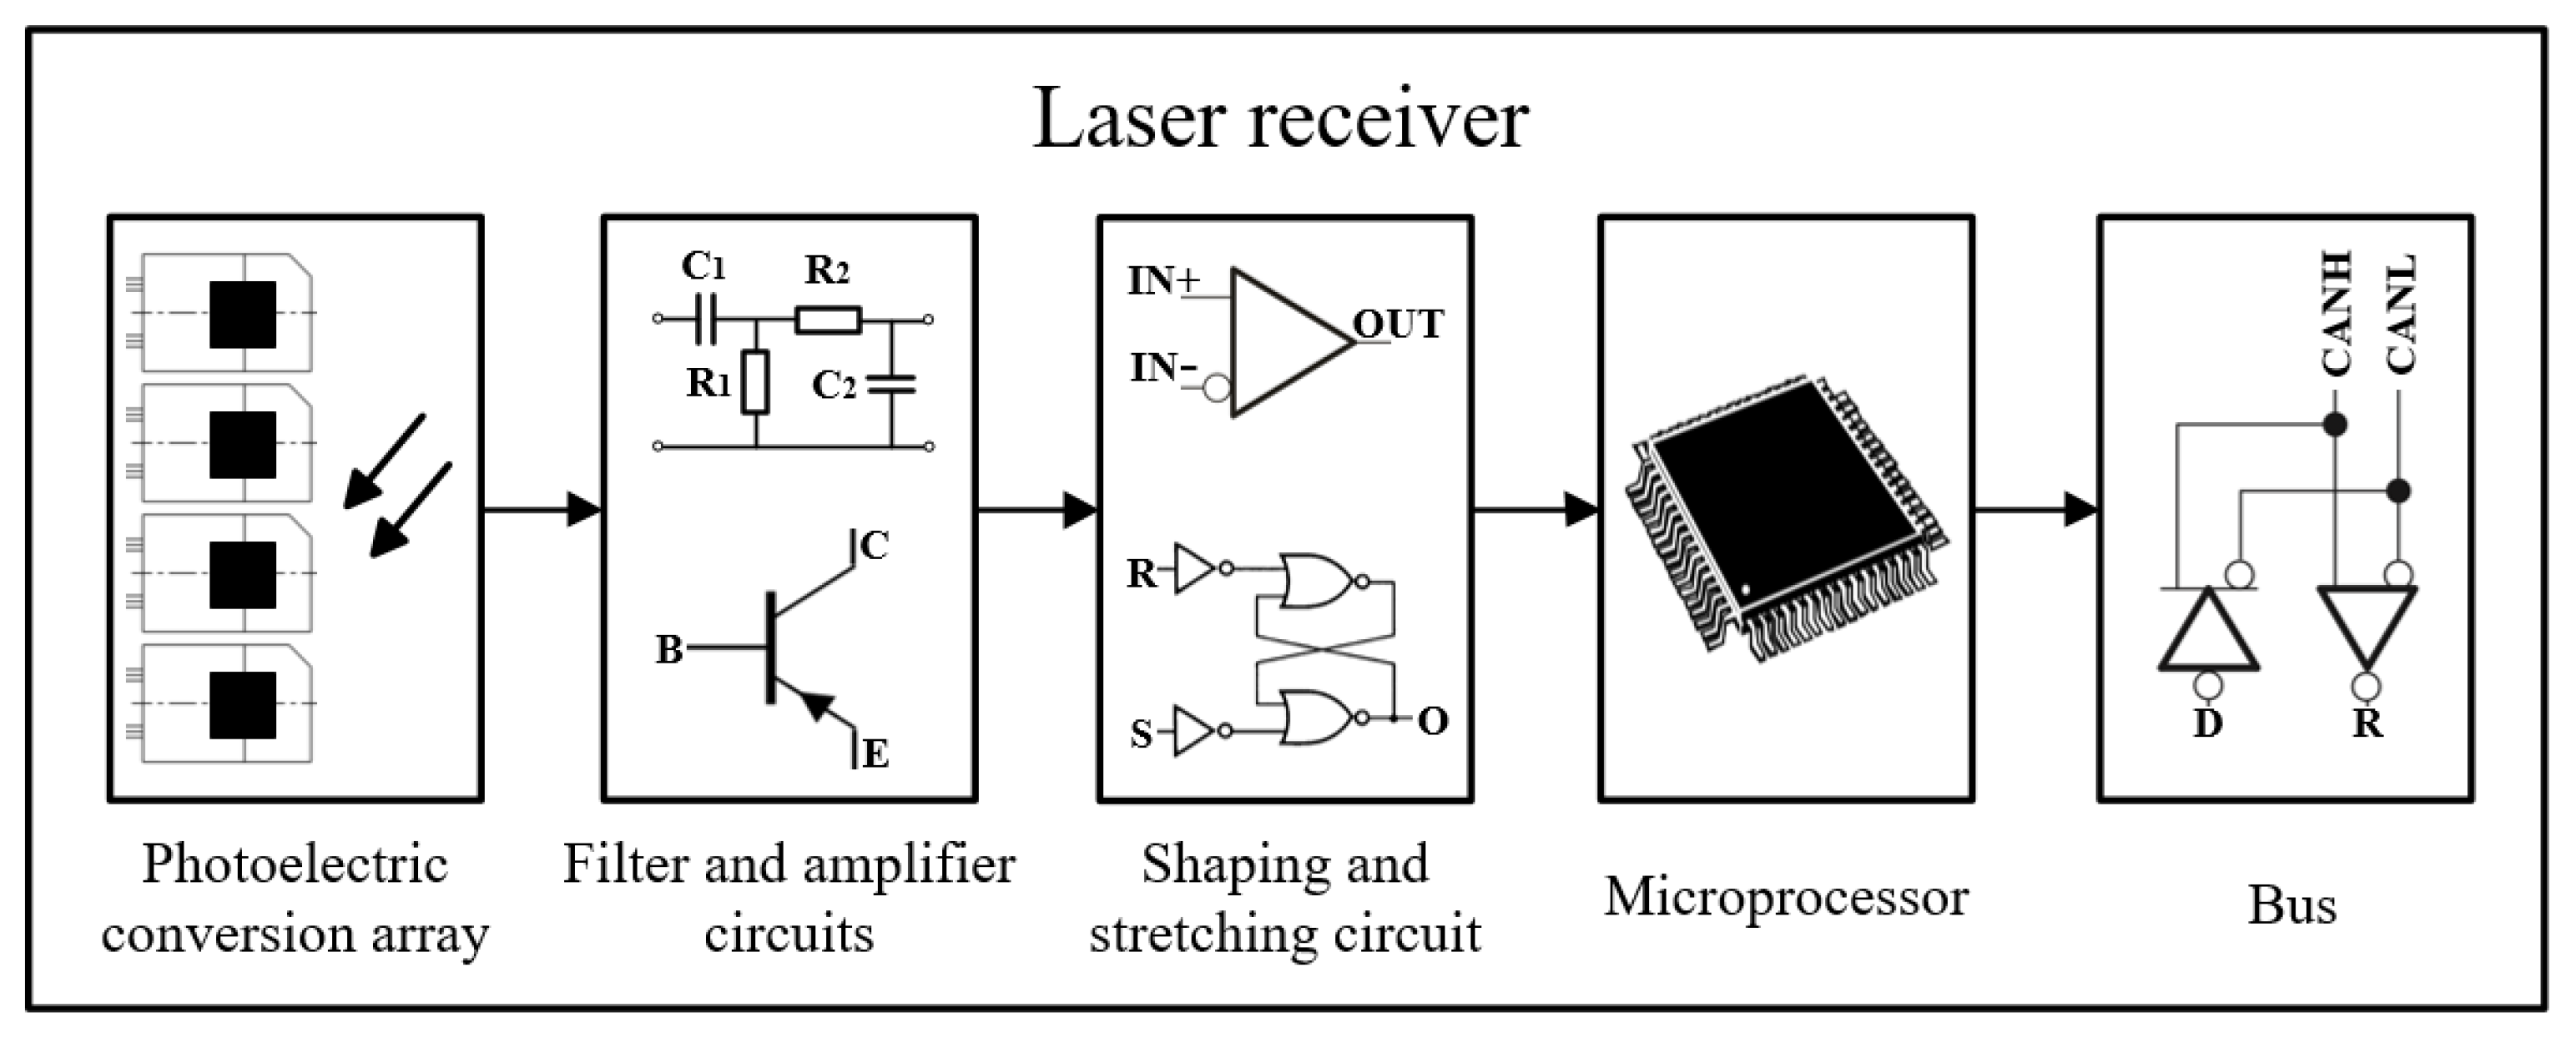
The structure of the laser receiver is shown in
Figure 1. It consists of a photoelectric conversion array, filter and amplifier, shaping and stretching circuits, a microprocessor, and a bus.
2.1. Photoelectric Conversion Array
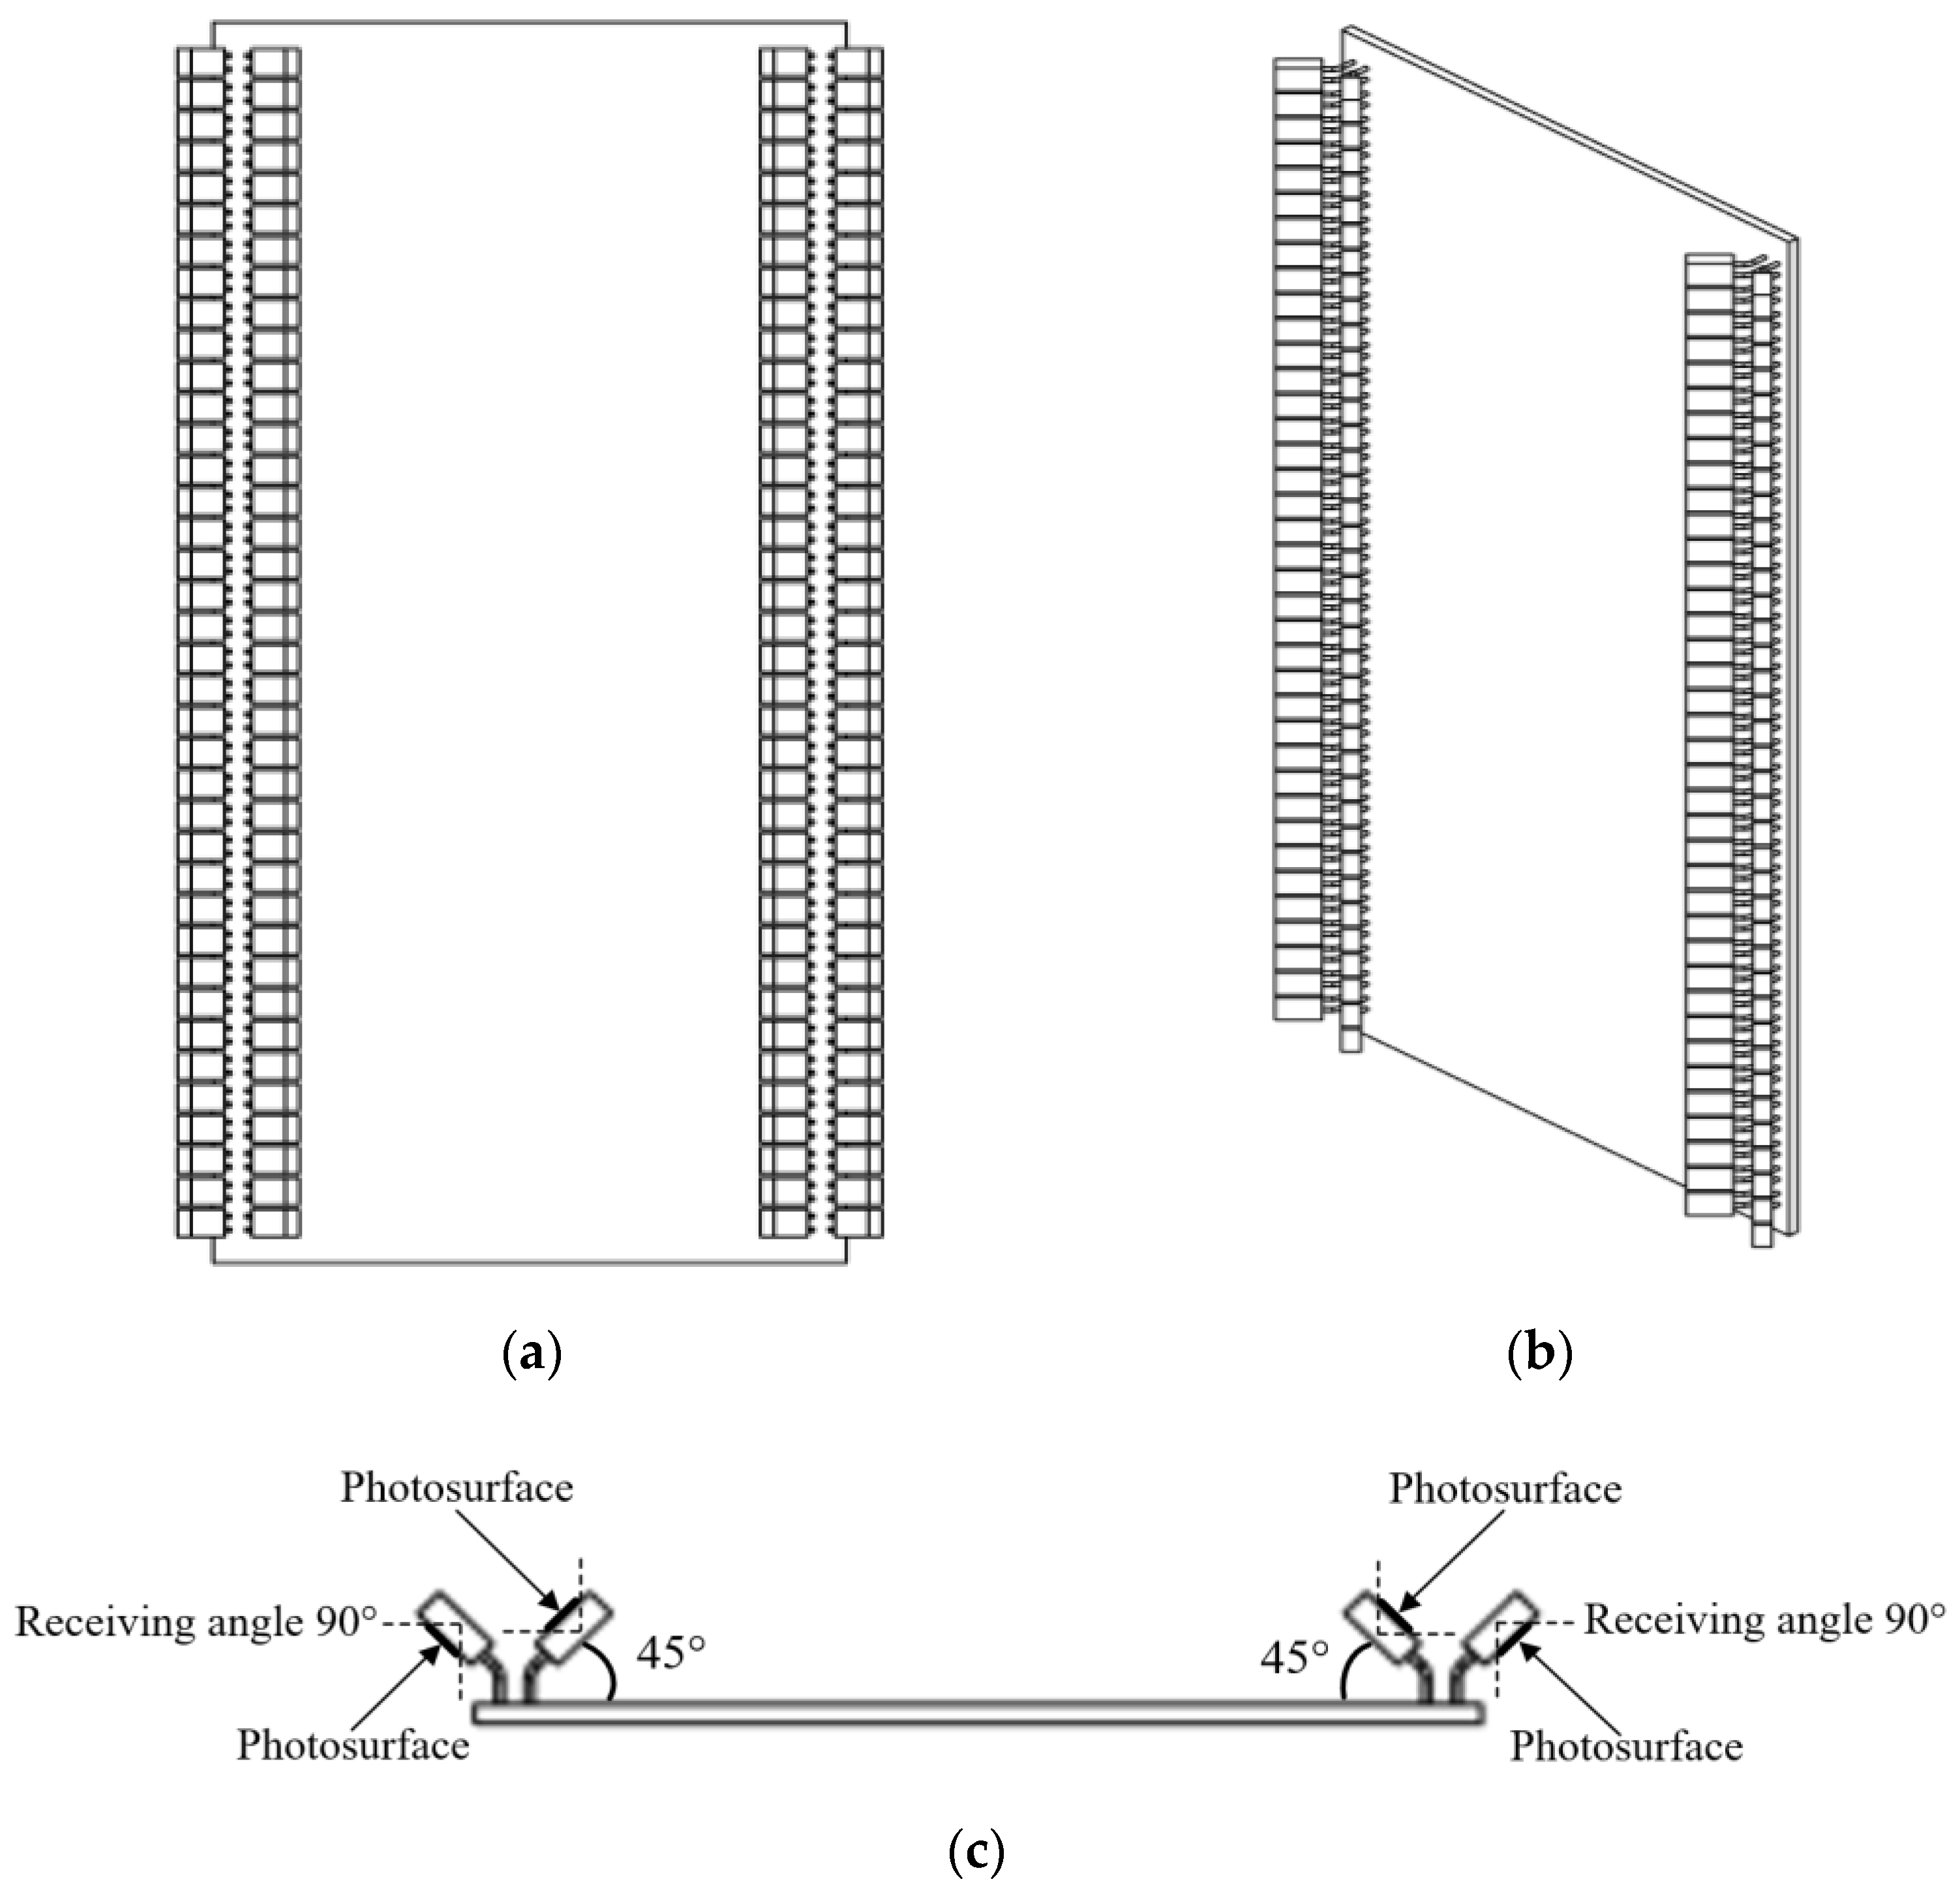
The photoelectric conversion array selected a silicon photodiode (Everlight Electronic, PD638C) as the photodetector (package size of 7.5 mm × 5.5 mm, a photosensitive surface size of 3 mm × 3 mm, response time: 50 ns, and wavelength of peak sensitivity: 940 nm). The arrangement of the photoelectric conversion array is shown in
Figure 2, whereby 152 silicon photodiodes are arranged in 38 rows and 4 columns, and the interval between the adjacent silicon photodiodes is 0.5 mm. This makes the vertical effective detection distance of the laser receiver to be 225 mm. The angle between the four rows of the silicon photodiodes and the receiver circuit board is 45°and the angle of each silicon photodiode is 90°, which can realize the laser receiver detect the laser signal from 0° to 360°.
2.2. Filter and Amplifier Circuit
The photocurrent signal after the photoelectric conversion is weak, and it is accompanied by noise signal interference. Thus, it is necessary to design a filter amplifier circuit with high gain and low noise characteristics [
27].
The laser transmitter rotates at a speed of 600 revolutions/min. After the photoelectric conversion, a periodic pulse signal with a frequency of 10 Hz can be obtained. The calculation of the pulse signal width τ is shown in Equation (1).
In the equation, τ is the pulse signal width in μs, is the laser beam transmission distance in m, and is the width of the photosensitive surface of the silicon photodiode in mm.
The center frequency
of the band-pass filter is shown in Equation (2). As indicated, as the laser beam transmission distance increases, the center frequency of the band-pass filter increases. Therefore, the center frequency of the band-pass filter should be calculated based on the shortest distance between the laser receiver and the laser transmitter, to ensure that within the working range of the laser receiver, the frequency of the pulse signal is concentrated at the center frequency of the band-pass filter.
In the above equation, is the center frequency of the band-pass filter.
After the filtering process, the PNP transistor is selected to form a single-stage, common emitter amplifier circuit, to amplify the millivolt-level voltage signal. The voltage gain calculation is shown in Equation (3).
In the equation, is the output voltage of the amplifier circuit in V, and is the input voltage of the amplifier circuit in V.
2.3. Shaping and Stretching Circuit
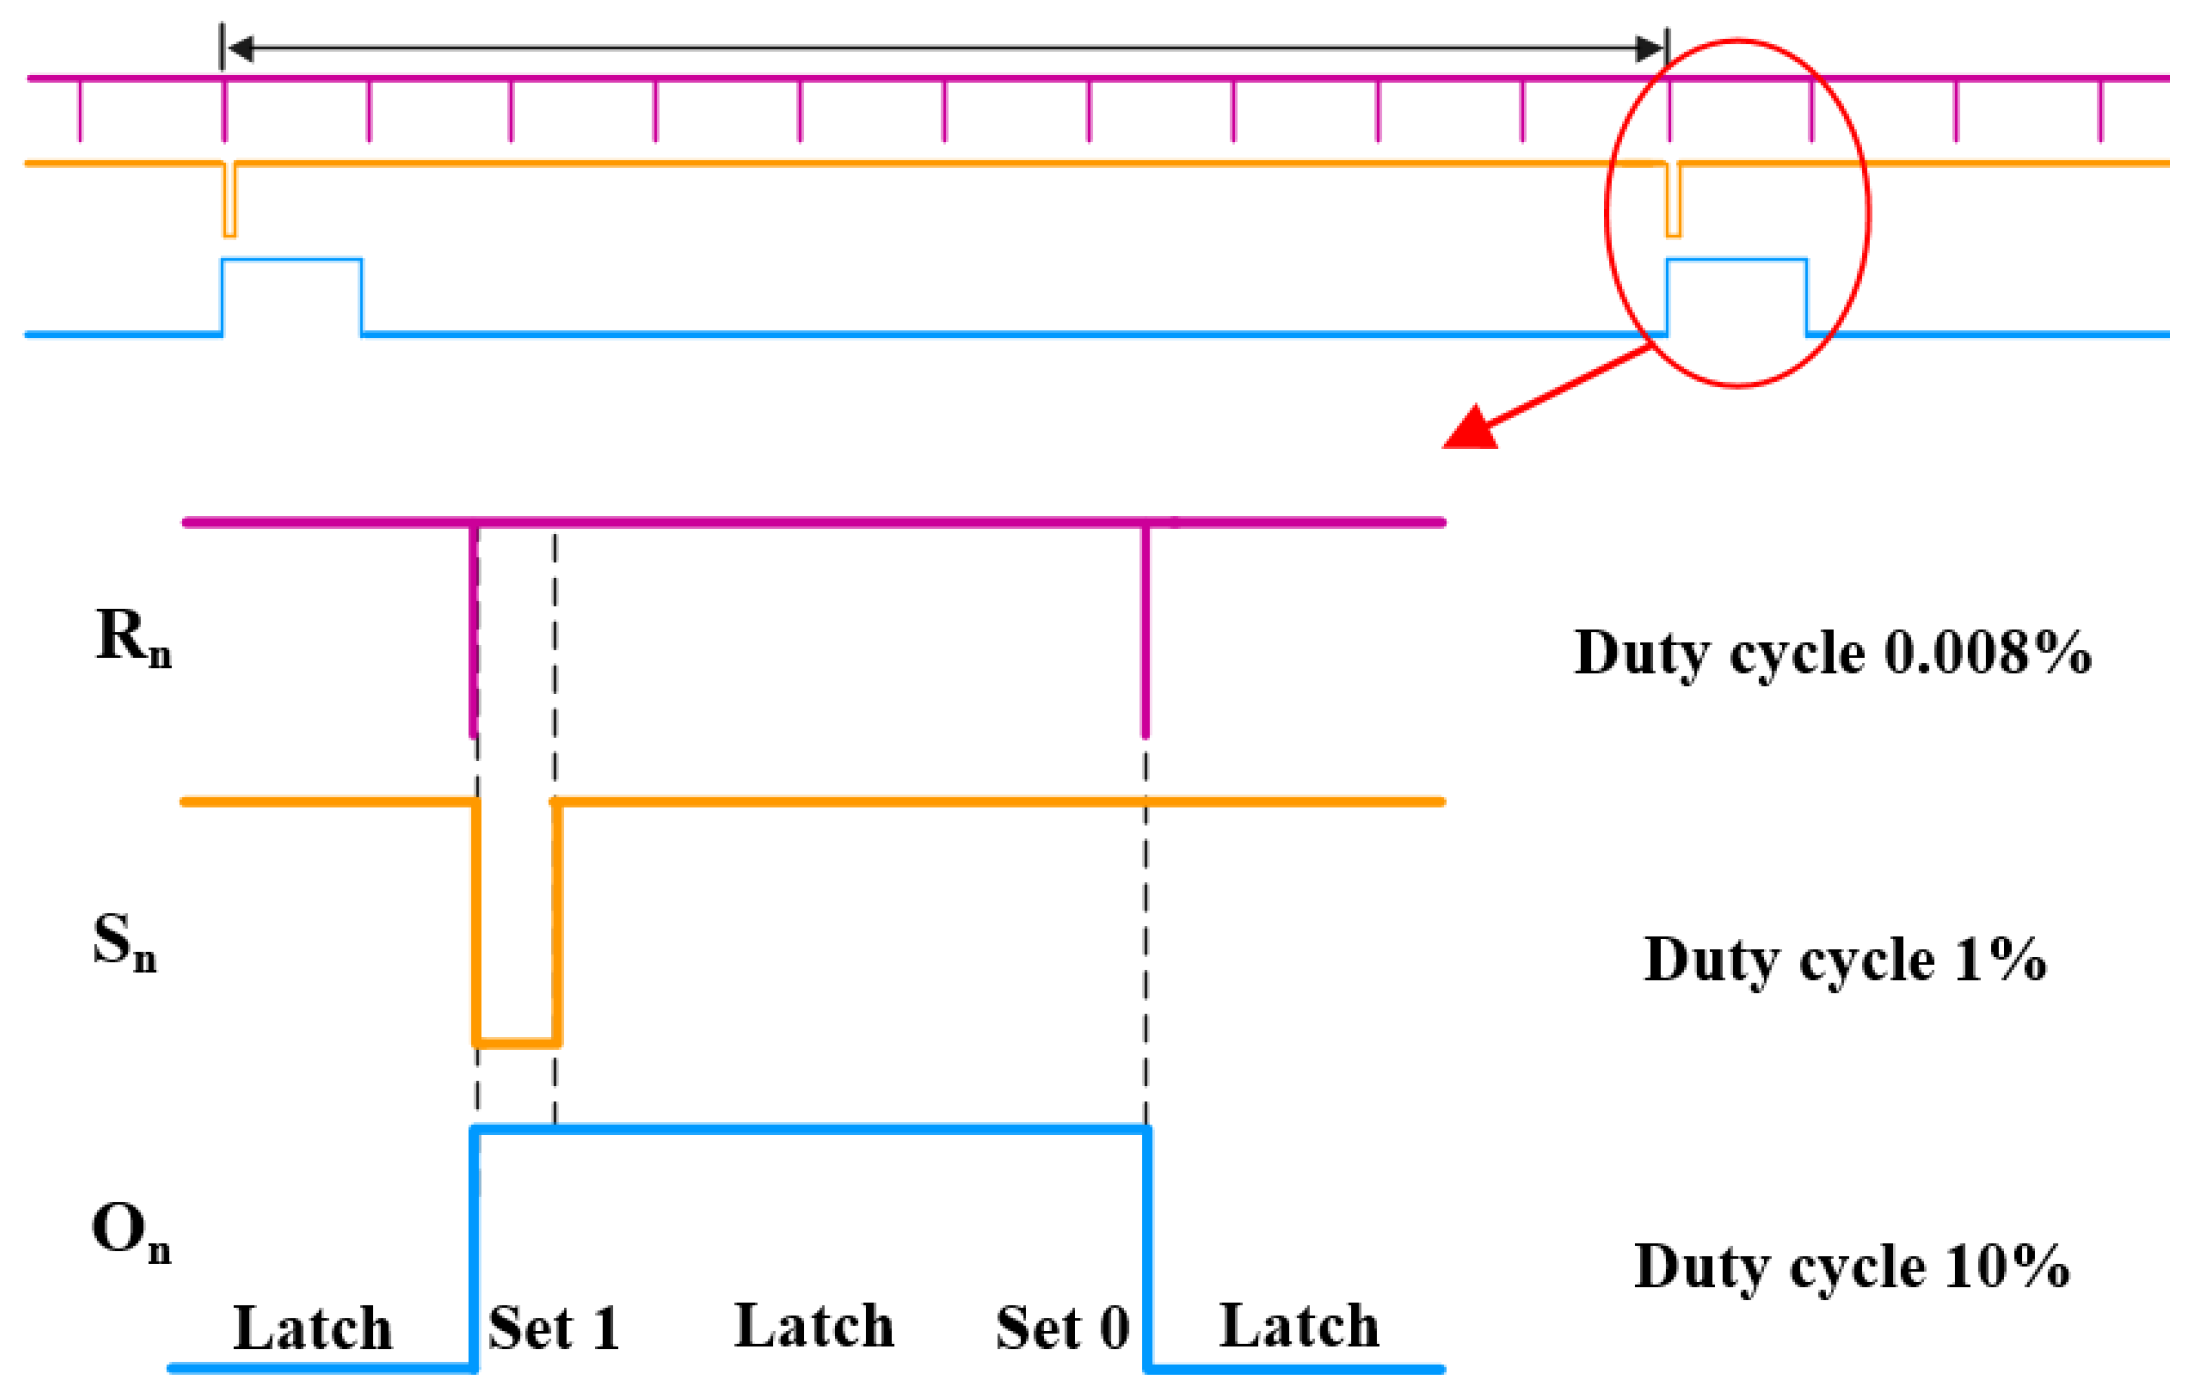
To facilitate the microprocessor to process the data, the filtered and amplified signal needs to be shaped and pulse stretched. First, a differential comparator is used to convert the filtered and amplified signal into a transistor–transistor logic (TTL) signal, with a frequency of 10 Hz and a duty cycle of 1%. Second, a trigger signal with a frequency of 100 Hz and a duty cycle of 0.008% is used to trigger the tri-stable R-S latch, to achieve pulse stretching. The principle is shown in
Figure 3. When the shaped input signal S
n is at a low level and the trigger signal R
n is at a high level, the output signal O
n is at a high level. When the shaped input signal S
n is at any level and the trigger signal R
n is at a low level, the output signal O
n is at a low level. When the shaped input signal S
n is at a high level and the trigger signal R
n is at a high level, the output signal O
n is in a latched state. The trigger signal R
n stretched the duty cycle of the input signal S
n 10 times, that is, the duty cycle was stretched from 1% to 10%.
3. Transmission and Diffusion of Laser Beam Spot Diameter
In ideal conditions, the laser beam generated by the laser transmitter through the laser gain medium, pump source, and optical cavity, is a Gaussian beam. The spot gradually diffuses as the transmission distance increases. Accordingly, the diffusion rate first increases and then stabilizes [
28]. The transmission and diffusion law of the Gaussian beam spot diameter is expressed by Equation (4).
In the equation, D is the spot diameter in mm, r is the spot radius in mm, x is the transmission distance in m, is the initial spot radius in mm, and λ is the wavelength in nm.
3.1. Equipment and Method for Spot Diameter Measurement Test
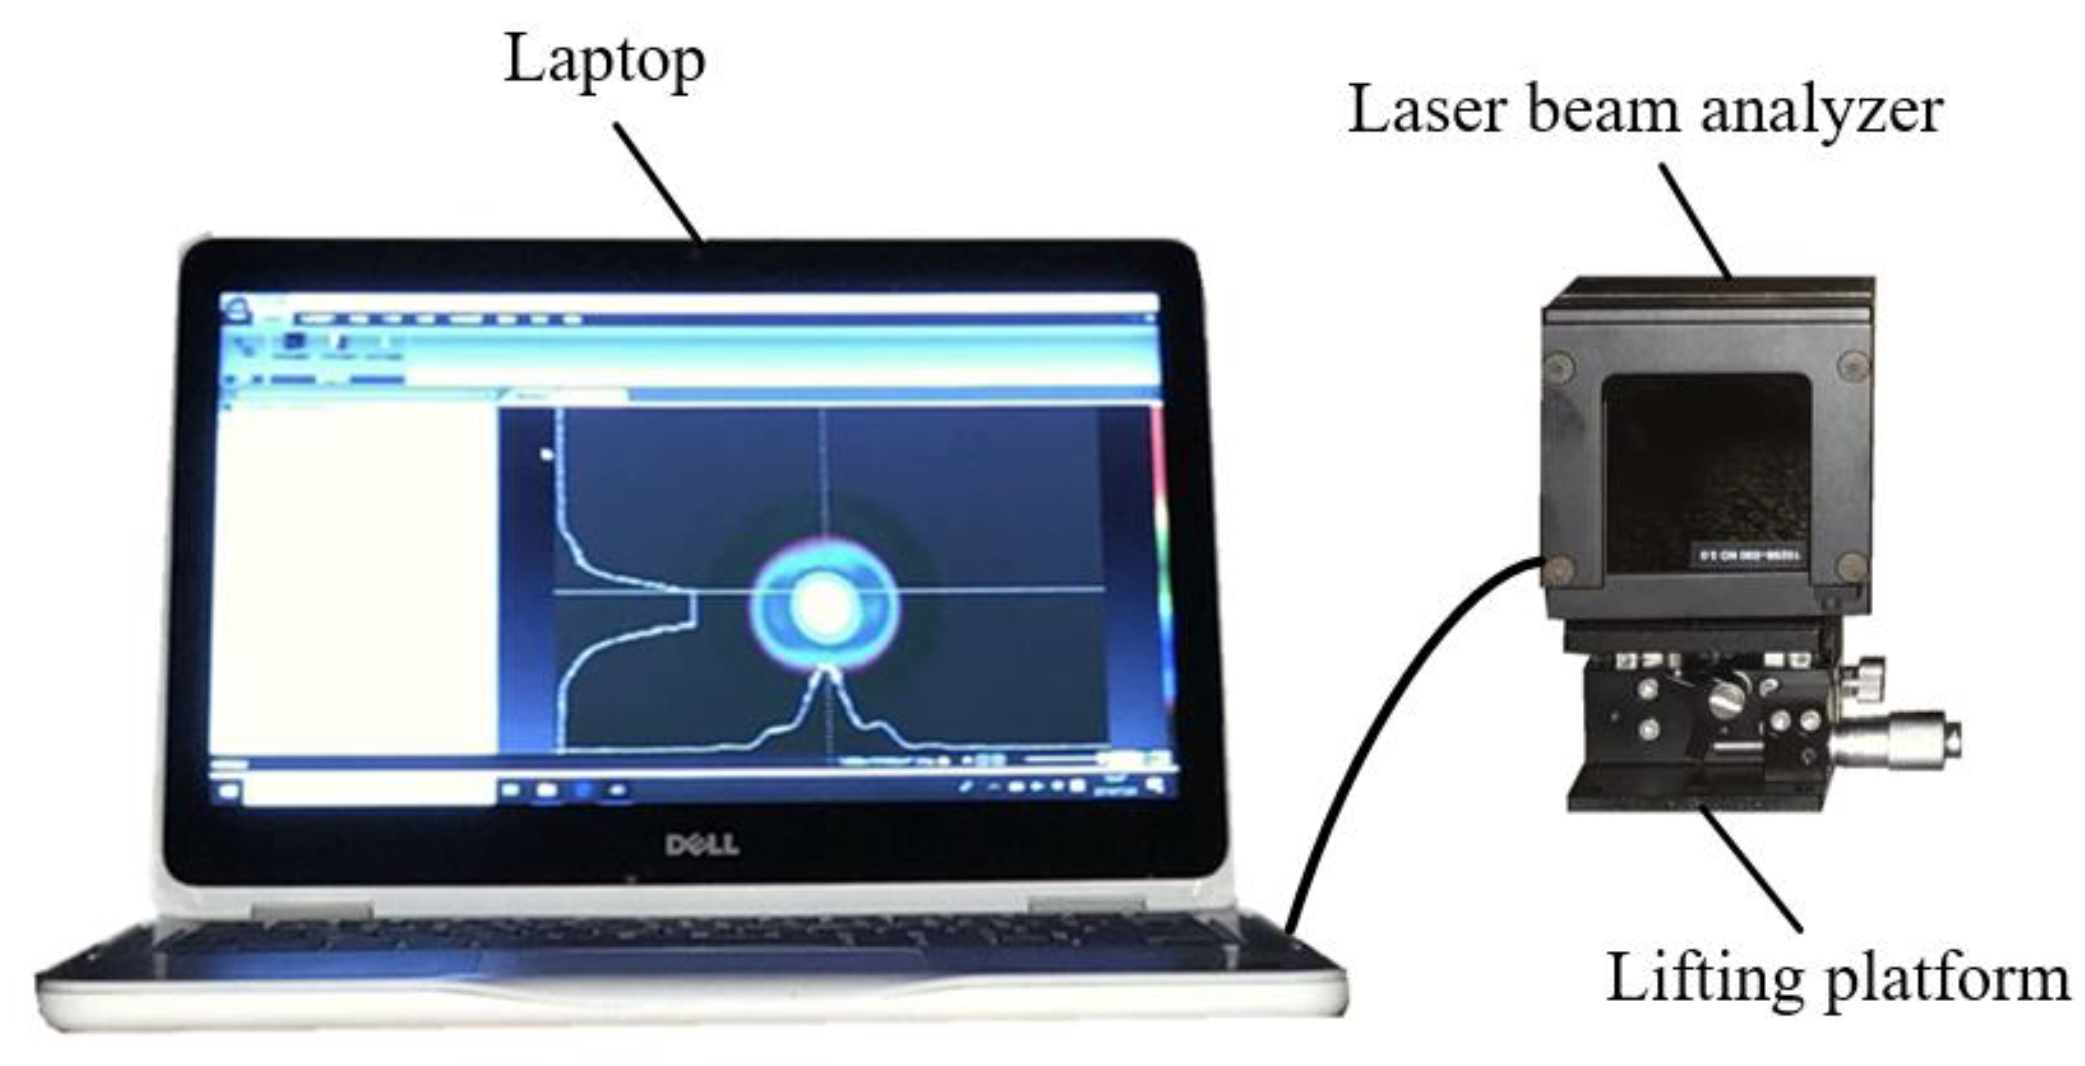
The laser beam spot image collection test was performed in a sports field, and the test scheme and main equipment are shown in
Figure 4. At the beginning of the 100 m runway, a laser beam analyser (Spiricon, L11059) was installed on a lifting platform (accuracy = 0.01 mm) to fine-tune the displacement, and was connected to a laptop (DELL, Inspiron-11) via a universal serial bus (USB) interface. Additionally, a pulsed laser mode was selected to be at 10 m, 20 m, …, 90 m, and 100 m away from the laser transmitter (Topcon, RL-H4C), to collect laser beam spot images. The BeamGage (Ophir-Spiricon, v6.8) software was used to analyze the fitted Gaussian of the beam of the laser beam spot image, and the laser beam spot diameter was calculated at transmission distances in the range of 100–200 m.
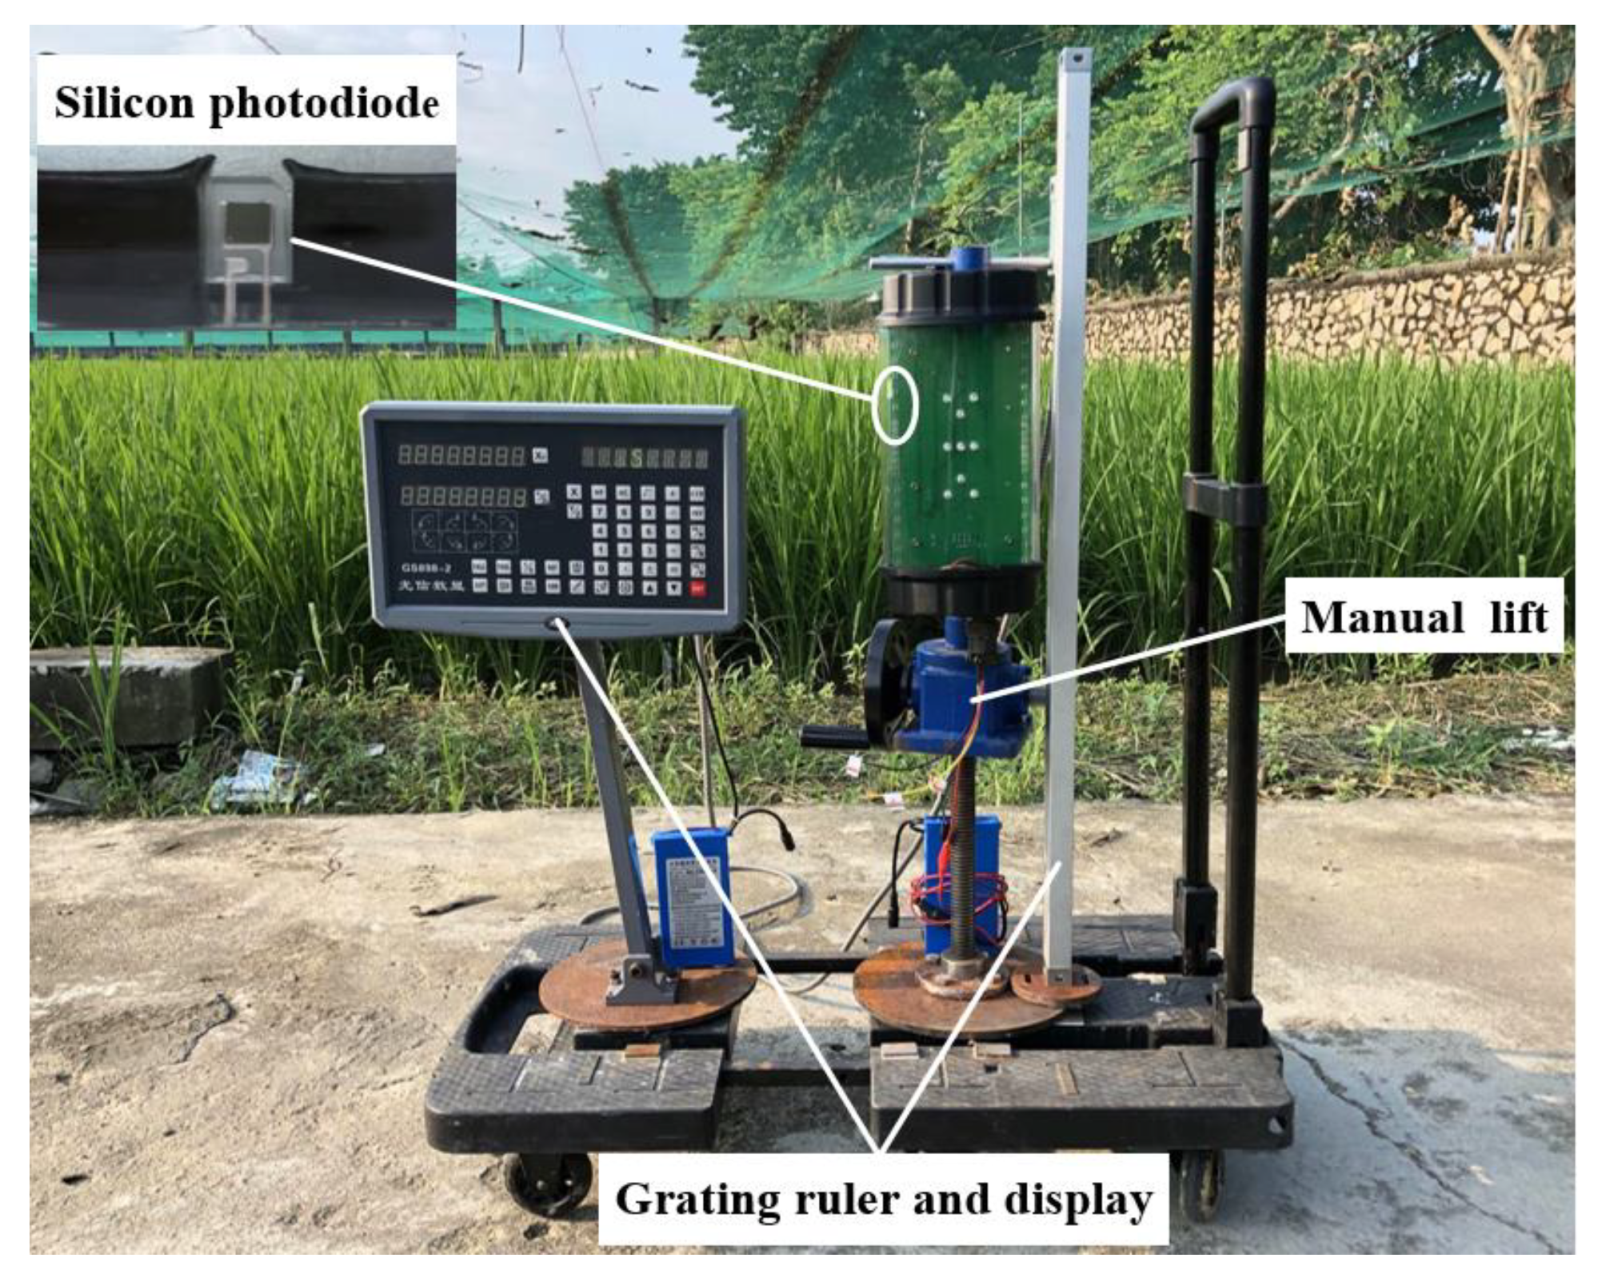
The laser beam spot diameter measurement test that can be detected by the laser receiver was carried out at the research base of the South Chinese Agricultural University in Guangzhou. The test scheme and main equipment are shown in
Figure 5. As shown, the laser receiver installed on the manual lift contains only one silicon photodiode that can detect the laser signal (other silicon photodiodes are covered by a black film). When the laser beam transmission distance is 10 m, 20 m, …, 190 m, and 200 m, the elevation position of the laser receiver is adjusted by the manual lift (accuracy = 0.05 mm), and the digital grating ruler (accuracy = 5 μm) is used to measure the laser beam spot diameter that can be detected by the laser receiver.
3.2. Law and Analysis of Spot Diameter Transmission and Diffusion
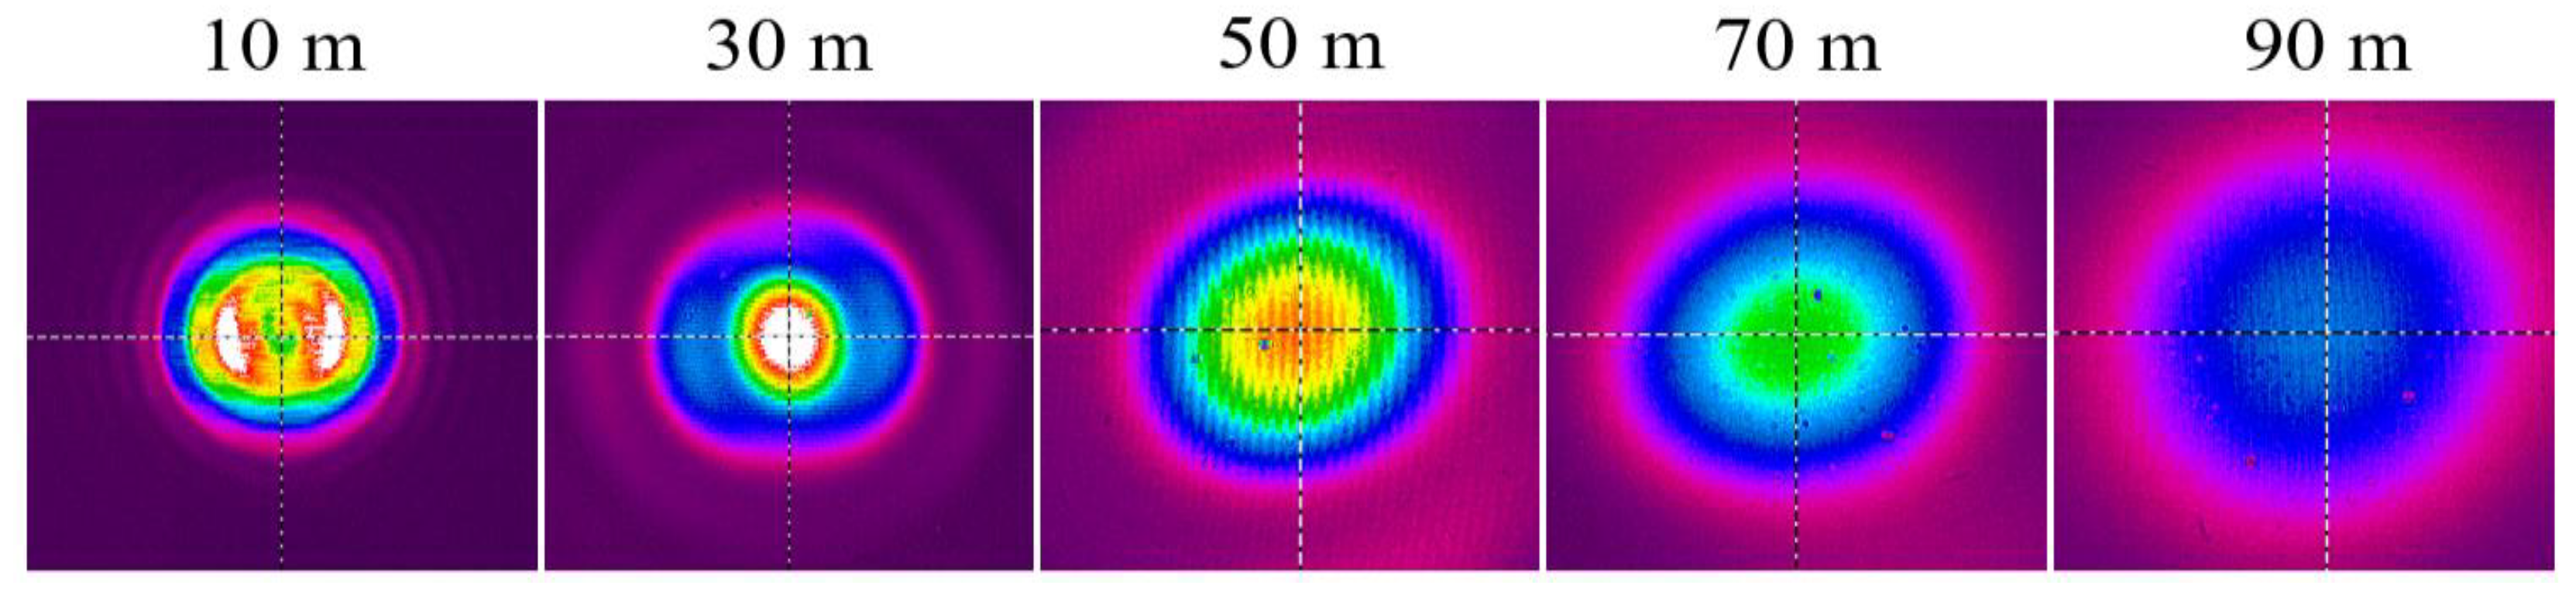
The laser beam spot images at the transmission distances of 10 m, 30 m, 50 m, 70 m, and 90 m, are shown in
Figure 6. As the transmission distance increases, the spot of the laser beam continues to diffuse and forms a multistage amplified light ring.
The comparison of the actual and detectable laser beam spot diameters are shown in
Figure 7 for transmission distances in the range of 10–200 m. The transmission and diffusion law of the laser beam spot diameter is consistent with that of the Gaussian beam spot diameter (expressed by Equation (4)), but it is significantly different from the corresponding law of the detected laser beam spot diameter. When the transmission distance is in the range of 10–50 m, the range of the laser beam spot diameter that can be detected is 6.85–8.93 mm. When the transmission distance is in the range of 50–150 m, the fitting equation of the detectable laser beam spot diameter is Y
1 = 0.1971X
1−1.256 (R
2 = 0.9985), and the spot diameter is increased from 8.93 mm to 28.53 mm. When the transmission distance is greater than 150 m, the laser beam spot diameter gradually becomes smaller, and the fitting equation of the detectable laser beam spot diameter is Y
2 = −0.07923X
2 + 38.91(R
2 = 0.9978).
4. Calculation of Rotating Laser Elevation Deviation
A schematic of the rotating laser illumination photoelectric conversion array is shown in
Figure 8. When the photosensitive surface of a silicon photodiode is illuminated by the rotating laser, the elevation deviation is calculated as the error between the center position of the illuminated silicon photodiode and the zero position of the laser receiver. As the transmission distance increases, the laser beam spot diameter becomes larger, and when the photosensitive surface of multiple silicon photodiodes is illuminated by the rotating laser at the same time, the elevation deviation is calculated as the error between the centers’ positions of the illuminated multiple silicon photodiodes and the zero position of the laser receiver. This calculation method can accurately obtain the geometric center elevation position of the laser beam spot image, and it can effectively reduce the calculation error of elevation deviation caused by the laser beam spot diffusion.
The longitudinal center of the photoelectric conversion array is defined as the zero position. When the rotating laser is illuminated above the zero position, elevation deviation is defined as a positive number. In all other cases, elevation deviation is defined as a negative number. The calculation of elevation deviation is expressed by Equation (5).
In the above equation, Δx is the elevation deviation in mm, i is the number of silicon photodiodes above the zero position illuminated by the rotating laser, j is the number of silicon photodiodes below the zero position illuminated by the rotating laser, a is the width of the silicon photodiode in mm, b is the distance between two adjacent silicon photodiodes in mm, n is the code (1–19) of the silicon photodiode above the zero position illuminated by the rotating laser, and m is the code (−1 to −19) of the silicon photodiode below the zero position illuminated by the rotating laser.
The width of the silicon photodiode is a = 5.5 mm, and the distance between two adjacent silicon photodiodes is b = 0.5 mm. According to Equation (5), the elevation deviation detection resolution is ± 3 mm. By modifying the equation used to calculate the elevation deviation in the algorithm, the accuracy of the elevation deviation detection can be set to ±3 mm, ±6 mm, ±9 mm, ±12 mm, and ±15 mm. Therefore, the accuracy can be adjusted at a multiple level to meet different accuracy requirements.
5. Tests and Analyses
5.1. Testing and Analysis of the Laser Receiver Elevation Detection Accuracy
5.1.1. Test Materials and Methods
The test method is shown in
Figure 9; the laser transmitter (Topcon, RL-H4C) is mounted on the ground on a tripod. The elevation position of the laser receiver, which can be adjusted by the hand wheel, is mounted on a manual lift (accuracy = 0.05 mm). The grating ruler (measurement resolution = 5 μm) is used to measure the elevation deviation. The main parameters of the laser receiver are the pulse signal width range from 0.239 to 4.78 μs and the band-pass filter center frequency of 1050 Hz. The theoretical value of the laser beam spot diameter is the detectable laser beam spot diameter, and the elevation deviation is calculated according to Equation (5). The main parameters are the number of silicon photodiodes illuminated, the code of the silicon photodiodes illuminated; the width of the silicon photodiode is 5.5 mm, and the distance between two adjacent silicon photodiodes is 0.5 mm. Therefore, the elevation deviation detection resolution is ± 3 mm. The trolley is used to carry test equipment to adjust the distance from the laser transmitter; the tape measure (range = 50 m, accuracy = 0.01 m) is used to calibrate the distance. Moreover, the elevation detection accuracy test was performed every 10 m, so that the laser receiver stopped for the first time at the critical position of the output elevation deviation of 0 mm and 3 mm, and stopped for the second time at the critical position of the output elevation deviation of 0 mm and −3 mm. Accordingly, the elevation deviation measured by the grating ruler and the number of silicon photodiodes illuminated by the rotating laser was observed and recorded.
5.1.2. Test Data and Analysis
The data of the number of silicon photodiodes illuminated and elevation detection accuracy absolute error, which calculated theoretically and measured experimentally, are listed in
Table 1. When the detectable laser beam spot diameter is in the range of 3~9 mm, the theoretical value of the number of silicon photodiodes illuminated is 1 or 2; when the detectable laser beam spot diameter is in the range of 9~15 mm, the theoretical value of the number of silicon photodiodes illuminated is 2 or 3; when the detectable laser beam spot diameter is in the range of 15~21 mm, the theoretical value of the number of silicon photodiodes illuminated is 3 or 4; when the detectable laser beam spot diameter is in the range of 21~27 mm, the theoretical value of the number of silicon photodiodes illuminated is 4 or 5; when the detectable laser beam spot diameter is in the range of 27~33 mm, the theoretical value of the number of silicon photodiodes illuminated is 5 or 6. The test comparison results show that the theoretical value of the number of silicon photodiodes illuminated by the laser beam spot is consistent with the measured value. When the transmission distance is less than or equal to 90 m, the measured value of absolute error of the elevation detection accuracy of the laser receiver at each test point is less than 3 mm. When the transmission distance is greater than 90 m, the measured value of absolute error pertaining to the elevation detection accuracy is greater than 3 mm, mainly owing to the combined effect of the laser beam spot transmission diffusion law and the laser beam spot drift phenomenon. This is because the elevation deviation detection error increases gradually as the transmission distance increases.
5.2. Farmland-Levelling Test and Analysis
5.2.1. Test Purpose and Standard
It is important to study the instant at which the laser receiver is used in conjunction with the agricultural grader, to ascertain whether the farmland levelling effect meets the high standard farmland construction requirements. According to the GB/T30600-2014 farmland construction standard, the elevation deviation of the field surface should be within ±3 cm after levelling.
5.2.2. Test Materials and Methods
In June 2019, a dry land levelling test was conducted in the Qingyuan City in the Chinese Province of Guangdong, whereby the test field was approximately 60 m long, 30 m wide, had an area of approximately 1800 m
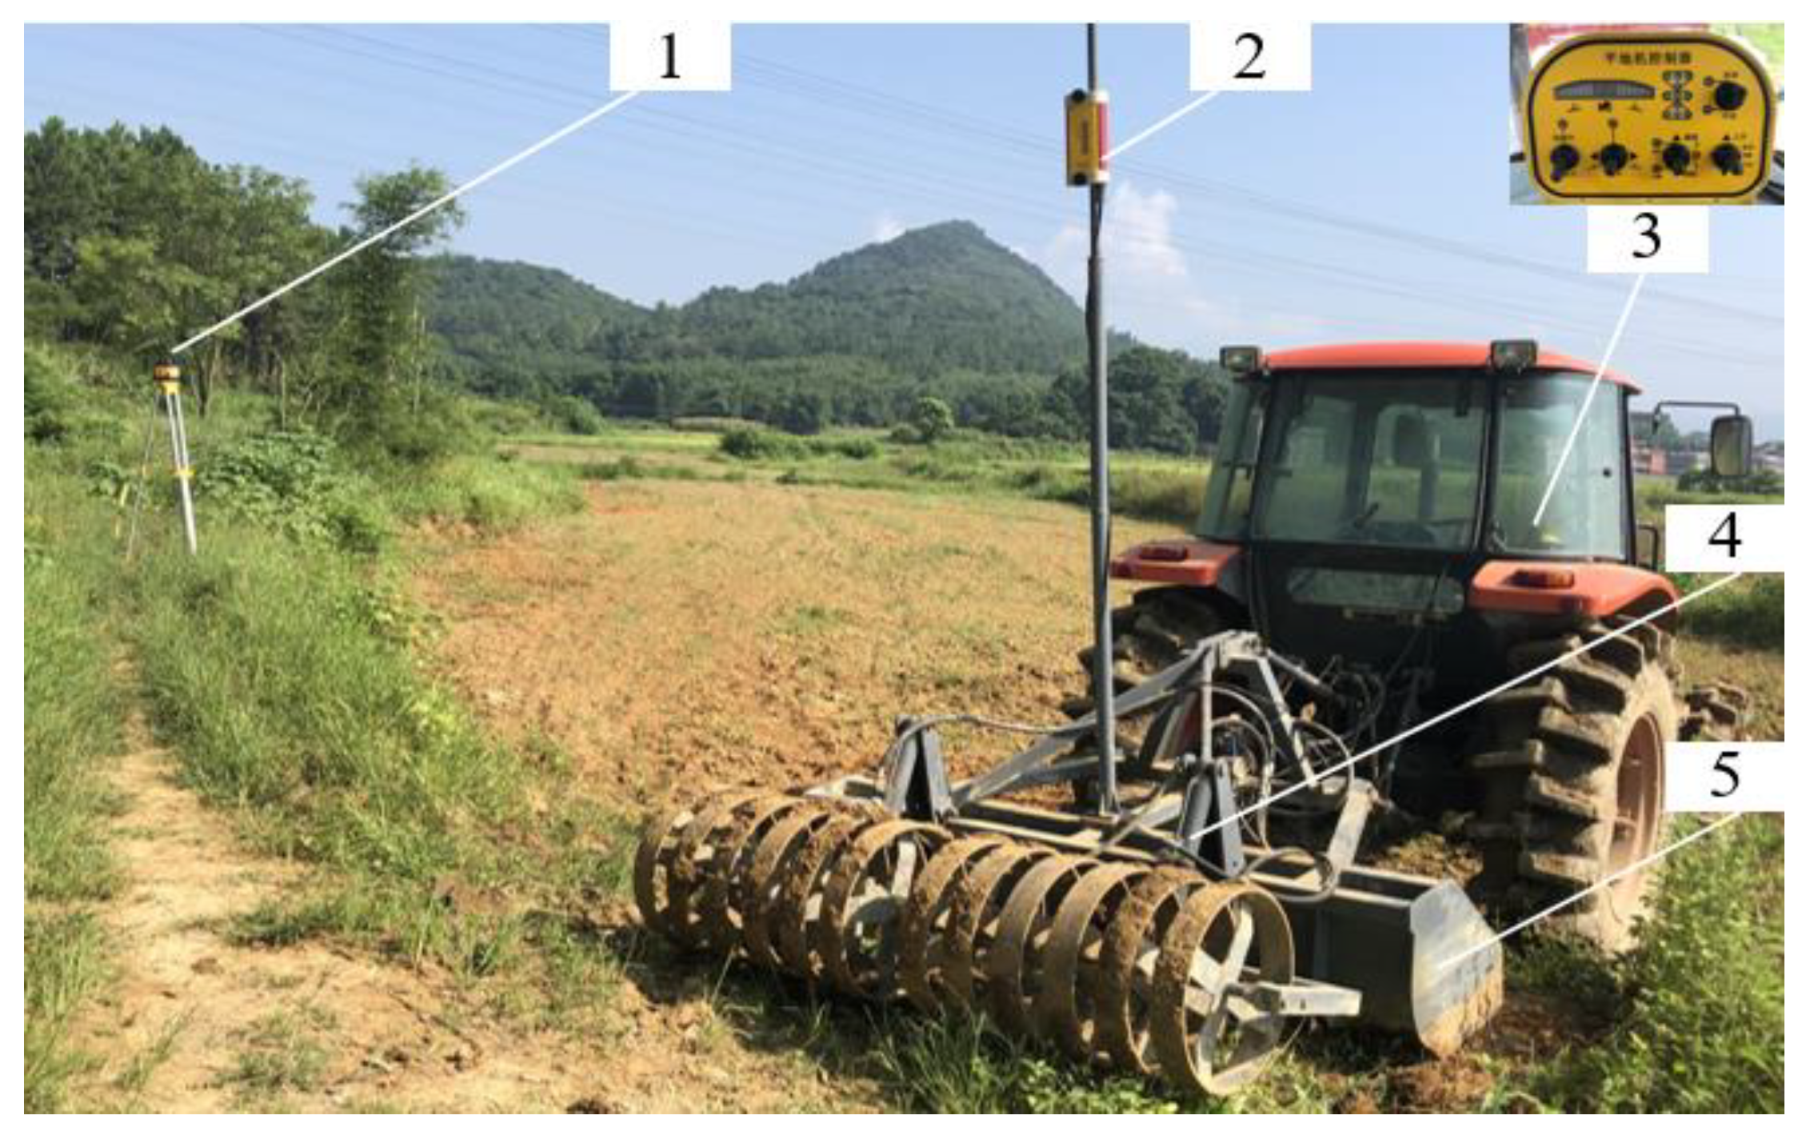
2, and was sun-cured for more than 24 h after rotary tillage. The drill and laser grader [
29] are shown in
Figure 10. The tractor was a Kubota M704KQ, and the laser transmitter was a Topcon RL-H4C. To reduce the elevation adjustment oscillation of the scraper, the accuracy of the laser receiver was set to ±9 mm.
Before the test, the field was measured with a 50 m tape and was divided into 5 × 5 m grids. The grid intersections denote the sampling points (a total of 69). The expected elevation reference point O is calibrated on the ridge and set to the origin of the coordinate system (0, 0, 0). A digital level (Topcon, AT-B4) was used to measure the elevation of each sampling point relative to the reference point O. During the test, the laser transmitter (Topcon, RL-H4C) was set up in the ridge, and the drill and laser graders carried out S-type farmland-levelling operations with an average speed of 2.34 km/h. After the test, the elevation of each sampling point relative to the reference point O was measured with the use of a digital level.
5.2.3. Test Data and Analysis
Figure 11a shows a three-dimensional (3D) topographical map before levelling, while
Figure 11b shows a 3D topographical map after levelling. As indicated in this figure, the field surface is uneven before levelling, and the flatness of the field surface is significantly improved after levelling.
As shown in Equation (6) and Equation (7), the test estimates the flatness of the farmland, based on the standard deviation of the elevation
of the sampling points. It was found that the percentage of the absolute error between the sampling point elevation and the expected elevation was ≤3 cm. This reflects the characteristics of the farmland elevation error distribution [
1].
In the above two equations, denotes the elevation of the sampling point in cm, is the expected elevation in cm, n is the number of sampling points, m is the number of the absolute error between the sampling point elevation, and the expected elevation is ≤3 cm.
The test results are listed in
Table 2. After levelling, the maximum elevation error of the field surface decreases from 28.9 cm, before levelling to 11.1 cm, while the standard deviation
of the field surface decreases from 9.54 cm before levelling to 2.42 cm after levelling, and the percentage of the sampling points for absolute errors less than or equal to 3 cm is 84.06%. The test results show that when the laser receiver is used with the agricultural grader, the flatness of the field surface is significantly improved, and the requirements of farmland construction standards are thus met.
5.3. Concrete Levelling Test and Analysis
5.3.1. Test Purpose and Standard
The optimal time instant at which the laser receiver should be used in conjunction with the concrete leveler was studied, to ascertain whether the deviation of the elevation adjustment and the effect of the levelling operation met the construction requirements of the concrete industry. According to the concrete paving standards set by the American Concrete Institute (ACI) and the Canadian Standards Association (CSA), during the construction process, the adjustment of the elevation deviation of the system consisted of the laser receiver and the controller. Within a radius of 30 m, this adjustment needed to be less than or equal to ±3 mm [
30].
5.3.2. Test Materials and Methods
The laser transmitter (Topcon, RL-H4C) generates a rotating laser signal. The level sensor (Topcon, RE160, accuracy = 0.5 mm) is selected for zero position calibration, deviations in elevation adjustment, and for sampling point elevation measurements. Two laser receivers were installed on the left and right masts of the concrete leveler.
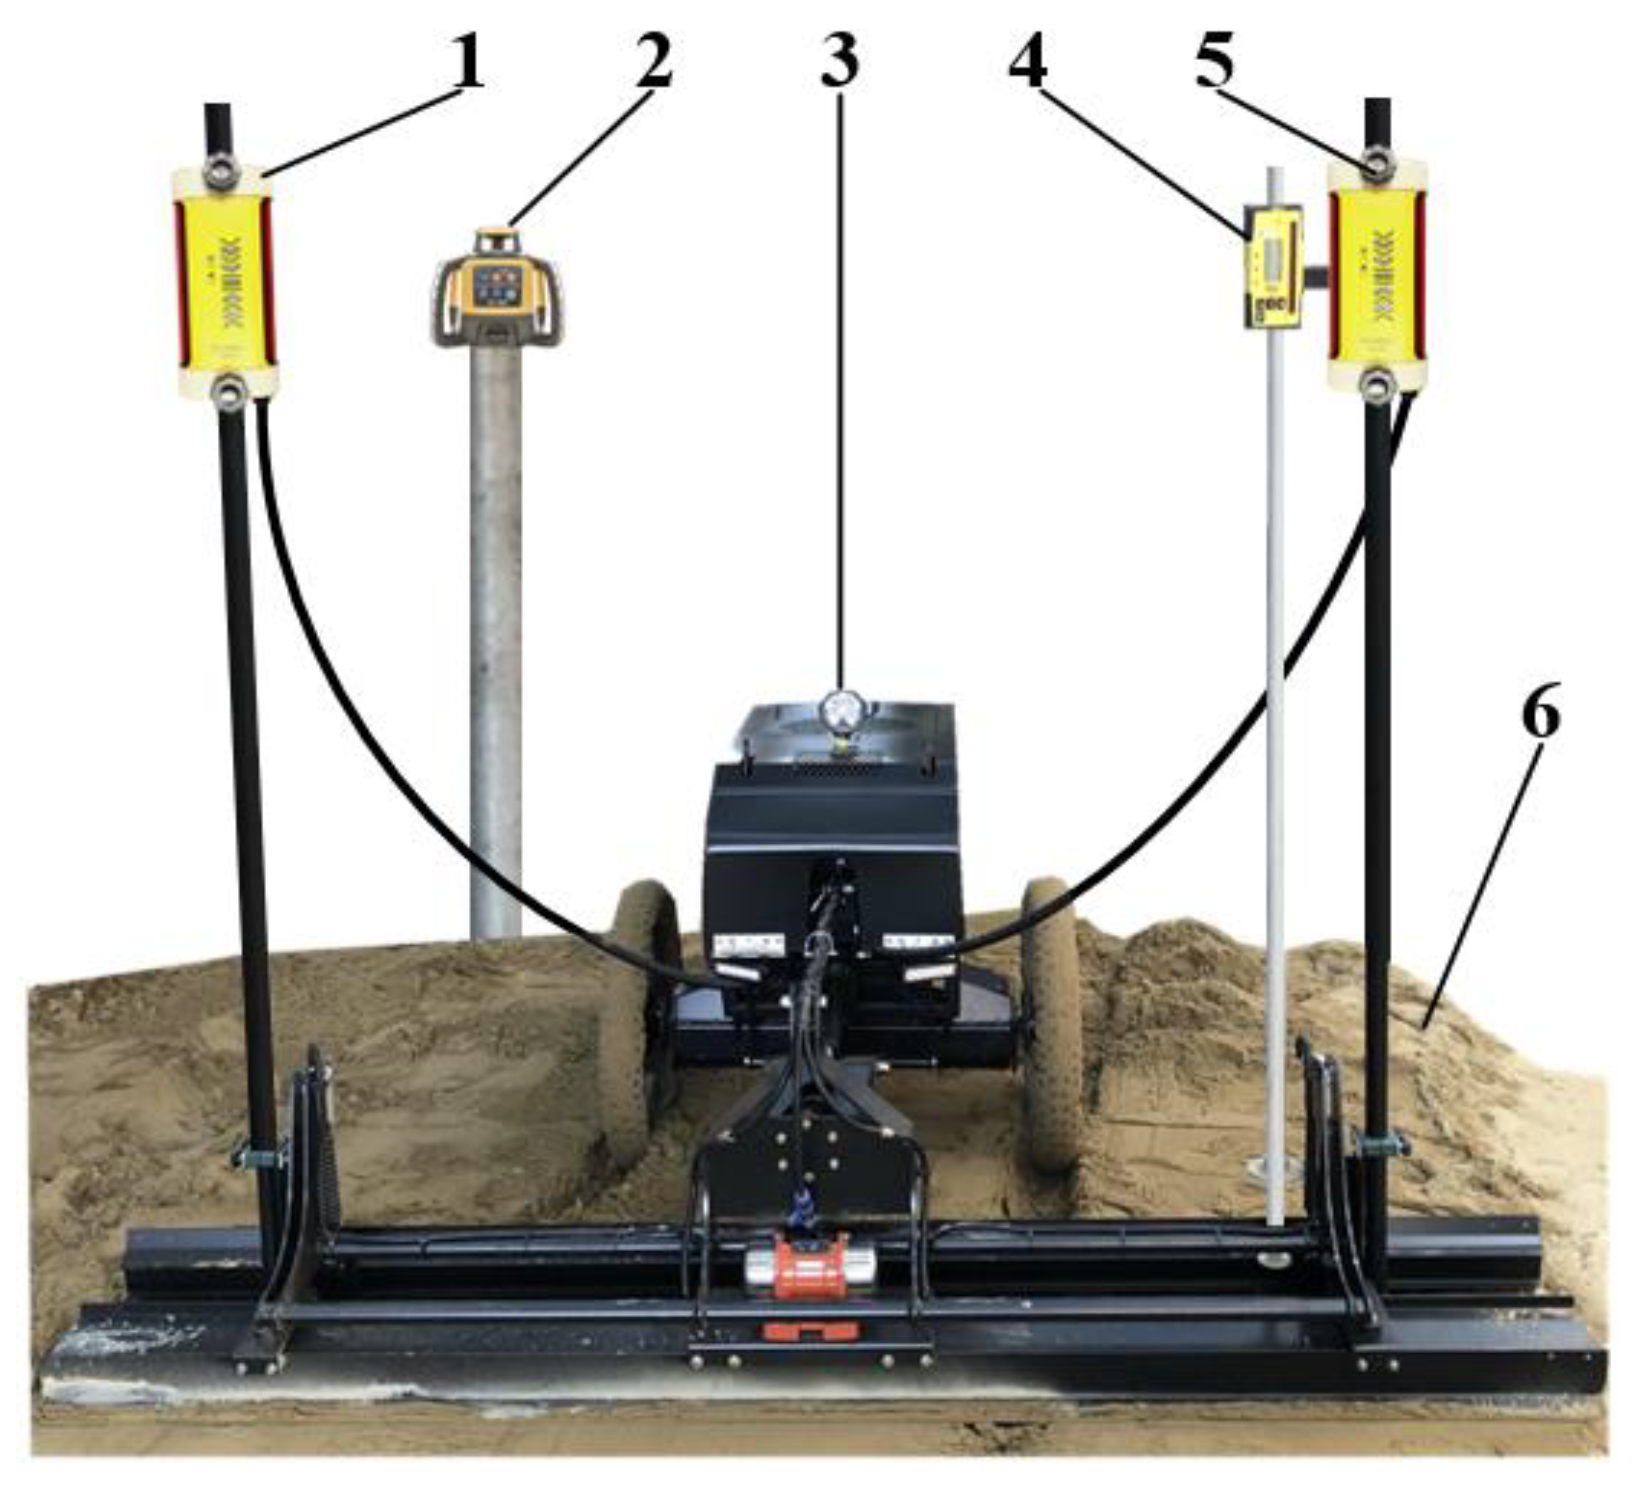
The test site is shown in
Figure 12. As indicated, the laser transmitter is set at 0 m, and the sand bed is paved within 30 m with a length of 10 m, width of 2.5 m, and a thickness of 5 cm. Level sensors were used to calibrate the zero position of the laser receiver. The elevation position was adjusted manually by the control system, and the status of the elevation indicator was recorded. Additionally, the value of the elevation deviation was set as the initial elevation deviation for automatic adjustment. Finally, we switched to the automatic adjustment mode, and measured and recorded the elevation deviation of the stopped position after the automatic adjustment. The running speed of the levelling operation was approximately 0.45 km/h, and 10 sampling points were selected at regular intervals (interspacing of 1 m), from the left, middle, and right sides of the sand bed after the levelling (for a total of 30 sampling points). We used the level sensor to measure and record the deviation between the elevation of the sampling point and the expected elevation.
5.3.3. Test Data and Analysis
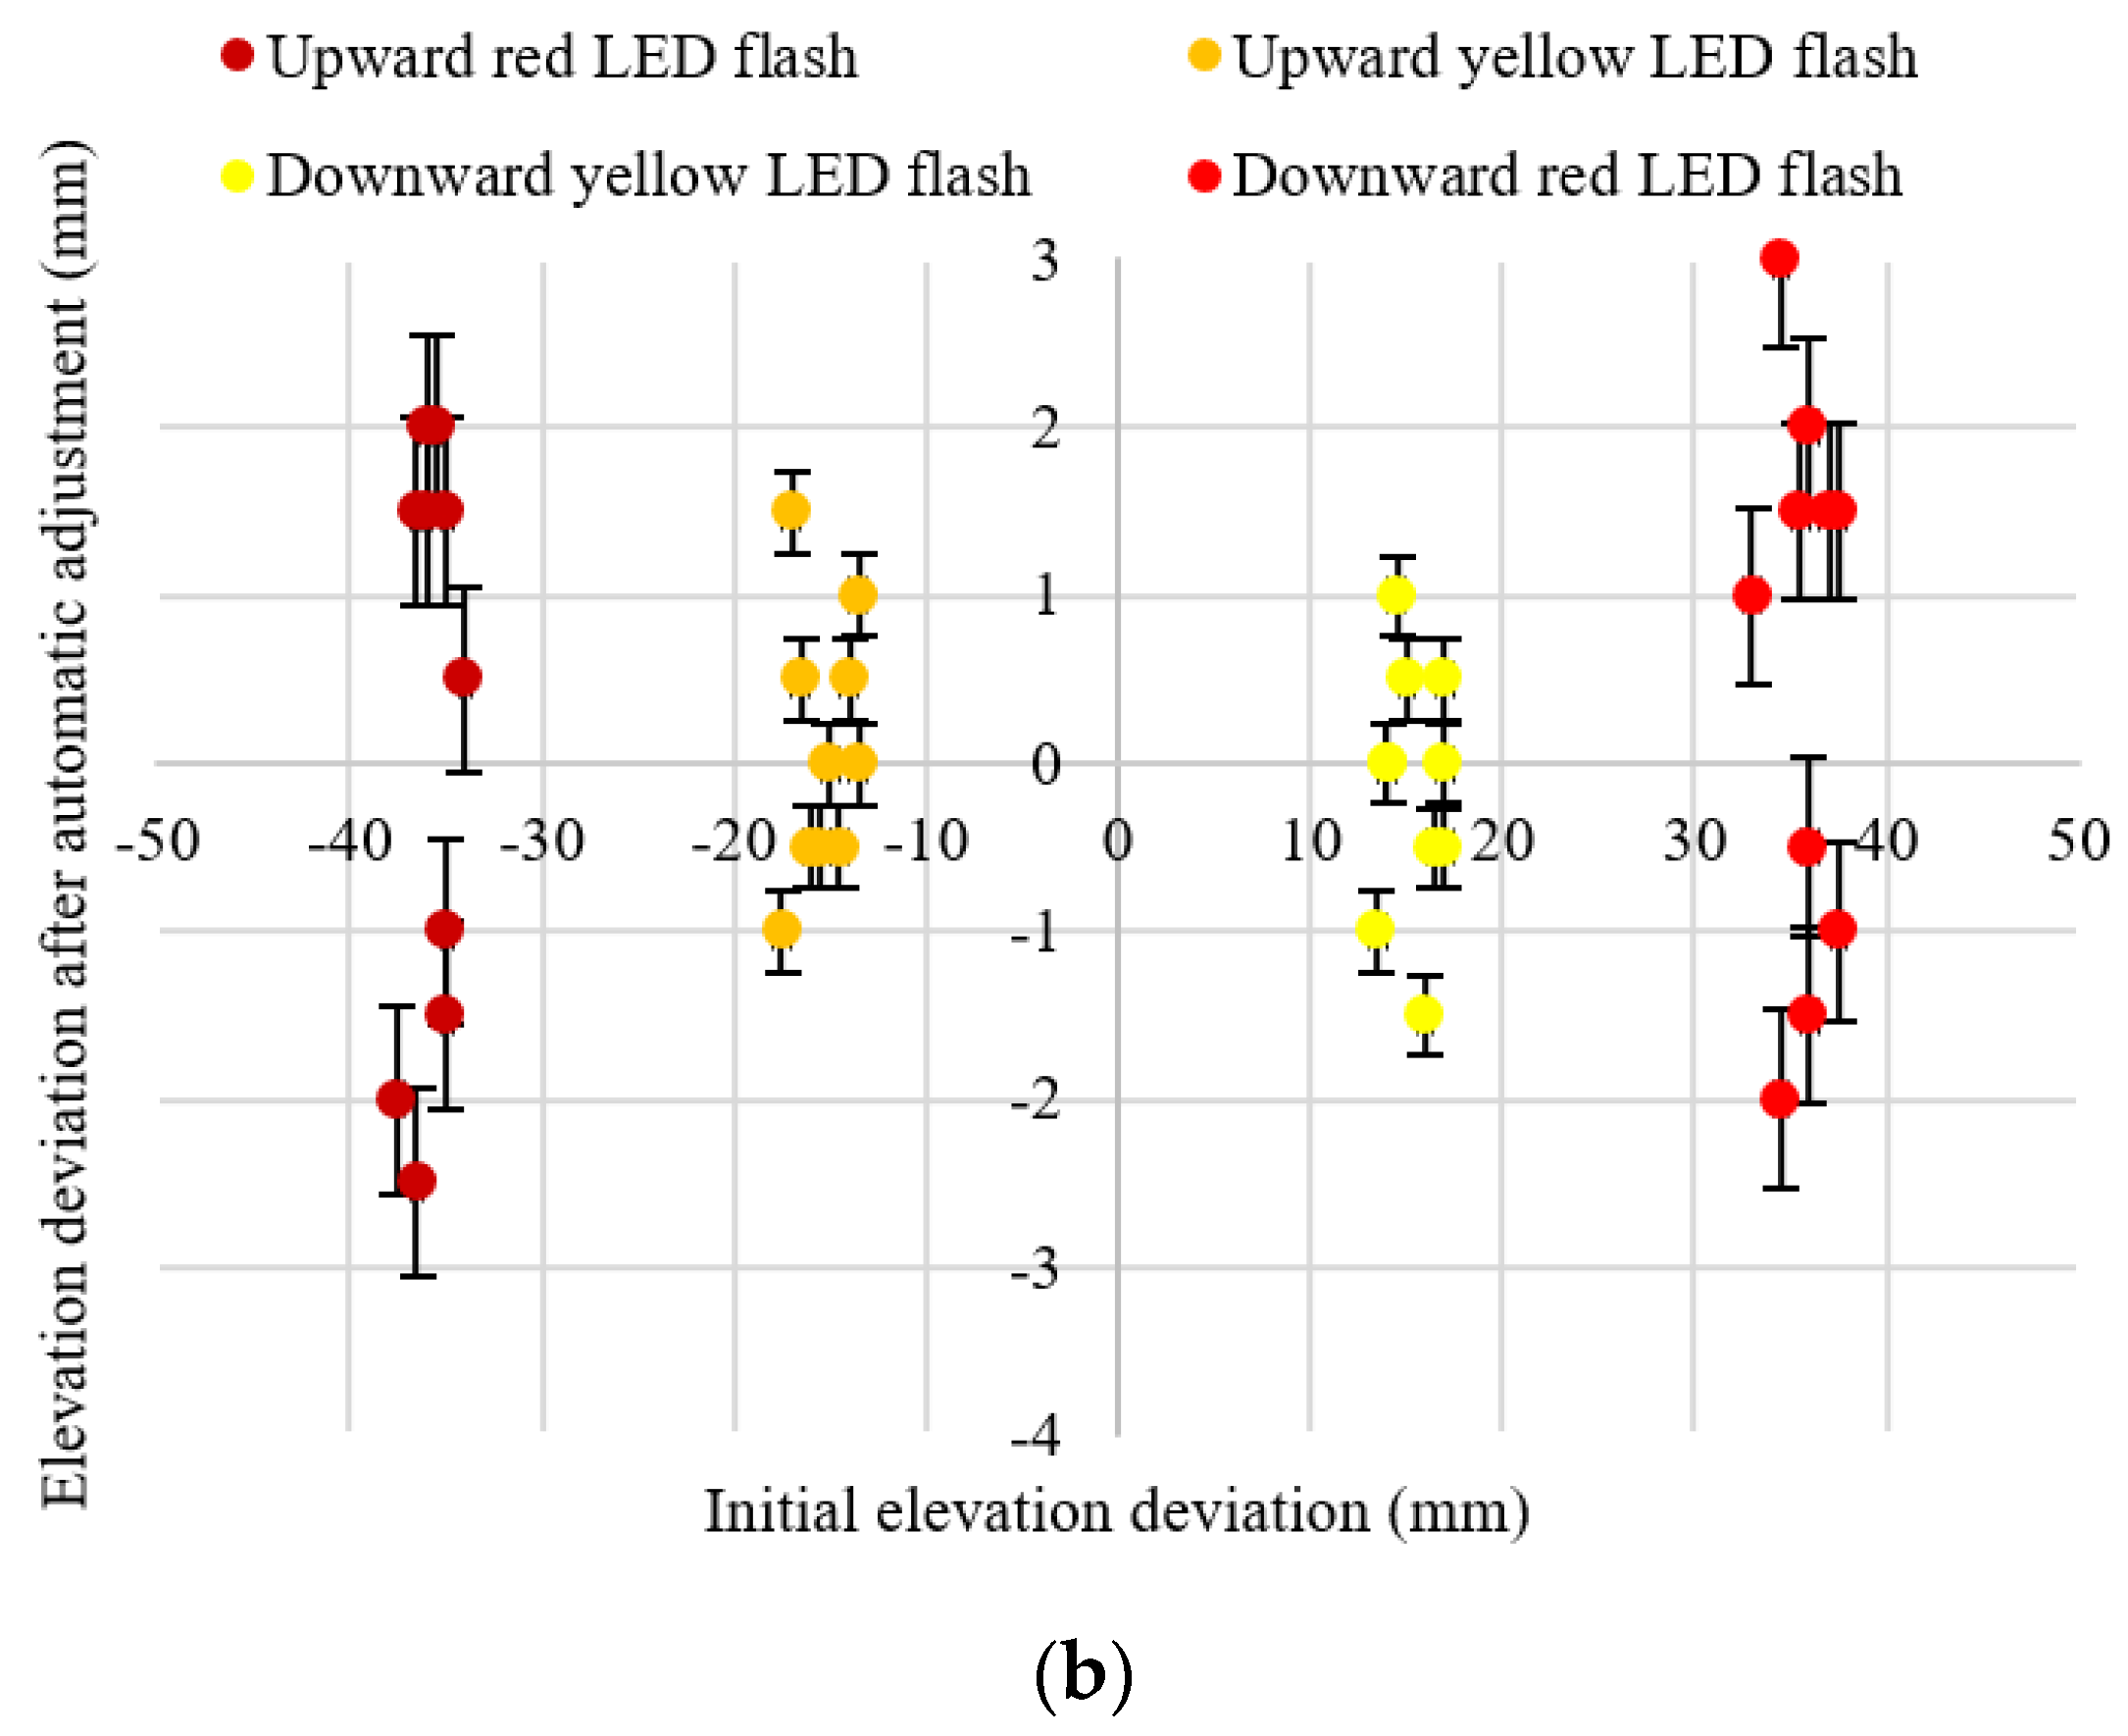
When the initial elevation deviation is in 4 different elevation LED states, the left and right laser receivers perform 10 automatic adjustments. The test data scatter plot is shown in
Figure 13. As shown, within a radius of 30 m, the left and right laser receivers are automatically adjusted at different initial elevation deviations, and the elevation deviations are randomly distributed within ±2.5 mm. Accordingly, the deviation of the elevation adjustment is met within a range of ±3 mm, in accordance with the test standard.
According to the test data, we calculated the standard deviation
and the percentage of absolute error, which was less than 3 mm of the elevation adjustments in the cases of the left and right laser receivers. The test results are listed in
Table 3. Within a radius of 30 m, the standard deviation
of the elevation adjustment of the left laser receiver was 1.389 mm, and the standard deviation
of the elevation adjustment of the right laser receiver was 1.316 mm. In addition, the percentage of the absolute error which was less than 3 mm of the elevation adjustment of the two laser receivers was 100%.
According to the test data, we calculated the standard deviation
and the percentage of the sampling points. The test results are listed in
Table 4. The standard deviation
is 0.881 mm, and the percentage of the sampling points with elevation absolute errors of ≤ 3mm was 100%. Therefore, the laser receiver designed in this study can be used with the concrete leveler to meet the construction standards of the concrete industry.
6. Discussion and Conclusions
(1) In this study, the silicon photodiode was used as the photodetector. Based on the study of the laser signal detection technology and processing circuit, regular patterns of the laser beam spot diameter transmission and diffusion, and solution methodology related to the deviation of the rotating laser elevation, we optimization designed a multilevel adjustable laser receiver, through densely arranged photoelectric conversion arrays and rotating laser elevation deviation calculation methods, to accurately obtain the geometric center elevation position of the laser beam spot image. Accordingly, the test results of elevation detection accuracy showed that when the laser receiver was within a radius of 90 m, the elevation detection accuracy was within ±3 mm.
(2) When the laser receiver was used with the agricultural grader, the test results of farmland levelling showed that the standard deviation of the field surface decreased from 9.54 cm, before levelling to 2.42 cm after levelling, and the percentage of sampling points with elevation absolute errors of ≤3 cm was 84.06%. These outcomes meet the requirements of the high standard of farmland construction.
(3) When the laser receiver was used with the concrete leveler, the test results of the levelling showed that after levelling, the standard deviation of the sand bed surface was 0.881 mm, and the percentage of the sampling points of the absolute error less than or equal to 3 mm was 100%. These outcomes also met the construction standards of the concrete industry.
(4) As the transmission distance increased, the elevation detection accuracy of the laser receiver decreased, owing to the laser beam spot transmission diffusion and the laser beam drift phenomenon. It is concluded that the solution of the interference of the laser beam drift phenomenon on the detection accuracy of the laser receiver requires additional research.


 ,
, 


