1. Introduction
Metal Oxide Semiconductor or MOS-Type gas sensors are a type of sensors that can detect presence of some volatile, oxidizable or reducible substances in an oxygen environment. In recent years, these sensors have been used in different study areas like healthcare [
1,
2] or food industry [
3], among others. These sensors are resistive sensors whose nominal resistance changes with the presence of different fuels, oxidizing gases or reducing gases [
4,
5].
This type of sensor has many advantages such as a high response, low cost and portability. Due to these characteristics, different fabrication processes of MOS-Type gas sensors have been studied to improve their sensitivity, power consumption, and response time [
6,
7,
8,
9]. Other studies have researched into the applications in fields like the Internet of Things (IoT) devices [
10] and wearables [
11] by using different techniques of power supply, such as triboelectric nano-generator (TENG) [
12], and others.
With these types of sensors, a voltage divider [
13,
14] is often used to measure the substance searched for. But other electronic topologies could be used to power resistive sensors. In this work, besides a voltage divider, the Wheatstone bridge, the Anderson loop, and a resistance-to-frequency converter were designed to be used with different MOS-Type gas sensors and compared among them. The difference of these MOS gas sensors from others resistive sensors (as platinum resistance temperature sensor or thermistors) are: they use a heater in the same sensor (need to work high temperatures), and the range of the variable resistance is higher than others.
In this article, TGS2600 [
15] and TGS2610 [
16] sensors are used, whose sensing material is tin dioxide (SnO
2), because SnO
2 is a very popular sensing material in this area [
17]. In addition, both sensors have similar heaters onto the reverse side of the substrate, which is made of RuO
2 [
15,
16]. However, their bases are different: TGS2600 has a Ni-plated steel sensor base [
15], whereas TGS2610 sensor base is made of NiCu-plated steel [
16]. Moreover, another difference between both sensors is the long-term stability (
Figure S1 and S2 in the Supplementary Materials). TGS2610 is very stable but TGS2600 has a worst long-term stability.
2. Materials and Methods
This section deals with the design of different electronic conditioner topologies to maximize the accuracy of MOS-type gas sensor applications. The analysis and simulated results for the different topology are discussed.
The voltage divider and the Wheatstone bridge are the most commonly used topologies for measurement systems based on resistive sensors because they are easy to design and easy to get data from [
4].
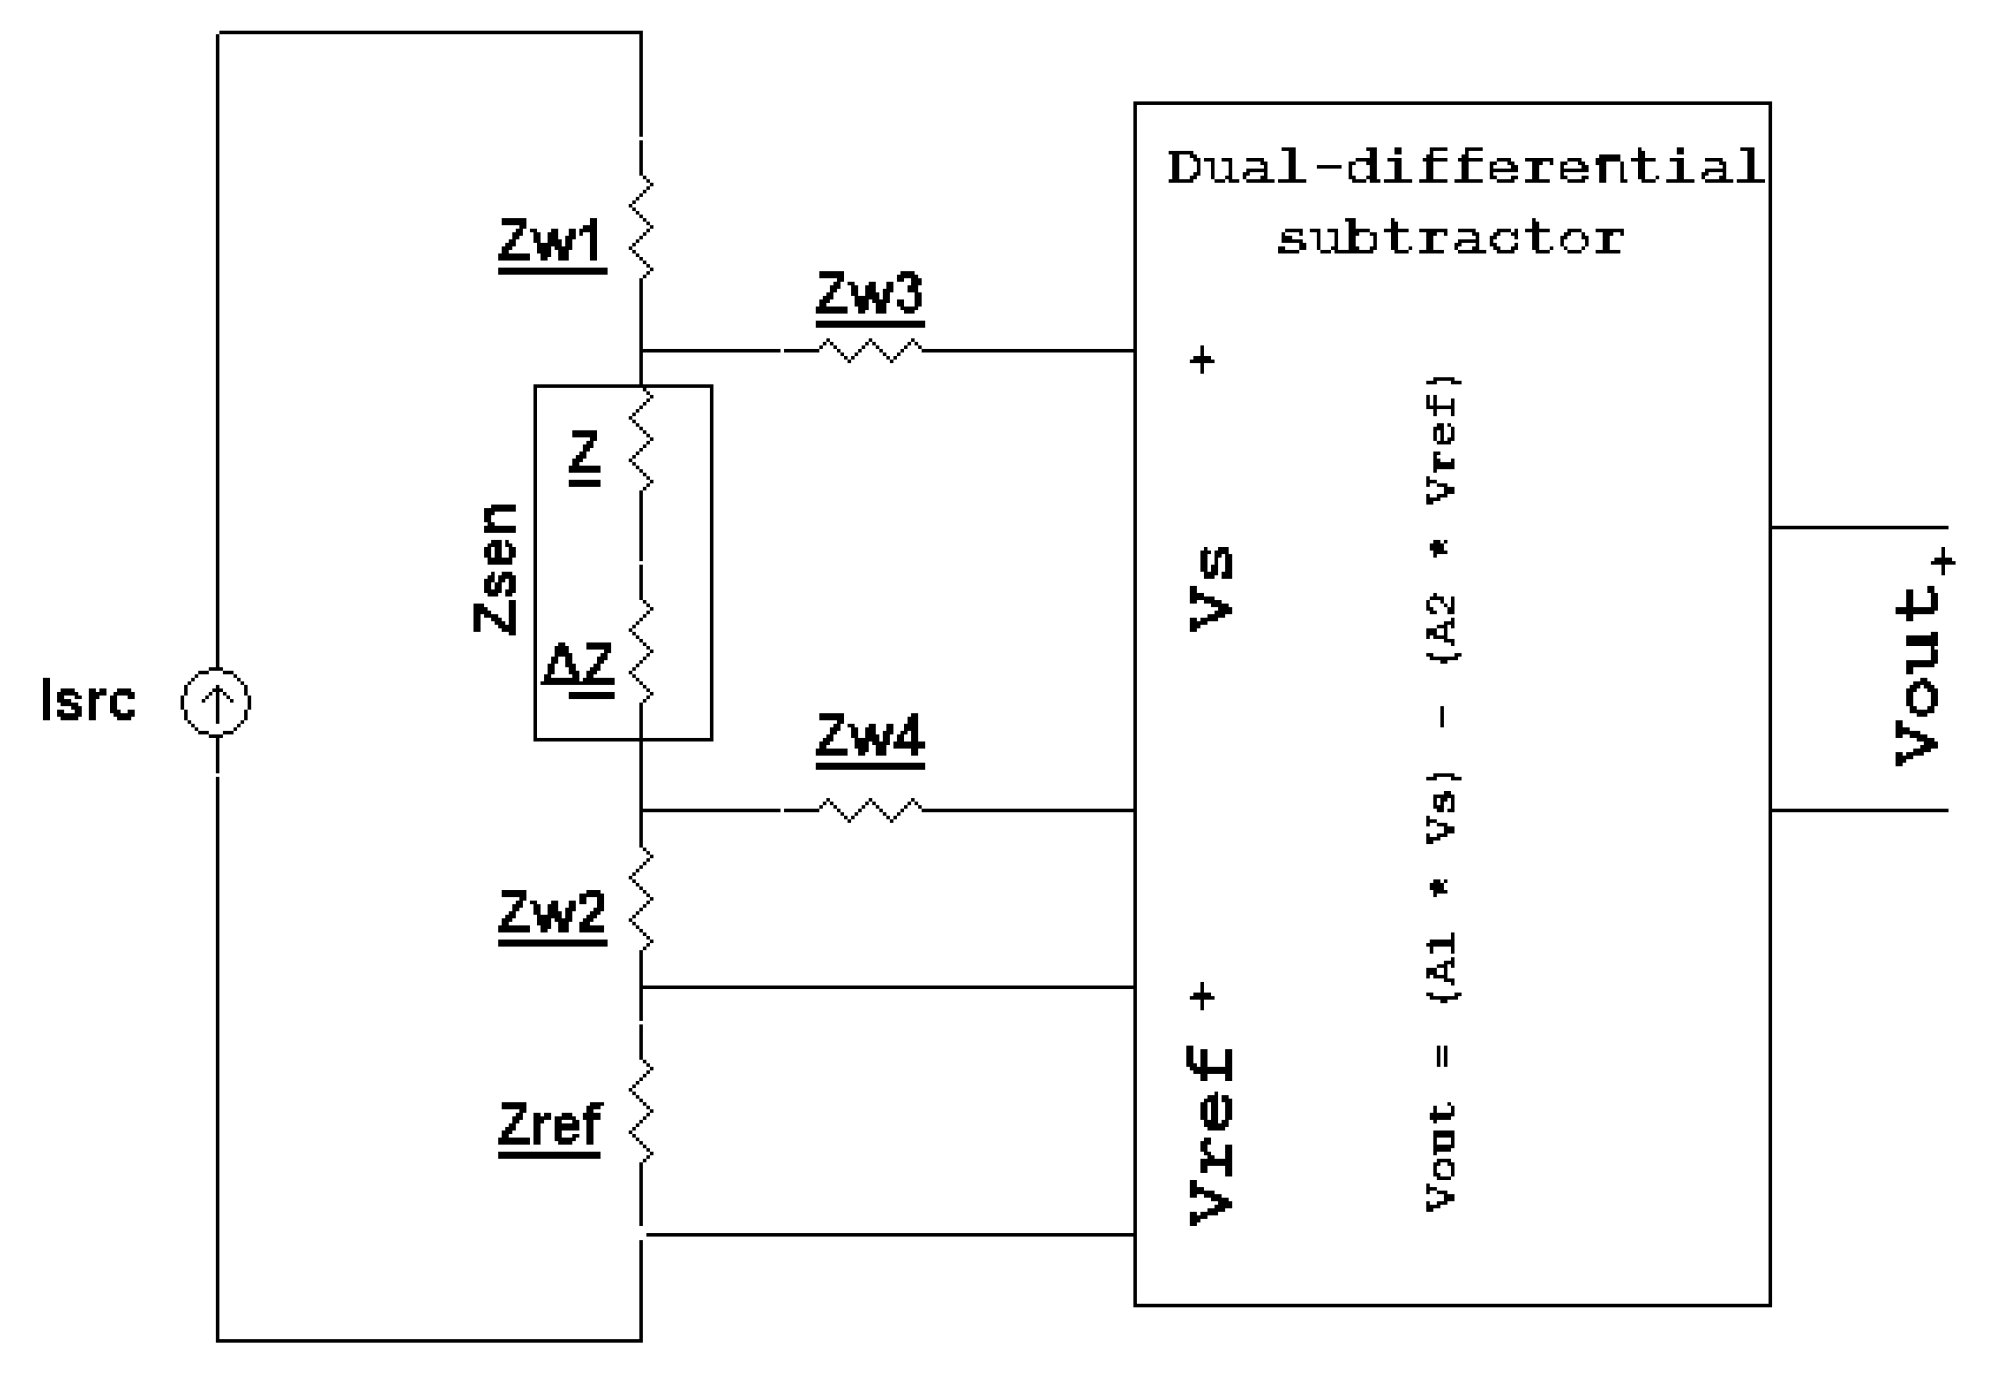
The Anderson loop is more difficult to design because a current source and an active voltage subtractor are needed, as shown in
Figure 1. However, unlike the voltage divider and the Wheatstone bridge, the output signal for this topology changes linearly with the sensor resistance. Furthermore, the Anderson loop can be easily designed for an array of resistive sensors [
18,
19,
20].
The resistance-to-frequency converter is the most complex topology we are going to study in this paper. This topology is based on the use of a simulated capacitance using a Generalized Impedance Converter (GIC). The capacitance changes linearly with the sensor resistance; an oscillator is created using a 555 timer with a frequency that depends on the simulated capacitance [
21]. This topology theoretically has a linear dependence between the sensor resistance and the oscillator frequency, like the Anderson loop. But it has several advantages due to the fact of using frequency: it is more immune to noise (but it has a lower Spurious-Free Dynamic Range (SFDR), the transmission distance can be higher, and it could be acquired by digital system without an Analog to Digital Converter (ADC).
The interface to obtain data from these designs is the Red-Pitaya STEMlab 125-14, which has 14-bit ADC, with an input voltage range from −20 V to 20 V. Furthermore, the sample rate is 125 MS/s [
22]. Thanks to these characteristics, this acquisition board can be used with all topologies described above (
Figure S3 and S4 in the Supplementary Materials).
2.1. Voltage Divider and Wheatstone Bridge
The voltage divider was designed as indicated in the datasheet [
15] and [
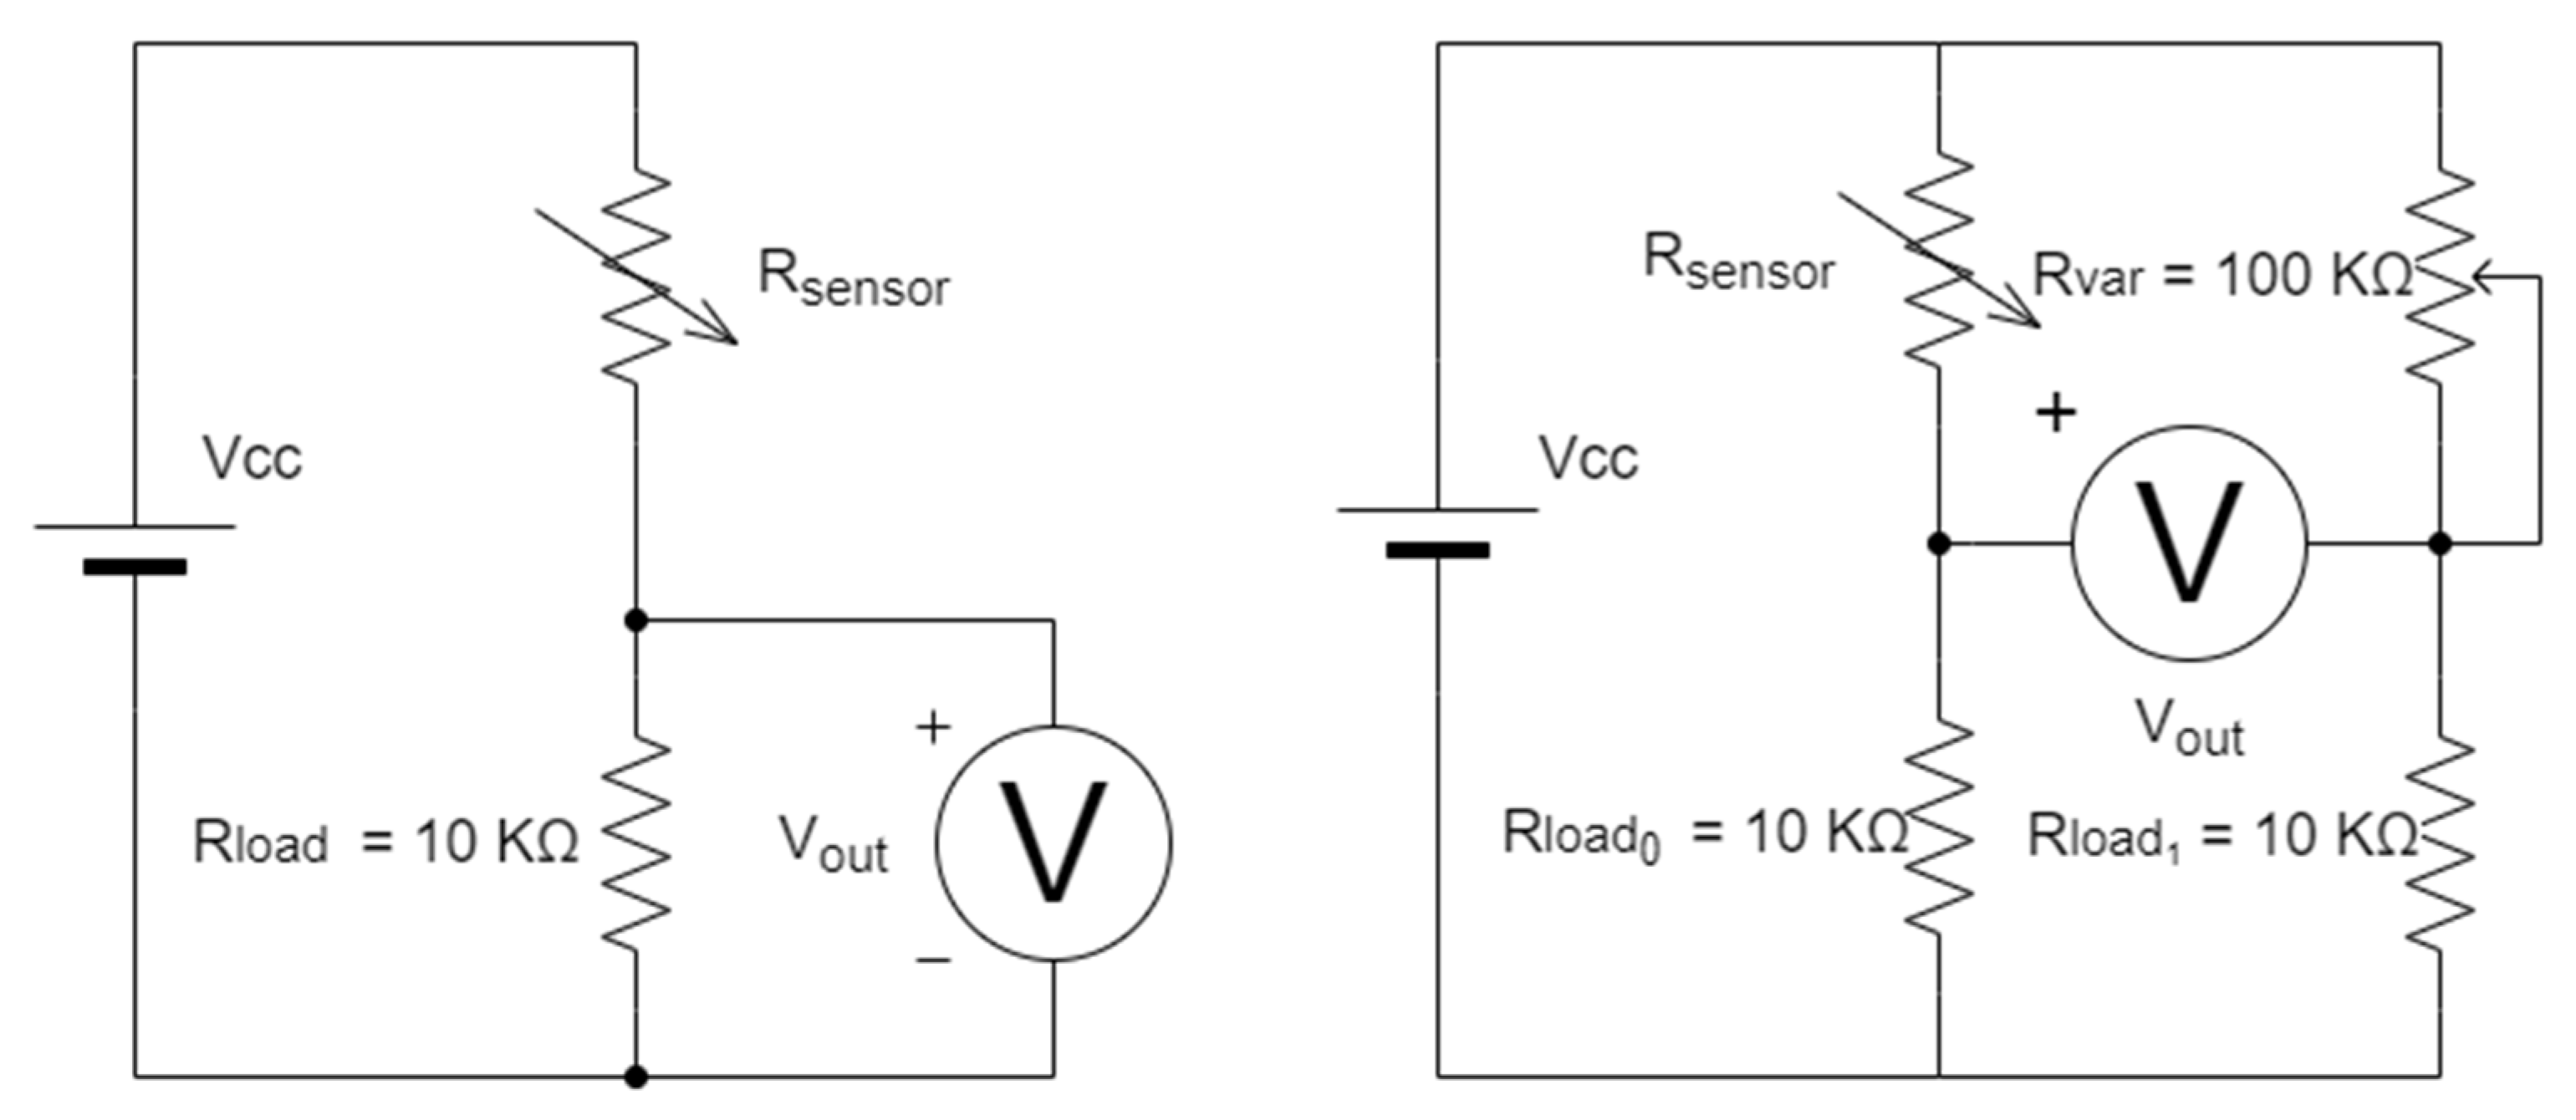
16] for TGS2600 and TGS2610, respectively. Both datasheets indicate that the load resistance of the voltage divider should be greater than 0.45 kΩ. Another important thing to consider when choosing this resistance was the sensor resistance when detect clean air. In this case, this resistance can be from 10 kΩ to until 100 kΩ, it is a big range. For this reason, if the load resistance is close to 100 kΩ and the sensor has a sensor resistance with clean air close to 10 kΩ, the output signal change is going to be small when the sensor resistance changes and that made the resolution of the measure will be worst. Consequently, the load resistance should be close to the small values of that range. Finally, the chosen load resistance is 10 kΩ because this is suitable for both sensors when measuring clean air.
The Wheatstone bridge is based on the voltage divider,
Figure 2. Unfortunately, with these sensors is difficult to make a balanced bridge, because although the same model is used, the resistance of two identical sensors can have a high variation. For example, a sensor TGS2600 can have a resistance of 10 kΩ when measuring clean air and another TGS2600 can have 90 kΩ in the same conditions. Due to this reason, the Wheatstone bridge has two 10 kΩ resistors and a 100 kΩ potentiometer, which will be regulated at the beginning of each measurement as a calibration step.
2.2. Anderson Loop
The electronic system based on the Anderson loop needs a current source, which is designed taking advantage of the following characteristic of the GIC: the current flowing through R5 resistor in
Figure 3 is the same current that flows through R4. And, if all passive components are resistors and the voltage Vcc [
23,
24].
A current of 0.1 mA is selected for this design because the maximum power supported by the chosen sensors is 15 mW and the maximum resistance of the sensors is around 100 kΩ [
13,
14].
Once the current source is designed, the next step is to create an active subtractor by using instrumentation amplifiers. In this case, unlike the Anderson loop, the differential voltage of the reference resistance is not subtracted from the differential voltage of the sensor resistance; in this design, the differential voltage of the sensor resistance is subtracted from the differential voltage of the reference resistors, as
Figure 4 shows. For this reason, the sensors have maximum resistance when measuring clean air, and in this way, a negative voltage is not needed [
25]. The R3 value must have a high value to assure good efficiency between the upper operational amplifier output current and the current source [
24], with that, we selected R3 with a resistance value of 47 kΩ, this is because is close to the maximum value of the resistance sensor. In the other hand, R1 and R2 have been modified to achieve, in the lower values of the range, a properly behavior of the GIC, and these values are 3.3 kΩ to both. Finally, it is only necessary to create a non-inverter amplifier with a gain between 1 to 4.5, which is controlled by a potentiometer in the position of R9 in the circuit, and the resistance selected is R8 = 1 kΩ and the potentiometer R9 = 3.5 kΩ.
2.3. Converter Resistance-to-Frequency
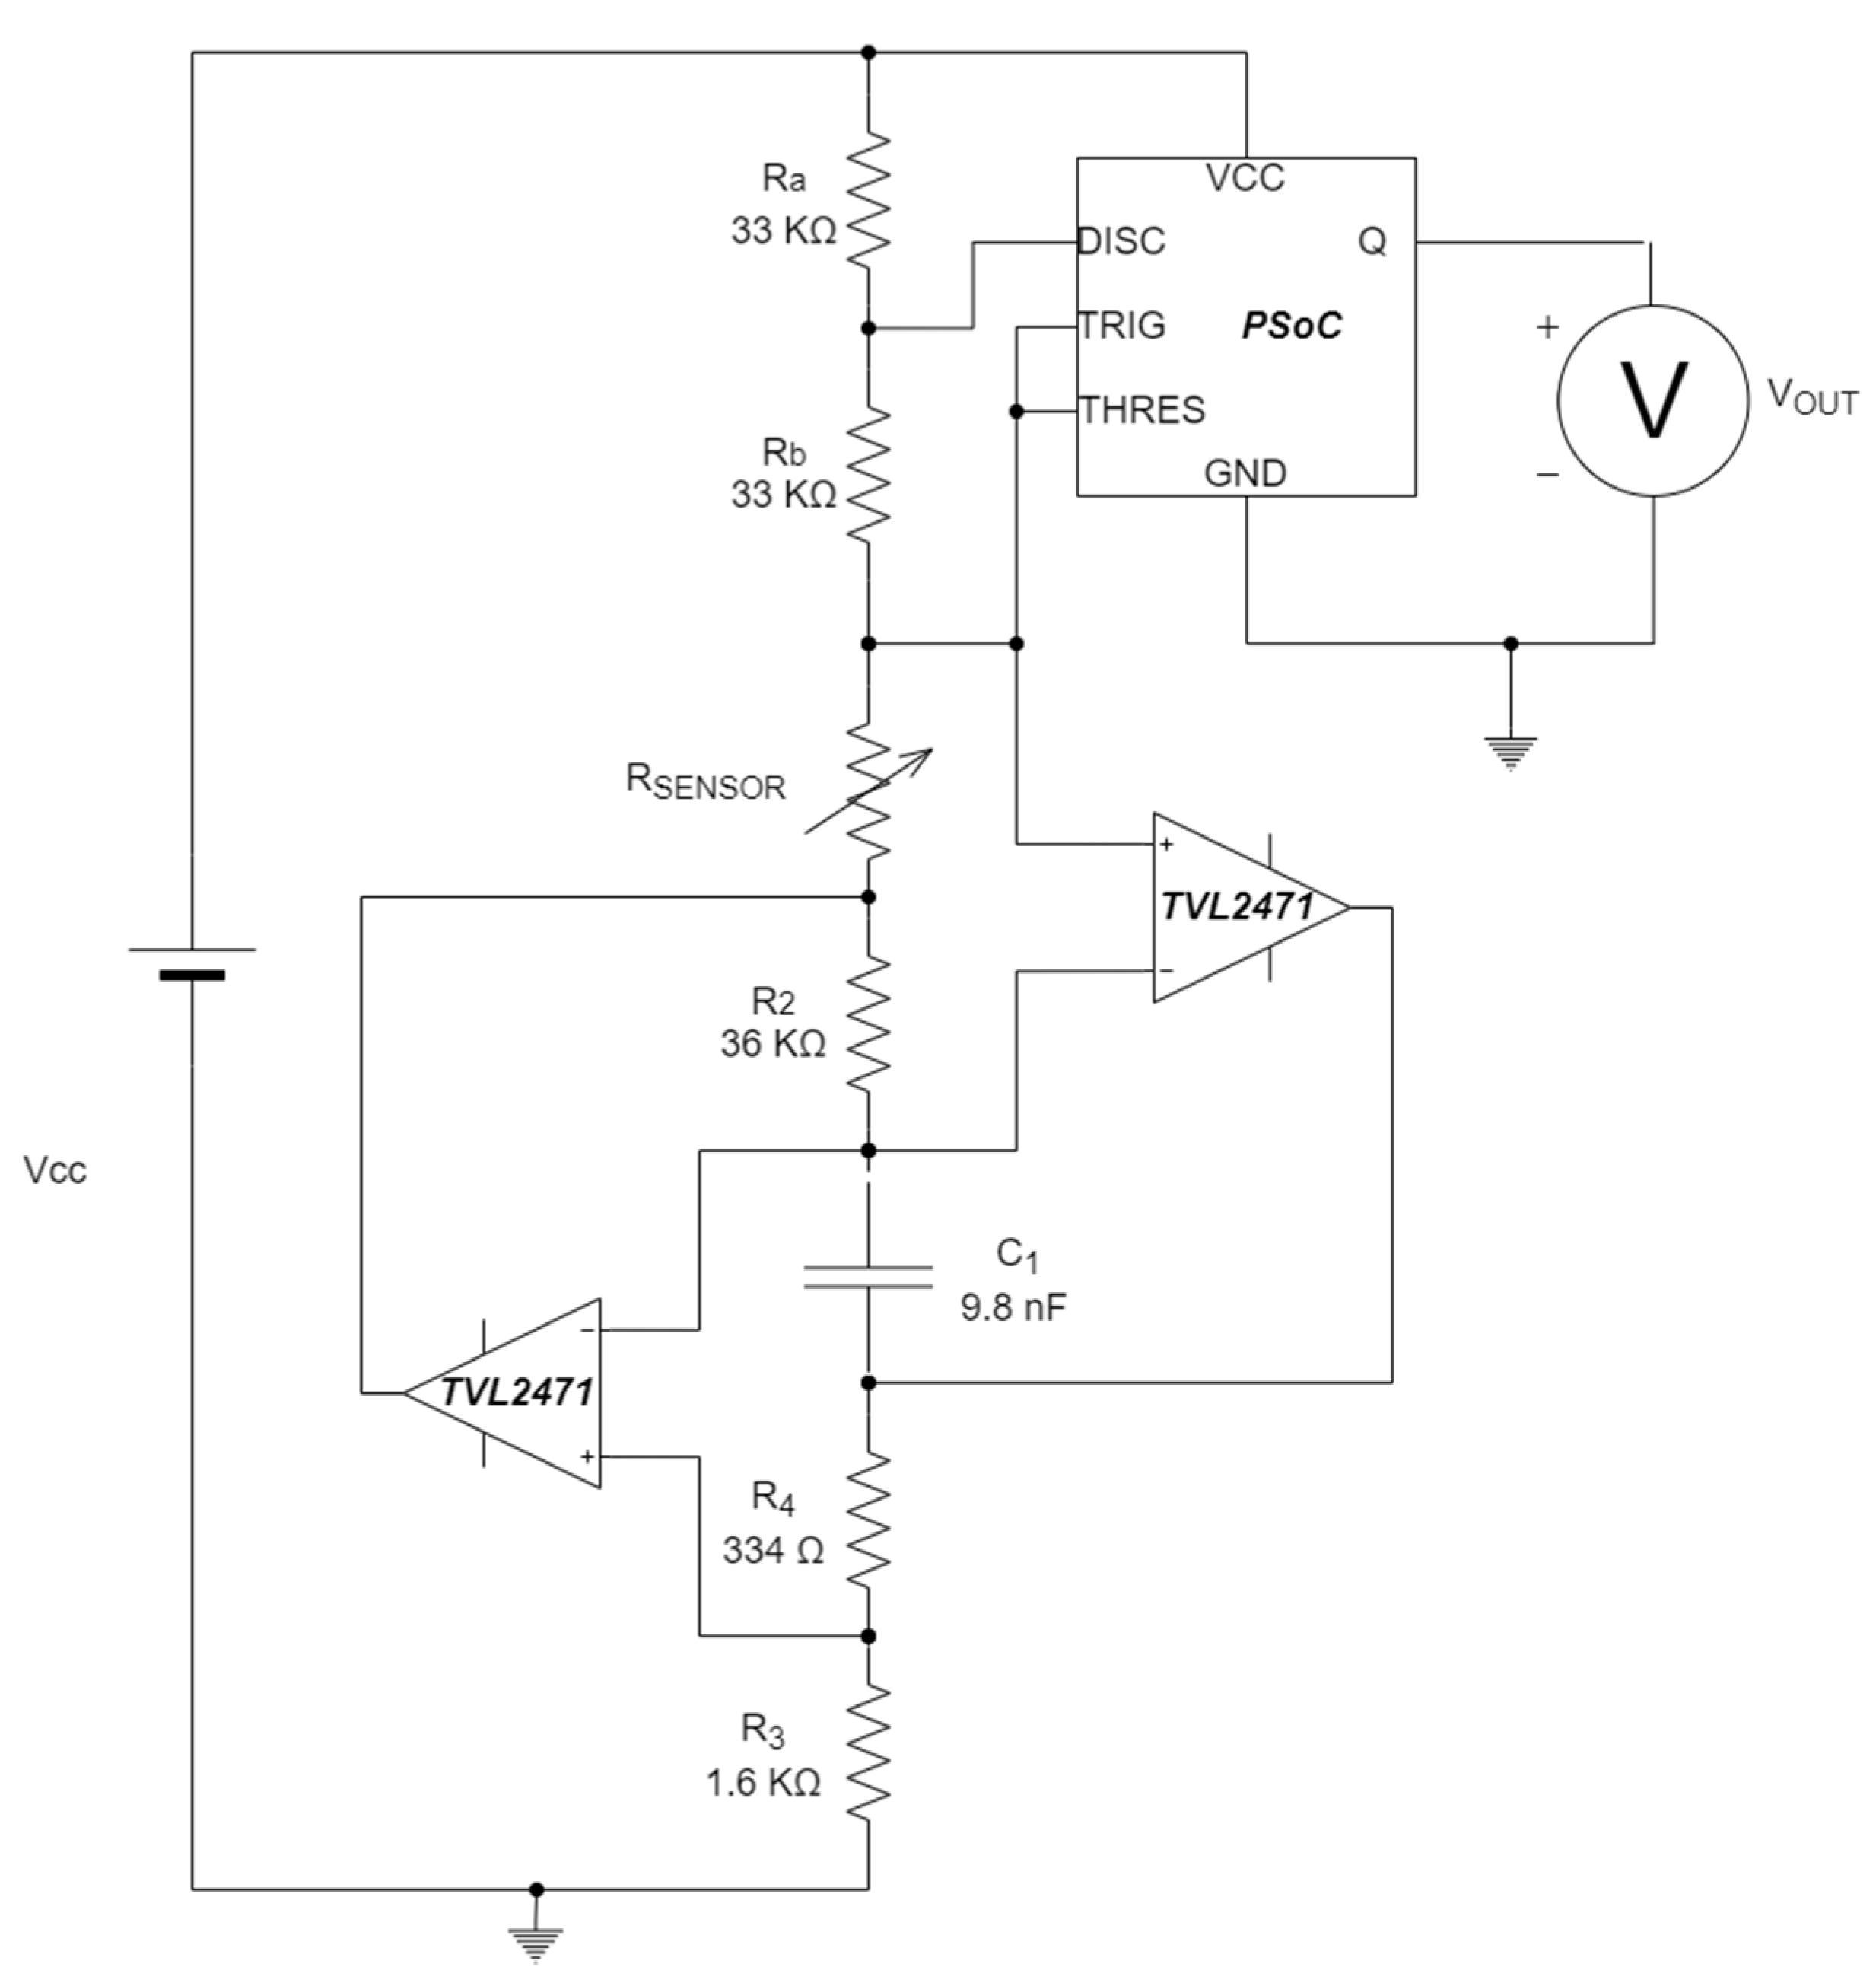
The last topology was proposed in [
21], and it is based on the simulation of a capacitance using the Generalize Impedance Converter. In addition, a 555 timer is used in a stable mode to obtain a signal whose frequency changes linearly with the sensor resistance [
26].
In [
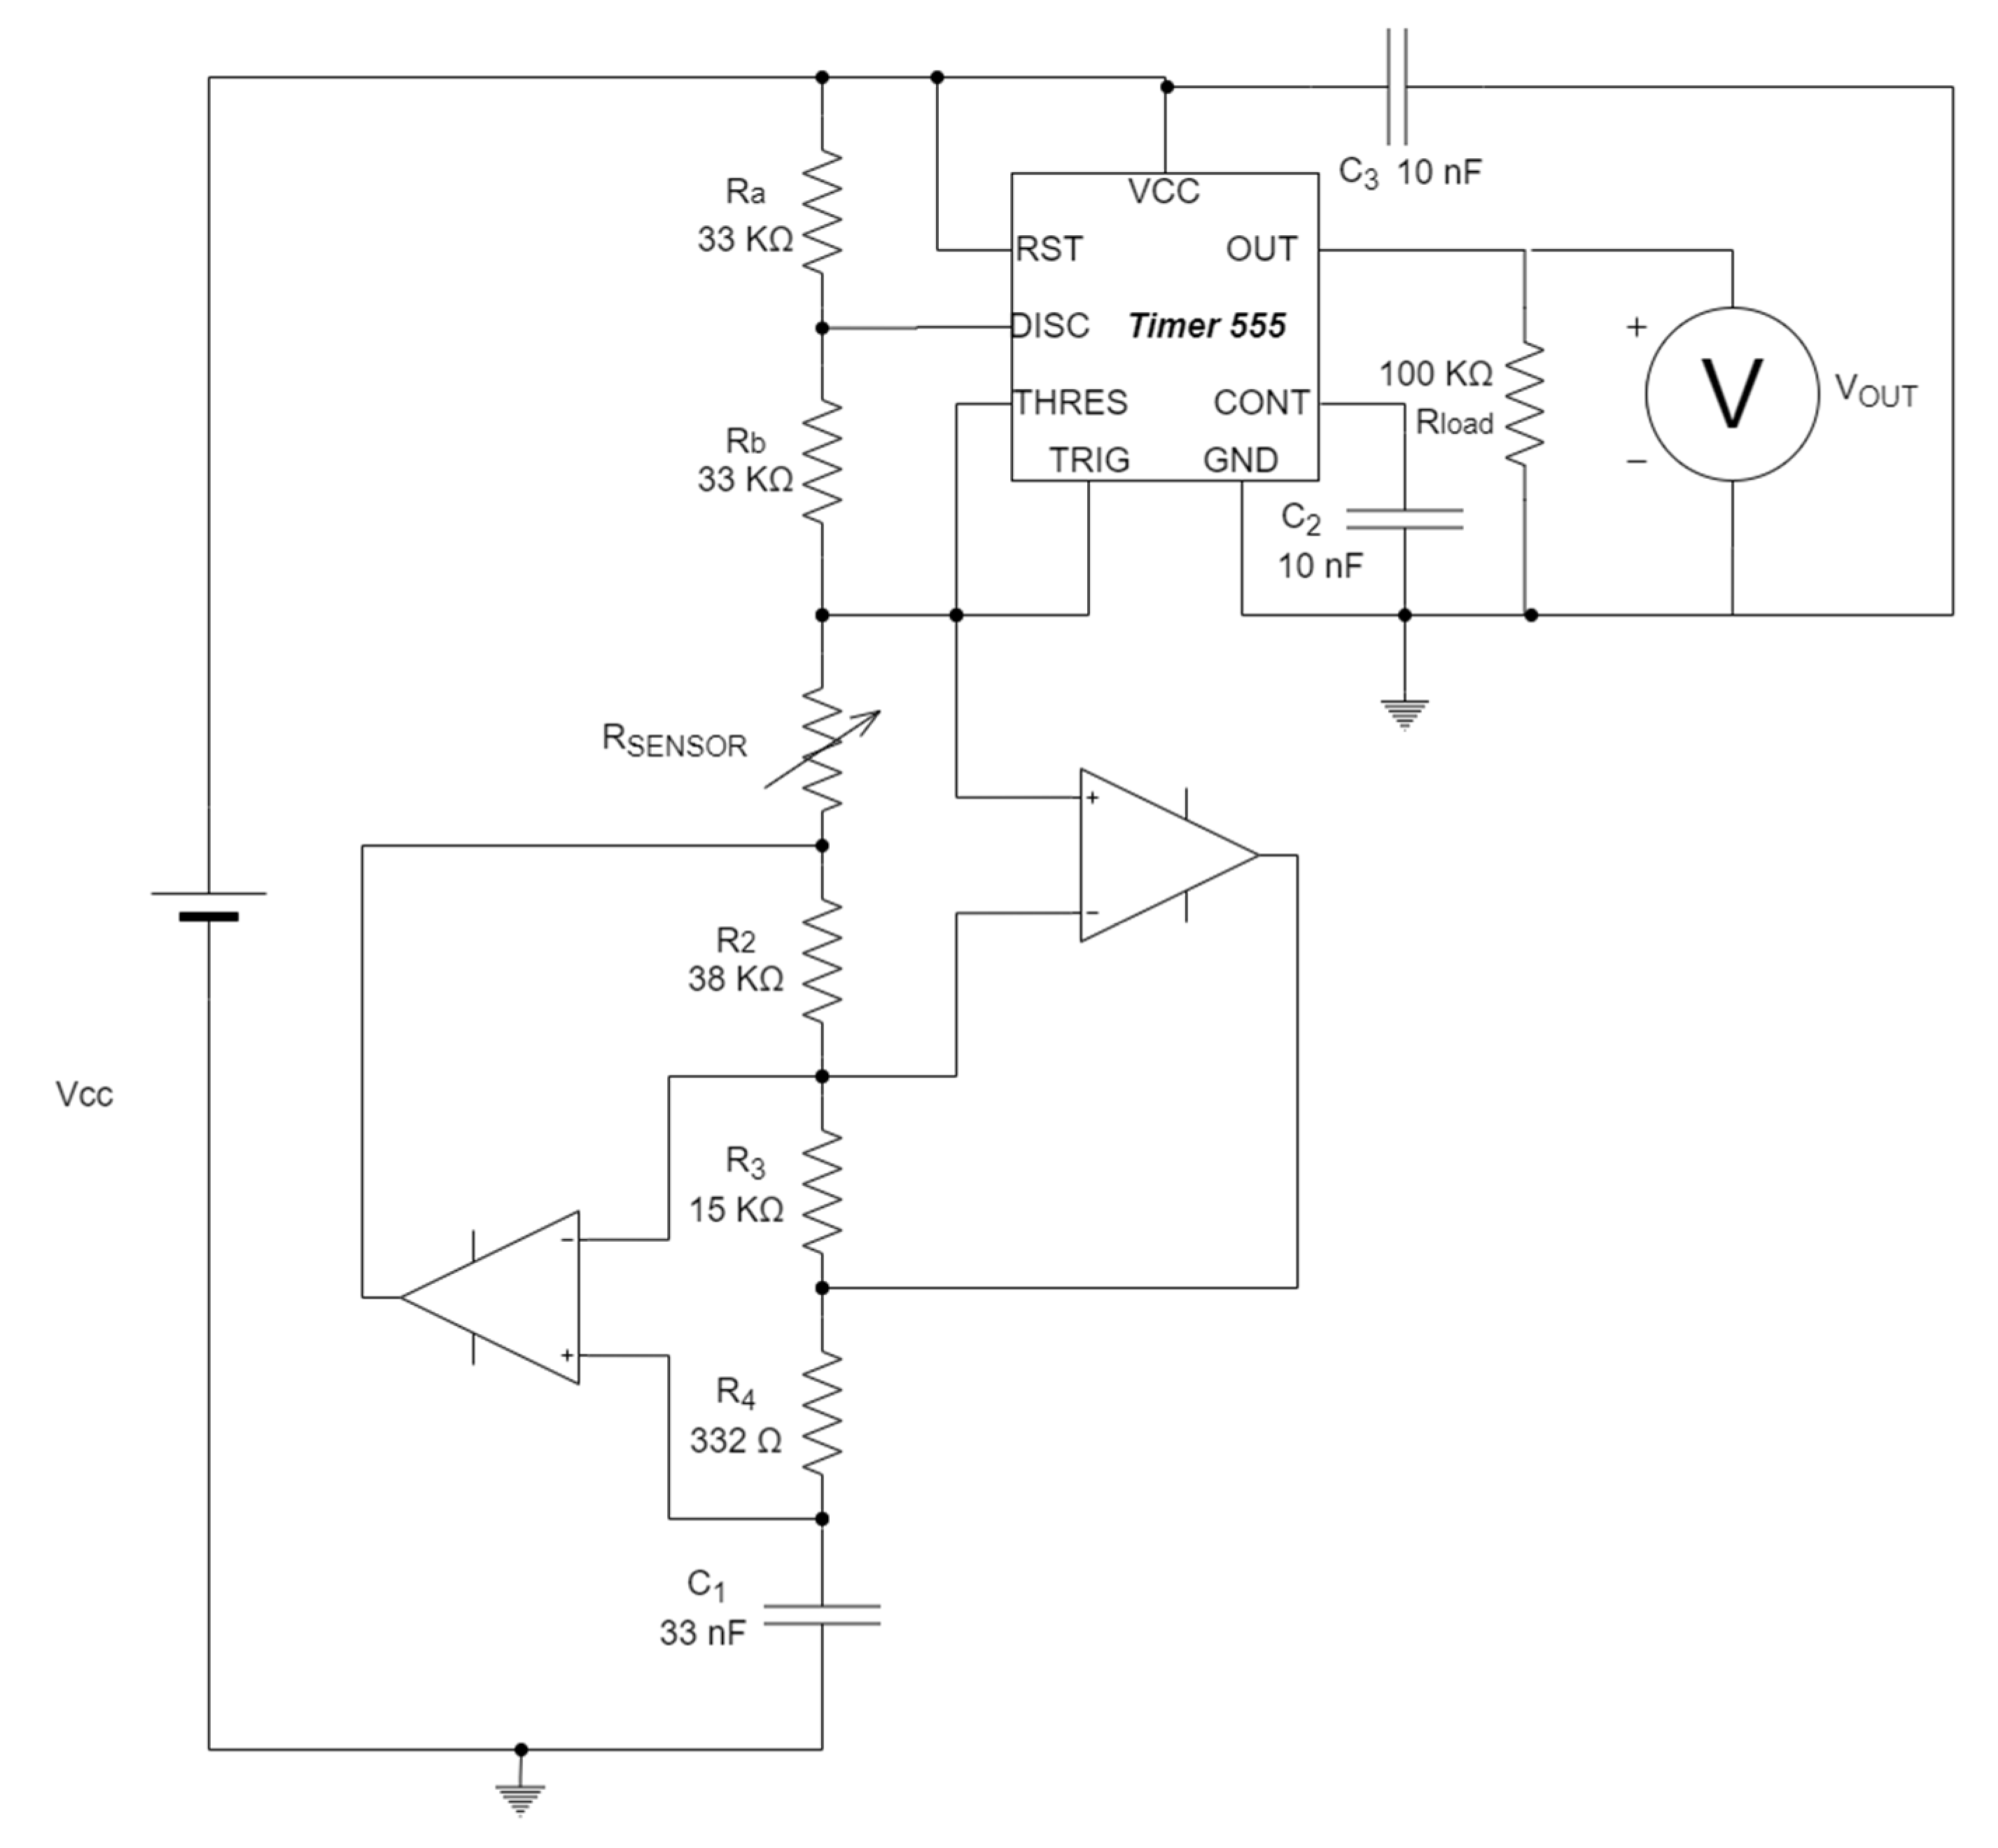
21], the sensor resistance range is between 500 Ω and 30 kΩ, but the range is wider in in this proposal, from 500 Ω to 100 kΩ. Due to this, some changes in the topology were introduced. On one hand, the capacitor C3 of the
Figure 5 changes its place for the resistance R5, and to grow their values until 33 nF and 15 kΩ; this change does not affect to the theoretical behavior of the GIC [
27], but the maximum voltage drop is only 3 V in the worst case. On the other hand, our design has higher voltages than the voltages used in the original paper; this is due to two reasons: the first reason is that the change in the resistance range of the sensor increases the voltage needed; and the second reason is that in [
21] a microcontroller PSoC was used simulating a timer 555, with power voltage level of 3.3 V, whereas in our design a 555 timer integrated circuit [
26] is used with a minimum power voltage of 5 V.
There was a calibration process when 30 resistors with different values where selected. Then, the different circuits were activated with these resistors and 5 V in order to make them stable in terms of temperature. A 4-wires measure was taken for each resistor and each circuit. With these data, the output characteristic (voltage or frequency) vs. Rsensor can be compared with the theoretical value.
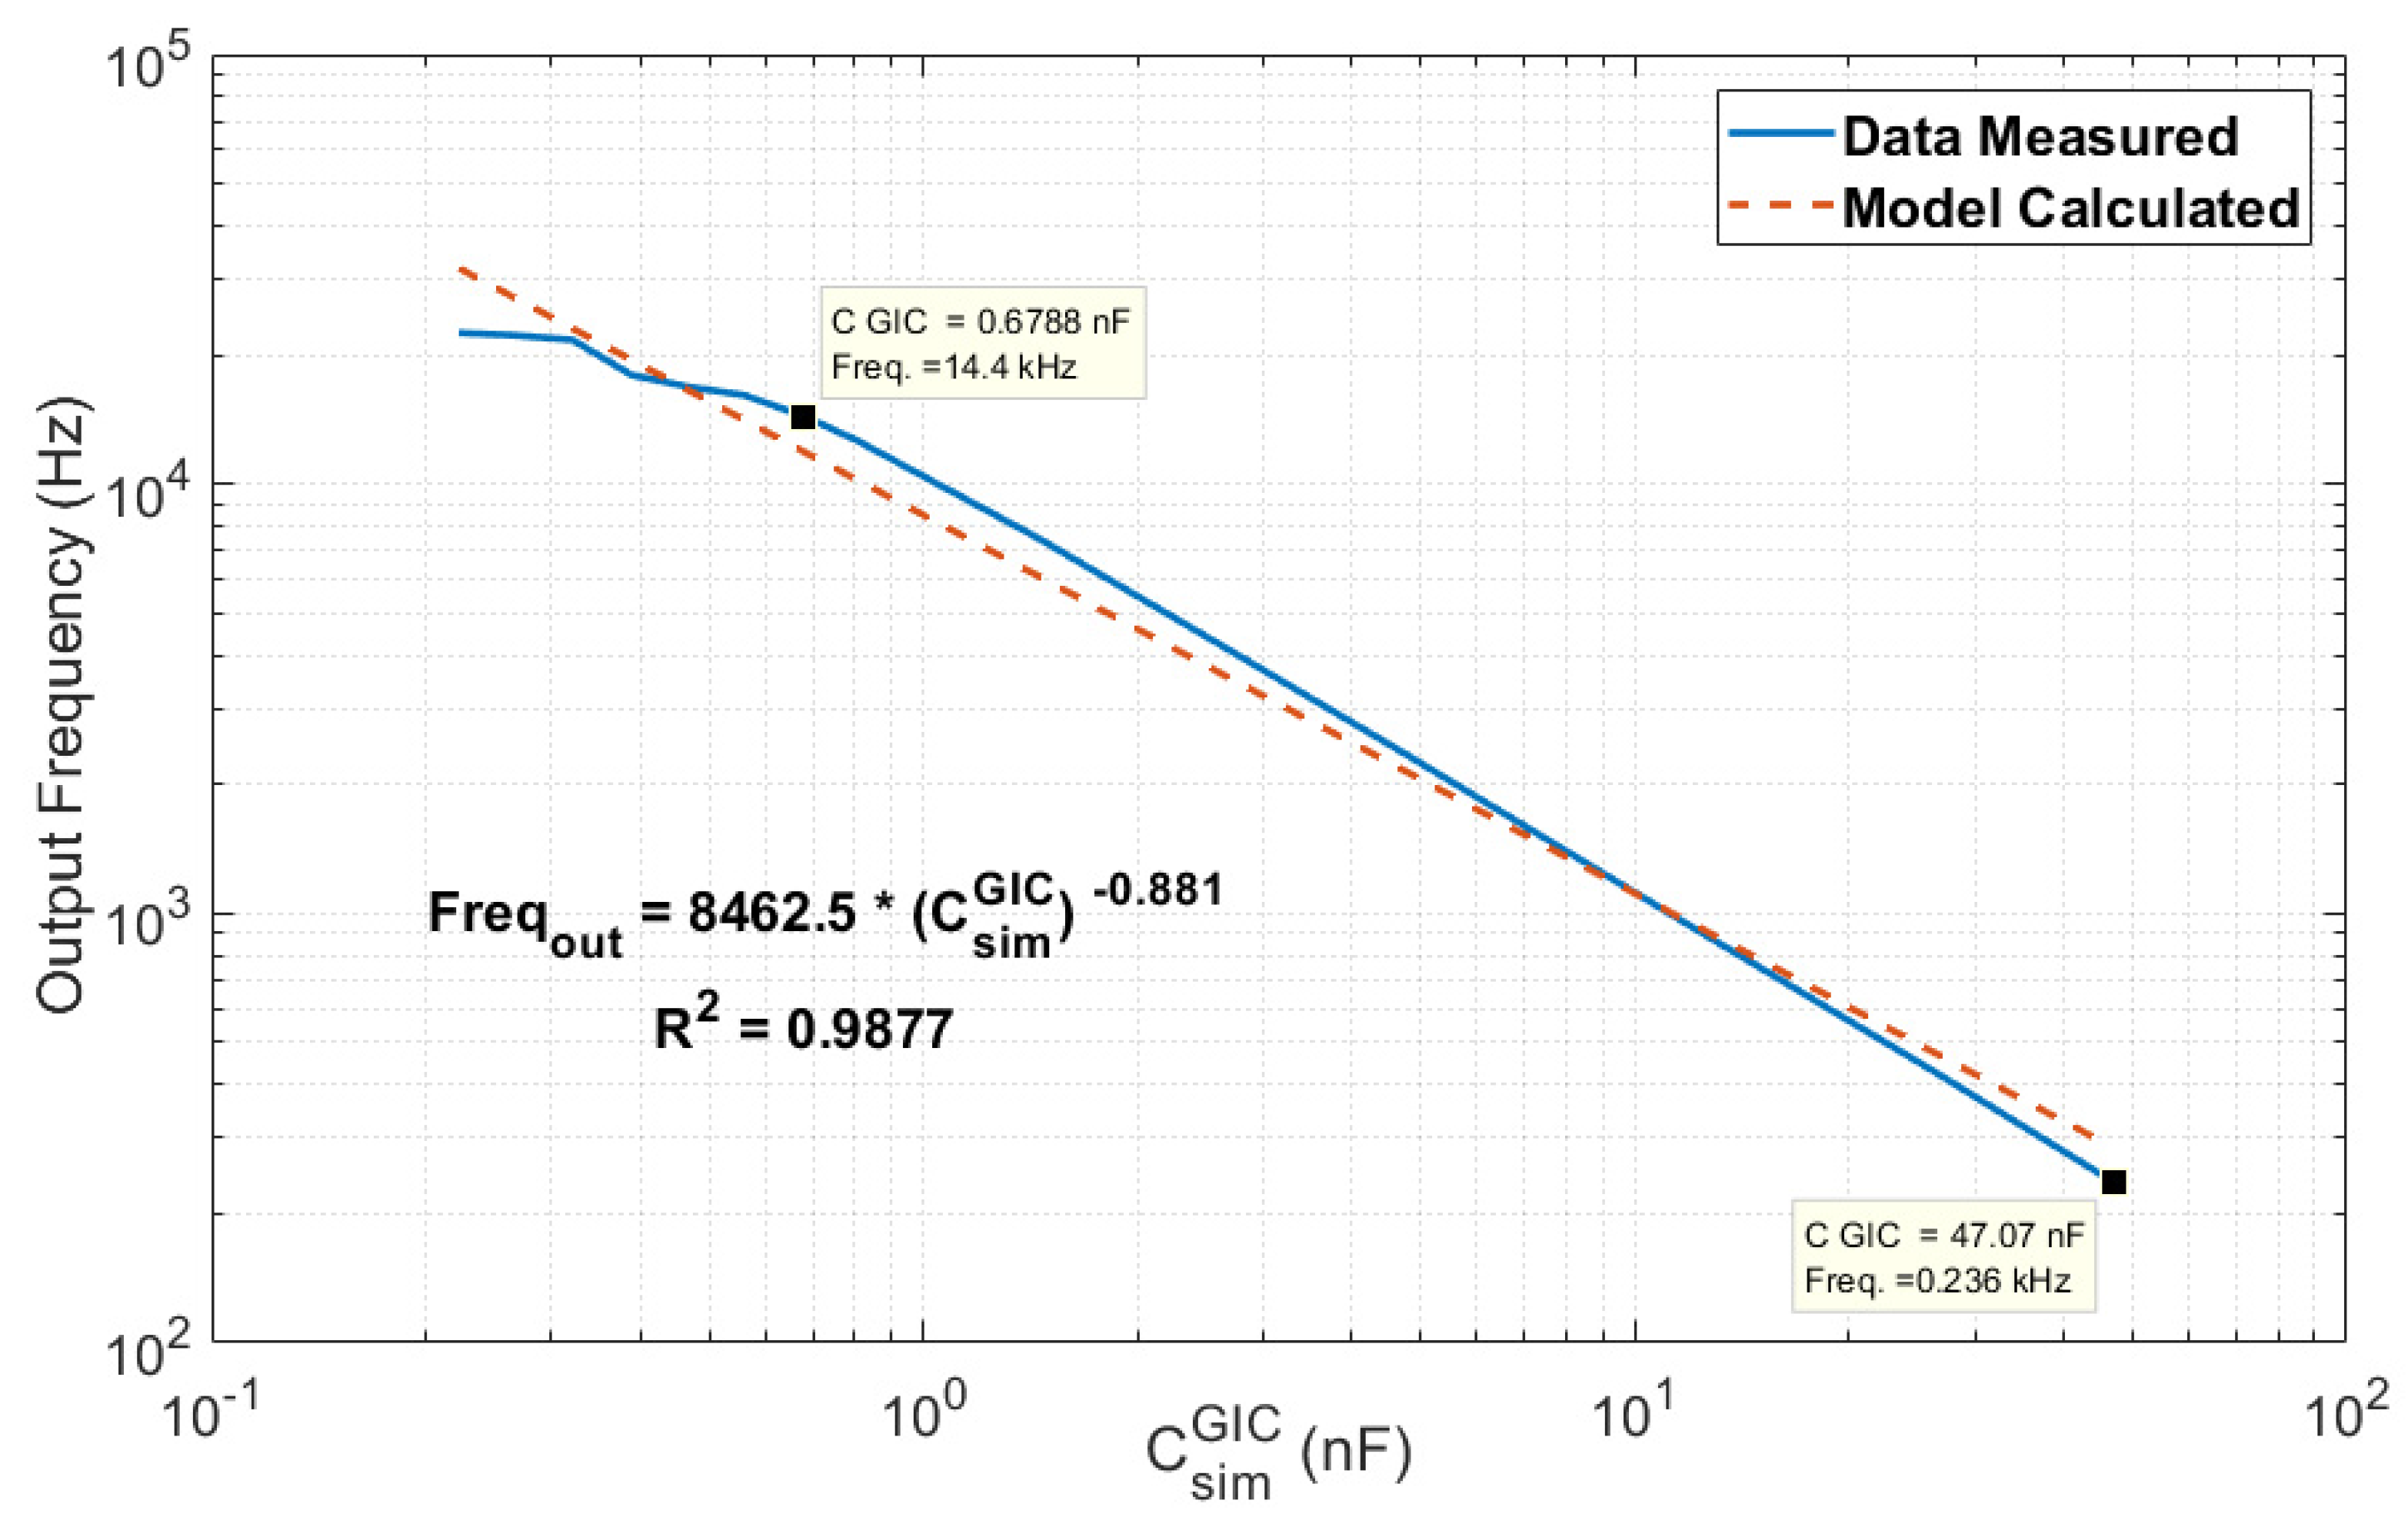
If we consider the resistance-to-frequency circuit in
Figure 6, the output frequency vs. capacitance is shown in
Figure 7, where we can see that the output frequency does not change linearly with the sensor resistance along a wide range, but it still can be used taking into account this particularity. In the range of the sensor resistance, from 500 Ω (
) to 40 kΩ (
), frequency changes linearly with the sensor resistance, but if the resistance is bigger than 40 kΩ this behavior changes. Moreover, it shows that, when the capacitance simulated by the GIC is lower than 0.65 nF and the sensor resistance is smaller than 40 kΩ, the change of the frequency regards the change of the capacitance simulated by the GIC has an hyperbolic function, and given that
,
Figure 7 confirms the behavior of the output frequency explained above.
2.4. Methods
The output voltage was measured using a Red-Pitaya STEMlab 125-14 [
22] board, whose operative system and Field Programmable Gate Array (FPGA) program were modified to use it as a data acquisition card using the project made by Nils Roos [
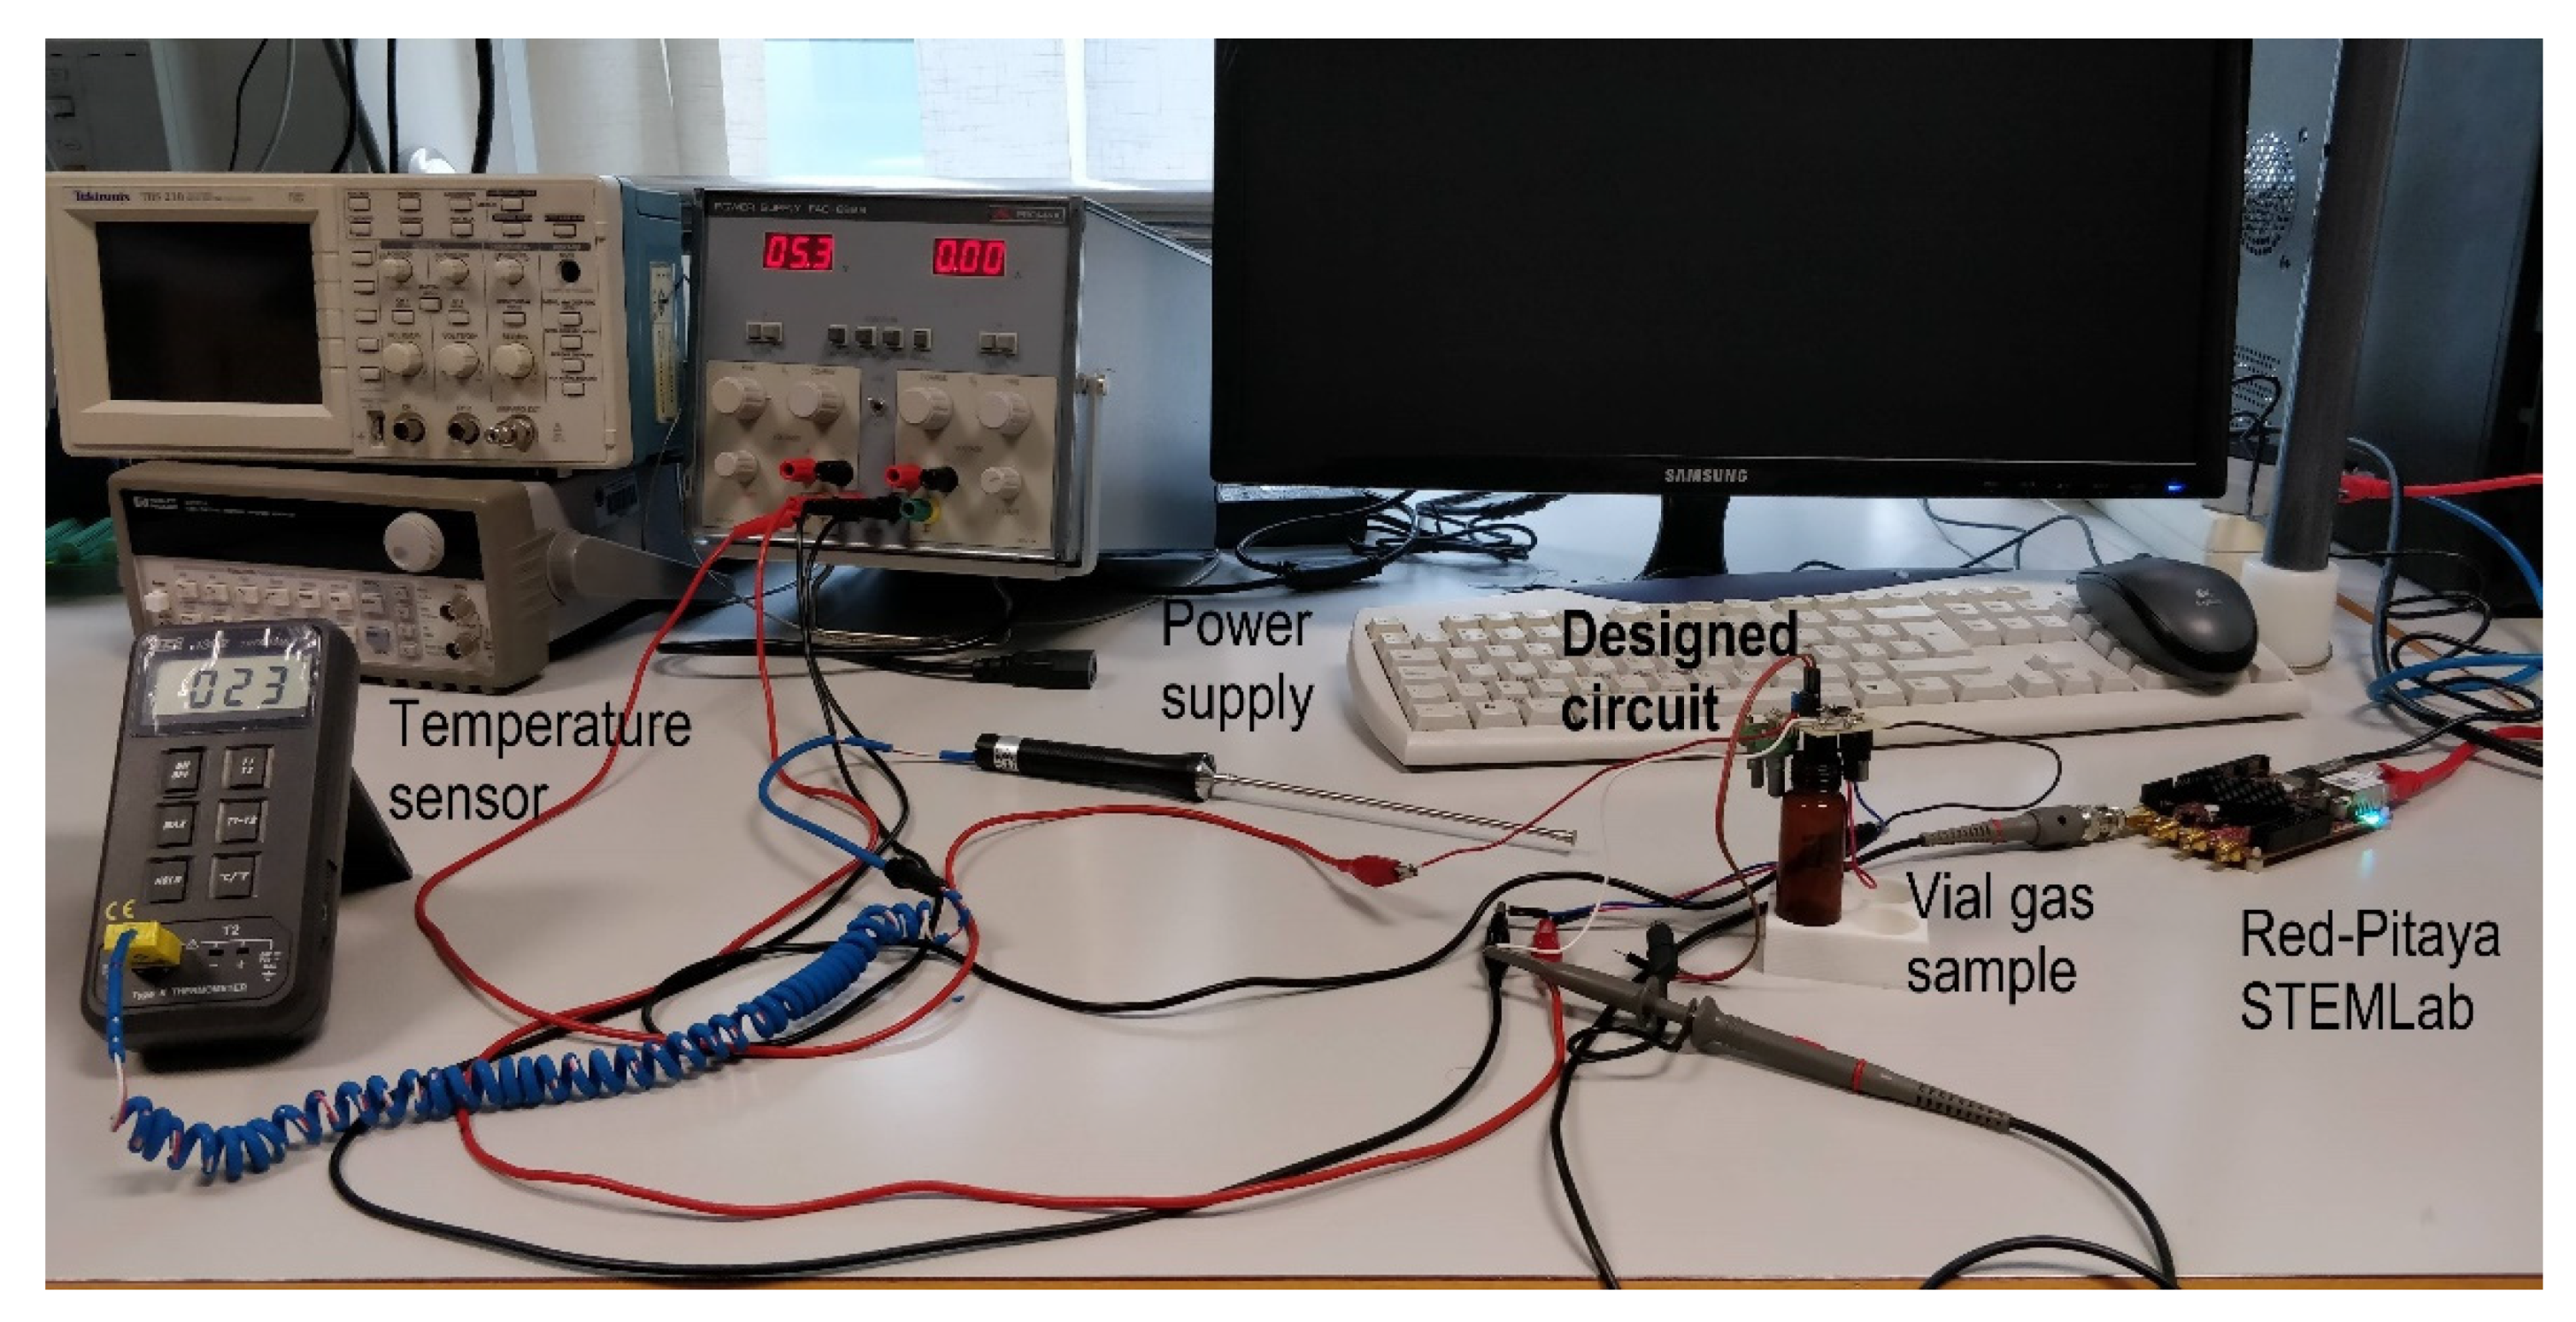
28]. The board sends all data through a TCP-IP connection, to a computer that saves all data in a file using a LabVIEW program. The experimental setup of electronics is shown in
Figure 8 and the frontal panel is shown in
Figure 9.
The substance to be detected was absolute ethanol of Scharlau, whose density is 0.79 g/cm3 in water, and dissolutions with different concentrations were applied; from 500 ppm to 6000 ppm. Each sample contained 2 cm3 of one dissolution in a vial, where the sensor was placed. All the measures were taken at temperatures from 296 to 297 °K. This temperature was measured using a thermocouple type K and a digital thermometer TES-1302.
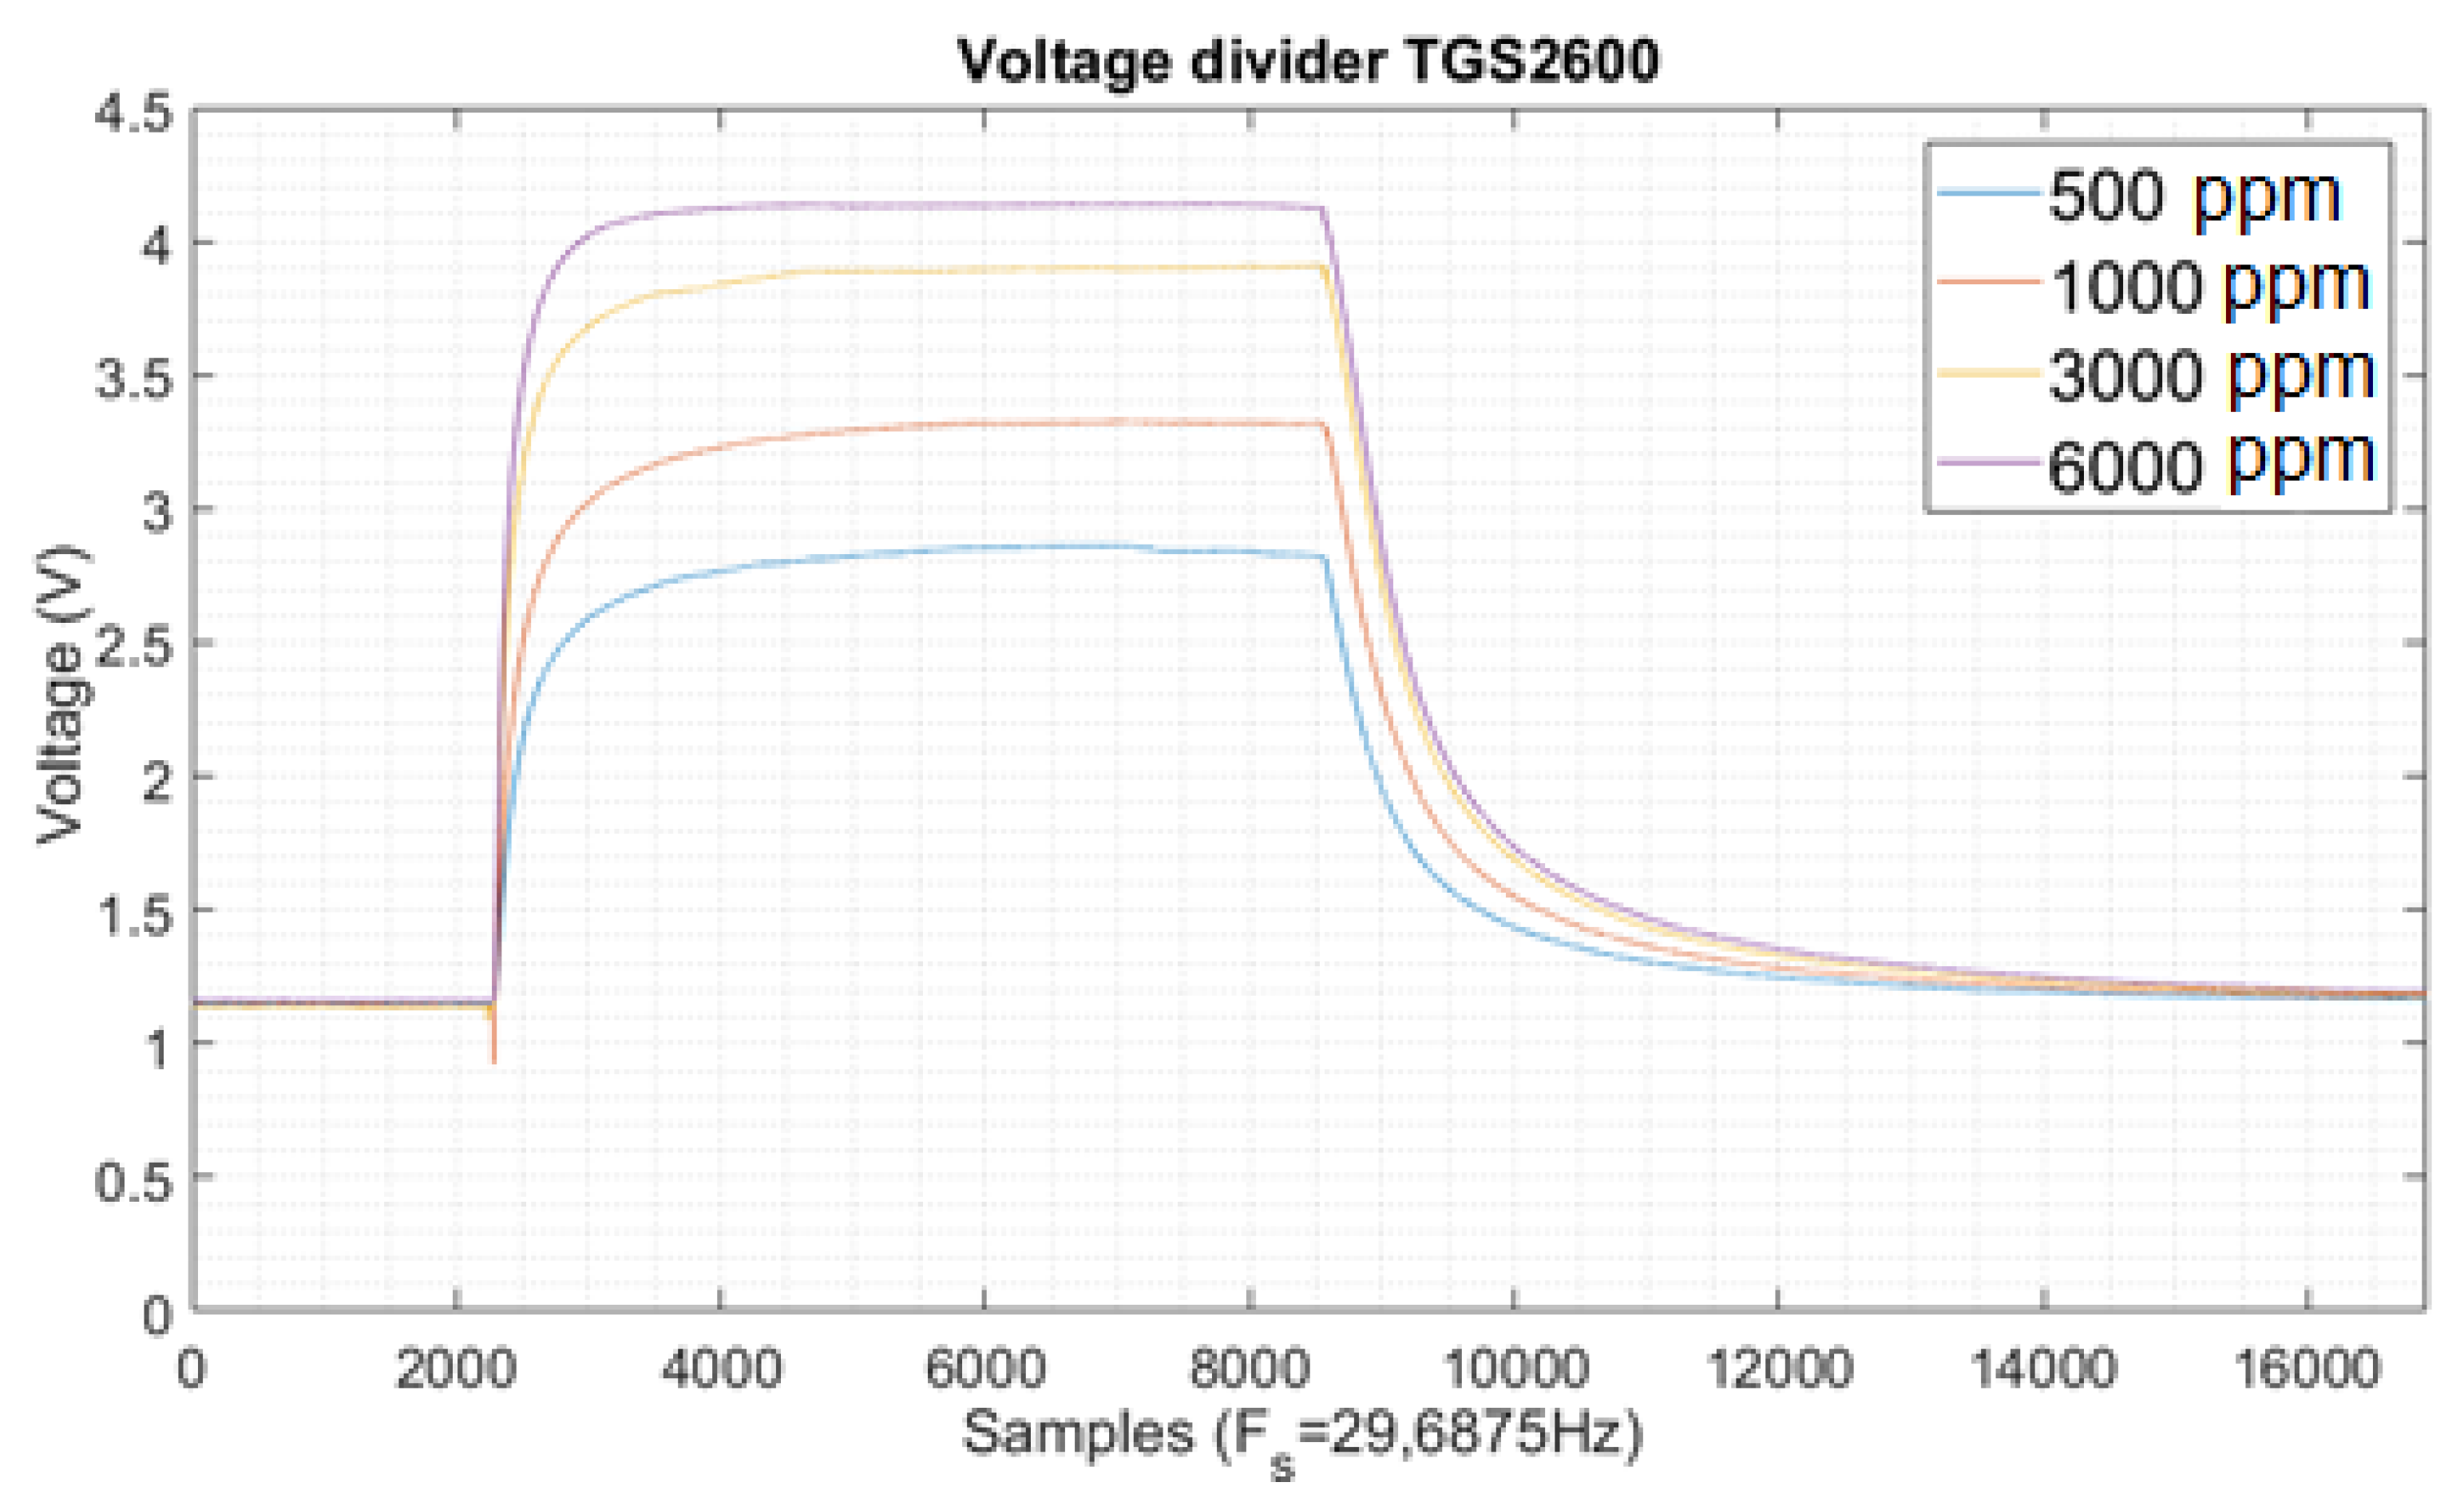
Typical curves obtained in the acquisition system are shown in
Figure 10 for illustrative purposes; in this case, the condition circuit was the voltage divider, and the sensor was the TGS2600, with different concentrations of ethanol.
Measures were taken following this procedure (
Figure S5 in the Supplementary Materials): firstly, a measure of clean air is obtained to take a voltage reference. Secondly, the dissolution sample is measured, in this step two characteristics of the measure were considered: the rising edge of the voltage, and the voltage value when it is stable. The last step is to measure clean air again. All sensors had been working previously at least 24 h because they need to be warmed up before being used.
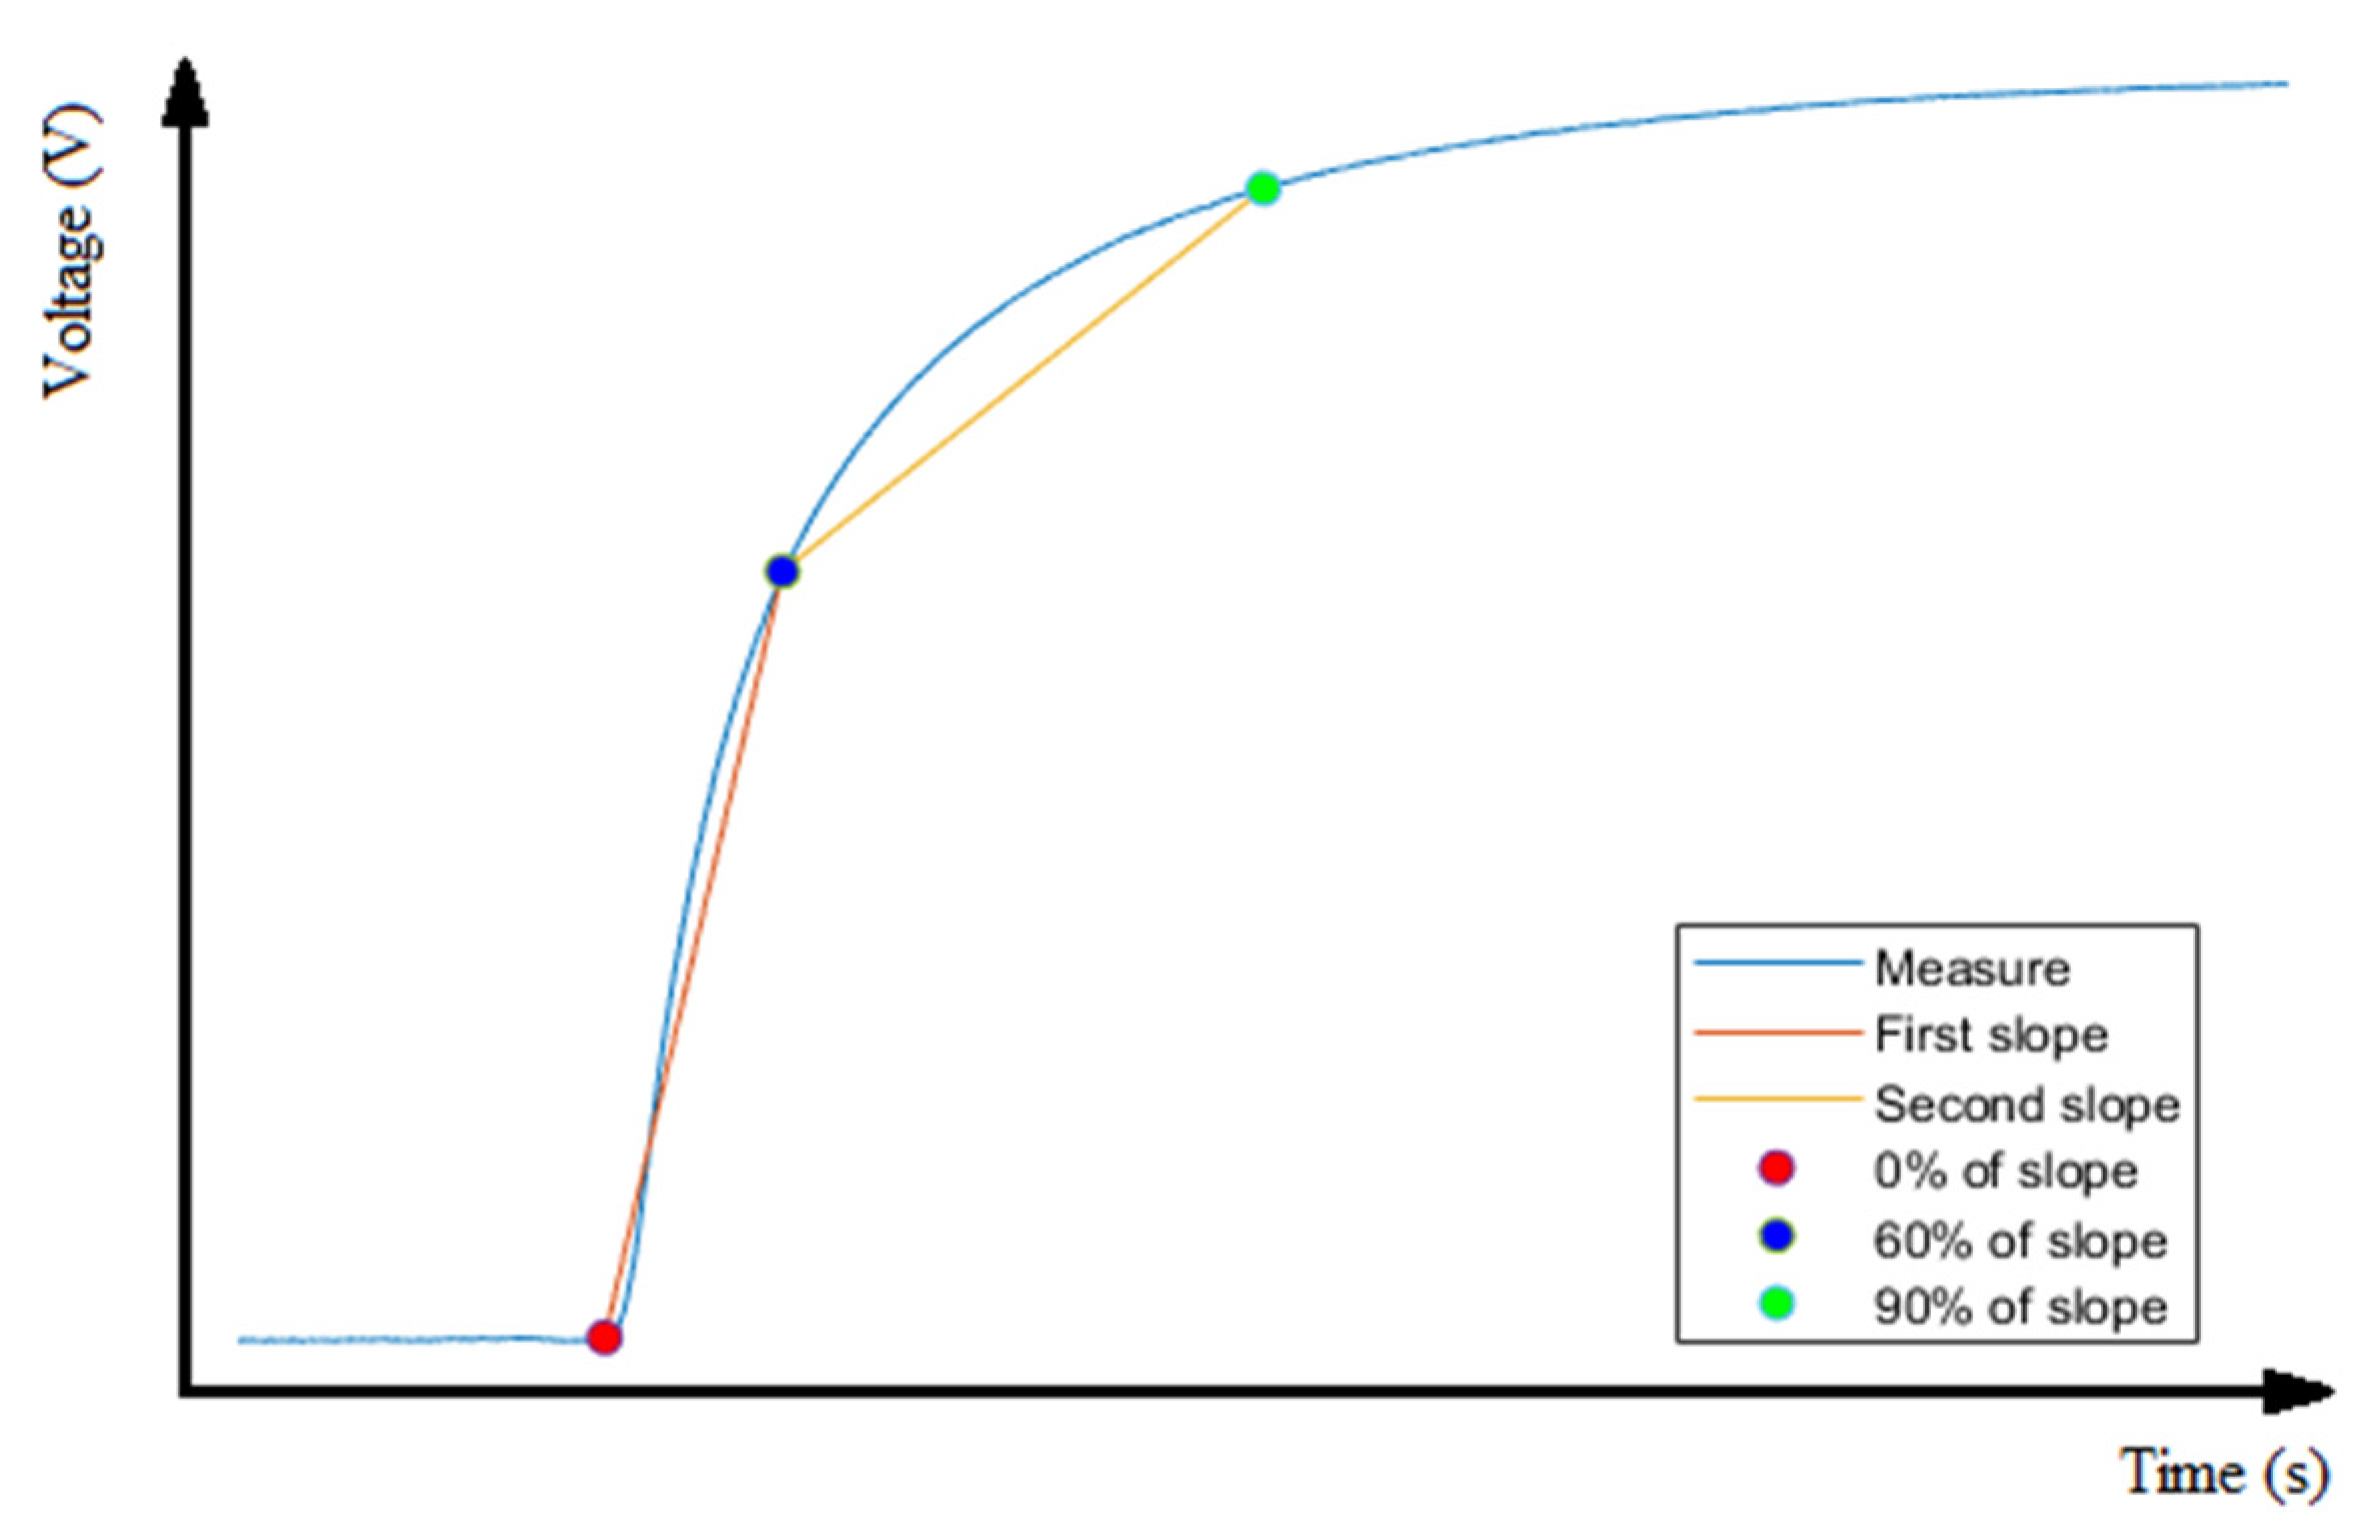
One of the characteristics measured in the voltage divider, Wheatstone bridge and Anderson loop designs was the slew rate when the sensor starts to measure the sample. The voltage rise transition is approximated to two lines, whose slopes are calculated as follow: the first one from t = 0 and instant when voltage is 60% of the stable value; and the second one from 60% to 90%, as shown in
Figure 11.
The characteristic measured in the resistance-to-frequency converter design is the main frequency of the output signal. For this reason, a Fast Fourier Transform (FFT) of the data was calculated to obtain the main frequency component. The steps followed for these measures are the same as explained previously (
Figure S5 in the Supplementary Materials).
3. Results
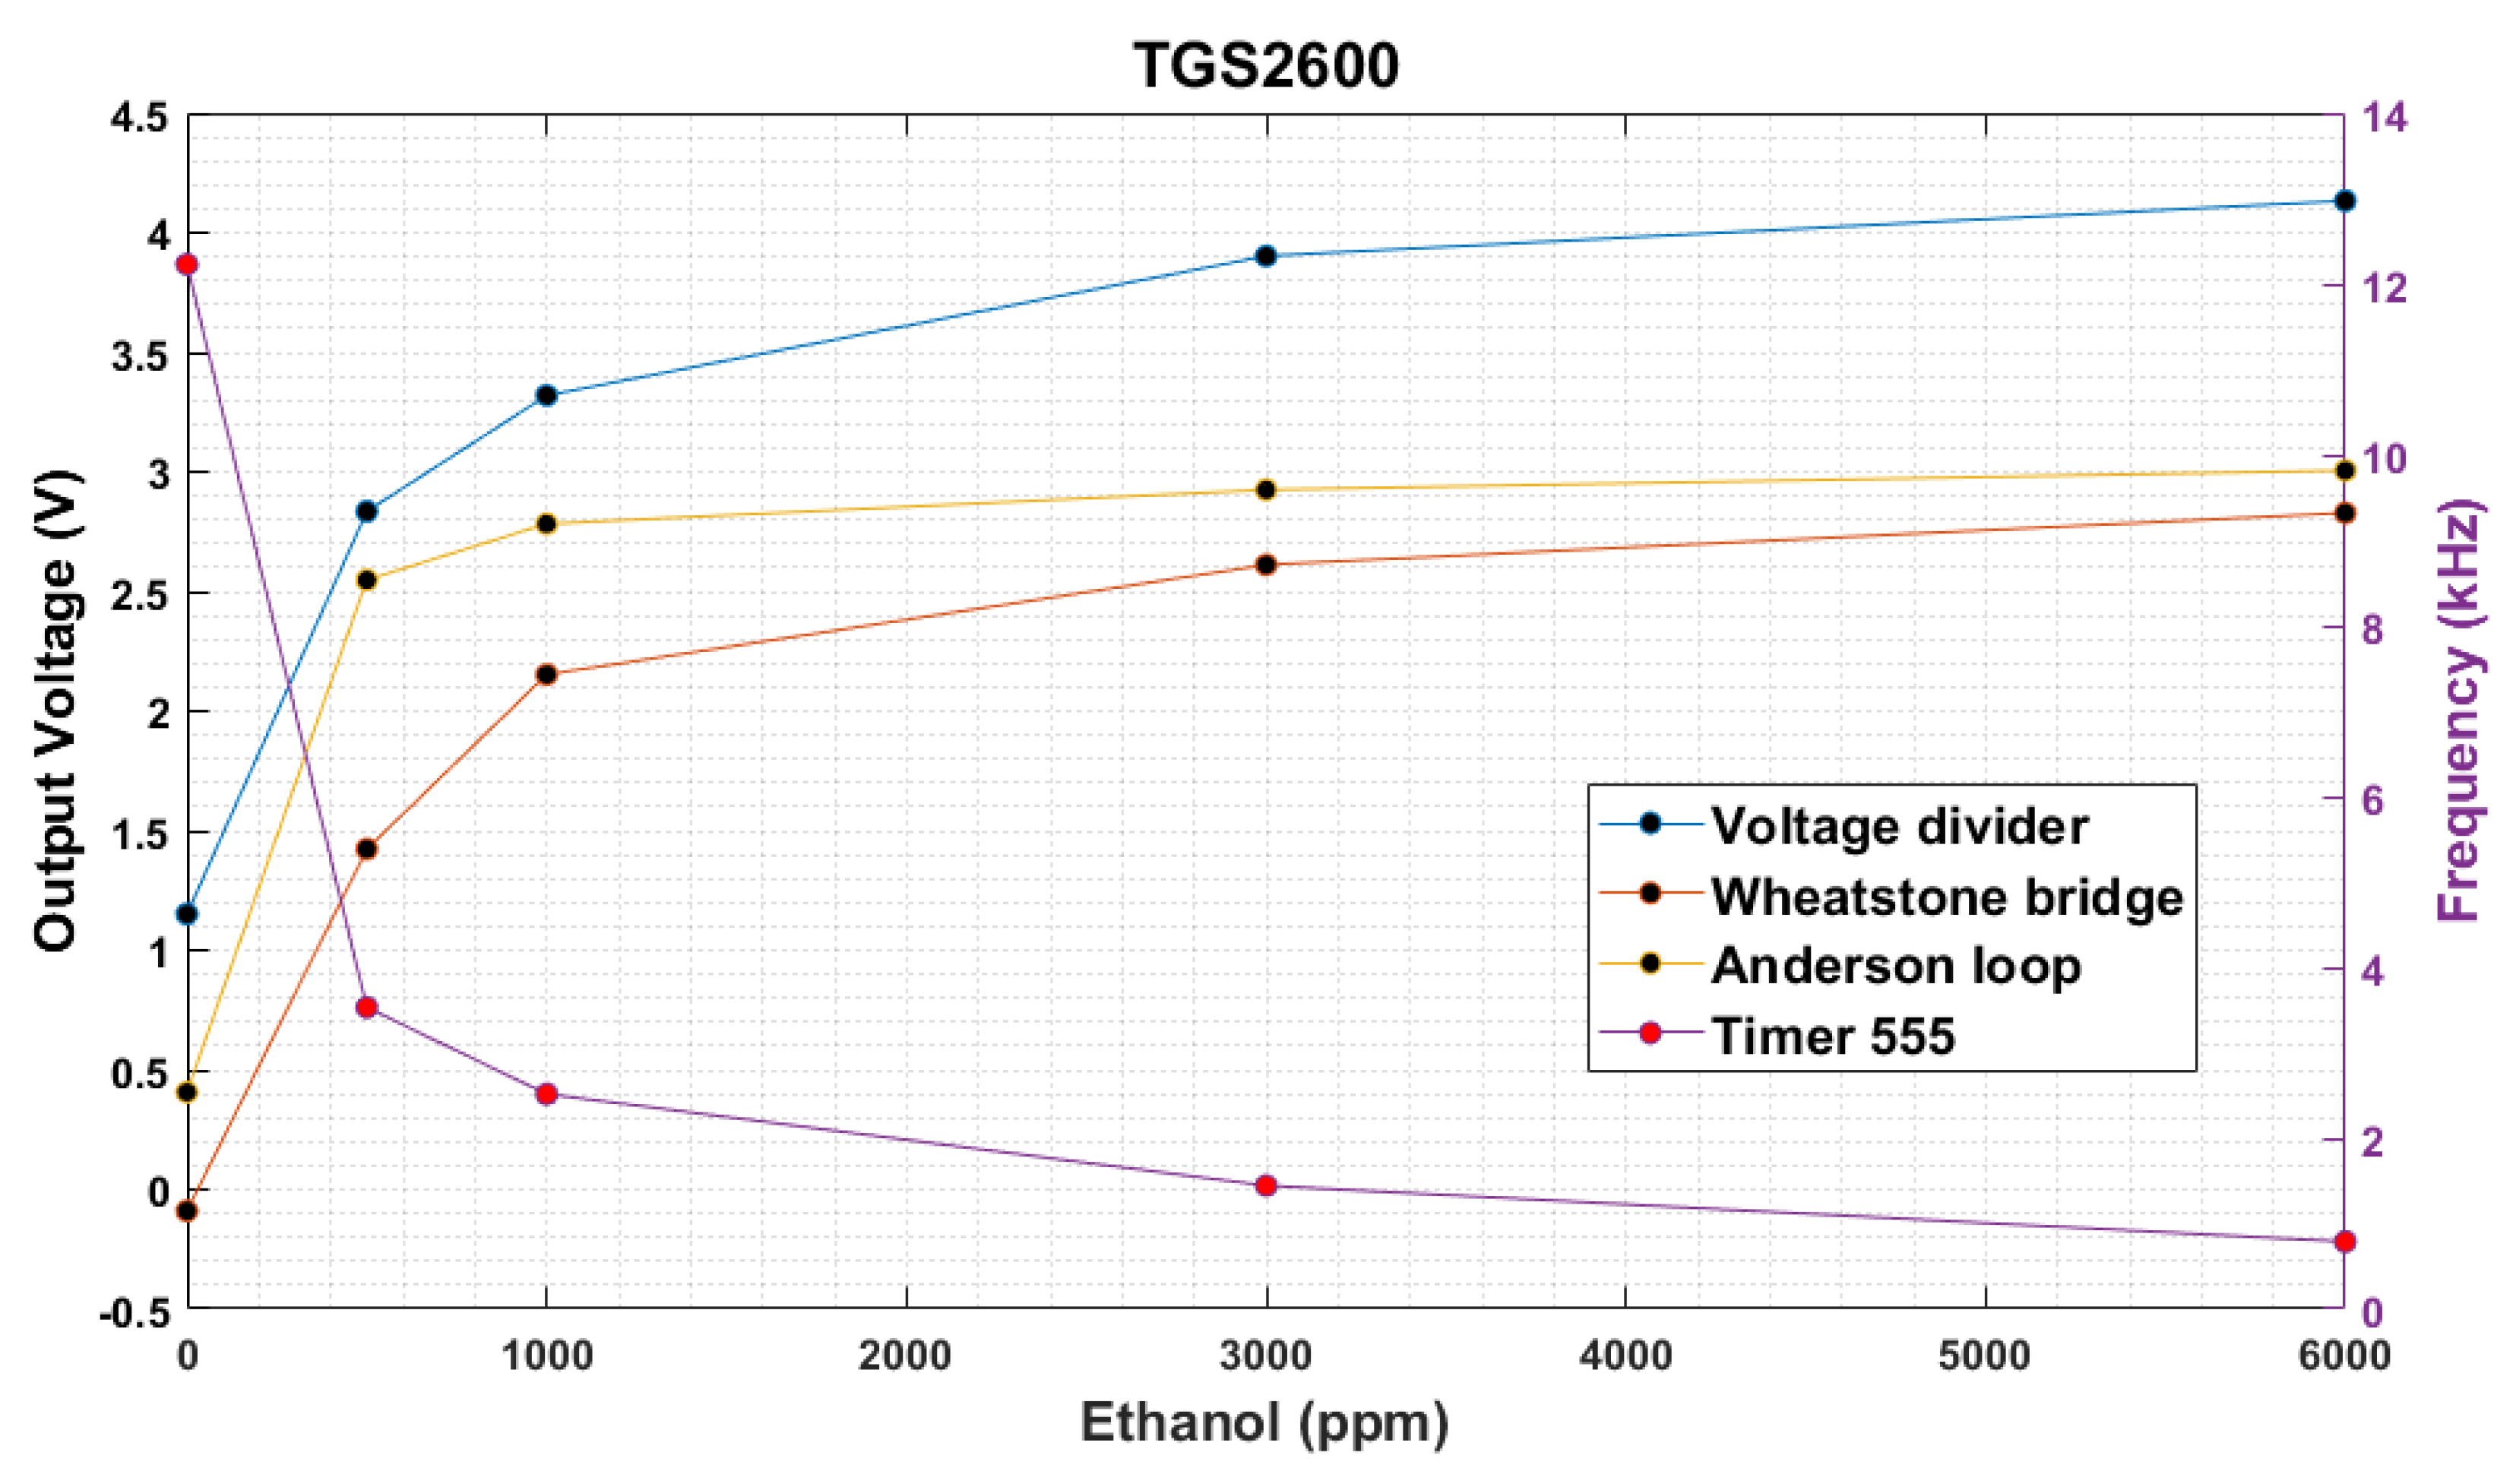
Figure 12 shows the values when the sensor is stable with the TGS 2600. Although all measures are in the same graph, the resistance-to-frequency converter design uses the right vertical scale (output signal frequency) whereas the other three plots use the vertical left scale (output voltage).
Figure 12 confirms that all designs can be used to measure different concentrations of ethanol in the air, but there are other characteristics to consider, such as the signal noise. This characteristic is measured when the voltage output is stable. In case of the voltage divider and the Anderson loop, the noise is considered as the floor noise of the ADC, but in the Wheatstone bridge the noise is greater than in the others.
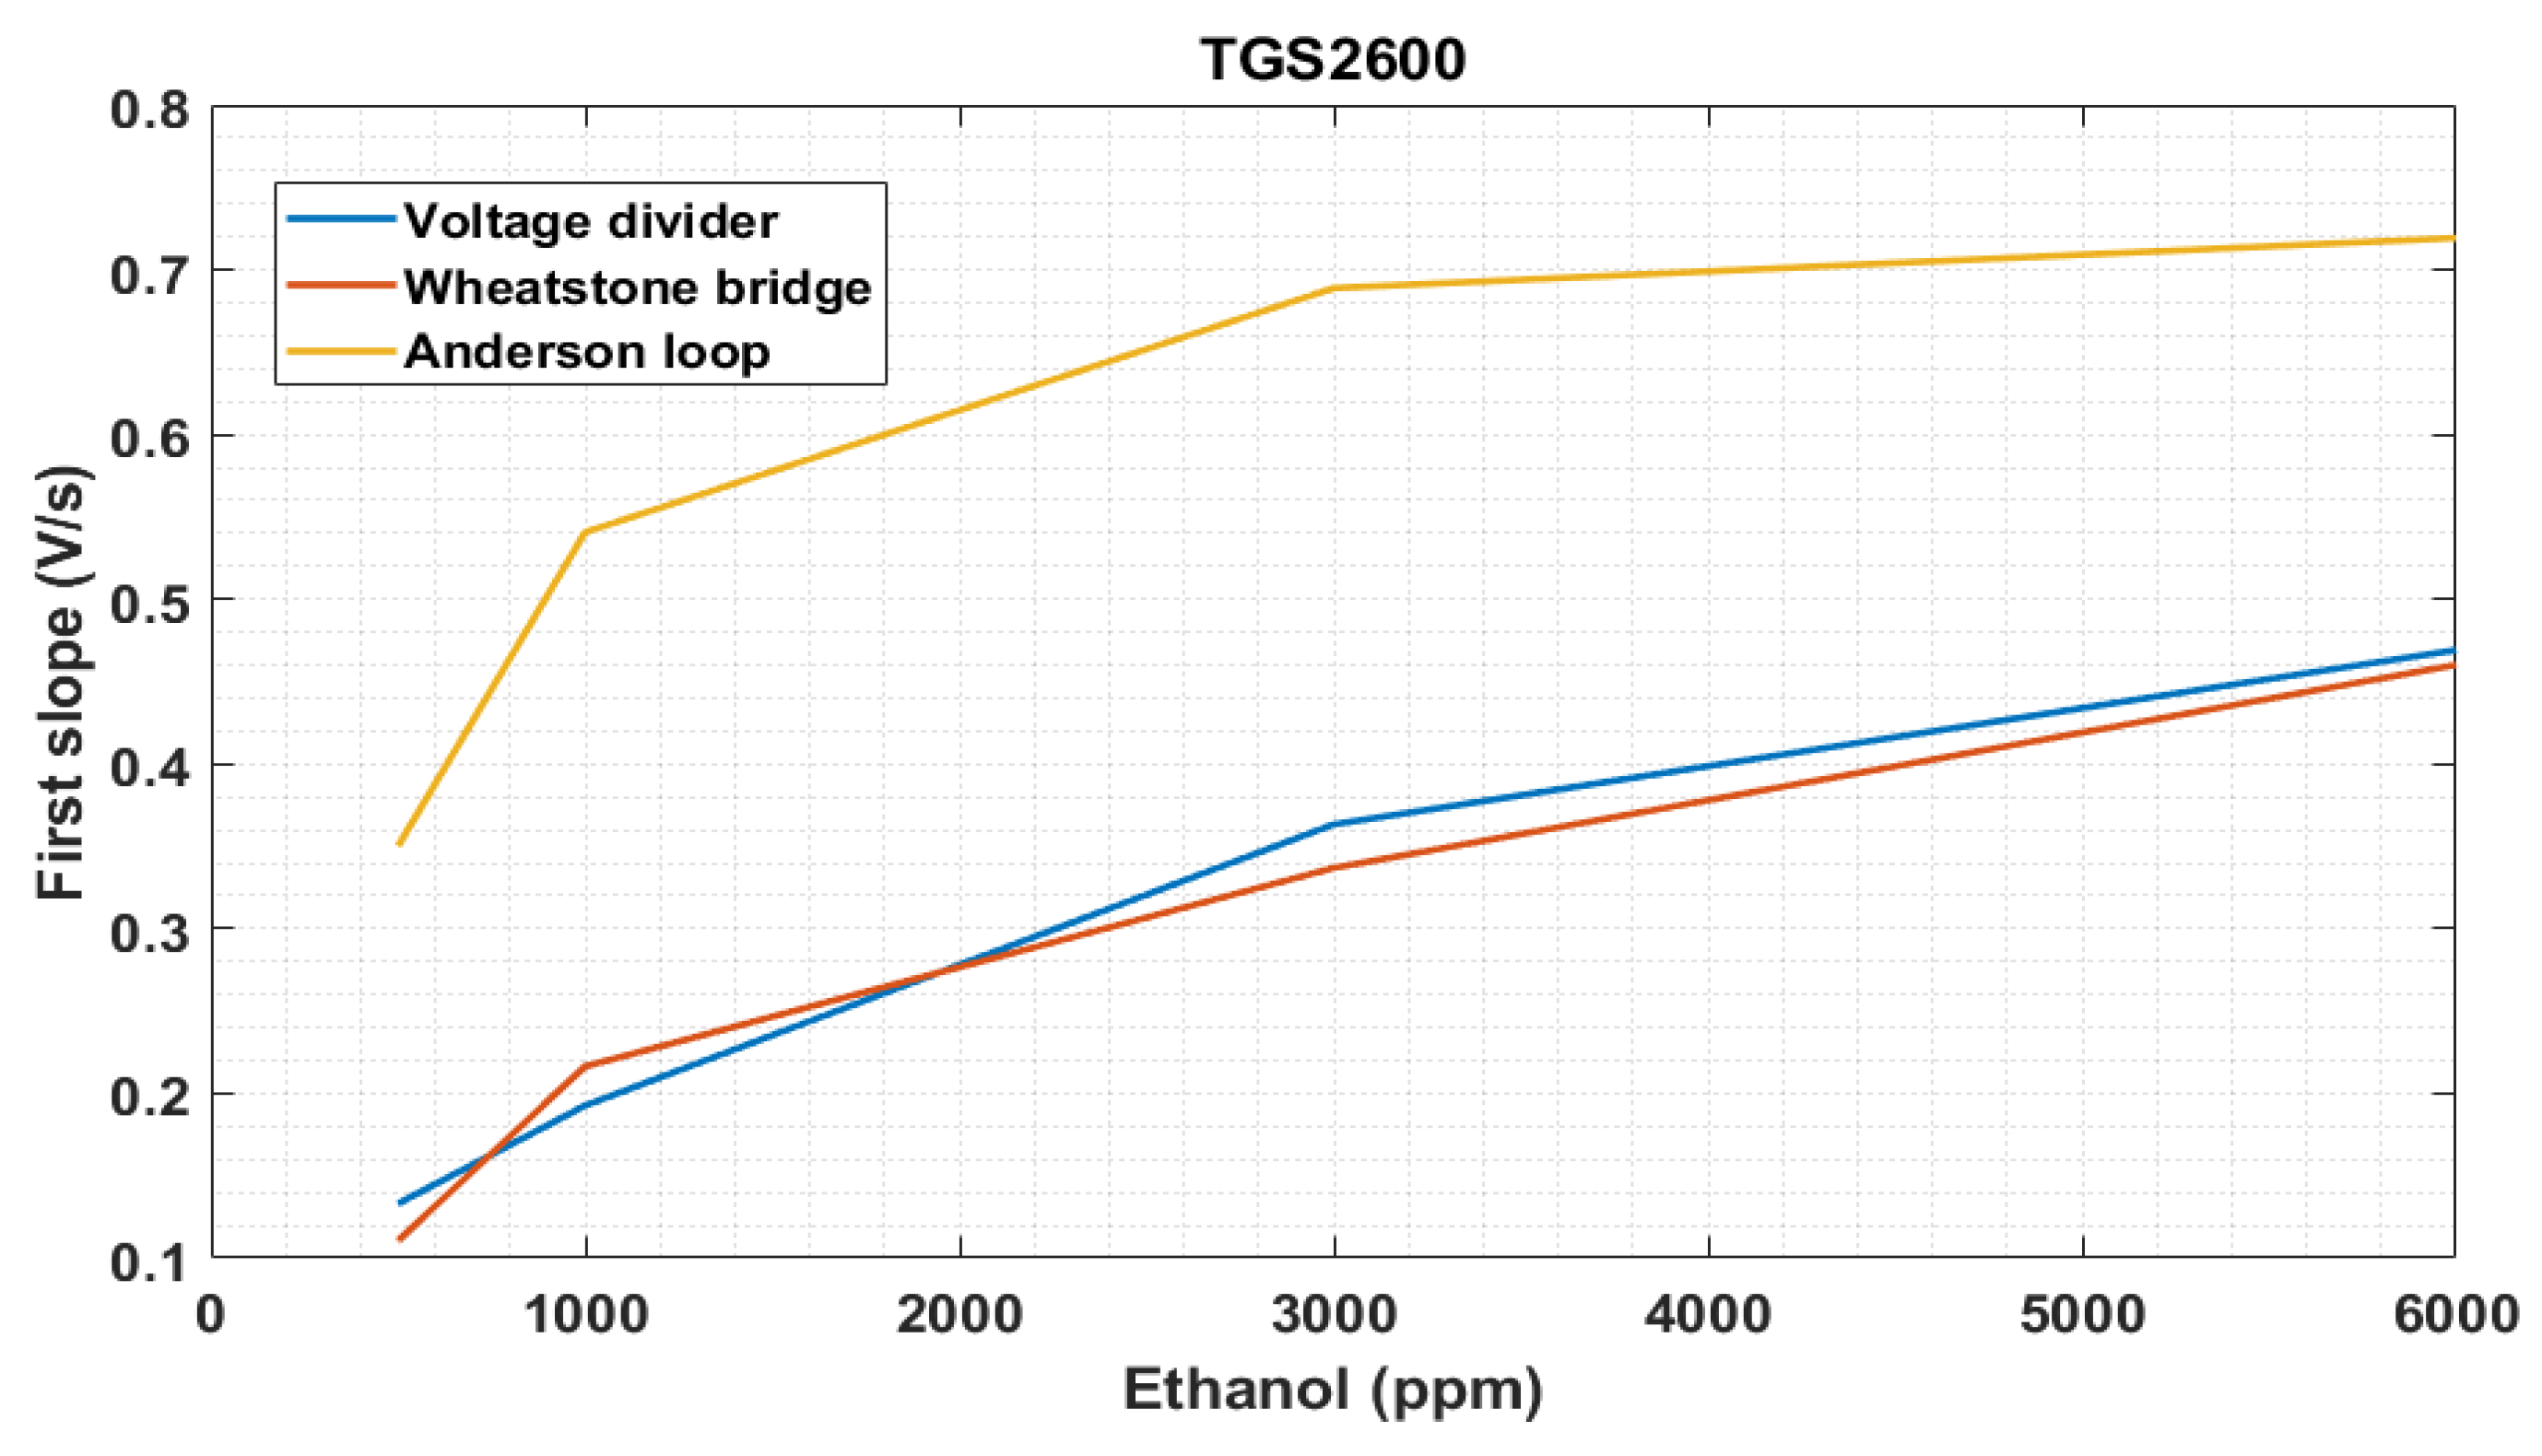
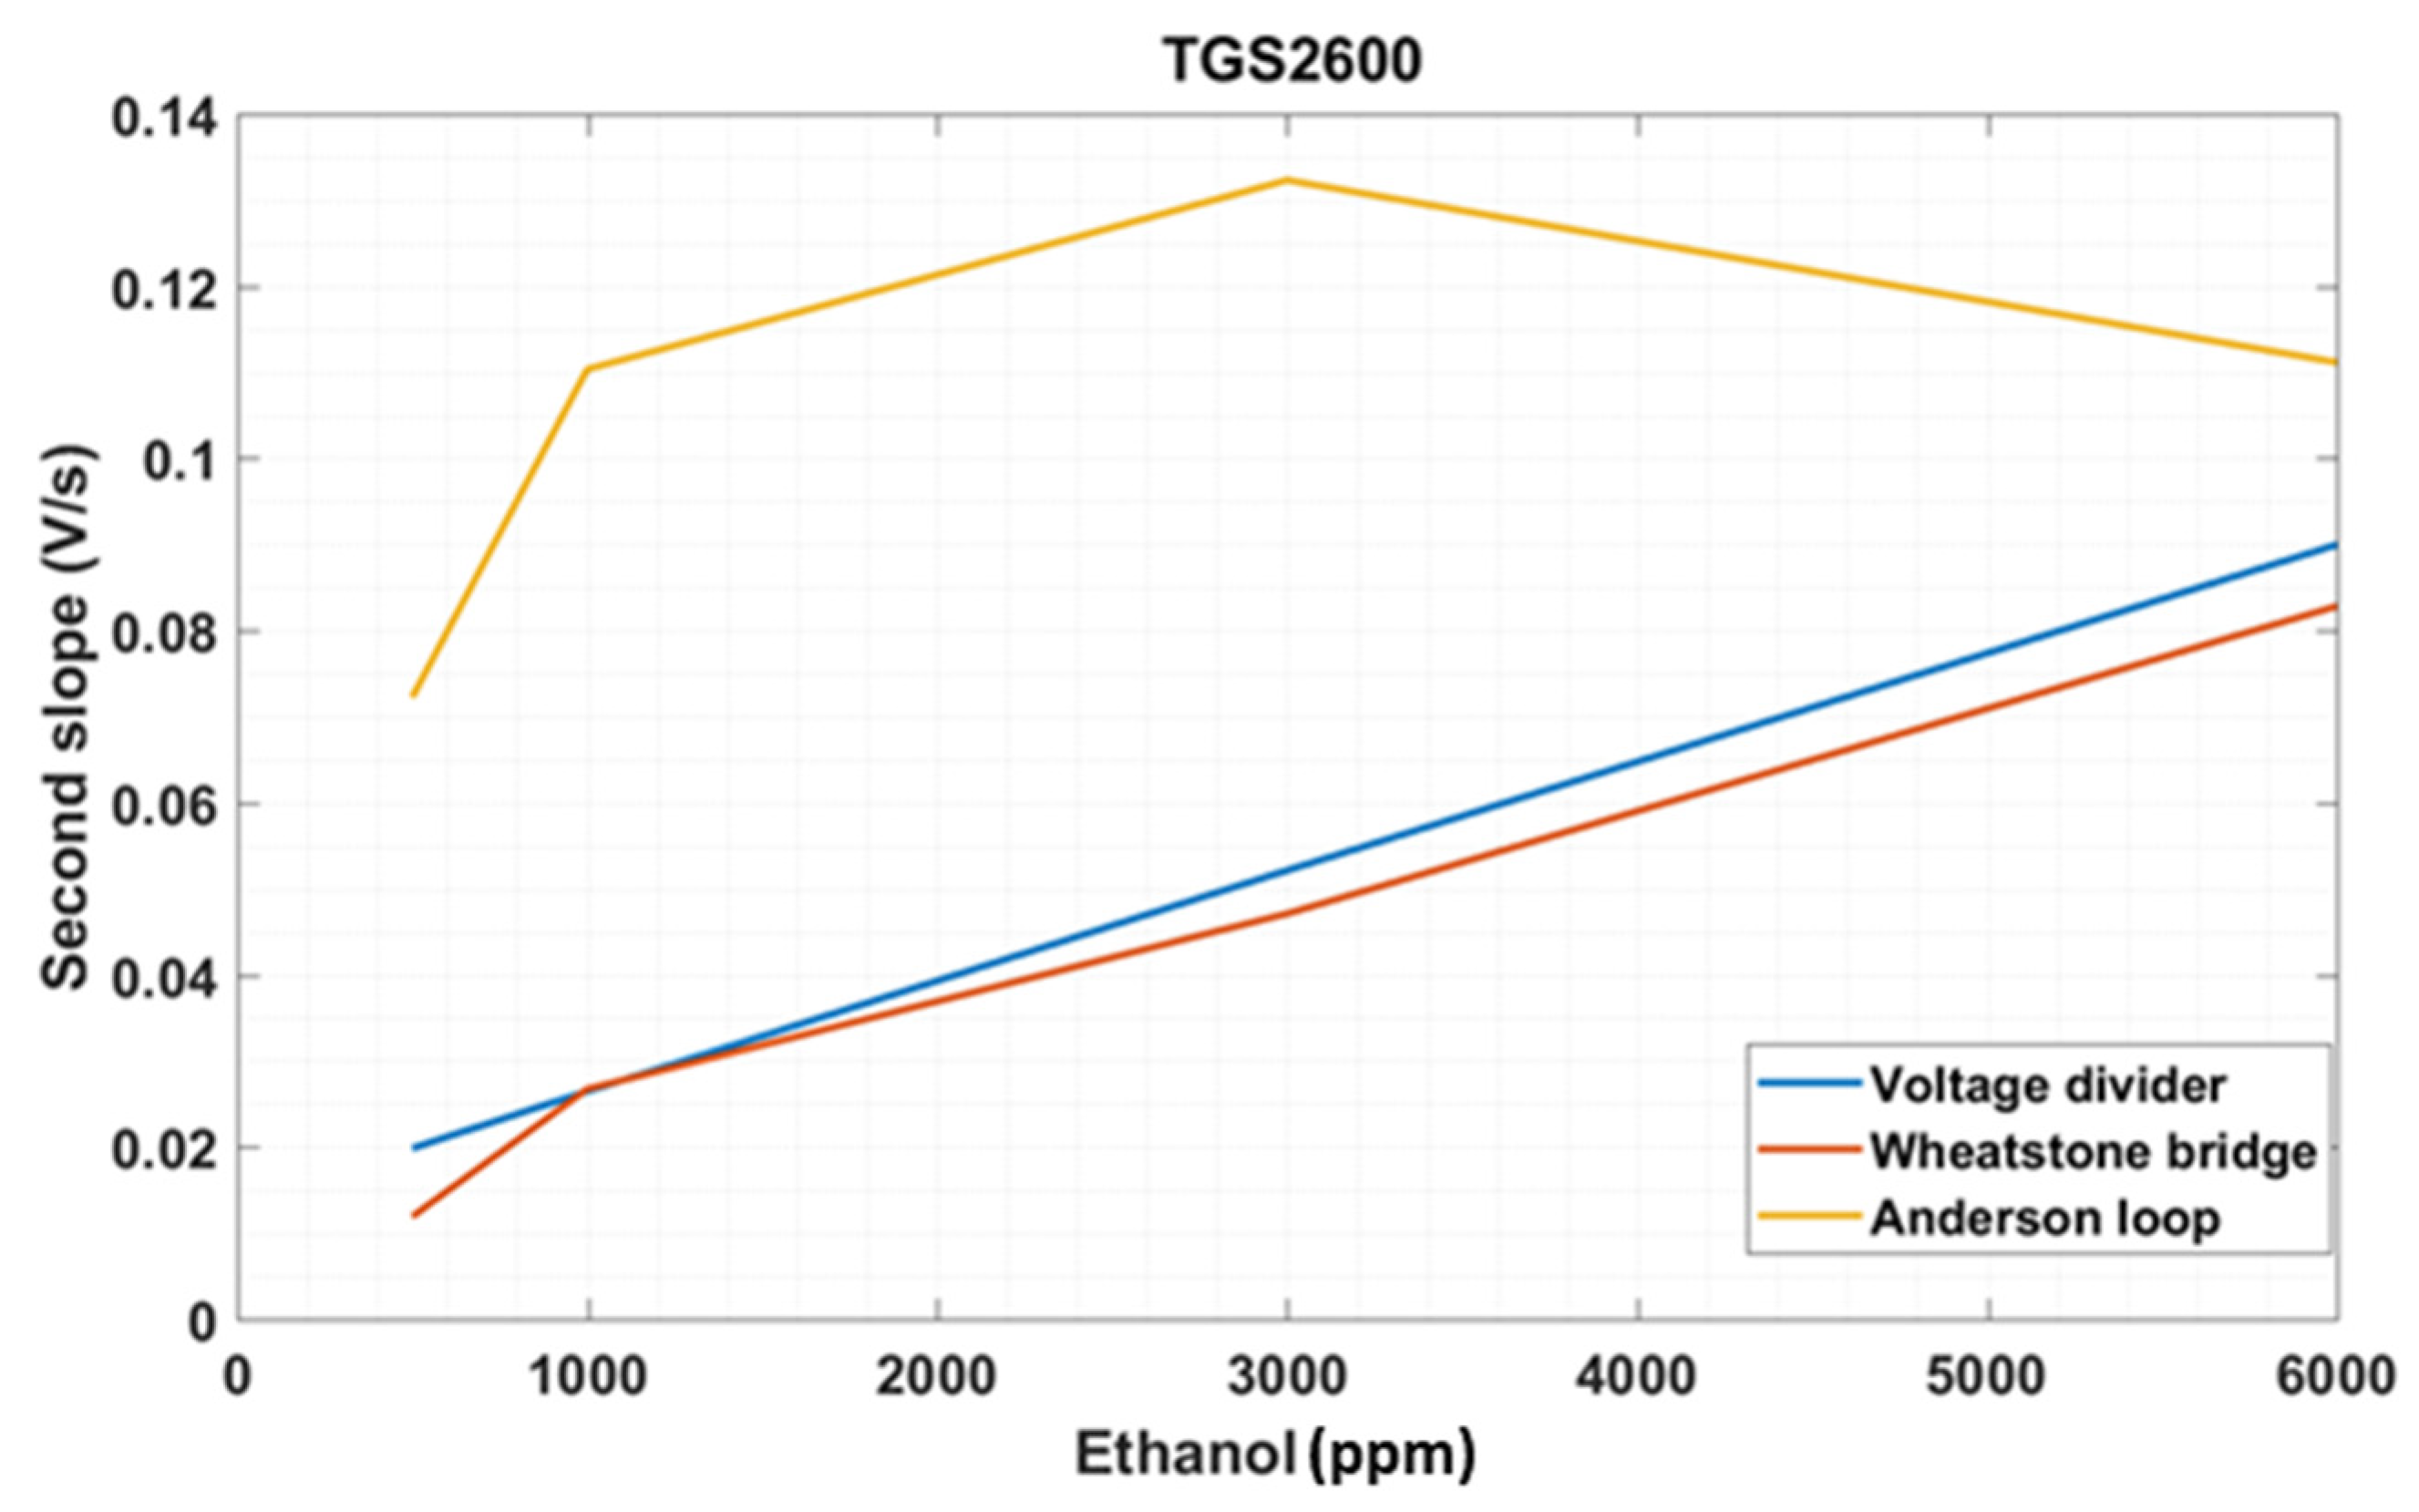
Another characteristic of the output signal from the voltage divider, Wheatstone bridge, and Anderson loop designs is the rising edge modeled as two lines, as explained previously.
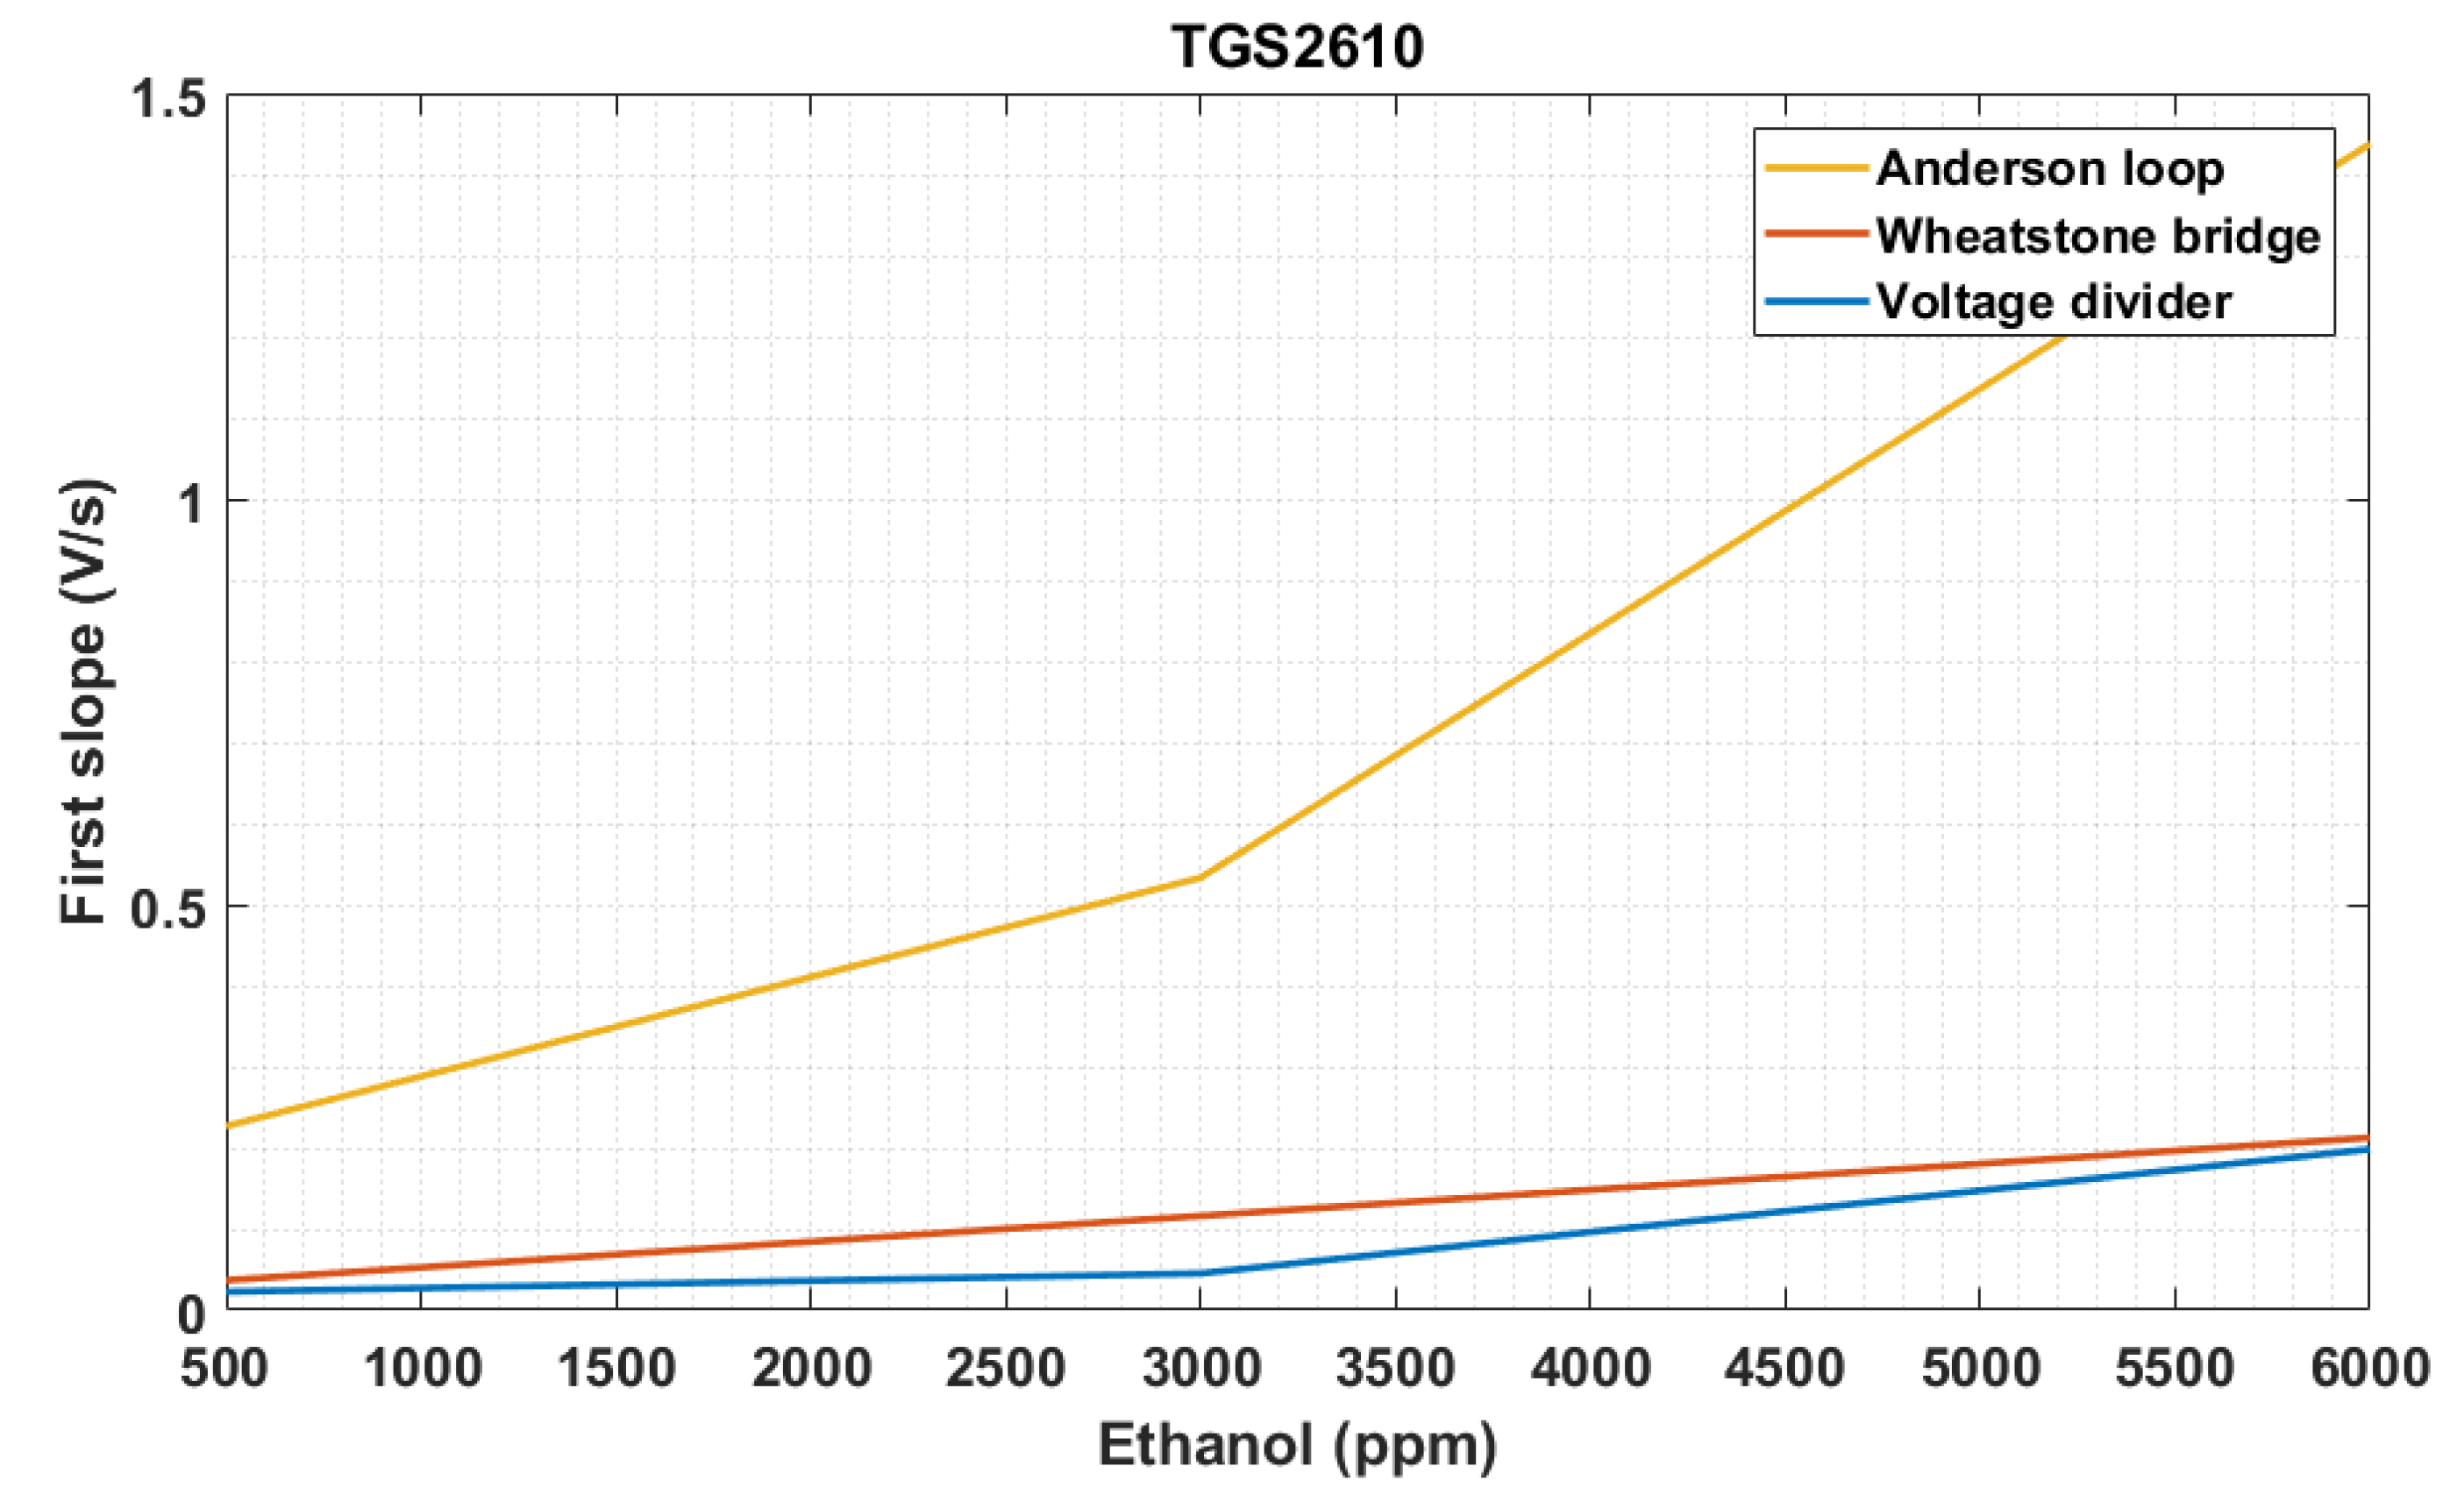
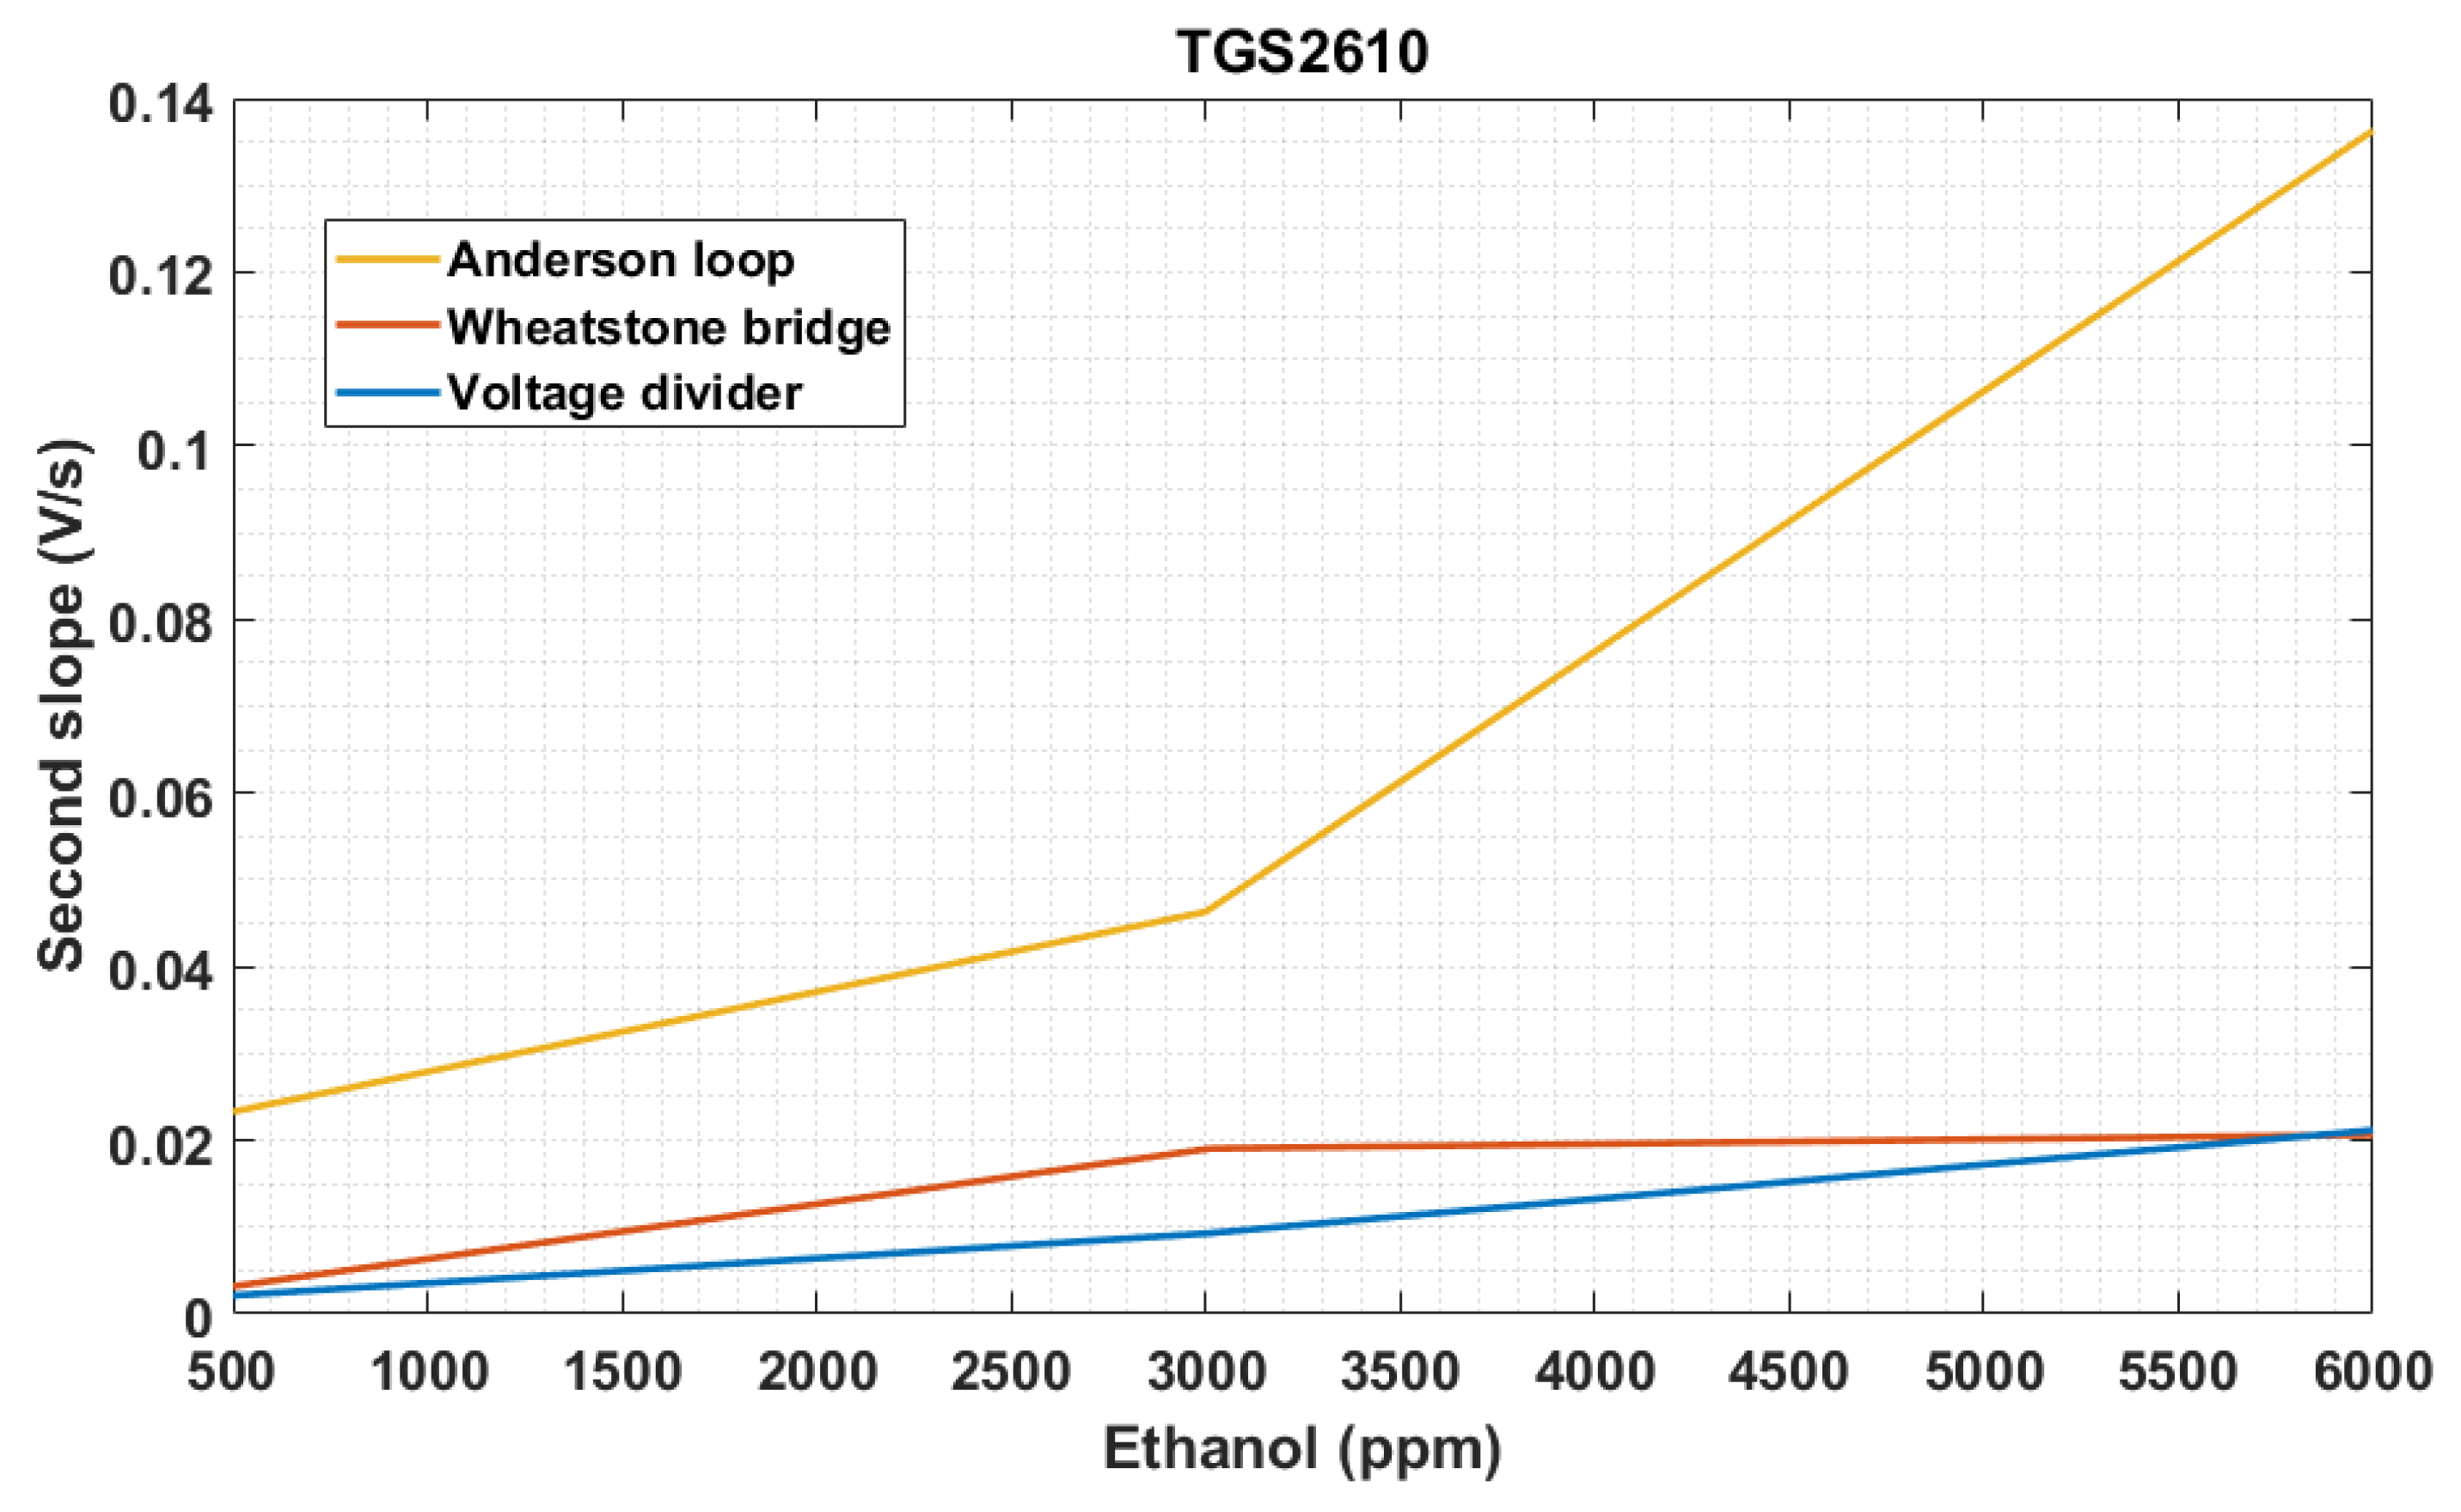
Figure 13 and
Figure 14 proves that the value of the first slope can be used to know the ethanol concentration in the air in the three designs. The second slope can only be used for the voltage divider and for Wheatstone bridge designs, but not for the others because of the lack of monotonicity.
The last characteristic considered is the power consumption of each design. The power consumed by the Wheatstone bridge and voltage divider is very small and similar in our circuits because of our experimental setup: both designs share components in the same Printed Circuit Board (PCB). Moreover, it had the lowest power consumption of all the designs, 2.28 mW maximum by voltage divider and 4.56 mW maximum by Wheatstone bridge. Others designs have active electronics, and this increases the power consumption. In the Anderson loop, the current source, this design has the higher power consumption (114.91 mW at most), but it allows to use the same current for some sensors in array configuration,
Table 1. The consumption of the resistive-to-frequency design is in a middle point (41.85 mW).
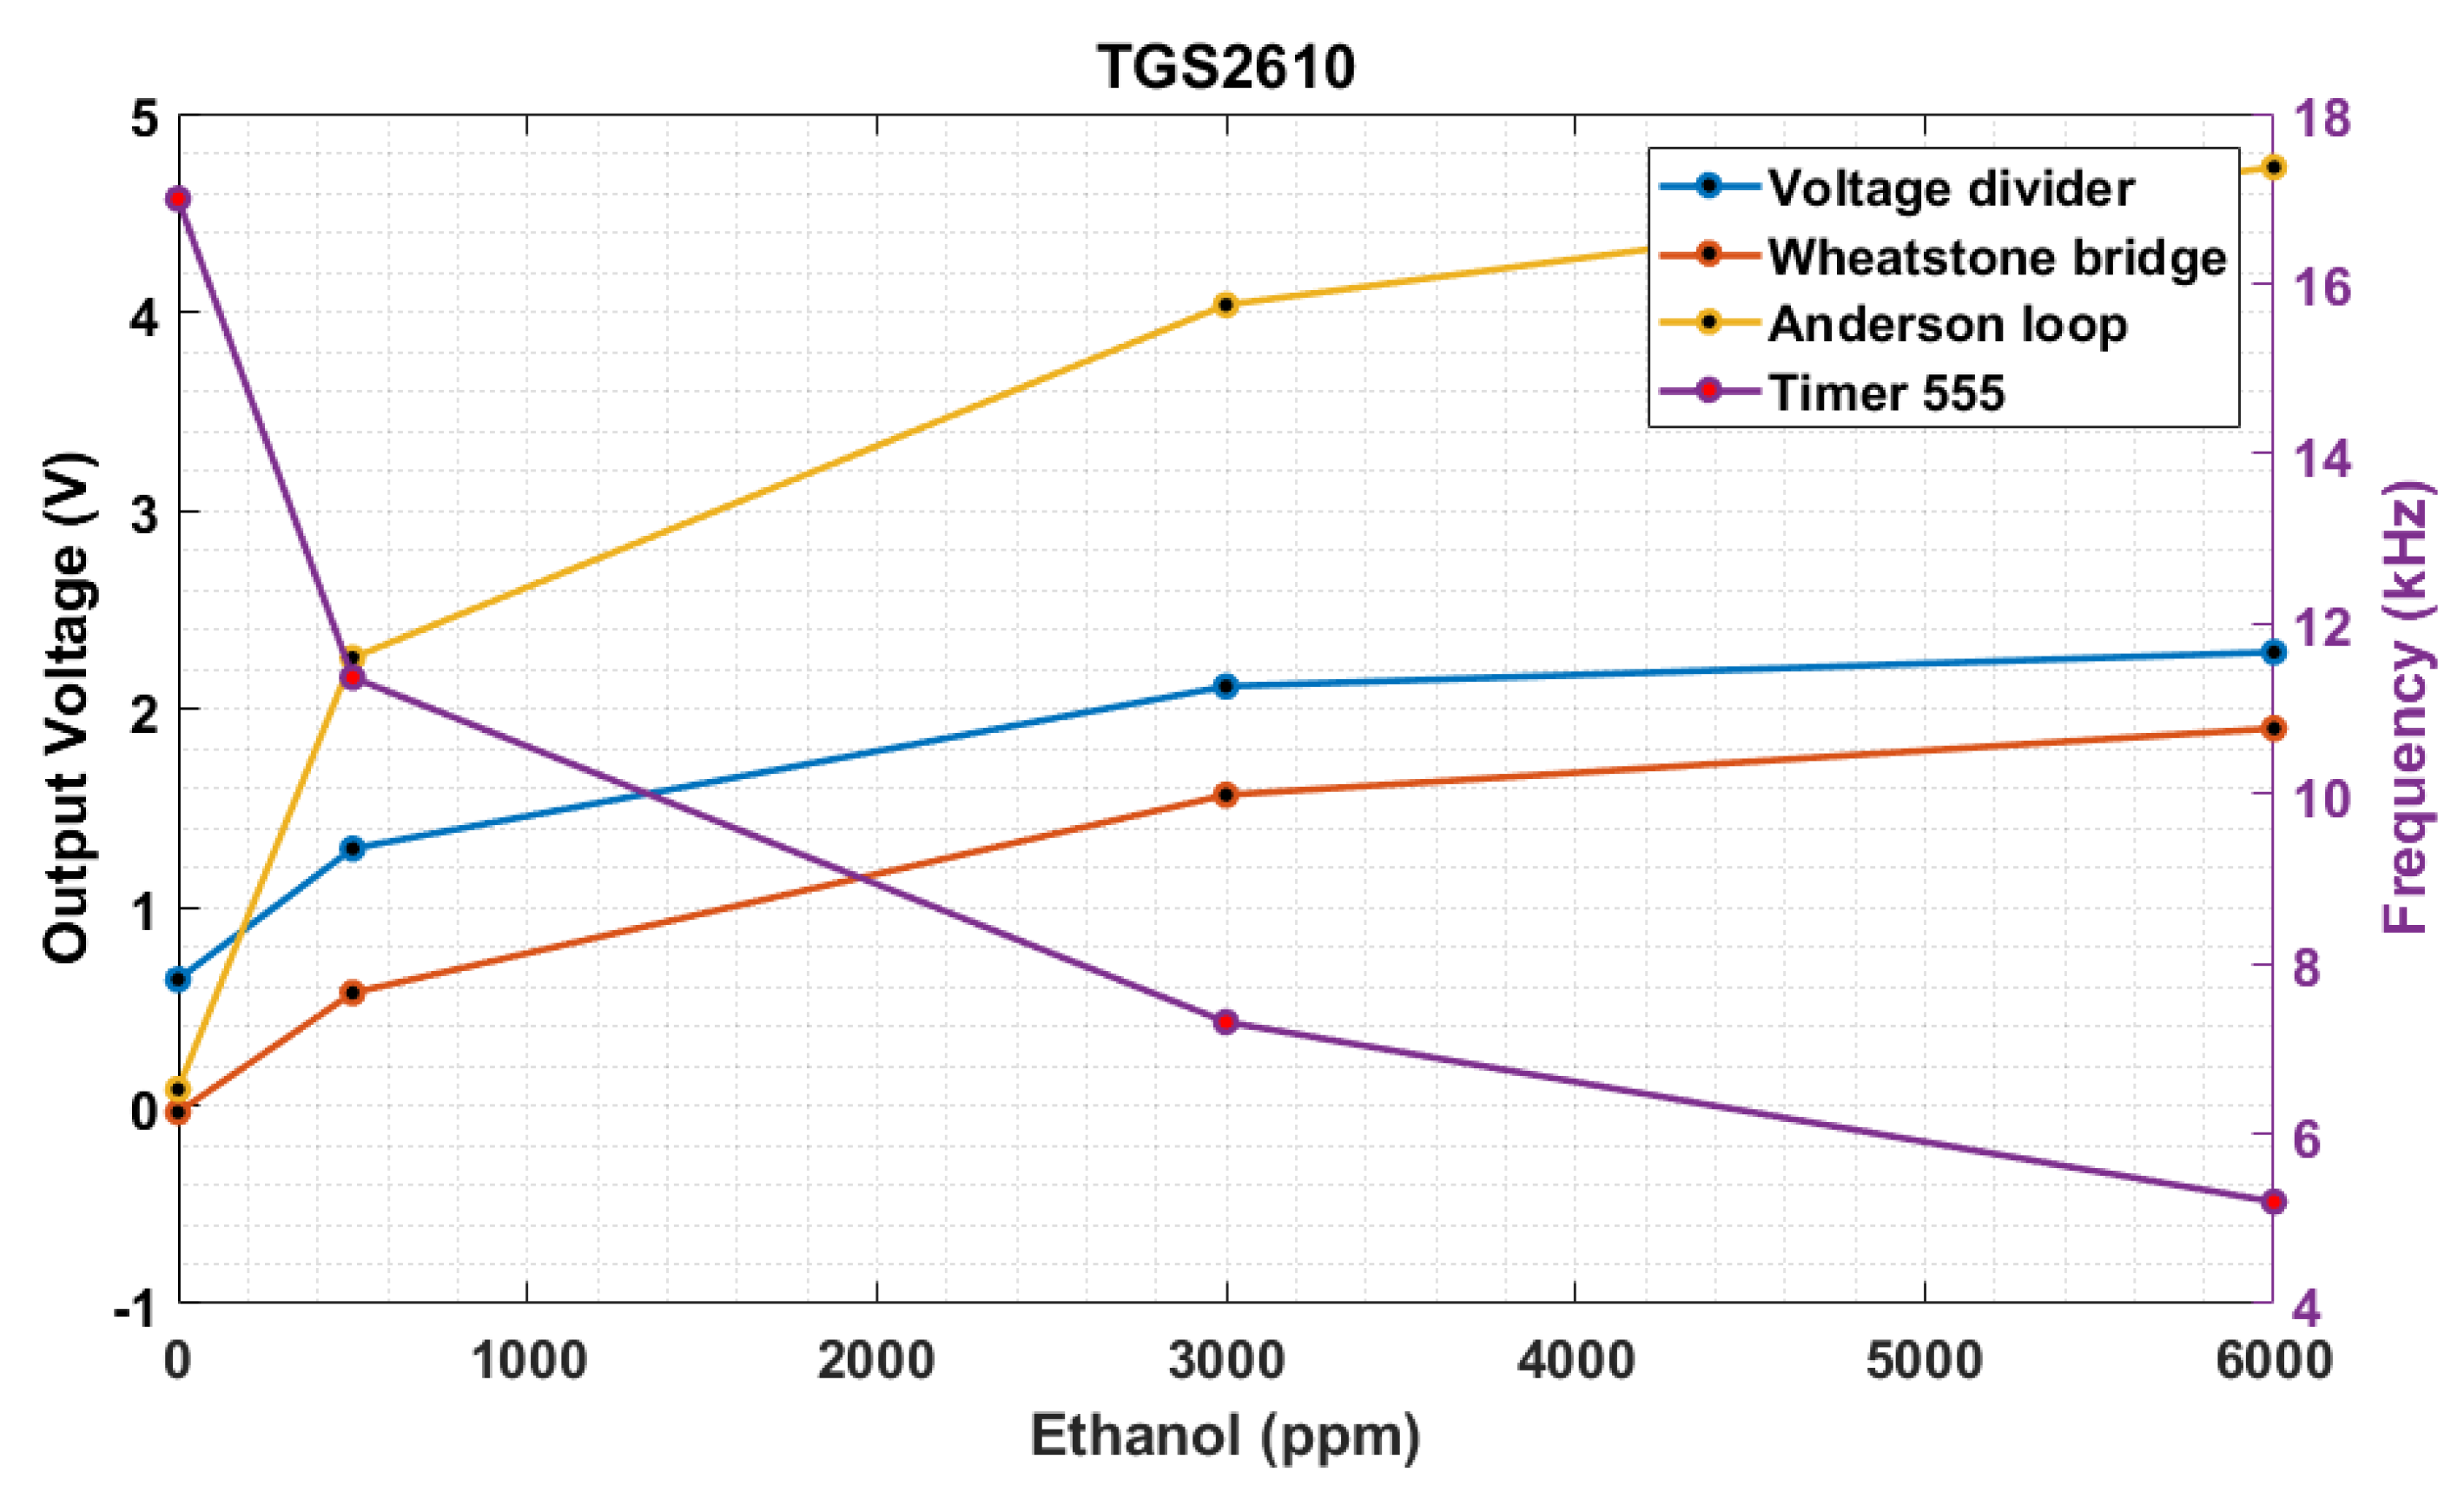
Results were repeated for the sensor TGS2610 and results similar to sensor TGS2600 were obtained, as
Figure 15,
Figure 16 and
Figure 17 show that.
The acquisition system behavior does not depend on the gas used in the measure, but it only depends on the electronic used (sensors, operational amplifiers, among others). For this reason, measuring other gases is not relevant from the point of view of the electronic conditioning, only the sensor, and it does not affect the results.
Finally, an equation, which models the behavior of each measurement system, is found (
Figure S6 and S7 in the Supplementary Materials). The method to obtain this is a fitting process by using functions fit() and fittype() in MATLAB; it was tested a polynomic, logarithmic and exponential fitting with different orders. After different combinations, the best results were obtained by using a polynomic division, with the coefficient of determination (R-Squared) shown in
Table 2. This fact confirms that all systems analyzed in this paper can be used to measure different concentrations of ethanol in the air. These models follow two types of equations:
Whether the output voltage changes linearly with respect to the sensor resistance (Anderson loop and Converter resistance-to-frequency when the sensor resistance is under 40 kΩ [when TGS2610 is used]), their model has an equation such as Equation (1).
However, if the system has not these characteristics (voltage divider and Wheatstone bridge), their equations correspond to (2).
The coefficients px and qx for each equation are shown in
Table 3.
4. Conclusions
Each circuit has benefits and drawbacks that the designer should consider. The voltage divider is the topology with less power consumption, and the noise is small enough to obtain good results. This makes this topology the best option to implement in a portable device. Furthermore, as it does not need the rising edge but only the voltage level, the frequency sampling can be much lower. The Wheatstone bridge is very difficult to implement using this type of sensor due to the big sensors’ nominal resistance variability. For this reason, this topology is not recommended. The Anderson loop has some strengths: the output voltage linearly depends on the resistance sensor; and in case of the design presented in this paper, the resistance range is quite high, from 10 kΩ up to 90 kΩ, which makes it useful for these sensors and others with lower ranges; and finally, it can be easily redesigned to have more than one sensor. However, this design has the higher power consumption, and it needs at least two different voltage sources. For this reason this topology is only recommended when the system is permanently connected to the power source, or for sensor arrays. The last topology presented is GIC-based. This is recommended when the voltage output cannot be measured with a good ADC because it provides a digital output which can be measured easily using a timer/counter.
