Article

A Machine Learning and Integration Based Architecture for Cognitive Disorder Detection Used for Early Autism Screening

1
Lucentia Research Group, Department of Software and Computing Systems, University of Alicante, 03690 Alicante, Spain
2
Lucentia Research Group, Department of Computer Science Technology and Computation, University of Alicante, 03690 Alicante, Spain
3
Department of Information Technology, Mehr Alborz University, 1413913141 Tehran, Iran
4
U.I. for Computer Research; 03690 Alicante, Spain
5
School of ECE, University of Tehran, 14395-515 Tehran, Iran
*
Author to whom correspondence should be addressed.
Electronics 2020, 9(3), 516; https://doi.org/10.3390/electronics9030516
Submission received: 31 January 2020 / Revised: 15 March 2020 / Accepted: 19 March 2020 / Published: 21 March 2020

Abstract

:
About 15% of the world’s population suffers from some form of disability. In developed countries, about 1.5% of children are diagnosed with autism. Autism is a developmental disorder distinguished mainly by impairments in social interaction and communication and by restricted and repetitive behavior. Since the cause of autism is still unknown, there have been many studies focused on screening for autism based on behavioral features. Thus, the main purpose of this paper is to present an architecture focused on data integration and analytics, allowing the distributed processing of input data. Furthermore, the proposed architecture allows the identification of relevant features as well as of hidden correlations among parameters. To this end, we propose a methodology able to integrate diverse data sources, even data that are collected separately. This methodology increases the data variety which can lead to the identification of more correlations between diverse parameters. We conclude the paper with a case study that used autism data in order to validate our proposed architecture, which showed very promising results.

1. Introduction

According to the World Bank [1], 1 billion people, or 15% of the world’s population, experience some form of disability, with a higher prevalence in developing countries. For instance, specific cognitive disorders like Autistic Spectrum Disorder (ASD) are seen among people of all ages. Autism is a developmental disorder distinguished mainly by impairments in social interaction and communication and/or by restricted and repetitive behaviors. In the developed countries, about 1.5% of children are diagnosed with ASD as of 2017 [2].
The broader goal of health systems is to tailor care plans to address the needs of individuals with disabilities, and to improve their quality of life and allow them to be integral parts of their society. Machine learning has shown great potential to help toward this broader goal. Consequently, there are many machine learning or data mining studies in the brain health area (e.g., the work of Kessler et al. [3]) that have tested the use of machine learning algorithms to predict the persistence and severity of major depressive disorder. This research is useful because the heterogeneity of the major depressive disorder (MDD) illness course complicates clinical decision-making. Chekroud et al. [4] proposed a machine learning approach for prediction of treatment outcomes in depression. The authors identified 25 variables that were the most predictive of treatment outcome from 164 patient-reportable variables, and used these to train their model. Torous et al. [5] introduced and explored numerous analytical methods and techniques from the computational sciences field to apply to psychiatric data collected using smartphones; these data can better realize the potential of mobile mental health and empower both patients and providers with novel clinical tools. Mohr et al. [6] presented a review of the state of research on behavioral intervention technologies in mental health and an identification of the top research priorities. The authors concluded that improvements in the collection, storage, analysis, and visualization of big data are urgently required.
Our goal has also been to learn from and disseminate research and best practices to help address this broader goal. Specifically, the authors previously used machine learning methods in the health area to diagnose and model urological dysfunctions [7,8,9], predict seminal quality factors [10,11], and classify central and peripheral nerve fibers [12].
The core motivation of this study was to propose an architecture able to integrate diverse and heterogeneous data sources, since these data are very often collected separately, increasing the variety in order to extract relevant information. We focused on ASD and, subsequently, studied different data related to this disorder. The main objective of this work was to advance and explain some of the hidden relationships among all the parameters, as there are many factors involved in the diagnosis of ASD. One of the main difficulties in this ongoing project has been the data collection. There are few recently developed tools that are currently in use by therapists to overcome this complexity.
For testing purposes, the proposed architecture was validated in a case study with the dataset obtained from the Machine Learning Repository related to the autism screening of children, adolescents, and adults (http://archive.ics.uci.edu/ml/datasets/Autism+Screening+Adult, visited on 2 December, 2019), achieving very promising results. We used three datasets: (1) ASD screening data for adults, (2) ASD screening data for adolescents, and (3) ASD screening data for children, which encompassed 20 features related to ASD. These features were utilized in our analysis to detect relevant characteristics and to improve the diagnosis of ASD.
The main contributions of this paper are as follows.
  • Proposing an architecture focused on integration of different heterogeneous data and data analytics. Ontologies are used to integrate the different data sources.
  • The proposed architecture allows distributed processing of the data.
  • Our approach was tested on ASD data, producing satisfactory results.
  • In the experimentation, correlation between different features and the identification of relevant features relating to ASD was carried out.
The rest of the paper is organized as follows: Section 2 describes the previous work of data mining in the heath area, and especially in mental diagnosis; Section 3 describes the proposal of this paper; Section 4 describes the experiments carried out; and finally, Section 5 presents the relevant conclusions and suggests future work.

2. Previous Work

Previously, several biomedical studies have used different data mining algorithms for classification, clustering, and association. Yoo et al. [13] conducted a survey about the use of data mining algorithms in healthcare and biomedicine, suggesting guidelines on how to use these algorithms; the authors concluded with three examples of how data mining can be used in the healthcare industry. Investigating whether Twitter could be used as a data mining resource, which could help address challenges related to promoting public awareness of a given disorder by enhancing engagement with affected individuals and their careers, was the goal of Beykikhoshk et al. [14]. The advantage of Twitter is that it can provide a large dataset of harvested tweets which may be used in subsequent experiments. Some experiments examining a range of linguistic and semantic aspects of messages posted by individuals interested in ASD were introduced in this work. The application of several data mining methods for identification of the most significant genes and gene sequences in a dataset of gene expression microarrays is demonstrated in a paper presented by Latkowski and Osowski [15]. Bellazzi et al. [16] addressed the challenge of exploring predictive data mining in clinical medicine and how to deal with learning models for predicting patient health. These models can be very useful for supporting physicians in diagnostic, therapeutic, or monitoring tasks.
Wall et al. [17] used machine learning to shorten the observation-based screening and diagnosis of autism. Specifically, they applied various machine learning algorithms to analyze the complete set of marks from the Autism Diagnostic Observation Schedule—Generic (ADOS), which is one of the most widely used tools for the assessment of the ASD behavior. The ADOS tool was also used by Kosmicki et al. in a study focused on the detection of autism-related behaviors through feature-selection-based machine learning [18]. Their emphasis was on the importance of developing precise procedures to detect risk faster than the current standards of care. The causal effects of one brain region on another (effective connectivity, considered to be an explanatory model for autism) in an fMRI study of the theory-of-mind (ToM) in 15 high-functioning adolescents and adults with autism and 15 typically developing control participants were assessed by Deshpande et al. [19]. The authors applied machine learning classifiers to determine the accuracy with which the classifier could predict a novel participant’s group membership (autism or control). The findings of this study collectively indicated that alterations in causal connectivity in the brain in ASD could serve as a potential non-invasive neuroimaging signature for autism. The work of Bone et al. [20] not only addressed the challenges of using machine learning in this context, but also criticized works that were lacking in objectivity. They pointed out that machine learning has immense potential to enhance diagnostic and intervention research in the behavioral sciences, and especially in research involving the highly prevalent and heterogeneous diagnosis of ASD. The authors proposed best practices when using machine learning in autism research. Furthermore, they highlighted a few especially promising areas for collaborative work between the computational and behavioral sciences.
Given the importance of early ASD identification, several works have analyzed the main features involved in the disease. Rosenber et al. [21] analyzed individual and family-based features, as well as several geographic factors. Rotholz et al. stated in their work that they used a two-tiered screening process with enhanced quality assessment, interagency policy collaboration, and coordination [22]. Daniels and Mandell published an overview of the major factors of ASD diagnosis, including age [23]. Finally, the possible delays in ASD identification were also analyzed by Zuckerman et al. [24]. They assessed differences between child age at first parental concern and age at first parental discussion of concerns with a health care provider among children with ASD vs. those with intellectual disability/developmental delay (ID/DD). They studied whether a provider’s response to parental concerns was associated with delays in ASD diagnosis.
After analyzing the state of the art, we concluded that despite the existence of different proposals for the identification of relevant characteristics of ASD, our proposal is the first to allow (1) integration of data from various heterogeneous sources, (2) data analysis, (3) distributed processing, and (4) identification of relevant features and their possible correlations.

3. The Proposed Architecture

The variety of input data used for neurological disorder screening make such screenings very hard and complex. In particular, the aim of this work was to be able to integrate data from many diverse sources, such as medical or intervention centers, hospitals, and academic centers with help/support. For this reason, our architecture is designed to support all this variety, focusing on crucial functions such as integrity and feature reduction.
In Figure 1a, a plain and classical method for ASD screening is shown. The proposed approach, which is divided into five steps, is shown in Figure 1b.
The phases of our proposed architecture can be summarized as follows.
(1)
ASD tests (data collection):
The first step is to collect data from every source, including manual observations/evaluations by experts. It is common for data to be generated in many diverse centers and areas, such as medical or intervention centers, hospitals, and academic centers with help/support. However, it is also common for the data to be stored separately, and they are not always processed or analyzed. This was one the main objectives of this work: to be able to gather data from many diverse data sources and incorporate them into a unique database in order to apply the same preprocessing techniques to the whole dataset.
(2)
Raw data (data warehousing):
Once data are collected, they are stored. Nowadays, there are many choices regarding data storage. Essentially, depending on the taxonomy, variety, and volume of the data, diverse options can be explored in the era of big data, such as cloud data and lake data [25,26].
(3)
Data transformation:
It is typical to identify this phase, which is also known as data preprocessing, as the most time-consuming task. This task can easily be divided into several subtasks, such as normalization, feature reduction, and integration. All of them are complex and, in this paper, we focused on the integration and feature reduction subtasks. In addition, the difficulty of each of these subtasks depends on the taxonomy of the data.
In our proposal, ontologies were chosen as an integrator mechanism for all data sources. Ontologies offer a formal model of concepts of interest (classes), features and attributes of each concept (properties), and property restrictions, involving a specific knowledge domain in the real world [27,28]. We used ontologies with the aim of integrating data from different sources that express the same concept. For example, the words “gender” and “sex” might appear as features in different datasets to be analyzed. These features represent the same concept (synonyms) and, therefore, this information can be integrated.
We used the following methodology consisted of three stages:
  • Ontology-based semantic tagging of different data sources. The objective of this task was to identify the semantic concept of each field of the source databases in order to subsequently integrate them. All the database attributes were searched in the domain ontology, thus obtaining their semantic concepts. If a concept had different semantic types, word sense disambiguation (WSD) [29,30] techniques were applied to obtain a unique semantic type.
  • Core ontology selection. Different data sources have their own ontologies or semantic resources (domain ontologies). The information from each source was semantically enriched/associated with the information extracted from its specific domain ontology. The core ontology was defined as a Knowledge Base (KB). This ontology was used when the integration of all information was carried out.
  • Ontology mapping. To accomplish the integration, data sources were described in terms of the core ontology via equivalent concepts and relations (ontology mapping) between the core ontology and the specialized domain ontologies of different sources. Peral et al. [31] used a similar approach to carry out the integration of heterogeneous data applied to telemedicine systems.
For instance, let us suppose that we have two databases related to a specific disease, such as diabetes or hepatitis, tagged with two different domain ontologies or resources, e.g., Cyc [32] and the Unified Medical Language System (UMLS) [33] (Stage 1 of the methodology). Furthermore, there are two attributes related to “race” in the two datasets. In the first one, the attribute “ethnicity” was tagged with the Cyc concept #$EthnicGroupType, whereas in the second dataset, the attribute “race” was tagged with the concept unique identifier (CUI) C17049 and the semantic type unique identifier (TUI) T098 (Population Group).
In Stage 2, the core ontology was selected. In our approach, we used the lexical resource WordNet [34] as the core ontology, as explained in Section 4. Finally, these concepts were mapped to the core ontology (Stage 3) using an ontology-mapping strategy, as explained in Section 4. In our example, both of these concepts would be tagged with the WordNet synset “{07984596} <noun.group> race#3 (people who are believed to belong to the same genetic stock)”, establishing a synonymy relation between the concepts of the two datasets.
(4)
Application of Machine Learning (ML) techniques:
In the fourth phase, ML techniques were applied. There are many ML methods that could be used to obtain indicators of a target class, such as children with ASD. In the proposed architecture it is possible to carry out experiments using these diverse ML algorithms to obtain the precision measure for each algorithm. In this phase, we use the cross-validation method in order to divide the whole dataset into two subsets, training and test datasets. Using the test datasets, we were able to test the correctness, validity, and reliability of the model without overfitting the system.
(5)
Dashboard generation:
The purpose of creating a dashboard is to visualize data types according to specific purposes and needs [35]. Organizations use dashboards to manage an organization’s performance, providing an overall suite of applications such as strategy maps, balanced scorecards, and business intelligence, and to make information available for them in a specific format for decision-making [36]. One of the methods used to create dashboards is a graphical system called Tableau, which is used to perform temporary discovery and analysis of customer datasets [37]. In our approach, dashboards were used to discover the key indicators, correlations among data, hidden patterns, most important features (this may produce a feature reduction), detection, prediction, etc.
The main advantage of our proposed architecture is its ability to address the two main objectives of this work: (1) integration of data from several sources and (2) dimensionality reduction. In addition, it made it possible to highlight each of the phases separately. Furthermore, hybrid solutions may present themselves as new technological possibilities emerge. For example, there are many machine learning techniques. It is difficult to specify which one is the best one, and it usually depends on the taxonomy of the data. In such cases, it is useful to try different methods and compare the results, and often to create hybrid methods that combine the benefits of two or more methods.

4. Experiment—Case Study

The dataset used in our experiments were obtained from the Machine Learning Repository (http://archive.ics.uci.edu/ml/datasets/Autism+Screening+Adult, visited on 2 December, 2019). We made use of open data, specifically the three datasets “ASD screening data for adults”, “ASD screening data for adolescents”, and “ASD screening data for children”. These datasets, related to autism screening of adults, adolescents, and children, each contains 20 features that can be used for further analysis in determining influential autistic traits and improving the classification of autistic spectrum disorder (ASD) cases. Furthermore, in those datasets, 10 behavioral features (AQ-10) of individuals that have been proven to be effective in detecting ASD cases are recorded, together with 10 properties characterizing the individuals.
The whole list of these characteristics is shown in Table 1 with the information type, and the description of the attributes used to carry out the validation experiments of this section.
The choice to use these datasets for the validation of our proposed architecture was made because ASD screening represents a typical example of a situation where an IoT (Internet of Things) approach would be a natural and efficient way to obtain data. This could be easily carried out via small questionnaires that could be completed using any technological device, such as a tablet or mobile, favoring easy information collection.
We used the package Weka [38] to carry out the experiments. Weka is a machine learning package that allows the extensive use of several tools to make broad comparisons of different methods.
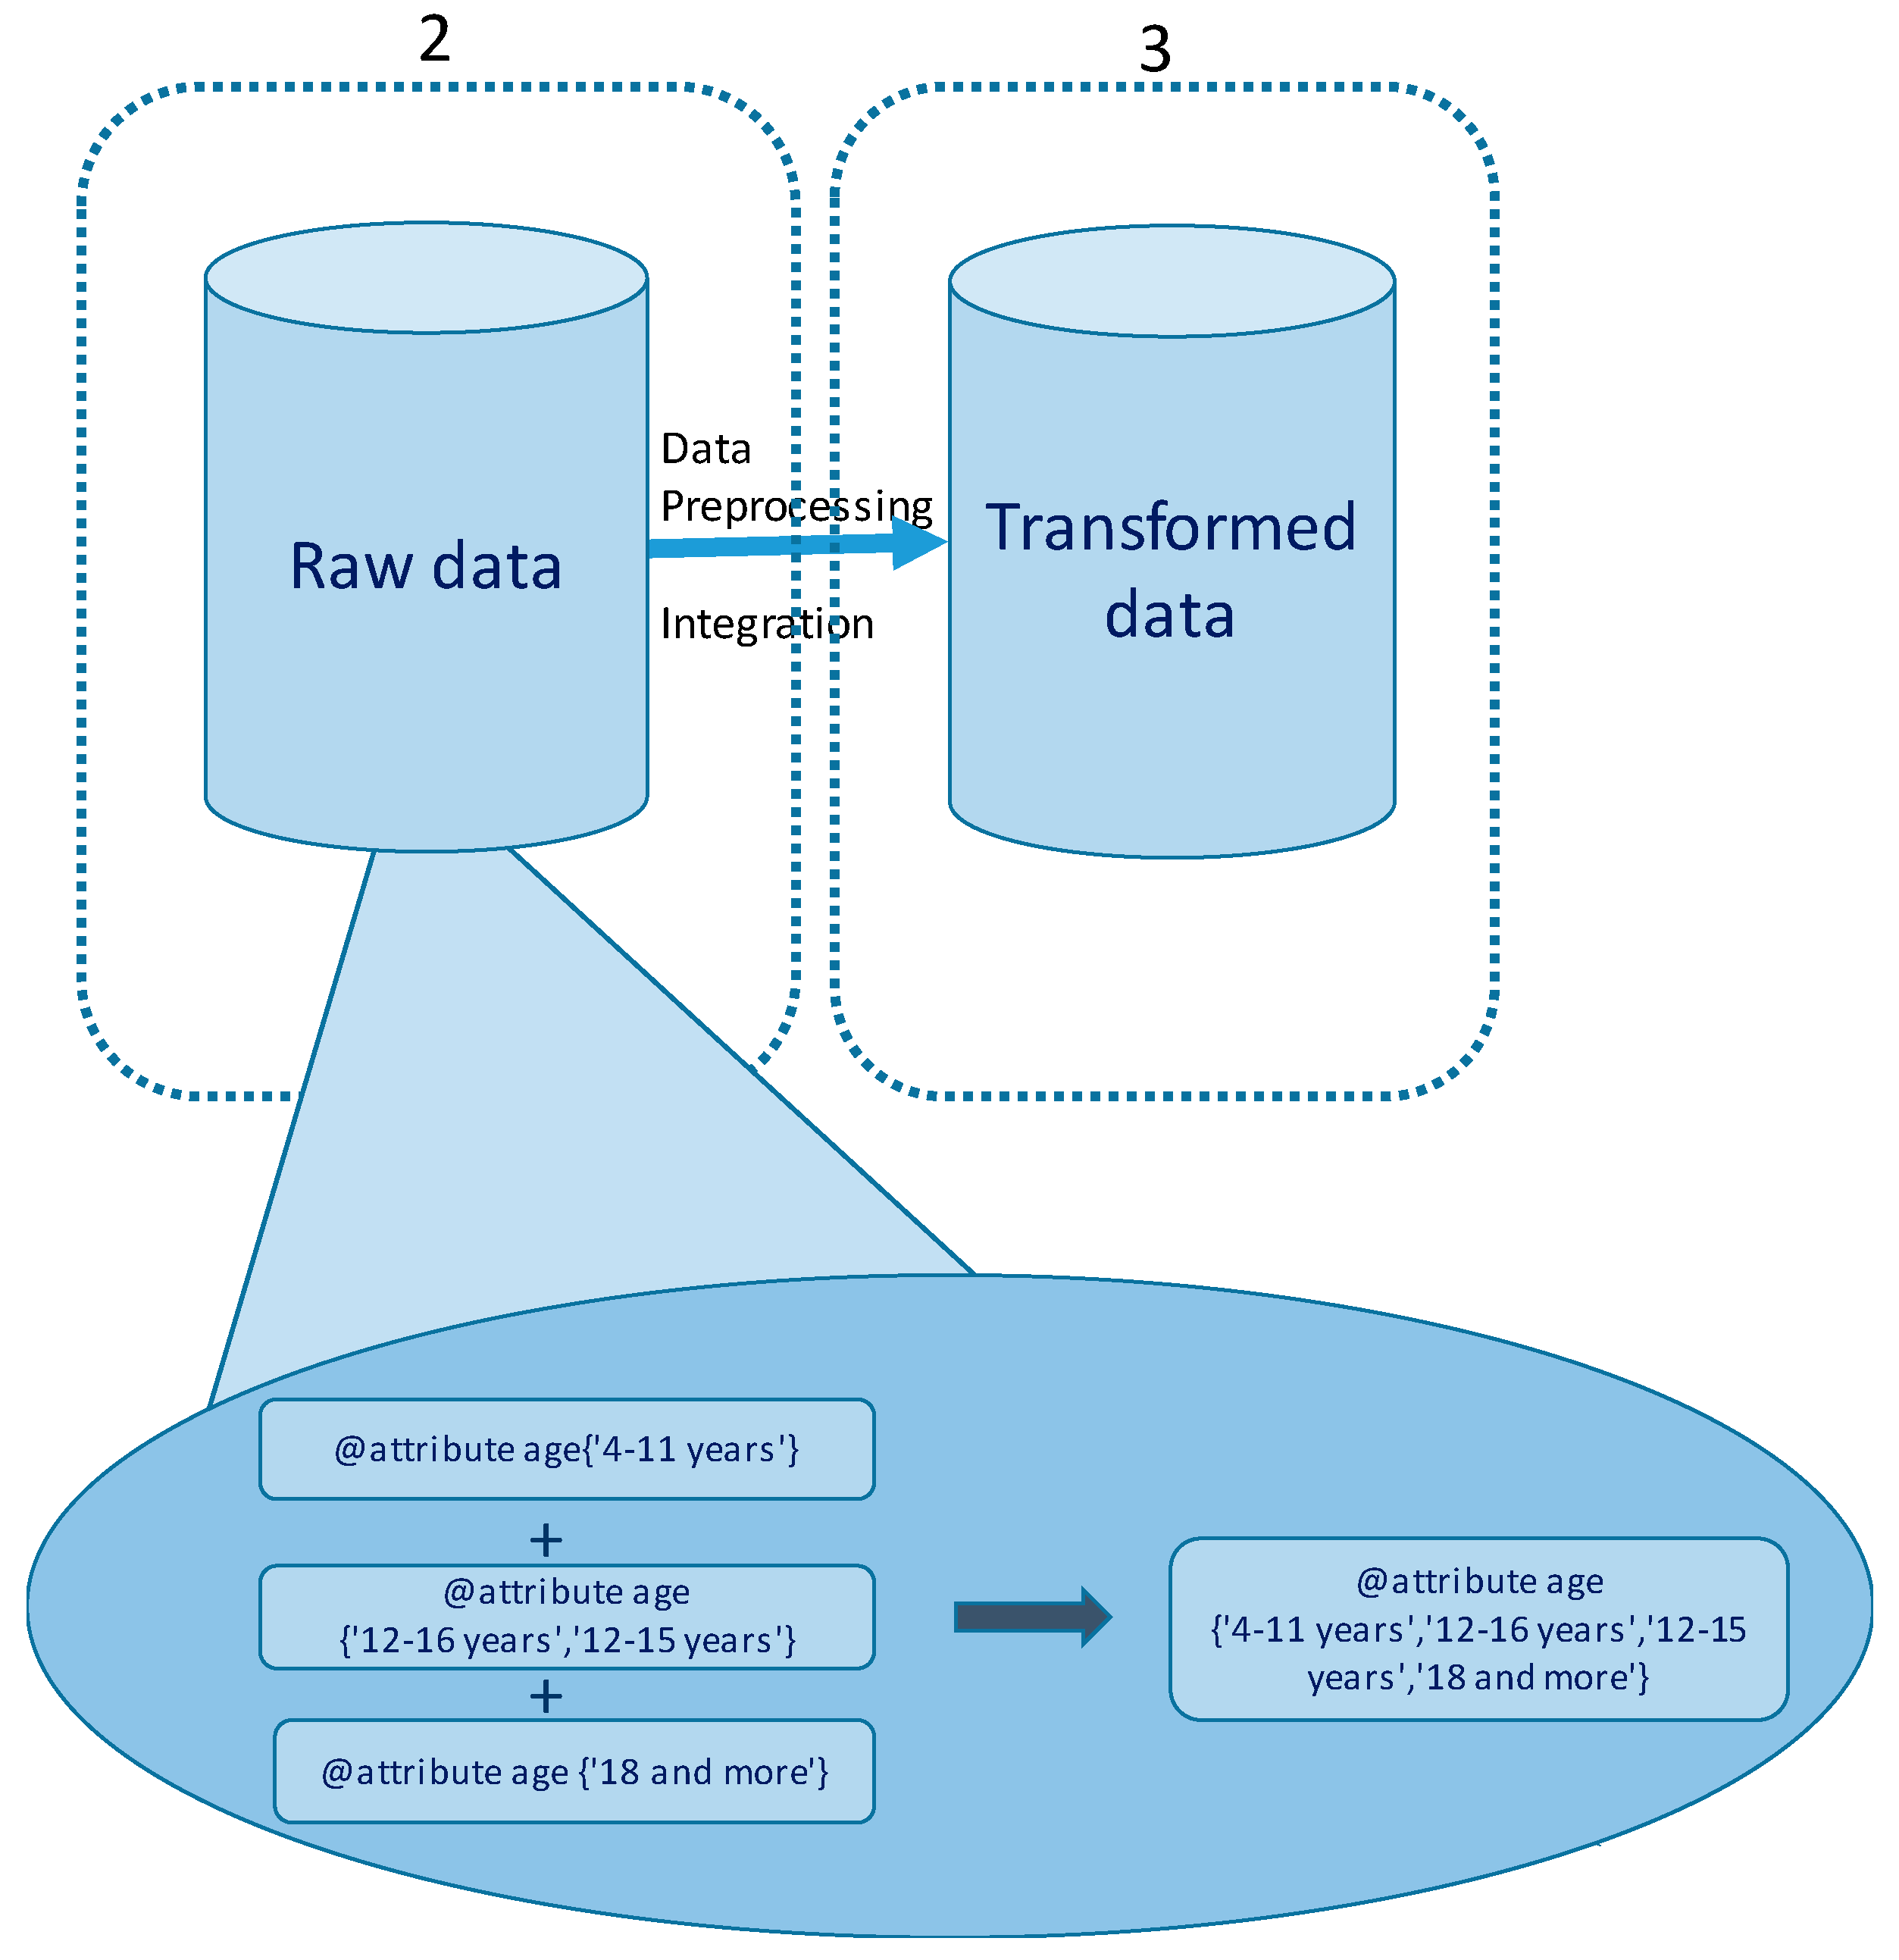
In Figure 2 the detail of one of the most complex aspects of Phase 3, i.e., the integration of the data, is shown. In our case study, this involves the integration of the three databases using a new variable. In this case study, a simple example was used to illustrate the complexity of the integration in which the procedure was carried out manually. However, in a real scenario, this would be carried out with complex and specific tools for integration and would require ontological measures.
In terms of data integration, with the objective of selecting a core ontology, we used the concept of Universal Ontology (UO) presented by Olivé [39]. By UO, Olivé means the formal specification of all the concepts that we use and share. This includes the concepts in general use, those that are particular to the existing disciplines, and those specific to any kind of human or organizational activity. A UO specifies the concepts that apply to objects, to their relationships, and to the actions or events involving those objects. In our proposal, the lexical resource WordNet was used as the core ontology. It provided a perfect basis to create the general level of UO. WordNet defines noun, verb, and adjective synsets that may be used as the source of the entity types and properties of UO.
Concerning the ontology mapping process between the specialized domain ontologies and the core ontology, there are two kinds of mapping: vertical and horizontal [39]. Vertical mappings define the correspondences between the domain ontology and the concepts at the general level (WordNet in our approach). Horizontal mappings define the correspondences between the domain ontology and the other ontologies at the domain level. In both types of mapping, a correspondence is a relationship between two concepts. In general, a correspondence can be an “equivalence” (the concepts are the same), an “IsA” (a concept is a subtype of the other), or a “disjointness” (no entity or property can be an instance of two concepts) [40]. In our approach, we proposed the use of STROMA (semantic refinement of ontology mappings) methodology [41] to determine both vertical and horizontal automatic semantic ontology mappings.
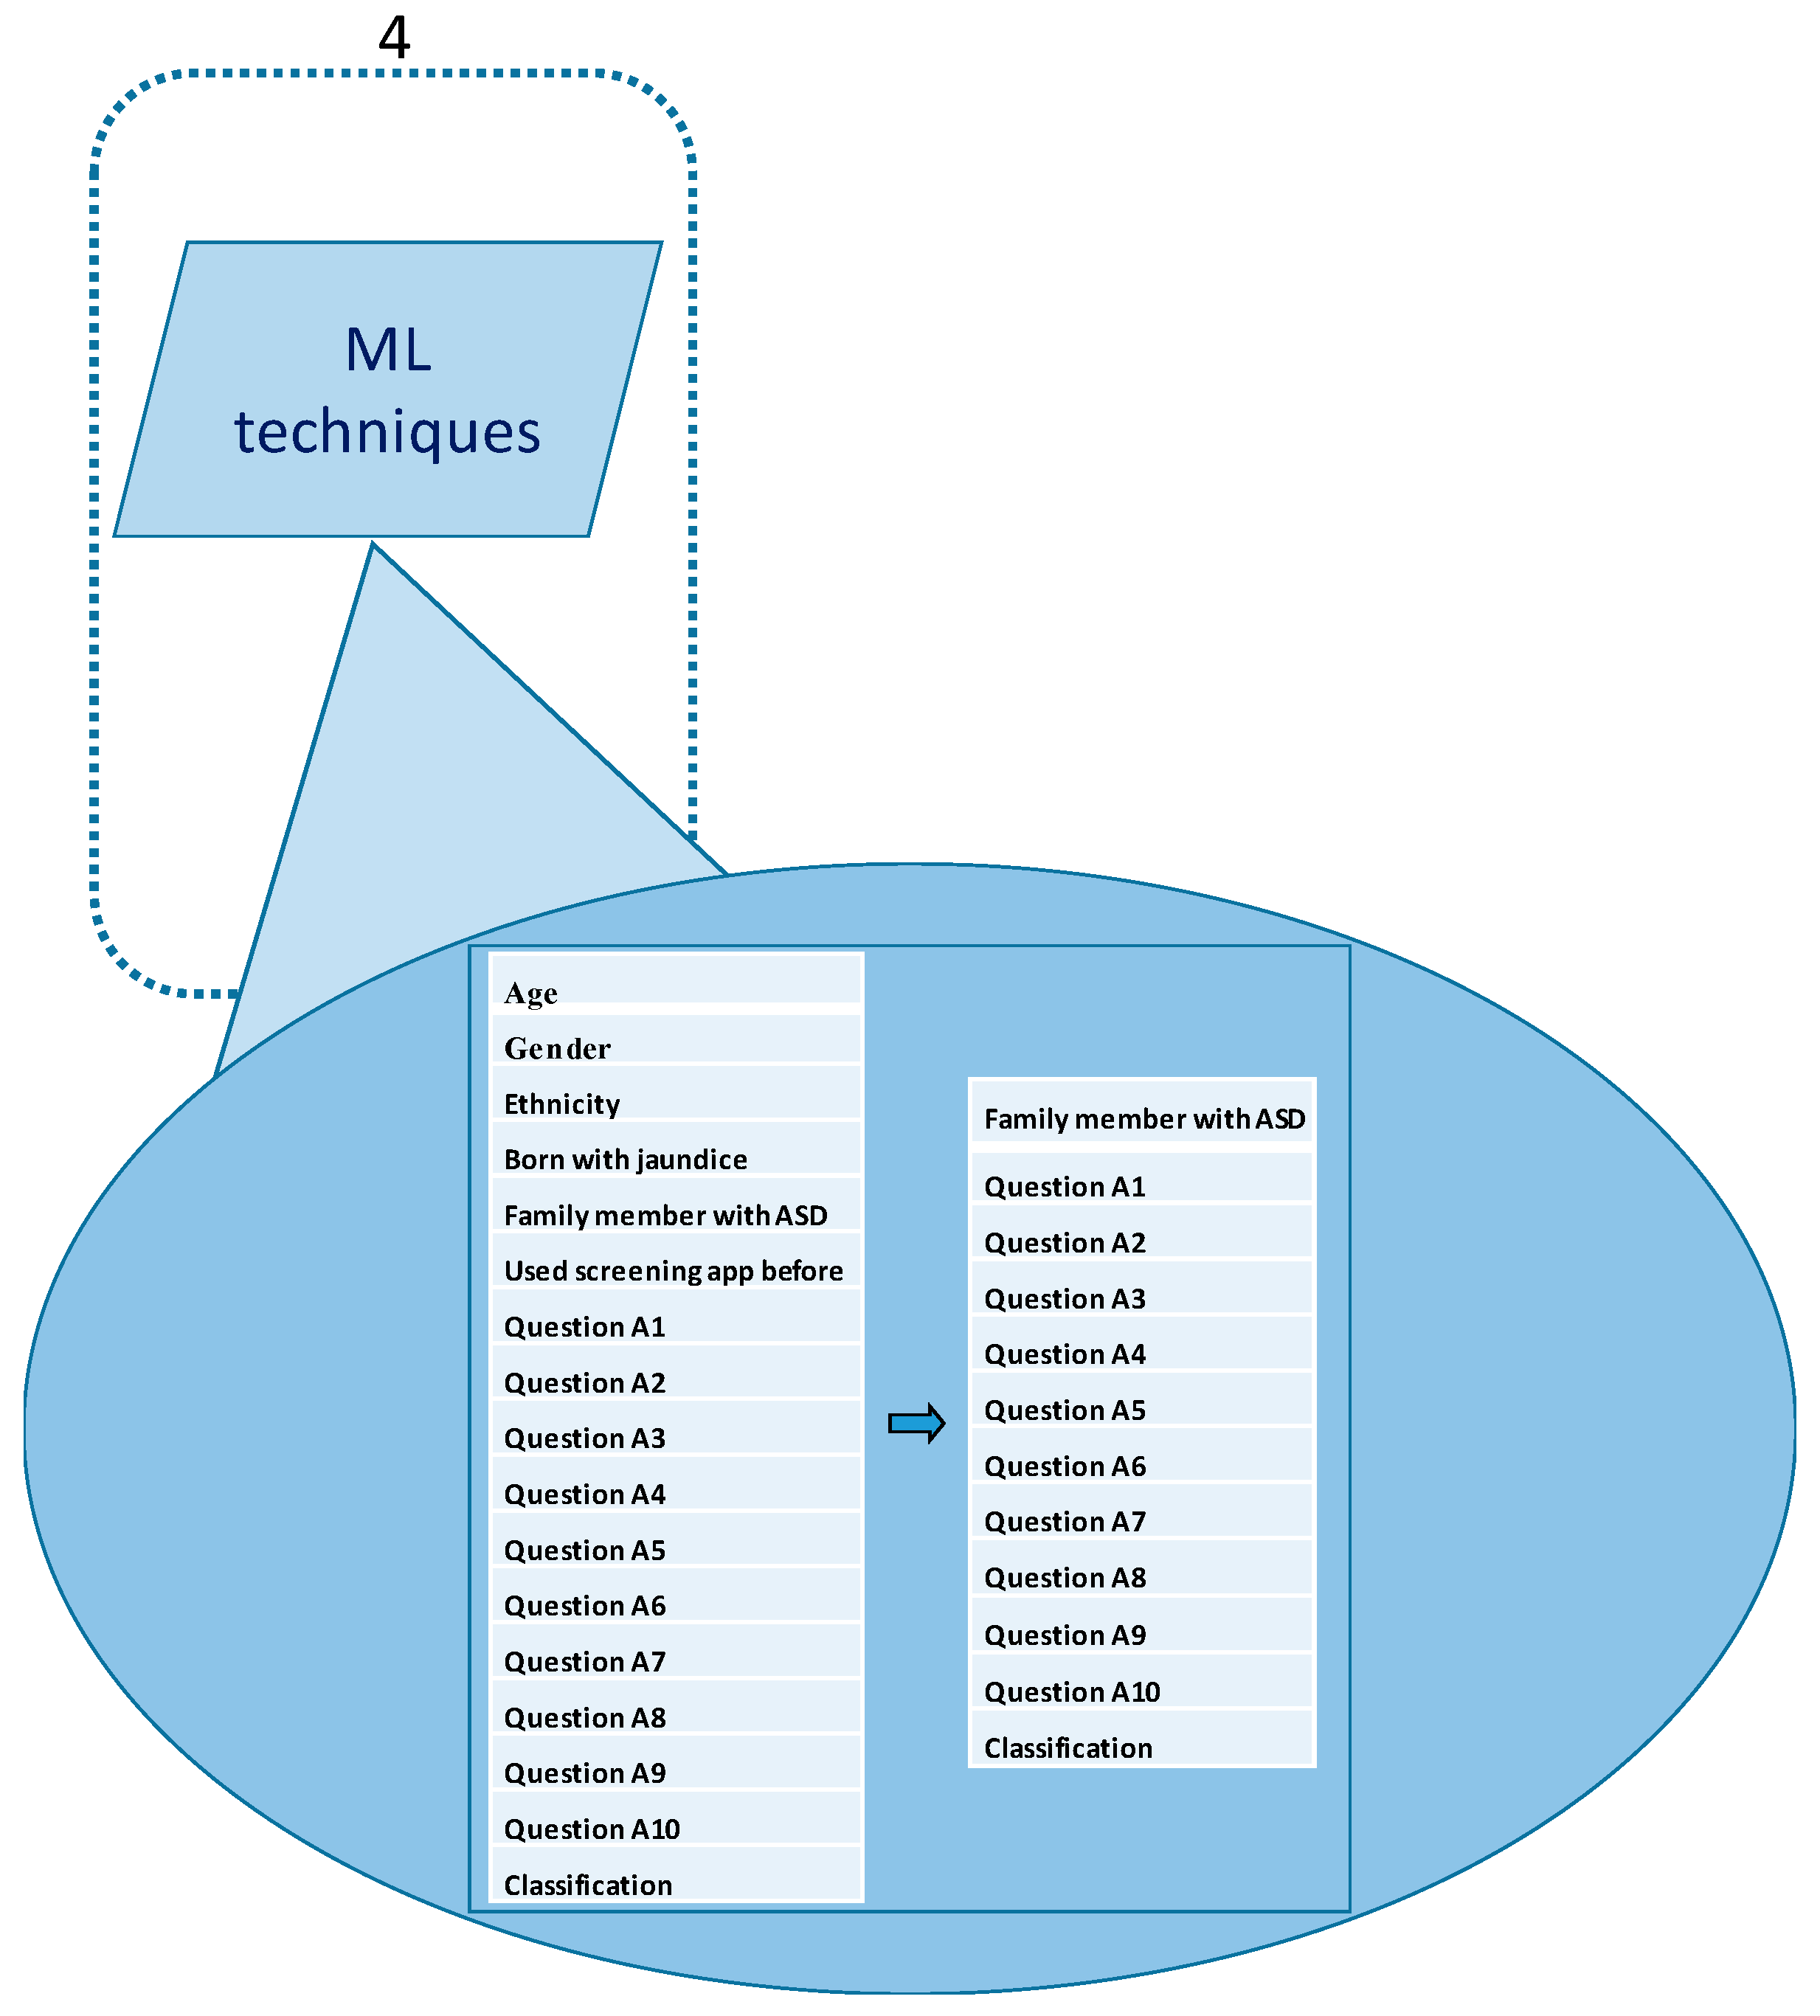
Figure 3 represents Phase 4, in which ML techniques were applied. Although the measures of accuracy, sensitivity, and specificity are displayed in Figure 5, in Figure 3 we show the capacity of the proposed architecture to reduce the dimensionality. Weka has several methods to evaluate the correlation of different input attributes with respect to the output (in this case ASD classification, yes or no).
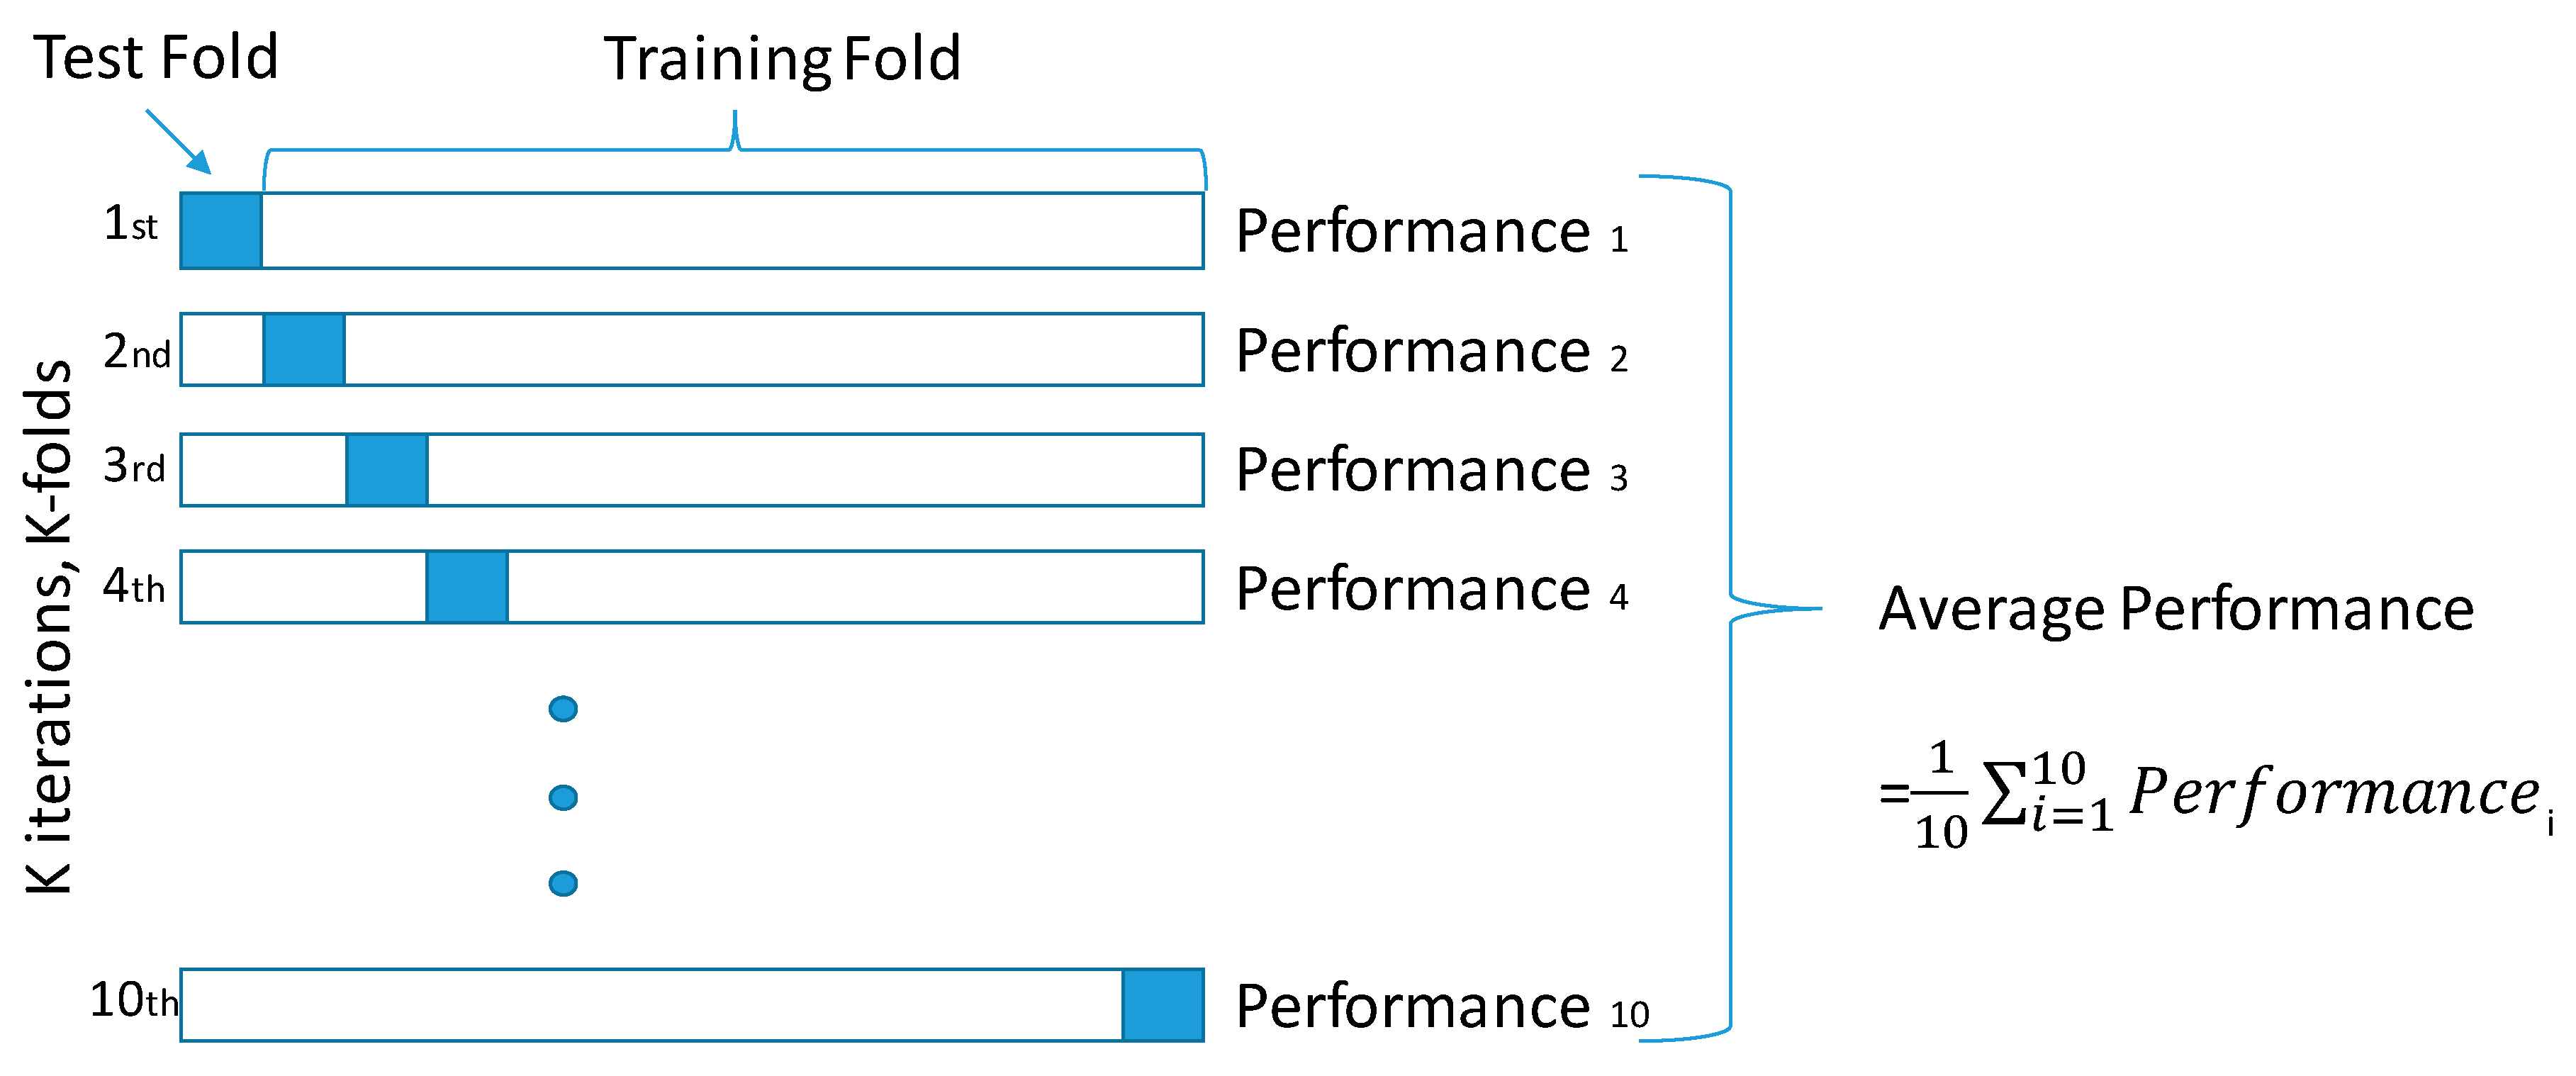
This experiment was carried out via cross-validation, dividing the complete dataset into two subsets, the training set and the test set. The training set was used to determine the system parameters, and the test set was used to evaluate the diagnosis accuracy and the network generalization. Cross-validation is widely used to assess the generalization of networks, estimating the accuracy as determined by the overall number of correct classifications divided by the total number of examples in the dataset. Figure 4 illustrates this method with the 10 iterations used in our experiments and the two subsets (i.e., training set and test set).
The experiments carried out based on the confusion matrix (Table 2) were used to evaluate the different statistical measures.
Accuracy = TP + TN TP + TN + FP + FN
Sensitivity = TP TP + FN
Specificity = TN TN + FP
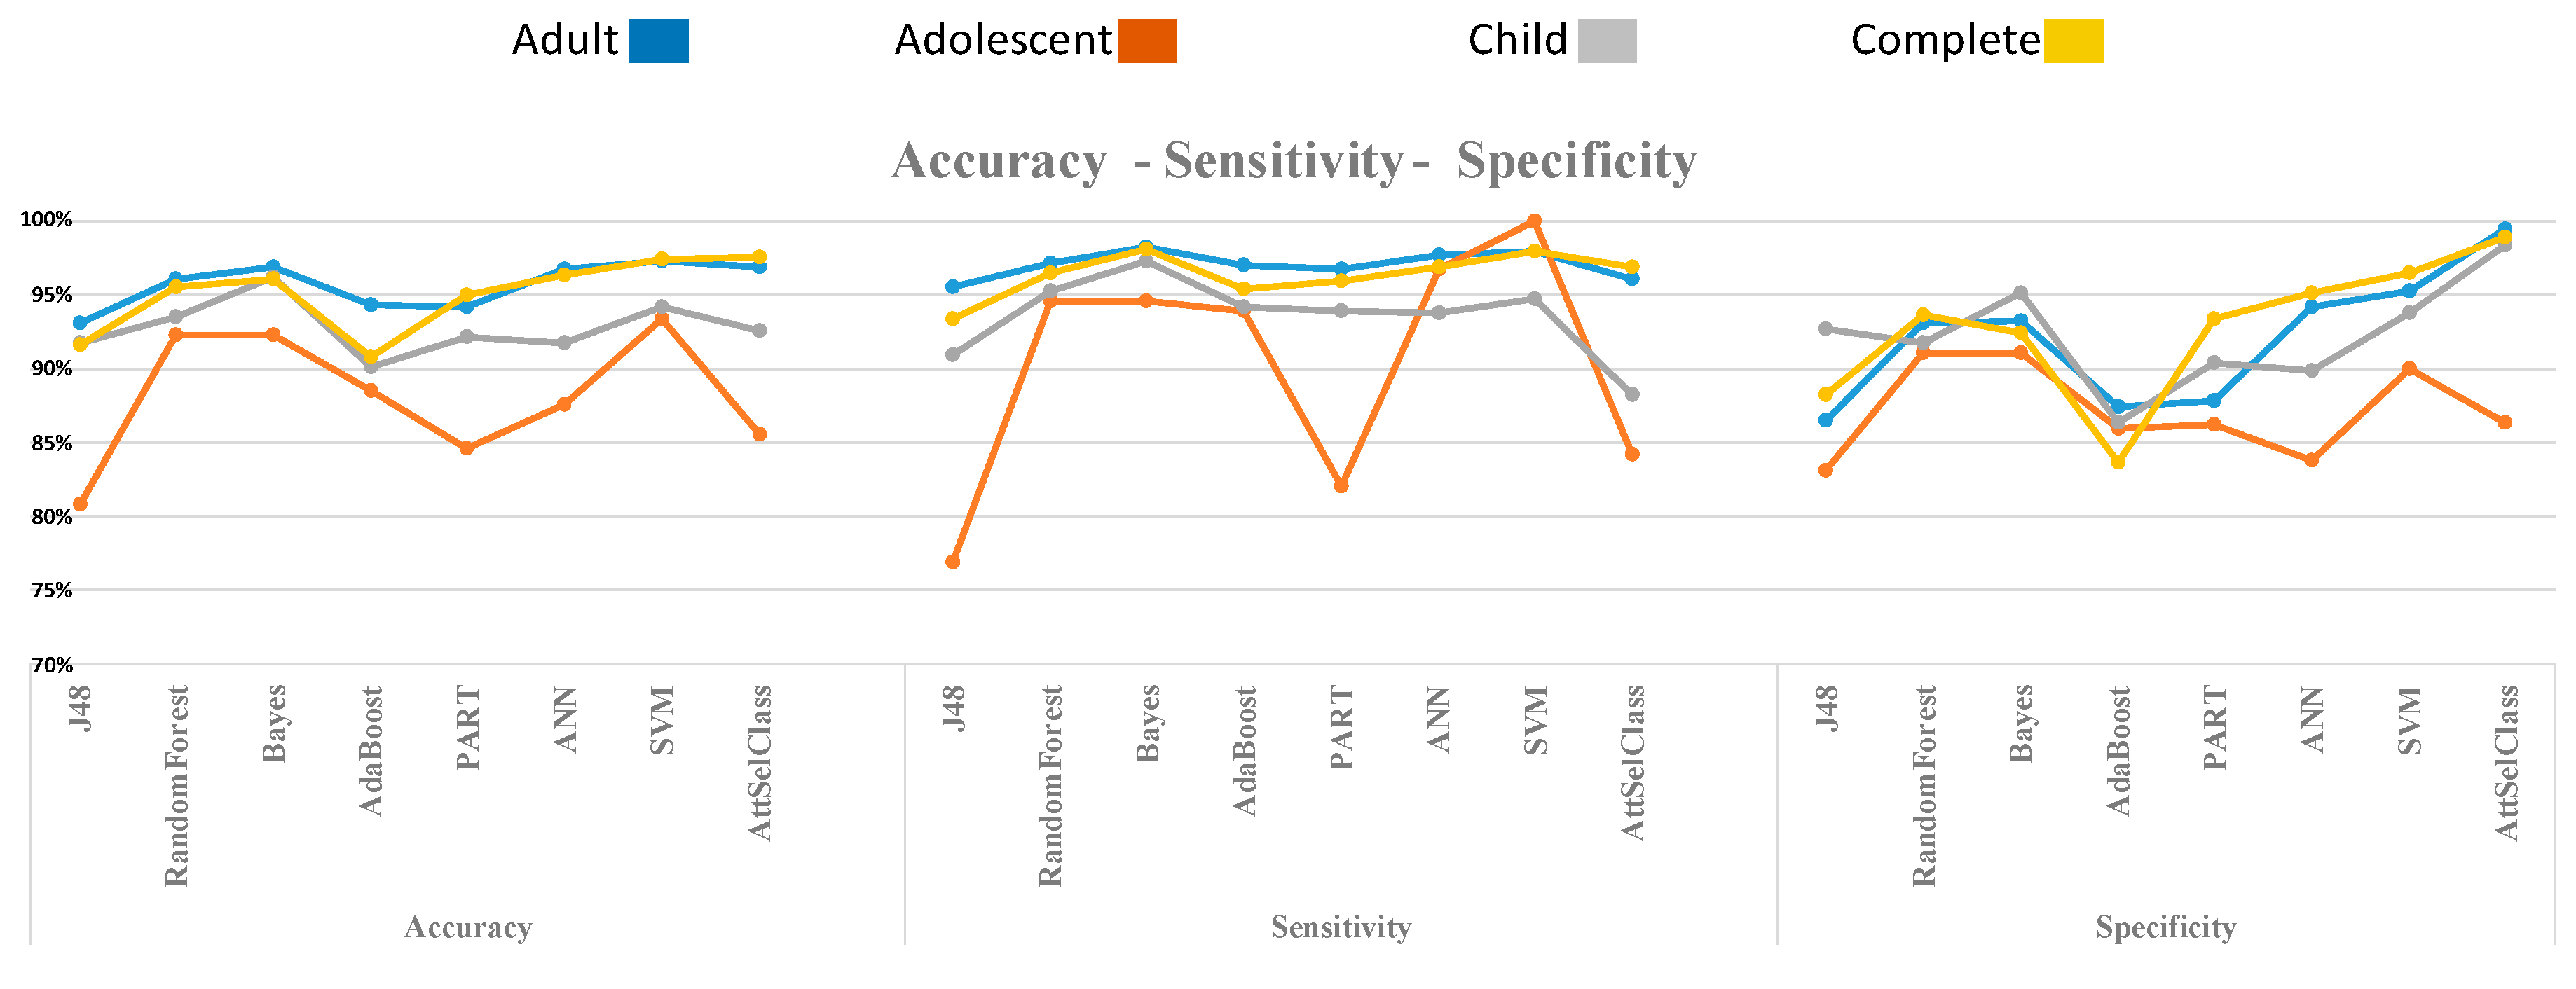
In Figure 5, all sound statistical measures that were evaluated via experiments using several machine learning methods including decision trees (J48), random forest, Bayes, Adaboost, Part, artificial neural networks (ANN), support vector machines (SVM), and AttributeSelectedClassifier (AttSelClass) are displayed. By using a wide range of techniques, we were able to calculate and compare the aforementioned measures.
The reduction indicated in Figure 3 facilitated a structure for distributed processing after collecting data from different sources. The main idea was that an autism screening for adults that initially contained 20 features could be reduced to 12 attributes, meaning that the requirements of the test were reduced by almost half (memory/processing, etc.).
As indicated in Figure 5, we included a metalearner named AttributeSelectedClassifier with the purpose of reducing the dimensionality of the training and test datasets by attribute selection before they were passed on to a classifier. Consequently, we applied attribute selection methods (including principal component analysis) to automatize this step while ensuring that attribute selection was based only on training data and not on testing of the model. The advantage of this approach was the integration of the classifier with the selection of attributes. Accordingly, the effect of reducing the attributes of a classifier was evaluated in order to select the attributes that most influenced the accuracy of the classifier. The selected method for inclusion in this metalearner was SVM, as it produced the best results as well as having a quick and efficient learning time.
This approach allowed us to collect a much larger volume of data because the input parameters were reduced. Consequently, the system became increasingly efficient, as learning improves with the number of samples that are collected.
Another advantage of reducing the input attributes is in the reduction of the needed computing power, especially for low computing power devices such as tablets. Furthermore, the low computing power devices do not need to do local computing as they can send the collected data directly from the device to the cloud, not needing high bandwidth due to reducing the input attributes. The cloud collects the data and will do the final tests or run them locally, depending on the volume of data.
This example can be extrapolated to an environment that includes more resources and devices, and one of the key aspects is the reduction of the number of attributes, which enables a larger number of tests to be considered, thus improving the knowledge in this area.
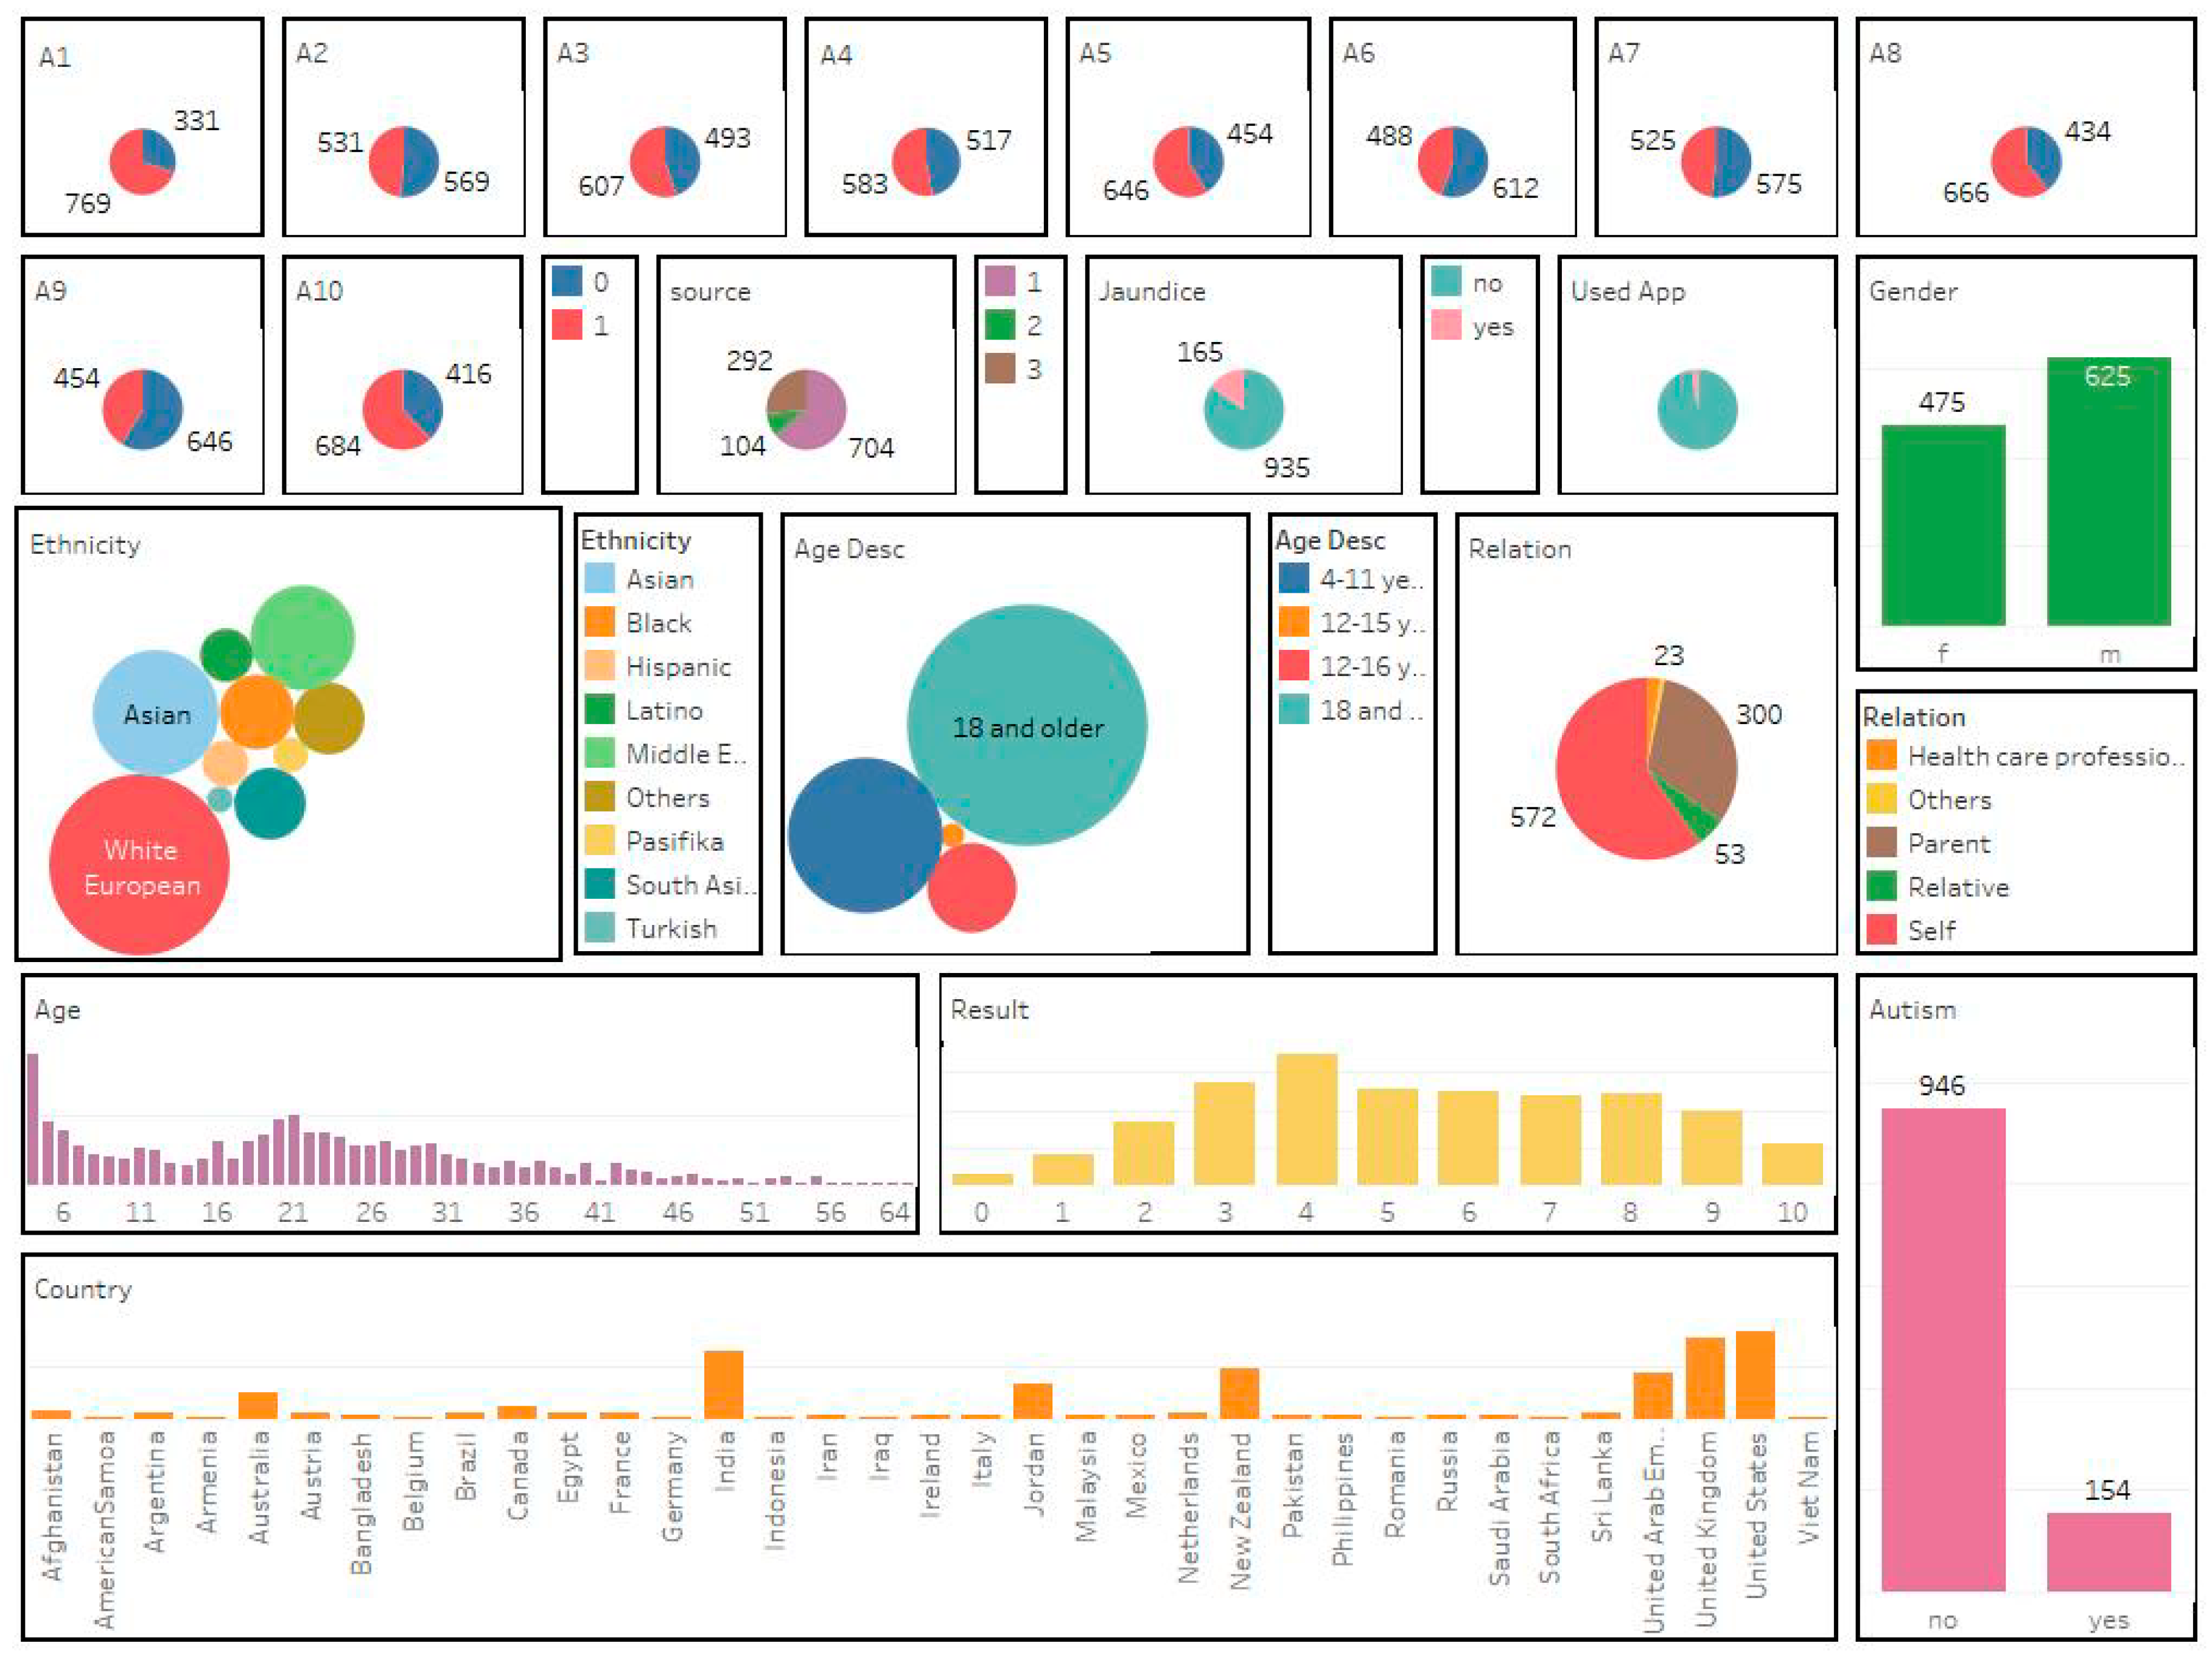
In Figure 6 several dashboards are displayed, representing the correlations between autism-related variables and the final classification. It worth highlighting the heterogeneity among the variables, which were described in Table 1.
As shown in the bar chart of countries, the majority of the people with ASD represented in these datasets lived in the United States, the United Kingdom, India, New Zealand, the United Arab Emirates, Jordan, and Australia. Looking at the ethnicity profile, it is clear that the prevalence of ASD among white Europeans was higher than among other ethnic groups, with Asia in second place in terms of ASD prevalence. It is noticeable that people who were born with jaundice experienced a significantly lower prevalence of ASD compared with those who were not. Men accounted for the highest proportion of ASD subjects. Regarding Questions 1 to 10, the number of people who ticked a positive answer was greater than or equal to the number of people who ticked a negative answer. The chart displaying the age variable (Age Desc) shows the most people with ASD were 18 or older, although ASD was also seen in children as young as four years old, with 92 children represented in the ASD dataset.
The main limitation of this dataset was that the number of respondents was not very high. Furthermore, the classes were not balanced (i.e., more data for respondents without autism than for respondents with autism). Other variables such as ethnicity, age, and relation (family members with the disorder) showed that some values were very often repeated while others barely appeared at all. One of the greatest challenges for future research will be to collect more data that can be integrated using our architecture, in order to increase the dataset and thus improve our system for early detection of the indicators of autism spectrum disorder.

5. Discussion

One billion people, or 15% of the world’s population, experience some form of disability, and the prevalence of disability is higher in developing countries. One fifth of this estimated global total, or between 110 million and 190 million people, experience significant disabilities [2]. It is important to mention that people with disabilities are more likely to experience adverse socioeconomic outcomes than people without disabilities, such as lower education, poorer health outcomes, lower levels of employment, and higher poverty rates [2].
To address the above issue, in this paper, we presented a framework which allows the integration and analysis of diverse and heterogeneous data in the screening of such disabilities. The framework consists of five steps: (1) ASD tests (data collection), (2) raw data (data warehousing), (3) data transformation (data integration using core and specialized domain ontologies), (4) application of ML techniques, and (5) dashboard generation (data visualization and analytics). Our framework is general and can be applied in diverse domains; in this case, the health domain (specifically ASD) was relevant.
As a case study, in this paper we identified several key parameters for the diagnosis of ASD, using the proposed approach. To this end, correlations between different parameters were established by carrying out a set of tests. We concluded with a case study which showed very promising preliminary results.
The main novelties of the proposed architecture are as follows: (1) an architecture focused on the integration and analysis of diverse and heterogeneous data, in which ontologies are used to integrate the data, is proposed; (2) the framework allows the distributed processing of input data; (3) the approach was tested on ASD-related data, producing satisfactory results; (4) in the experimental case study, correlations between different features and the identification of relevant features related to ASD were established.
In the future, it is expected that new data related to ASD will allow better results to be obtained and more correlations and patterns among the parameters to be identified. Datasets are not always gathered using the same criteria, which can lead to diverse results. In this regard, models are very useful to ensure similar results and simplify the data integration.
In terms of future work, we foresee several opportunities to improve our work, such as including new heterogeneous data from different domains (geographical, economic, etc.), which can be integrated using domain ontologies in order to identify hitherto unknown correlations between internal data (ASD data) and external data (environmental conditions, economic situation, etc.).

Author Contributions

Conceptualization, J.P., D.G. and H.M.; methodology, J.P., D.G. and H.M.; software, D.G., S.R., S.A. and M.G.; validation, D.G., S.R., S.A. and M.G.; formal analysis, J.P., D.G. and H.M.; investigation, J.P., D.G., S.R., S.A. and H.M.; resources, D.G., S.R., S.A. and M.G.; data curation, D.G., S.R., S.A. and M.G.; writing—original draft preparation, J.P., D.G. and S.R.; writing—review and editing, J.P., D.G., S.R. and H.M.; visualization, D.G., S.R. and S.A.; supervision, J.P., D.G. and H.M.; project administration, J.P. and D.G.; funding acquisition, J.P. and D.G. All authors have read and agreed to the published version of the manuscript.

Funding

This work was partially funded by Grant RTI2018-094283-B-C32, ECLIPSE-UA (Spanish Ministry of Education and Science).

Acknowledgments

We appreciate all constructive comments from anonymous reviewers to improve paper quality.

Conflicts of Interest

The authors declare no conflict of interest.

References

  1. The World Bank (IBRD-IDA). 2019. Available online: https://www.worldbank.org/en/topic/disability (accessed on 26 January 2020).
  2. Lyall, K.; Croen, L.; Daniels, J.; Fallin, M.D.; Ladd-Acosta, C.; Lee, B.K.; Park, B.Y.; Snyder, N.W.; Schendel, D.; Volk, H.; et al. The changing epidemiology of autism spectrum disorders. Ann. Rev. Public Health 2017, 38, 81–102. [Google Scholar] [CrossRef] [Green Version]
  3. Kessler, R.C.; van Loo, H.M.; Wardenaar, K.J.; Bossarte, R.M.; Brenner, L.A.; Cai, T.; Ebert, D.D.; Hwang, I.; Li, J.; de Jonge, P.; et al. Testing a machine-learning algorithm to predict the persistence and severity of major depressive disorder from baseline self-reports. Mol. Psychiatry 2016, 21, 1366–1371. [Google Scholar] [CrossRef]
  4. Chekroud, A.M.; Zotti, R.J.; Shehzad, Z.; Gueorguieva, R.; Johnson, M.K.; Trivedi, M.H.; Cannon, T.D.; Krystal, J.H.; Corlett, P.R. Cross-trial prediction of treatment outcome in depression: A machine learning approach. Lancet Psychiatry 2016, 3, 243–250. [Google Scholar] [CrossRef]
  5. Torous, J.; Staples, P.; Onnela, J.P. Realizing the potential of mobile mental health: New methods for new data in psychiatry. Curr. Psychiatry Rep. 2015, 17, 61. [Google Scholar] [CrossRef] [Green Version]
  6. Mohr, D.C.; Burns, M.N.; Schueller, S.M.; Clarke, G.; Klinkman, M. Behavioral intervention technologies: Evidence review and recommendations for future research in mental health. Gener. Hosp. Psychiatry 2013, 35, 332–338. [Google Scholar] [CrossRef] [Green Version]
  7. Gil, D.; Johnsson, M.; Chamizo, J.M.; Paya, A.S.; Fernandez, D.R. Application of artificial neural networks in the diagnosis of urological dysfunctions. Expert Syst. Appl. 2009, 36, 5754–5760. [Google Scholar] [CrossRef]
  8. Gil, D.; Johnsson, M. Using support vector machines in diagnoses of urological dysfunctions. Expert Syst. Appl. 2010, 37, 4713–4718. [Google Scholar] [CrossRef]
  9. Gil, D.; Johnsson, M.; García Chamizo, J.M.; Paya, A.S.; Fernández, D.R. Modelling of urological dysfunctions with neurological etiology by means of their centres involved. Appl. Soft Comput. 2011, 11, 4448–4457. [Google Scholar] [CrossRef]
  10. Gil, D.; Girela, J.L.; De Juan, J.; Gomez-Torres, M.J.; Johnsson, M. Predicting seminal quality with artificial intelligence methods. Expert Syst. Appl. 2012, 39, 12564–12573. [Google Scholar] [CrossRef]
  11. Girela, J.L.; Gil, D.; Johnsson, M.; Gomez-Torres, M.J.; De Juan, J. Semen parameters can be predicted from environmental factors and lifestyle using artificial intelligence methods. Biol. Reprod. 2013, 88, 99–100. [Google Scholar] [CrossRef]
  12. Gil, D.; Girela, J.L.; Azorín, J.; De Juan, A.; De Juan, J. Identifying central and peripheral nerve fibres with an artificial intelligence approach. Appl. Soft Comput. 2018, 67, 276–285. [Google Scholar] [CrossRef] [Green Version]
  13. Yoo, I.; Alafaireet, P.; Marinov, M.; Pena-Hernandez, K.; Gopidi, R.; Chang, J.F.; Hua, L. Data mining in healthcare and biomedicine: A survey of the literature. J. Med. Syst. 2012, 36, 2431–2448. [Google Scholar] [CrossRef]
  14. Beykikhoshk, A.; Arandjelović, O.; Phung, D.; Venkatesh, S.; Caelli, T. Data-mining Twitter and the autism spectrum disorder: A pilot study. In Proceedings of the 2014 IEEE/ACM International Conference on Advances in Social Networks Analysis and Mining (ASONAM 2014), Beijing, China, 17–20 August 2014; pp. 349–356. [Google Scholar] [CrossRef]
  15. Latkowski, T.; Osowski, S. Data mining for feature selection in gene expression autism data. Expert Syst. Appl. 2015, 42, 864–872. [Google Scholar] [CrossRef]
  16. Bellazzi, R.; Ferrazzi, F.; Sacchi, L. Predictive data mining in clinical medicine: A focus on selected methods and applications. Wiley Interdiscip. Rev. Data Min. Knowl. Discov. 2011, 1, 416–430. [Google Scholar] [CrossRef]
  17. Wall, D.P.; Kosmicki, J.; Deluca, T.F.; Harstad, E.; Fusaro, V.A. Use of machine learning to shorten observation-based screening and diagnosis of autism. Transl. Psychiatry 2012, 2, e100. [Google Scholar] [CrossRef]
  18. Kosmicki, J.A.; Sochat, V.; Duda, M.; Wall, D.P. Searching for a minimal set of behaviors for autism detection through feature selection-based machine learning. Transl. Psychiatry 2015, 5, e514. [Google Scholar] [CrossRef] [Green Version]
  19. Deshpande, G.; Libero, L.; Sreenivasan, K.R.; Deshpande, H.; Kana, R.K. Identification of neural connectivity signatures of autism using machine learning. Front. Human Neurosci. 2013, 7, 670. [Google Scholar] [CrossRef] [Green Version]
  20. Bone, D.; Goodwin, M.S.; Black, M.P.; Lee, C.C.; Audhkhasi, K.; Narayanan, S. Applying machine learning to facilitate autism diagnostics: Pitfalls and promises. J. Autism Dev. Disord. 2015, 45, 1121–1136. [Google Scholar] [CrossRef] [Green Version]
  21. Rosenberg, R.E.; Landa, R.; Law, J.K.; Stuart, E.A.; Law, P.A. Factors affecting age at initial autism spectrum disorder diagnosis in a national survey. Autism Res. Treat. 2011, 2011. [Google Scholar] [CrossRef]
  22. Rotholz, D.A.; Kinsman, A.M.; Lacy, K.K.; Charles, J. Improving early identification and intervention for children at risk for autism spectrum disorder. Pediatrics 2017, 139, e20161061. [Google Scholar] [CrossRef] [Green Version]
  23. Daniels, A.M.; Mandell, D.S. Explaining differences in age at autism spectrum disorder diagnosis: A critical review. Autism 2014, 18, 583–597. [Google Scholar] [CrossRef] [PubMed] [Green Version]
  24. Zuckerman, K.E.; Lindly, O.J.; Sinche, B.K. Parental concerns, provider response, and timeliness of autism spectrum disorder diagnosis. J. Pediatr. 2015, 166, 1431–1439. [Google Scholar] [CrossRef] [PubMed] [Green Version]
  25. Fang, H. Managing data lakes in big data era: What’s a data lake and why has it became popular in data management ecosystem. In Proceedings of the 2015 IEEE International Conference on Cyber Technology in Automation, Control, and Intelligent Systems (CYBER), Shenyang, China, 8–12 June 2015; pp. 820–824. [Google Scholar] [CrossRef]
  26. Miloslavskaya, N.; Tolstoy, A. Big data, fast data and data lake concepts. Procedia Comput. Sci. 2016, 88, 300–305. [Google Scholar] [CrossRef] [Green Version]
  27. Noy, N.F.; McGuinness, D.L. Ontology Development 101: A Guide to Creating Your First Ontology; Stanford University: Stanford, CA, USA, 2001. [Google Scholar]
  28. Guarino, N. Formal Ontology in Information Systems: Proceedings of the First International Conference (FOIS’98), Trento, Italy, 6–8 June 1998; IOS Press: Amsterdam, The Netherlands, 1998. [Google Scholar]
  29. Stevenson, M.; Wilks, Y. Word Sense Disambiguation. The Oxford Handbook of Computational Linguistics; Oxford University Press: London, UK, 2003; pp. 249–265. [Google Scholar]
  30. Navigli, R. Word Sense Disambiguation: A survey. ACM Comput. Surv. (CSUR) 2009, 41, 1–69. [Google Scholar] [CrossRef]
  31. Peral, J.; Ferrandez, A.; Gil, D.; Munoz-Terol, R.; Mora, H. An ontology-oriented architecture for dealing with heterogeneous data applied to telemedicine systems. IEEE Access. 2018, 6, 41118–41138. [Google Scholar] [CrossRef]
  32. Matuszek, C.; Witbrock, M.; Kahlert, R.C.; Cabral, J.; Schneider, D.; Shah, P.; Lenat, D. Searching for Common Sense: Populating Cyc from the Web; UMBC Computer Science and Electrical Engineering Department Collection: Baltimore, MD, USA, 2005; pp. 1430–1435. [Google Scholar]
  33. Bodenreider, O. The Unified Medical Language System (UMLS): Integrating Biomedical Terminology. Nucleic Acids Res. 2004, 32, D267–D270. [Google Scholar] [CrossRef] [Green Version]
  34. Fellbaum, C. WordNet. In Theory and Applications of Ontology: Computer Applications; Springer: Berlin, Germany, 2010; pp. 231–243. [Google Scholar] [CrossRef]
  35. Matheus, R.; Janssen, M.; Maheshwari, D. Data science empowering the public: Data-driven dashboards for transparent and accountable decision-making in smart cities. Gov. Inf. Q. 2018, 101284. [Google Scholar] [CrossRef]
  36. Rouhani, S.; Zamenian, S.; Rotbie, S. A Prototyping and Evaluation of Hospital Dashboard through End-User Computing Satisfaction Model (EUCS). J. Inf. Technol. Manag. 2018, 10, 43–60. [Google Scholar] [CrossRef]
  37. Morton, K.; Bunker, R.; Mackinlay, J.; Morton, R.; Stolte, C. Dynamic workload driven data integration in tableau. In Proceedings of the 2012 ACM SIGMOD International Conference on Management of Data, Scottsdale, AZ, USA, 20 May 2012; pp. 807–816. [Google Scholar] [CrossRef]
  38. Witten, I.H.; Frank, E.; Hall, M.A.; Pal, C.J. Data Mining: Practical Machine Learning Tools and Techniques; Morgan Kaufmann Series in Data Management Systems; Elsevier: Montreal, QC, Canada, 2016. [Google Scholar]
  39. Olivé, A. The Universal Ontology: A Vision for Conceptual Modelling and the Semantic Web (Invited Paper). In International Conference on Conceptual Modelling (Lecture Notes in Computer Science); Springer: Berlin, Germany, 2017; Volume 10650, pp. 1–17. [Google Scholar] [CrossRef] [Green Version]
  40. Shvaiko, P.; Euzenat, J. Ontology matching: State of the art and future challenges. IEEE Trans. Knowl. Data Eng. 2011, 25, 158–176. [Google Scholar] [CrossRef] [Green Version]
  41. Arnold, P.; Rahm, E. Enriching ontology mappings with semantic relations. Data Knowl. Eng. 2014, 93, 1–8. [Google Scholar] [CrossRef]
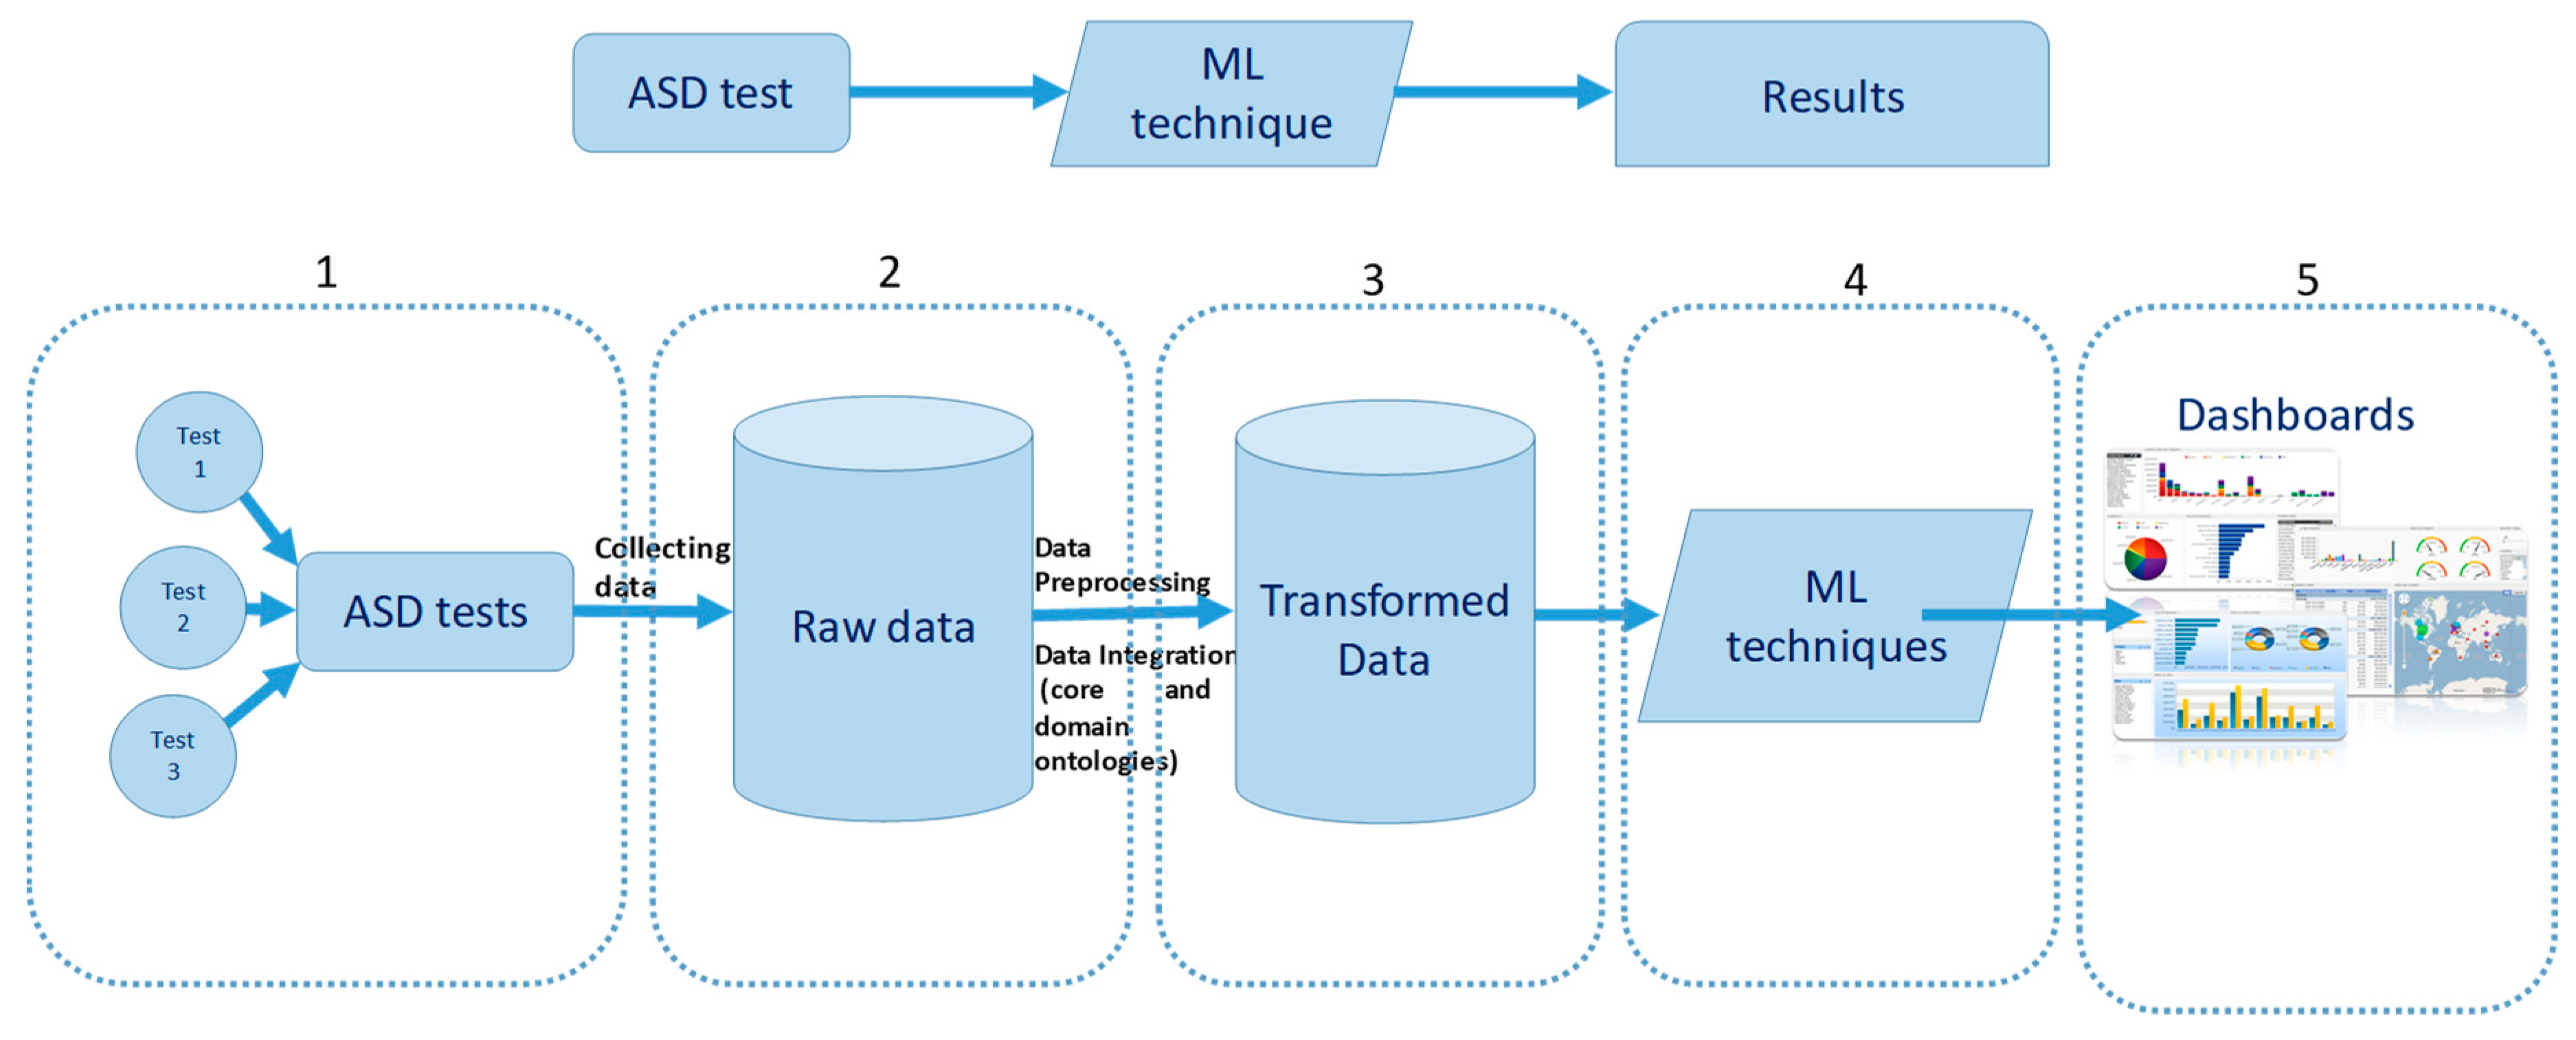
Figure 1. Proposed architecture divided into five steps (1b down) versus the classical version (1a up).
Electronics 09 00516 g001
Figure 2. Integration of one of the variables from Table 1.
Electronics 09 00516 g002
Figure 3. Dimensionality reduction from 19 attributes to 12. This reduction helped to apply the distributed approach, as every test was reduced by almost half.
Electronics 09 00516 g003
Figure 4. Cross-validation method. Dataset was divided into two subsets, the training set and the test set. In our case, every experiment was carried out 10 times (10-fold) and the final performance was calculated as the average of the 10 performances.
Electronics 09 00516 g004
Figure 5. Measures of accuracy, sensitivity, and specificity.
Electronics 09 00516 g005
Figure 6. Dashboards describing correlations between autism variables and the final classification.
Electronics 09 00516 g006
Table 1. List of attributes and their descriptions for Autism Spectrum Disorder (ASD) screening data for adults, adolescents, and children.
AttributeTypeDescription
AgeNumberAge in years
GenderStringMale or female
EthnicityStringList of common ethnicities in text format
Born with jaundiceBoolean (yes or no)Whether the person was born with jaundice
Family member with PDDBoolean (yes or no)Whether any immediate family member has a PDD (Pervasive Developmental Disorder)
Who is completing the testStringParent, self, caregiver, medical staff, clinician, etc.
Country of residenceStringList of countries in text format
Used screening app beforeBoolean (yes or no)Whether the user has used a screening app
A1Binary (0, 1)The answer code of: “I often notice small sounds when others do not.”
A2Binary (0, 1)The answer code of: “I usually concentrate more on the whole picture rather than the small details.”
A3Binary (0, 1)The answer code of: “I find it easy to do more than one thing at once.”
A4Binary (0, 1)The answer code of: “If there is an interruption, I can switch back to what I was doing very quickly.”
A5Binary (0, 1)The answer code of: “I find it easy to ‘read between the lines’ when someone is talking to me.”
A6Binary (0, 1)The answer code of: “I know how to tell if someone listening to me is getting bored.”
A7Binary (0, 1)The answer code of: “When I’m reading a story, I find it difficult to work out the characters’ intentions.”
A8Binary (0, 1)The answer code of: “I like to collect information about categories of things (e.g., types of car, types of bird, types of train, and types of plant).”
A9Binary (0, 1)The answer code of: “I find it easy to work out what someone is thinking or feeling just by looking at their face.”
A10Binary (0, 1)The answer code of: “I find it difficult to work out people’s intentions.”
ClassificationClass (Yes, no) The final classification
(yes = 189, he/she has ASD; no = 516, he/she does not have ASD)
Table 2. Definition of confusion matrix.
True Condition
Total PopulationCondition PositiveCondition Negative
Predicted ConditionPredicted condition positiveTrue positive (TP)False positive (FP)
Predicted condition negativeFalse negative (FN)True negative (TN)