2. Related Work
The expression Industry 4.0 has been minted by research and industrial partners during the last decade. In this context, a large variety of studies and research projects have been conducted. The work in [
2] shows an exemplary case study on big data analytics in industrial production environments. The outcome of this is a cross-industry methodology, capable of process improvements with data mining. In [
1] a distributed system architecture was used to enable predictive maintenance on a self-tuning engine by combining dynamic use of different prediction algorithms with data interpretation functionalities to allow better understanding by the end user. While in [
3] an overview of IoT platforms with applications in enhanced living environments and in healthcare systems is given highlighting the applications, the challenges, the opportunities of these new technologies.
The differences between multi-class classifiers and deep learning techniques are discussed in [
4]. A comparative experimental analysis of exploratory techniques was presented in [
5]. The scalability of big data methodologies is discussed in [
6] using an example from the energy domain industry. The authors of [
7] present a proposal for on-demand remote sensing of data to save network and processing capacities by extracting features as soon as possible in the data flow.
The linking between existing production system, their legacy systems and advanced Internet of Things (IoT) technologies is discussed in [
6]. For this purpose, virtualization and a cloud-based micro-service architecture are key technologies. The topic of distributed micro-service architectures for big data applications is also discussed in [
8]. Therein, the author describes an approach done by the Open Geospatial Consortium (OGC) to process large quantities of data collected by earth observation satellites. By bringing micro-services to the place where data is captured and stored instead of moving these large quantities of data to one central processing node, unnecessary data transport can be significantly reduced. In [
9] a scalable full-stack distributed engine tailored to energy data collection and forecasting in the smart-city context enabling the integration of the heterogeneous data measurements gathered from real-world systems and the forecasting of average power demand. Moreover, related to fog computing, in [
10] the authors introduce a new architecture enabling on-demand computation to offload the computation in the cloud architecture, reducing unnecessary network overhead, by properly selecting the most effective edge devices as computation delegates.
In the context of maintenance strategies, the condition based approach is considered as effective [
11], but also complex to implement and integrate to a production system [
12]. However, the determination of the current equipment condition is an important issue in the maintenance process chain. Using a combination of raw data and intelligent trend filtering, anomalies can be detected in various ways, as discussed in [
13]. Usually identified anomalies or the status of machine’s degradation are expressed in terms of a machine’s remaining useful life (RUL). In that way, a complex statistical analysis is directly mapped to a value with physical meaning for the maintenance personnel, responsible for further actions. The authors of [
14,
15] explore ways to estimate the RUL and derive a detailed maintenance scheduling strategy. It is important to note that to adequately estimate an equipment’s condition using raw data as a basis, a dataset of proper quality is necessary. This requires data corresponding to both normal and abnormal working conditions. Methods for data quality improvements are discussed by the authors of [
16]. The authors describe how datasets can be visualized, grouped, classified, clustered and evaluated in order to detect and remove outliers.
This paper extends the work presented in [
17] by (i) presenting an up-to-date architecture of the SERENA system, (ii) describing in further detail the main components of the predictive analytics service, and (iii) providing additional experimental results.
3. Proposed Architecture
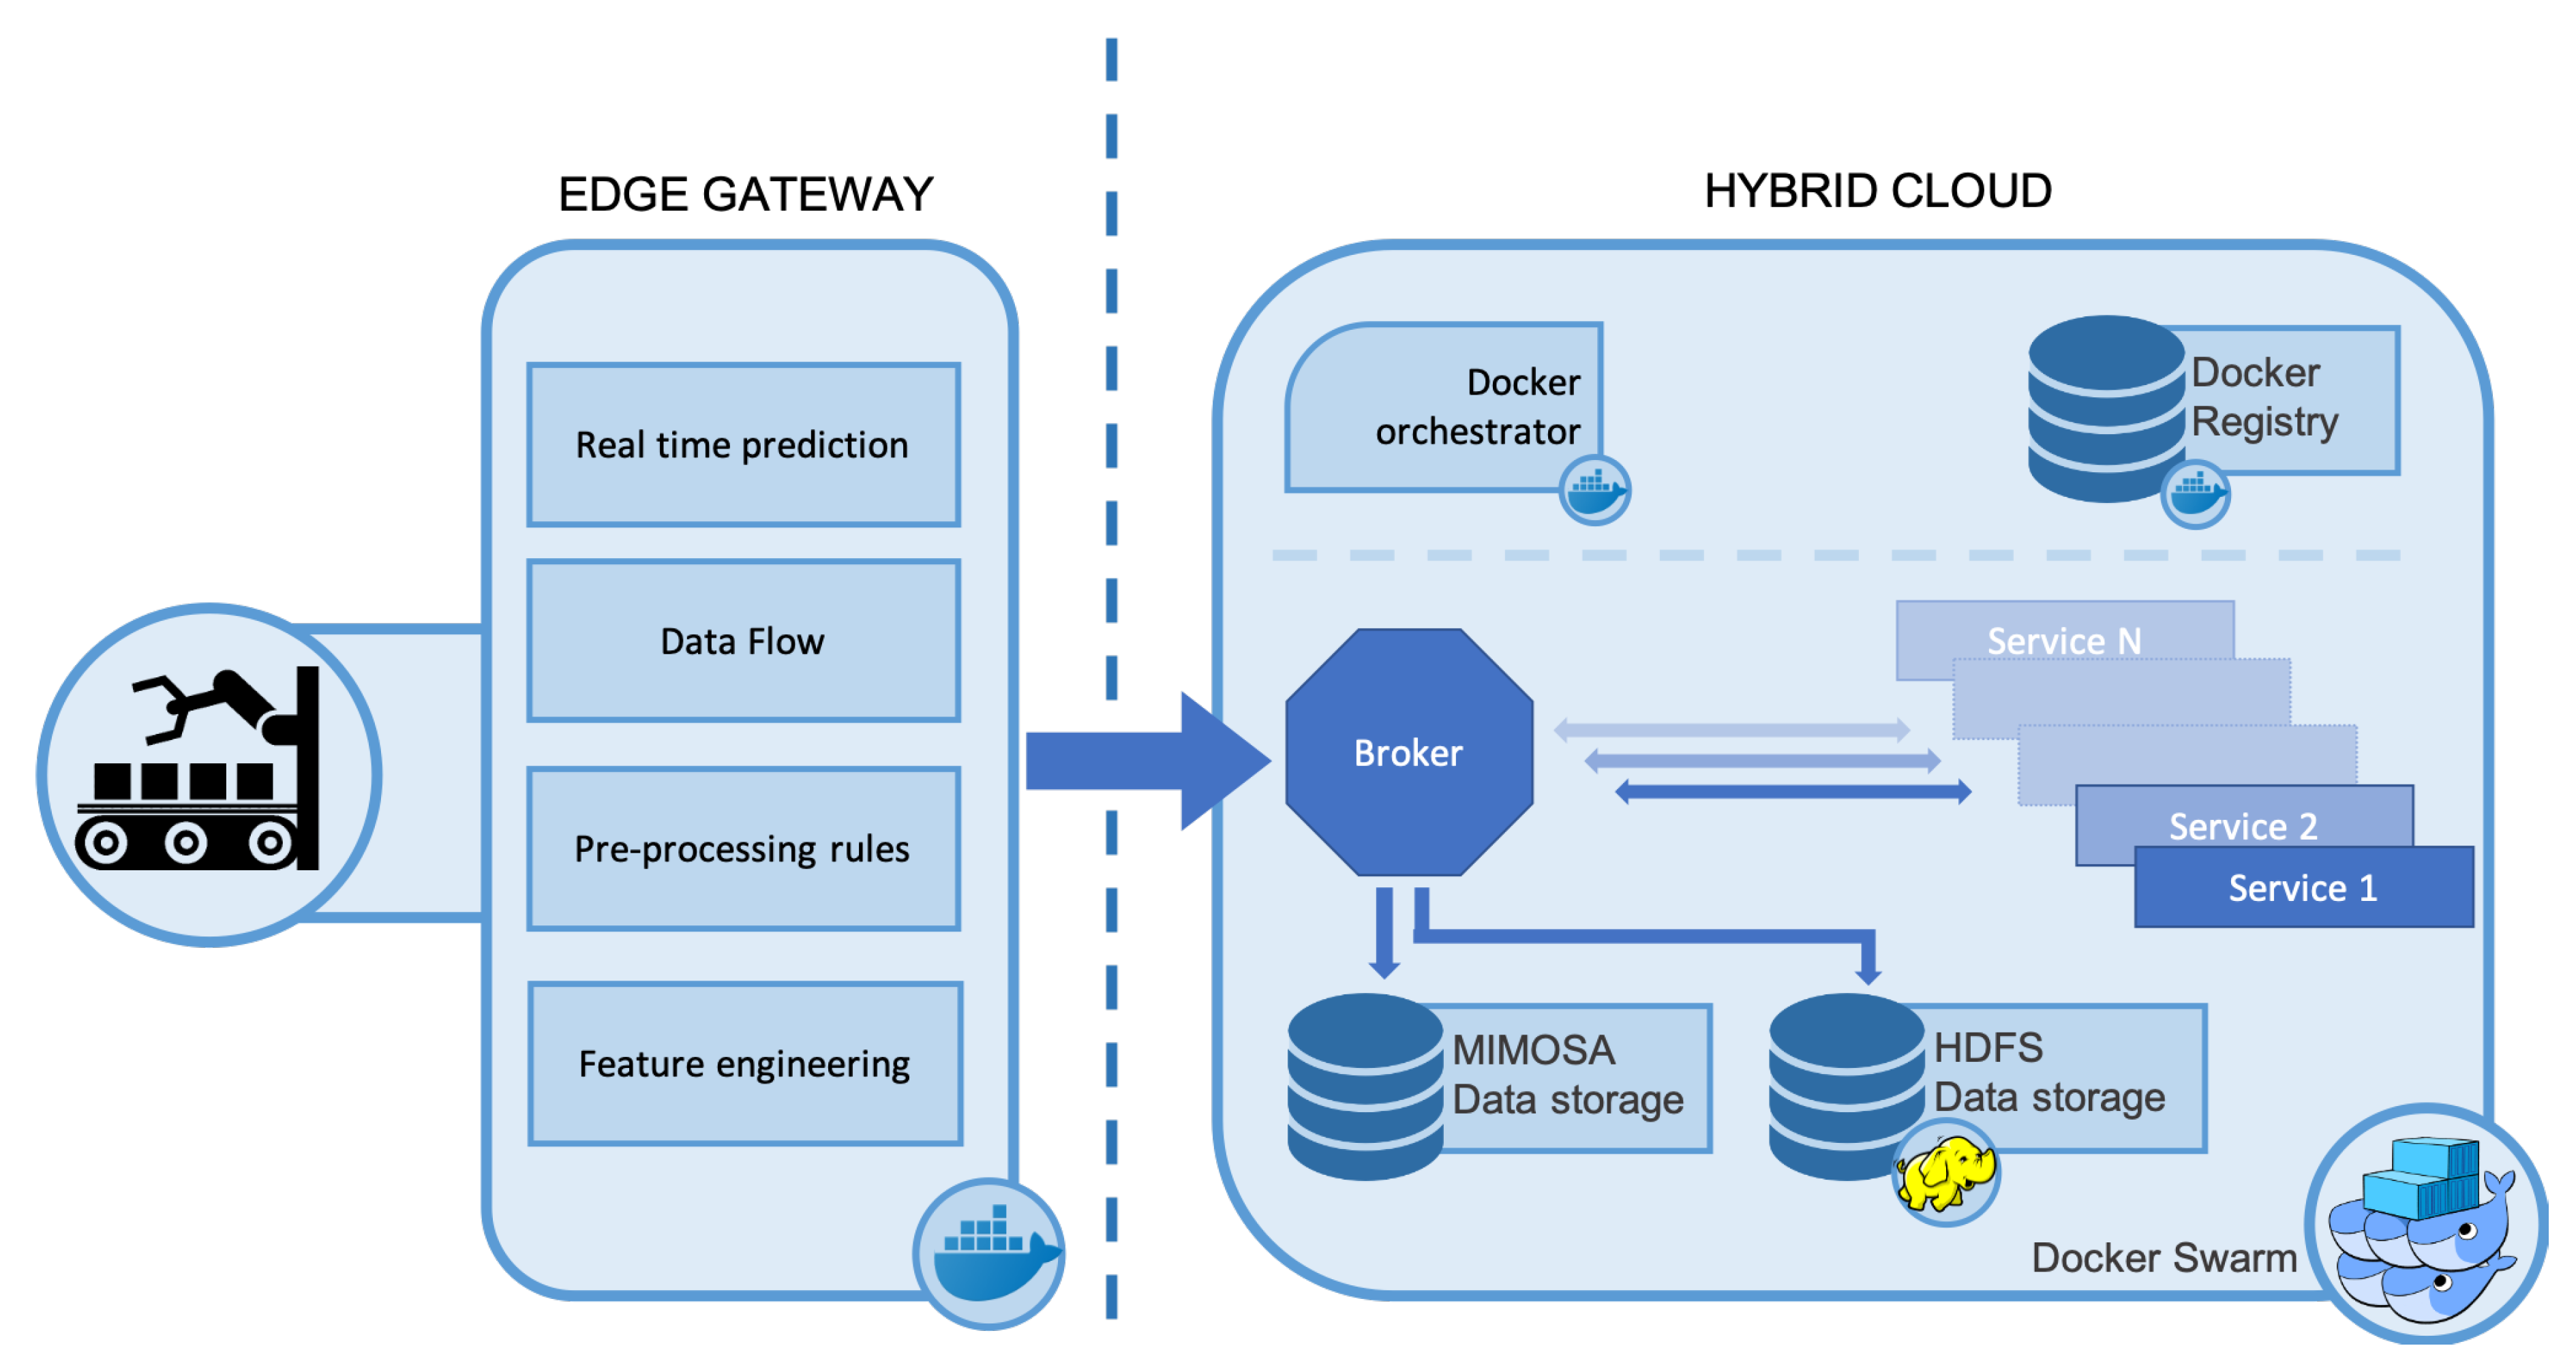
The SERENA system is built on a lightweight and flexible micro-services architecture as shown in
Figure 1, with the various applications implemented as independent Docker services. The services are integrated to seamlessly support maintenance engineers and personnel by providing the following main functionalities: (i) predictive maintenance analytics; (ii) dynamic maintenance scheduling; and (iii) assisted plant maintenance, using augmented reality devices. Communications are facilitated through a central message broker. With respect to the cloud-based nature of the architecture and its services, the SERENA data model is based on a JSON-LD [
18] mapping of the MIMOSA XML schema [
19]. A Docker orchestration layer manages the instantiation and life cycle of the services. The adoption of virtualization technologies like Docker, creates an agnostic middle-ware, enabling the SERENA system to be deployable on a wide variety of host infrastructures while providing scalability and resiliency. The Docker orchestration layer also provides the overlay network that allows the services to transparently communicate, irrespective of where they are deployed.
A standard practice for companies not providing IT products or services, is renting cloud space and web servers to avoid the related capital and maintenance cost, and it is obvious that production equipment and sensors are at a distance from the actual rented cloud infrastructure. With respect to the aforementioned point, the SERENA architecture extends the IoT cloud concept to directly include these devices. This is accomplished by wrapping the edge applications as Docker services, and managing their deployment and lifecycle from the Docker swarm as docker workers or managers in case of a complex swarm(s). This in turn can enable workload balancing in terms of deploying and executing docker applications to the appropriate network nodes, as well as managing the activation or deactivation of additional services at a certain node. In case of network bandwidth or latency constraints, the service can be moved to the edge of the cloud to analyze and convert the raw data into features, at source; alternatively, if high performance compute resources are required, such as tensor processing units (TPUs) for training machine learning (ML) models, services can be run on the central cloud infrastructure or in remote public clouds. Thus, the SERENA architecture considers both cloud and edge nodes, all being part of the same hybrid SERENA cloud system, centrally and holistically managed as one or more Docker swarm service network.
In the context of the SERENA project, a specific gateway has been designed and developed based on an Intel NUC, which has 8 GB of RAM and an Intel i5, as well as some analog inputs. The edge component, referring to an edge gateway (hardware and software), allows building real-time streaming applications, reliably collecting data among different heterogeneous systems or applications and transforming or reacting to the streams of data collected in the plant. It can scale in both data size and velocity. The edge gateway is located on the factory floor, collecting sensor data coming from industrial equipment as well as context information and the operating condition of the equipment. It includes the following key functionalities:
The data flow engine, managing the data streams;
A feature engineering component pre-processing incoming raw data into values that are of greater meaning for predictive analytics, such as the current average/rms value instead of simple amplitude;
The rules for performing the aforementioned pre-processing;
A pre-trained predictive analytics model providing real time predictions/classifications.
All components are deployed as docker containers under the control of a docker orchestration manager. Wrapping edge functionalities as docker services give the system the flexibility to execute the application workloads wherever it makes the most sense: If there are network bandwidth or latency constraints, the service can be moved to the edge of the cloud to analyze and convert the raw data into feature engineering, at source; alternatively, if high-performance computing resources are required, such as tensor processing units (TPUs) for training machine learning (ML) models, services can be run on the central cloud infrastructure or in remote public clouds.
The SERENA system has been designed and implemented aiming to be technology-independent. The reason for this is to allow any integrator or developer to customize it and tailor its reference technologies depending on case-specific technology limitations. Whilst a reference architecture and implementation are provided, the system has been designed in such a way as to give the developer the freedom to choose the technologies that conform to their own corporate guidelines or meet specific implementation challenges.
In particular, the technologies used for implementing the SERENA system during the proof of concept stage along with the data storage mechanisms are transparent to the other services. Thus, older technologies can be swapped for newer more powerful ones, without having to rebuild the entire system. As an example, the preferred data storage platform is HDFS [
20], but other databases, such as Cassandra [
21], may be preferred in specific cases.
4. Services
The architecture presented in the previous section has been designed to enable predictive analytics of industrial equipment. Towards that, a set of application services has been integrated. In the following sections the main services are presented in greater detail.
4.1. The Predictive Analytic Service
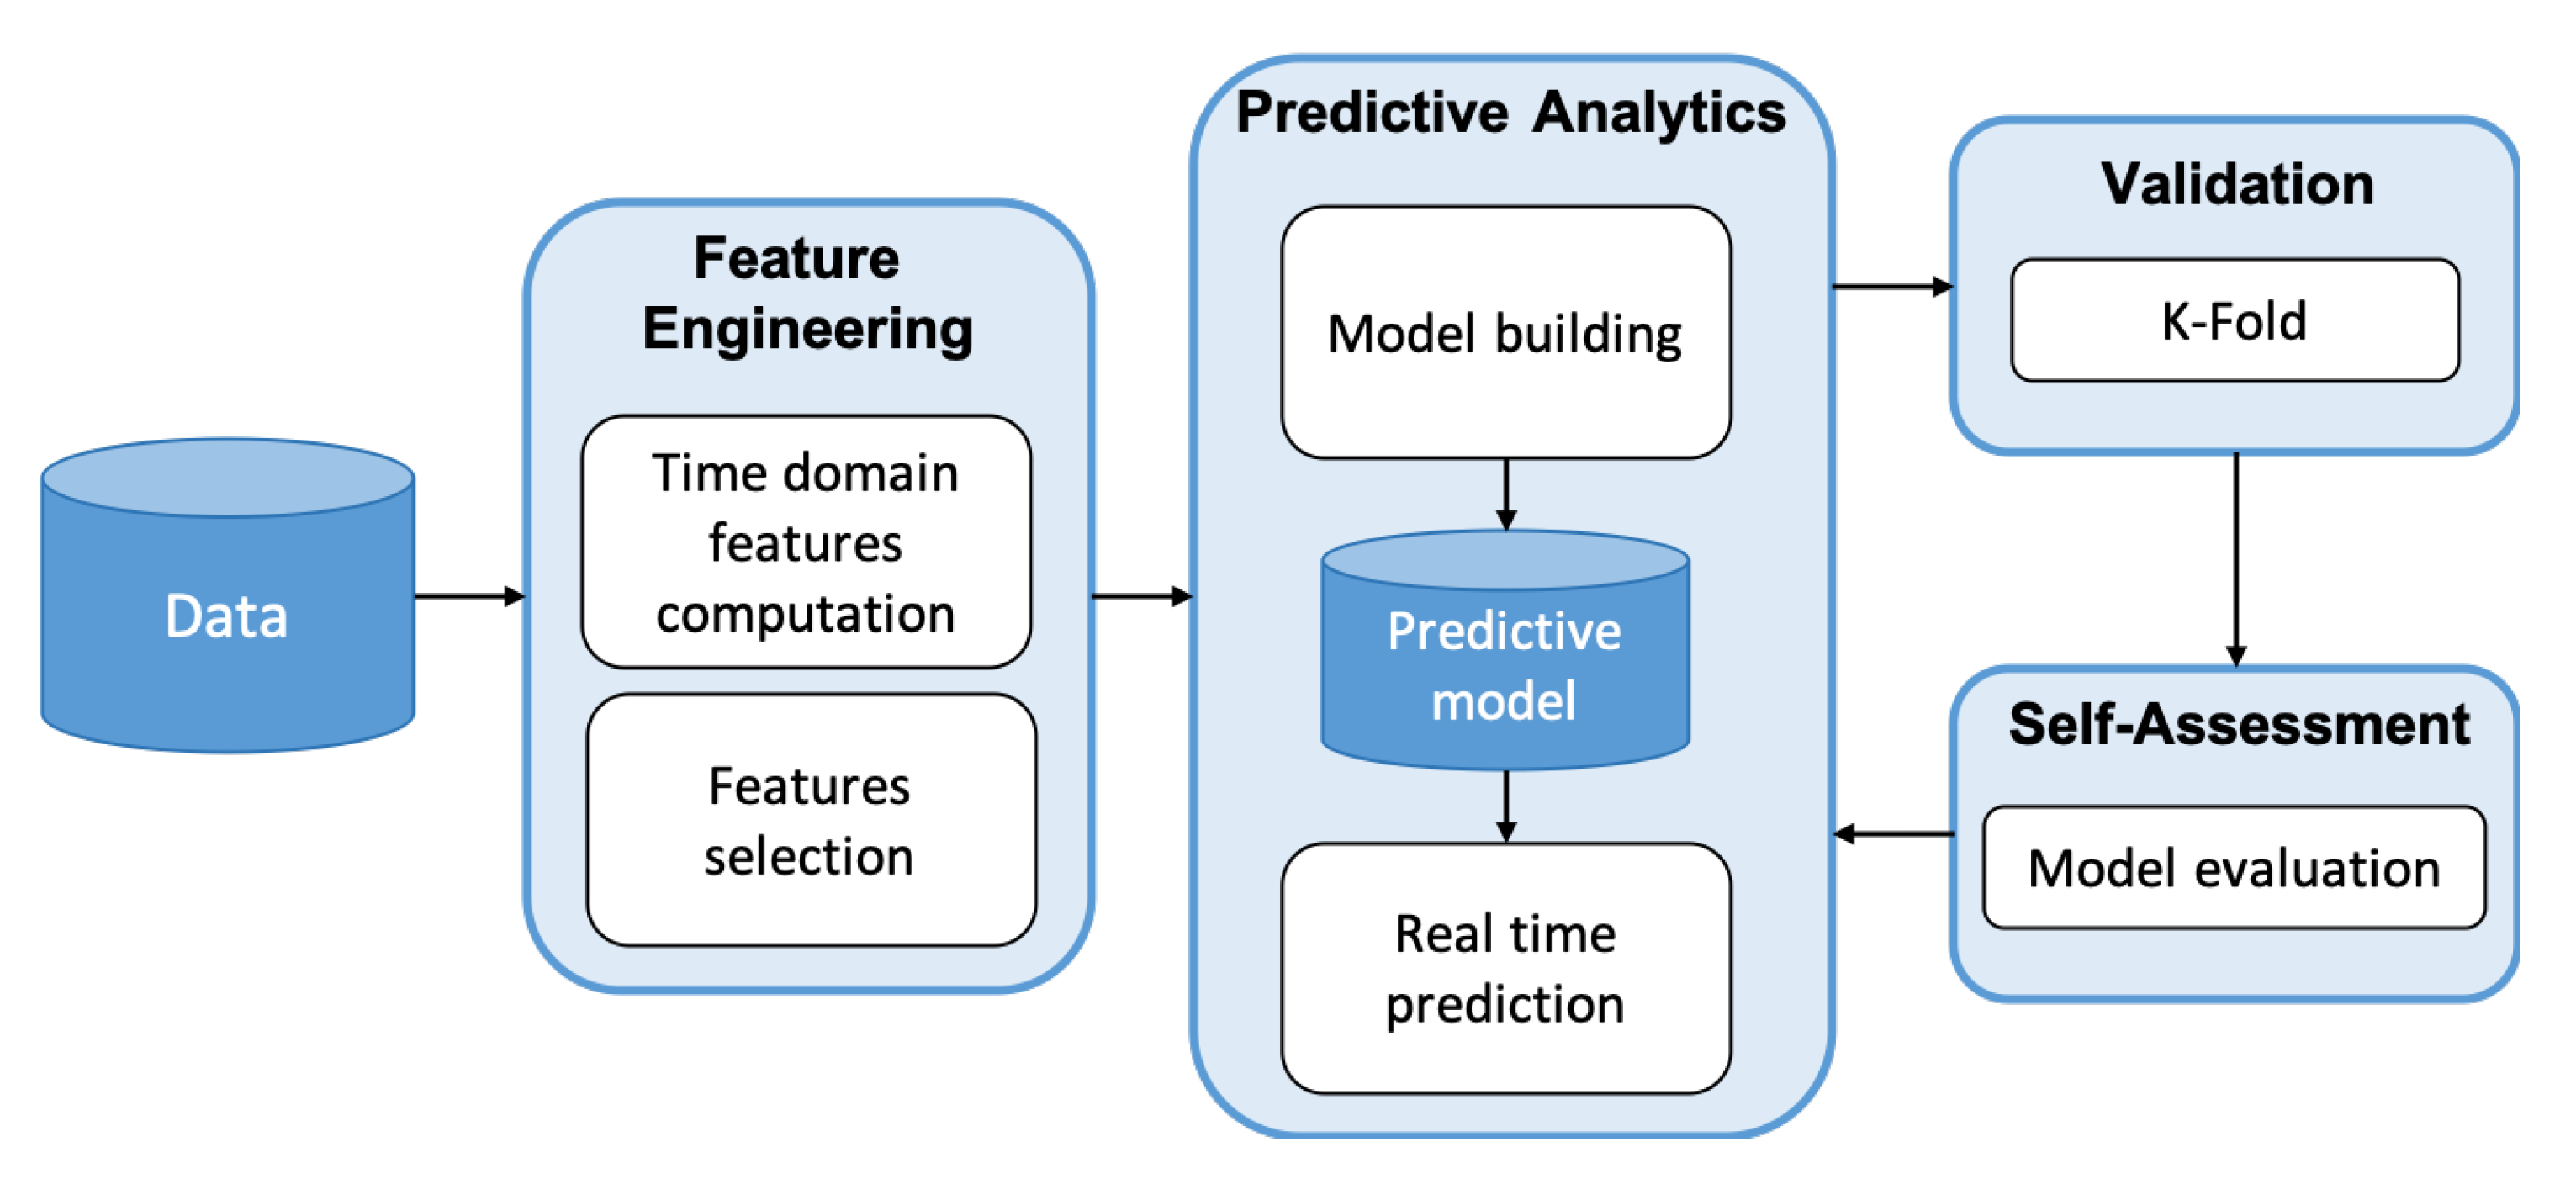
A general-purpose service suited to fulfill the condition monitoring and maintenance needs of modern companies in the context of industry 4.0 is proposed. The architecture of the analytical service proposed in this research, reported in
Figure 2, is flexible and it can be customized for any other use cases of interest (e.g., [
22]). The service is based on four main steps: feature engineering, predictive analytics, model validation, self-assessment.
Feature engineering. Industrial sensors monitor many production processes, that are usually repeated periodically and characterized by a specific duration. The feature engineering component is in charge of transforming and processing raw sensor data to extract the main features describing the signals. They are identified at the first stages of the raw data analysis process (i.e., clustering, correlation analysis, PCA, other) and implemented at a latter stage to reduce the amount of data communicated from the edge to the cloud. Specifically, each monitored cycle is divided in several segments over the time domain, to better extract the variability separately for each sub-cycle. Each segment is thus characterized by many statistical features (e.g., mean, standard deviation, quartiles, kurtosis, skewness, root mean squared error, sum of absolute values, number of elements over the mean, absolute energy, mean absolute change). These features are then used by the other steps of the analytical process to predict the outcome for each cycle.
Since the great number of computed statistical features, it is possible that the
time domain feature computation step produces a huge number of attributes and that, in some cases, this can affect the performance of the successive analysis. However, since it is possible that some features are highly correlated with some others in the dataset, the information gained by these attributes could be redundant and it can possibly produce noise in the
model building phase. Thus, to select the features that contain the most valuable information, the analytics engine includes a
feature selection technique based on the Pearson correlation test [
23]. Computing the correlation of each couple of attributes and removing those that are correlated the most, on average over all the (other) attributes, it is possible to identify which are the attributes that can be discarded without losing any accuracy in the model construction.
Predictive analytics. The predictive analytics block has the role to learn from the historical dataset and build a prediction model, to forecast the correct label for new incoming sensor data in the
real time prediction phase. The
model building process exploits a training phase necessary to extract the latent relations which exist between an historical set of signals and its labels (events to predict). The information contained in the features is analyzed by different scalable and transparent classification algorithms, available in the Apache Spark framework [
24,
25]: (i) Decision Tree [
26] (DT), (ii) Random Forest [
27] (RF), (iii) Gradient Boosted Tree [
28] (GBT). The chosen classification algorithms have been specifically picked for their interpretability: domain experts can indeed easily understand and inspect the main relationships between the input data and the outcome of the predictions. Once the model is built, the labels (and the probability to belong to a specific label) for new incoming sensors data can be forecasted by the
real time prediction. The trained model is pushed down to the edge to fulfill the need for short response time of the predictive models, in order to enable in-time corrective/preventive actions to take place on the shopfloor. Also for safety reasons for the human personnel as well as for preventing any robot/machine damage, that would be associated to additional expenditures. This would need a pre-trained model deployed close to the robot, getting data and processing in short time, providing results easy to understand and interpret by the human(s) in close proximity outputs.
Model validation. The performance of the predictive model built in the previous step has to be evaluated by the Validation block. In such phase, all the trained classification models are validated using the Stratified K-Fold Cross validation strategy and the values of precision, recall and f-measure are calculated for each class of interest. This step is necessary to understand which algorithm better fits the requirements of the given classification task (i.e., have higher values for the f-measure and the other metrics). The indexes computed to evaluate the training of the model require the information of the real class of the test data, namely a subset of labeled data kept apart during the training phase through a certain sampling strategy. Because of this reason, these approaches are not eligible to be used to evaluate the model performances on unlabeled data over time.
Self-assessment. It is common, especially in industrial production environments, that the nature of the collected data changes over time due to equipment degradation, the adoption of new machinery or to some environmental factors. The Self-assessment phase allows to identify if, due to changes in the production environment or in case of new labels not included in the dataset, the predictive model performance has degraded and so decides whether to trigger the update and retrain of model with newly arrived data.
The main idea behind the self-assessment approach is to exploit the changes in the geometrical distribution of the data over time to identify when the predictive model is no more performing as expected. Moreover, in real use cases, the ground truth label is often not available, thus, only unsupervised techniques can be exploited. The proposed methodology exploits a new, scalable version of a well known unsupervised index able to measure the intra-cohesion and inter-separation of clusters of data along. The exploited metric is the Descriptor Silhouette (DS) index proposed in [
29]. It provides an approximated estimation of the Silhouette index. The DS index ranges in
, as the standard Silhouette index, where a −1 represents a point that is distant from the distribution of the points to which it is assigned (bad assignment), while 1 describe a well assignment for the point in exam. Each record in the dataset is characterized by a DS score each time the self-assessment is executed, producing a Silhouette curve. Given a dataset characterized by class labels, it is possible to measure the cohesion and the separation of the data, before and after the collection of new incoming data. It has been proved experimentally that a variation of the geometric distribution of the incoming data w.r.t. the historical data corresponds to the presence of new unknown data. Then, the self-assessment service produces a measure of the percentage of degradation of the predictive model performance given by the following relation:
The degradation is calculated for each class
c learned by the predictive model and at specific timestamp
t. The degradation is obtained calculating the
Mean Arctangent Absolute Percentage Error (MAAPE) [
30] between the DS curve calculated with the training data and the DS curve calculated with all the data collected until time
t. This error is then weighted by the number of points predicted to belong to class
c (
) w.r.t. the cardinality of the whole dataset (
N). The coefficient
instead, give the sign to the degradation, describing if the mean silhouette is increased (negative sign) or decreased (positive sign), after the arrival of new unknown data. A positive sign of
represents a lower cohesion in the data, since the mean silhouette after the arrival of new data is lowered and thus the degradation is increased (the degradation is positive).
Remaining Useful Life estimation. A widely used indicator in industry about the condition of its assets is the Remaining Useful Life (RUL). The RUL of an asset can be defined as the time left to the end of its expected operational life and as it regards the functionality for which it was purchased for. The same asset operating under different conditions can be characterised by different degradation level, and as a result varying RUL values at the same point of time. As a consequence, the creation of a generic model, statistical or otherwise, for estimating the RUL value is extremely challenging if at all feasible [
31]. Nevertheless, the accurate estimation of the RUL value is a key component towards enabling predictive maintenance of a system. Thus, several efforts are underway to provide a solution to this problem. However, state-of-the-art algorithms, such as liner regression models, Hidden Markov Models, or Long Short-Term Memory Neural Networks, require extensive and complex modelling and training to estimate the RUL value, with limited efficiency.
To that end and towards overcoming the aforementioned limitations, this work proposes a novel methodology for RUL estimation. In particular, data collected out of different phases of an asset operational life are used to model its behavior at specified and labelled timestamps and support the identification of deviations from its nominal or ideal operational profile and other as well labelled profiles. More specifically, data acquired at the deployment of an asset on a shop floor can be considered as an ideal operational profile from which degradation starts to gradually deteriorate its operational behavior. Afterwards and during its usage for production purposes, data are used to estimate the deviation from this nominal profile. The distribution of the nominal set of key variables is calculated. Then the probability of each selected variable to belong to the nominal distribution is estimate using the Gaussian kernel density estimation [
32]. This probability representing the deviation of the two profiles can then be associated to the RUL indicator or similar, facilitating its estimation. The lower is the probability of each selected variable to belong to the data distribution of the correct functioning of the machinery, the faster is the degradation of object functionality, thus the lower is the RUL.
It should be mentioned that the set of selected as important variables for the aforementioned analysis can either be a-priori known, based on existing engineering/production knowledge or identified during the course of the data analysis by extracting features that may be used for pattern recognition and anomaly detection enabling in turn predictive maintenance activities. Afterwards, as the degradation level of the monitored equipment increases a drift from the initial distribution is detected, that can be associated to a decrease in the value of the RUL indicator. The deviation from the nominal profile or ”distribution drift” is evaluated through the self-assessment service and for the selected features.
Hence, the estimation of the RUL value in the context of SERENA and as presented in this work relies upon two main factors: (1) the joint
probability of the selected features with respect to their nominal profile or distribution, and (2) the presence of
probability drifting in the collected data over time. Both factors consist functions of time
t. At a random time
t, the percentage of the RUL value can be defined as follows:
where
refers to the set of historical data collected from the the beginning of the operational life to a time corresponding to the nominal or ideal operational profile of the asset under consideration,
refers to the new data collected from to time t,
corresponds to the number of new signals collected up to time t,
S is the set of relevant features for characterizing the degradation level of the asset,
denotes the distribution of the feature estimated from the historical data ,
refers to the probability of feature s as estimated out of a new set of data x to belong in the distribution ,
is the overall degradation estimated by the data collected from
to
t as measured out of the Equation (
1).
As a result, Equation (
2) estimates the percentage of RUL as a function of time by calculating the mean of the joint probabilities of each selected feature to belong to the ideal or nominal operational distribution, for each incoming set of data, weighted by 100 minus the percentage reflecting the probability drift at a time
t. The contribution of the drifting probability is calculated as 100 minus the percentage of degradation, reflected in the collected data, since an opposite analogy is considered between the RUL and the drift values.
Using the aforementioned concept as a basis, the SERENA system is able to estimate the RUL value of an asset, machine, robot, other. Moreover, considering a human-centered cyber physical production system, the proposed approach supports its customised tuning and configuration by the human user towards addressing different scenarios and assets. It should be noted that an important aspect of the presented approach and as part of the implemented SERENA system, is the knowledge of the domain expert for configuring the system and identifying the relevant or important features for the analysis. This knowledge is considered as part of the experience acquired during production and not knowledge that an equipment manufacturer could provide, unless monitoring the asset during its operational lifetime.
In addition the proposed RUL estimation approach supports the correlation to the drift measured by Equation (
1) to unknown or unmodelled knowledge collected over time through the analyzed features. This phenomenon is considered to represent degradation that cannot be effectively modelled due to its complexity and unknown correlation to the known asset variables and monitored characteristics.
4.2. The Scheduling Service
The result of the aforementioned predictive analytics service, a forecasted failure time horizon, is consumed by a scheduling service [
33]. The aim of the service is to prevent the predicted failure, by assigning the required maintenance activities to operators within the given time-frame. This service can be extended to consider the current production plan, hence fitting the maintenance activities within a given time slot to optimize production outputs.
The scheduling service has been implemented in Java following a client-server model. The service inputs include the monitored equipment, RUL value, maintenance tasks, including precedence relations and default duration per operation experience, and a number of potential operators with their characteristics, such as experience level. The server side includes a multi-criterion decision making framework, evaluating the alternative scheduling configurations, ranking them and selecting the highest ranked one. The client side communicates with the server side via restful APIs, supporting editing of tasks, resources, equipment, time series visualization, and process plan Gantt visualization.
The process time required to create a new schedule depends on the complexity of the schedule, referring to the number of tasks, resources, and their dependencies, along with the evaluated criteria.
4.3. The Visualization Service
The aim of the visualization service is to present the data, coming from the manufacturing process, in an effective and intuitive manner. It is an essential support for the maintenance engineers, giving them the opportunity to evaluate the status of the remote manufacturing process, and to the maintenance operator, who is responsible for performing the maintenance activity.
The visualization service can be considered as a set of information pages that integrate data and plant information coming from the manufacturing process, with the results of the predictive analysis. To effectively present real-time errors and predictions to the user in an intuitive way, the service uses a simplified, but realistic, 3D representation of the machinery. In addition, the user can display maintenance guidance and information pertaining to the mechanical and electrical components of the machine.
A Unity application that provides a real-time animation of the RobotBox 3D model via a web browser has been designed and developed. The live animation of the 3D model is achieved through a real-time data feed from the RobotBox controller, and the predictive information and machine status is obtained from the other SERENA services. The status of the component of interest is highlighted on the 3D model, along with its RUL. The 3D Virtual Procedure is an animated step-by-step guide, which shows the correct procedure to perform the maintenance operation. The concept is to evolve the typical text-based maintenance manual into an interactive 3D maintenance visualization, and so collaboratively guide the operator through the maintenance procedure.
The visualization service is also charged to show to the end user the information produced by the analytic services. The visualization service and the analytic services communicate through RESTFUL APIs, enabling also the monitoring of the performance for the predictive models used in the production environment. The monitoring of the predictive models performance, as explained in previous sections, is an important activity that should be always taken into account when dealing with real applications. The visualization service enables access to the information related to this task simplifying the understanding by non-expert users and the reliability of the models in production environments.
The information about the predictive model performance are showed in an interactive dashboard. The dashboard reports the precision and the recall information for the predictive model in production. Moreover, the dashboard shows an interactive section that exploits bar charts to describe the degradation of the model performance over time, for each learned class. The user can interact with the dashboard to see the details about the degradation at a specific timestamp. For the selected timestamp and for each learned class, the dashboard shows the silhouette lines produced by the self-assessment service though an interpolated scatter plot. More dashboard details are reported in
Section 6—Self-assessment.
4.4. Cloud Management and Communication Services
The cloud management and communication services provide the base functionality that implements the SERENA system.
Docker orchestrator service. The orchestrator controls the deployment and manages the life cycle of all services in the SERENA cloud. It ensures that the services are running and will redeploy them if part of the underlying infrastructure fails. Critical services, such as the central message broker, are deployed as resilient and scalable service clusters. The SERENA system implements its own local image registry, where the service images are stored. Running a local image registry reduces the security risk of directly accessing an Internet Docker registry, and ensures that the required images are always available from a trusted source.
As the edge gateways are part of the SERENA cloud, the orchestrator can automatically deploy services all the way to the edge. The analytics models are periodically retrained in the cloud, then wrapped as a Docker service and deployed to the gateways. The specific manufacturing process that the gateway supports is configured via the orchestrator using function description labels. Based on the labels the orchestrator will automatically deploy the correct services to the gateway.
Edge gateway services. The edge gateways collect and analyze raw sensor data from the manufacturing process, and are fully integrated parts of the SERENA cloud. Typically, two types of service are deployed to the gateway: a data flow engine and a pre-trained data analytics or predictive analytics. The data flow engine, based on Node-RED [
34], collects raw sensor data from the manufacturing process and passes it to the analytics service. The analytics service converts the raw time series data into features and encoding them into JSON-LD. JSON-LD is an extension of JSON that supports Linked Data, which allows data and metadata to be combined into a single context. The data flow engine then forwards the JSON-LD to the central message broker for distribution to the other SERENA services.
Regarding predictive analytics, the gateway represents a core component since it allows to fulfill different use case requirements and/or constraints. In the case of low latency, prediction is not needed (as is required in case of mechanical reaction in the actual process) or analytics algorithms require a huge amount of historical data which does not fit in the gateway storage; we can both train and execute predictive algorithms in the cloud in order to better optimize hardware resources and not overload equipment close to production. Otherwise, if the application requires to have the results of analytics services with high-performance constraints, the SERENA architecture offers a mechanism to deploy to the local gateway a model, trained in the cloud, whose output could be used in near real-time applications to easily perform the prediction.
Central message broker service. The central message broker service is the main communication hub of the SERENA system. To ensure its scalability and high availability, it is deployed as a resilient Docker cluster service. The broker exposes REST, MQTT and web service endpoints, which distribute messages between the cloud services and the edge gateways. In addition, the broker is intended to act as the access point for external facilities. Security is an important feature of the SERENA system, and the broker, as the communications hub, provides secure channels between the gateways and cloud services. It also validates the authenticity of incoming messages, and whether the requester is authorized to use the requested service.
Repository services. The SERENA architecture provides a number of repositories which hold various types of data used by the system, including the features and raw data repositories as well as maintenance manuals, data artefacts and information required by other SERENA services, such as maintenance tasks for the scheduler. The raw data repository is used for training the predictive analytics models. In addition, a metadata repository is included for storing contextual information connecting distributed stored and collected data. The repositories are implemented as stateless Docker services, the state being stored in external virtual volumes. Implementing the repositories as stateless services, enables a plug-n-play and dynamic deployment like the other services in the system.
5. Use Case Description
Given the high throughput of automation lines and the great number of robots involved in production, a common issue is the robot belts, working continuously for days at high cycles per minute ratios, suffering tensioning problems. The belts are used as transmission for the robot axes, and setting the tension is crucial for obtaining high levels of performance and precision.
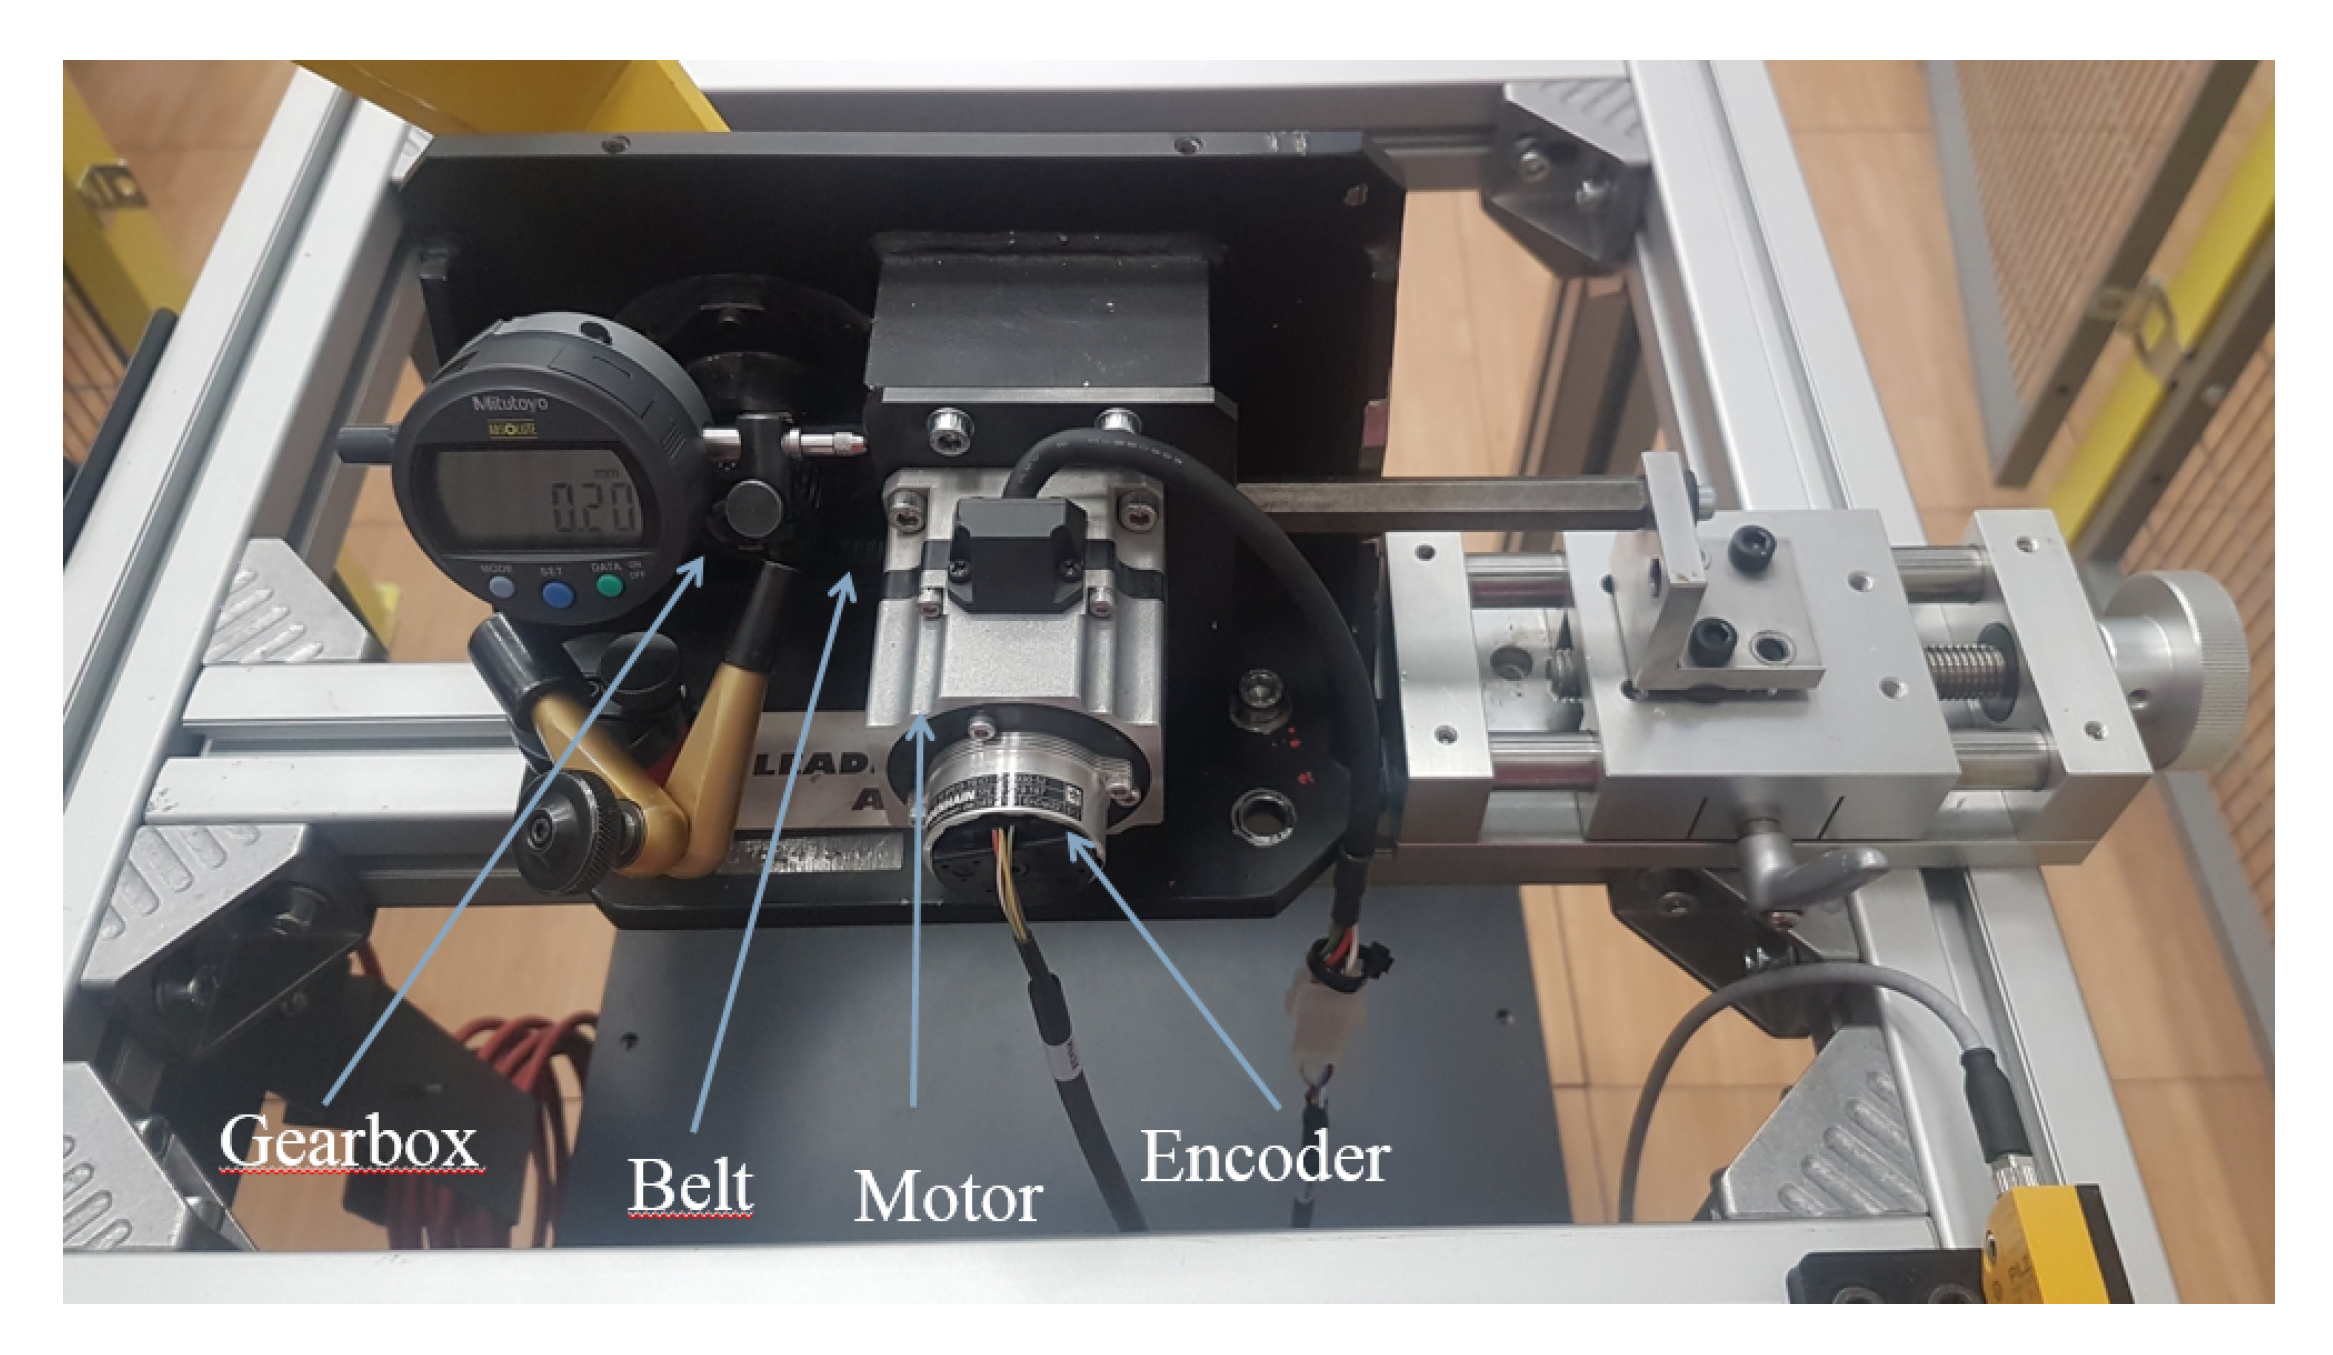
In factory plants, preventive maintenance policies are used to avoid production stops. Hence, the acquisition and analysis of failure data for predictive analytics is a challenge. To overcome the lack of failure data, since it would have been too complicated and expensive to manipulate an entire robot, a test-bed (
Figure 3) has been created, the
RobotBox. The
RobotBox is made of a motor equipped with an encoder (to read the actual motor axis position), a belt, a gearbox reducer, and a 5 kg weight to simulate an actual robot application. All components have been taken from a six axis industrial robot.
The decision to build the test-bed (RobotBox) instead of using an entire robot is not only due to the cost. Indeed, this simplification allows to better isolate the system from environmental factors such as weight of the links, inertia, vibration and so on. Thus, using the RobotBox allows to collect less noisy data and generalize the knowledge acquired to the entire robot axes.
In order to create a high quality dataset, changing the belt tension levels in a reproducible manner was necessary. Hence a slider was installed allowing a continuous change of the tension and a centesimal indicator, to measure the belt tensioning with respect to a pre-configured position. The distance between the gearbox and the motor is proportional to the belt tensioning.
In this work, only the current (in Amperes) used by the RobotBox motor is taken into account and used as input for the analytic component. The current is tracked by the RobotBox controller every 2 ms. Nevertheless, future works will consider fusing data of different sources.
The gateway collects data from the RobotBox and pre-processes the data in order to extract feature engineering for the analytics. The results of this processing step enriched by the result of already-deployed analytics models, remaining useful life or otherwise, is transmitted afterwards to the cloud node as a JSON file. Currently, and for the use case presented in this work, almost 1 GB of data are collected and transmitted per day, including raw data, extracted features, and analytics results of models already deployed at the gateway. Nevertheless, depending on the application, it could be sufficient to collect a smaller dataset with a greater time window.
Regarding computational power and bandwidth, the most impacting process is the prediction of the status of the machine, which is performed in runtime and at the gateway level. The response time, and hence the hardware setup requirements in terms of connectivity, data transmission, and processing/storage power, for the use case under discussion is expected to be within minutes. This is addressed by the aforementioned setup. More complex and time- or resource-consuming analyses, including the training and testing of new predictive models with new datasets as collected through time, take place at the cloud, and when a new model is created, this replaces the one deployed at the gateway.
6. Experimental Setting and Results
In this section the experimental setting and results related to the predictive analytics service are discussed in order to demonstrate its ability in correctly performing the prediction on real data. The analytics service, including both the model building phase and the real-time prediction, has been developed on the top of the big-data analytic framework Apache Spark [
24], along with the scalable machine learning library MLLib [
25]. The effectiveness of the proposed methodology is validated through a set of experiments, all performed on a Intel i7 8-core processor workstation, with a 32 GB main memory.
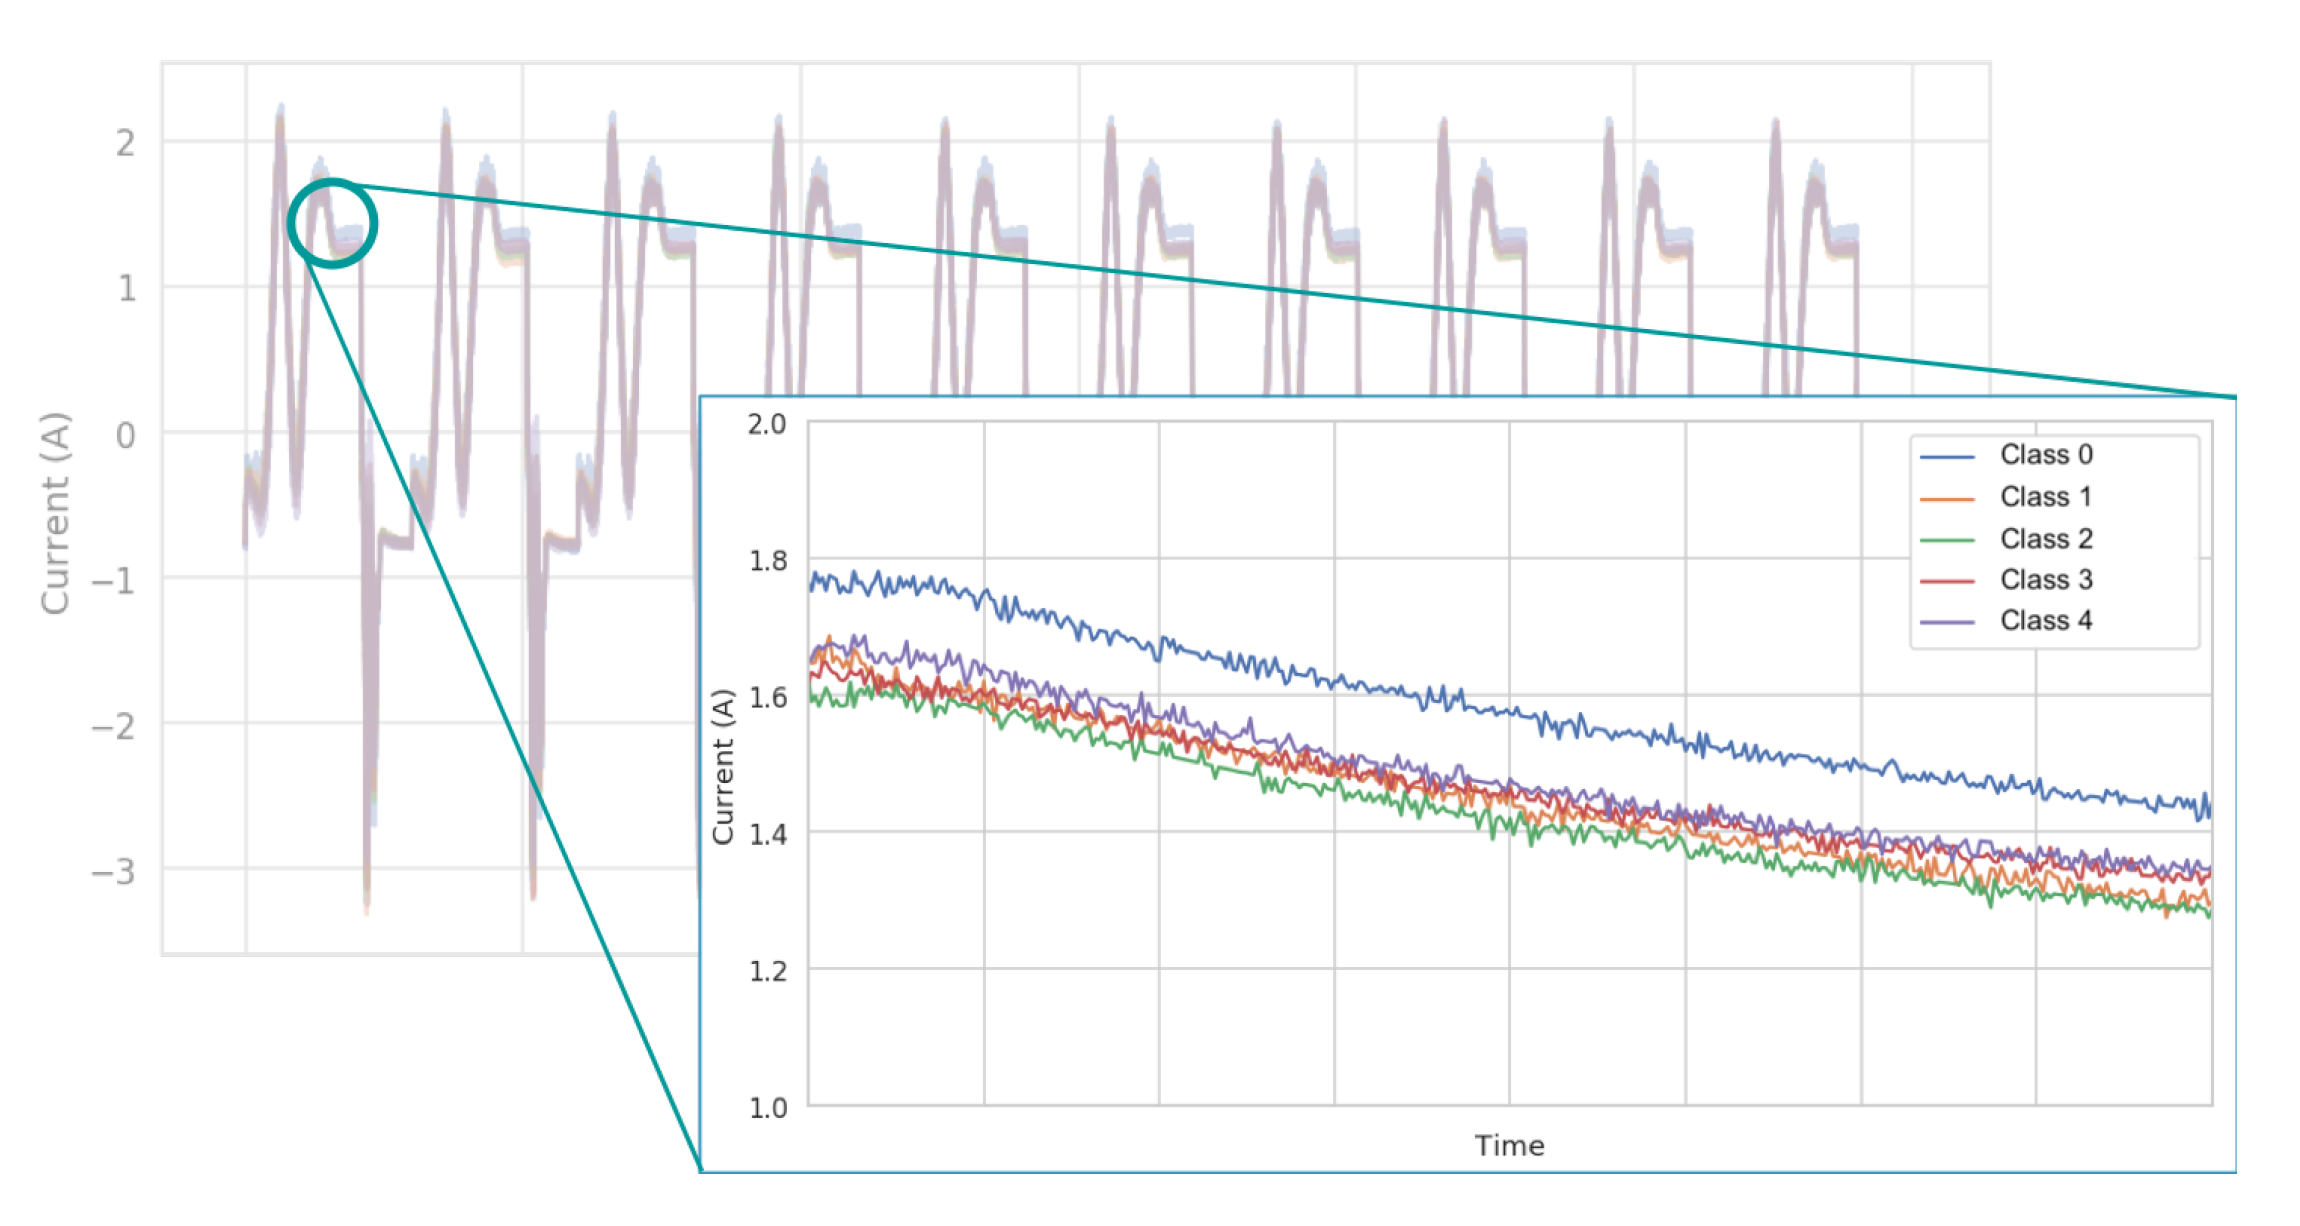
Using the slider installed on the
RobotBox, 5 different classes of tensioning have been defined: classes 0 and 1 refer to low tensioning, class 2 to correct tensioning and classes 3 and 4 to high tensioning.
Figure 4 shows an example of the current amplitudes values in Amperes for different level of tensioning.
Table 1 shows the number of cycles in the dataset under analysis, divided by class.
From the experimental results, the analytic service presented in
Section 4.1 turns out to be effective in predicting the class relative to the belt tensioning values given measurements of the current amplitude.
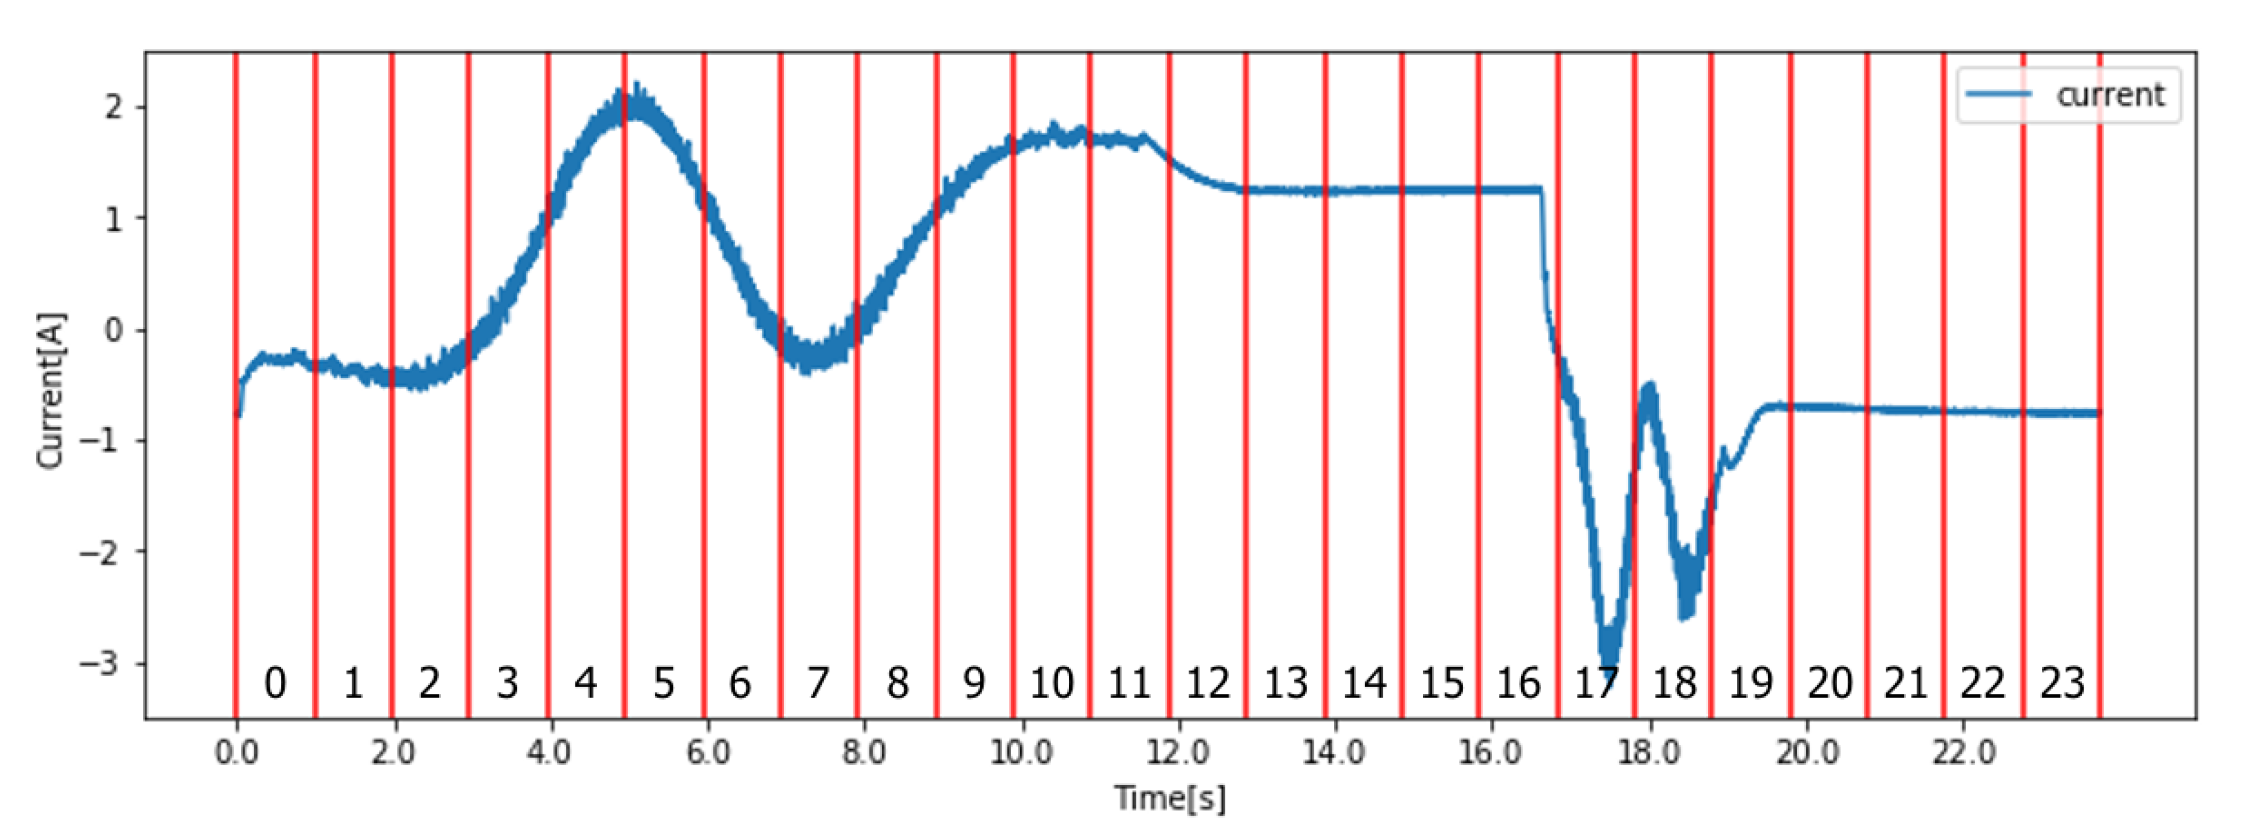
Features computation. Each incoming motor current signal has been divided into 24 segments (
Figure 5 shows the segments over a sample signal collected from the
RobotBox use case), and each segment has been characterized by statistical features (e.g. mean, std, quartiles, Kurtosis, skewness), for a total of 350 features.
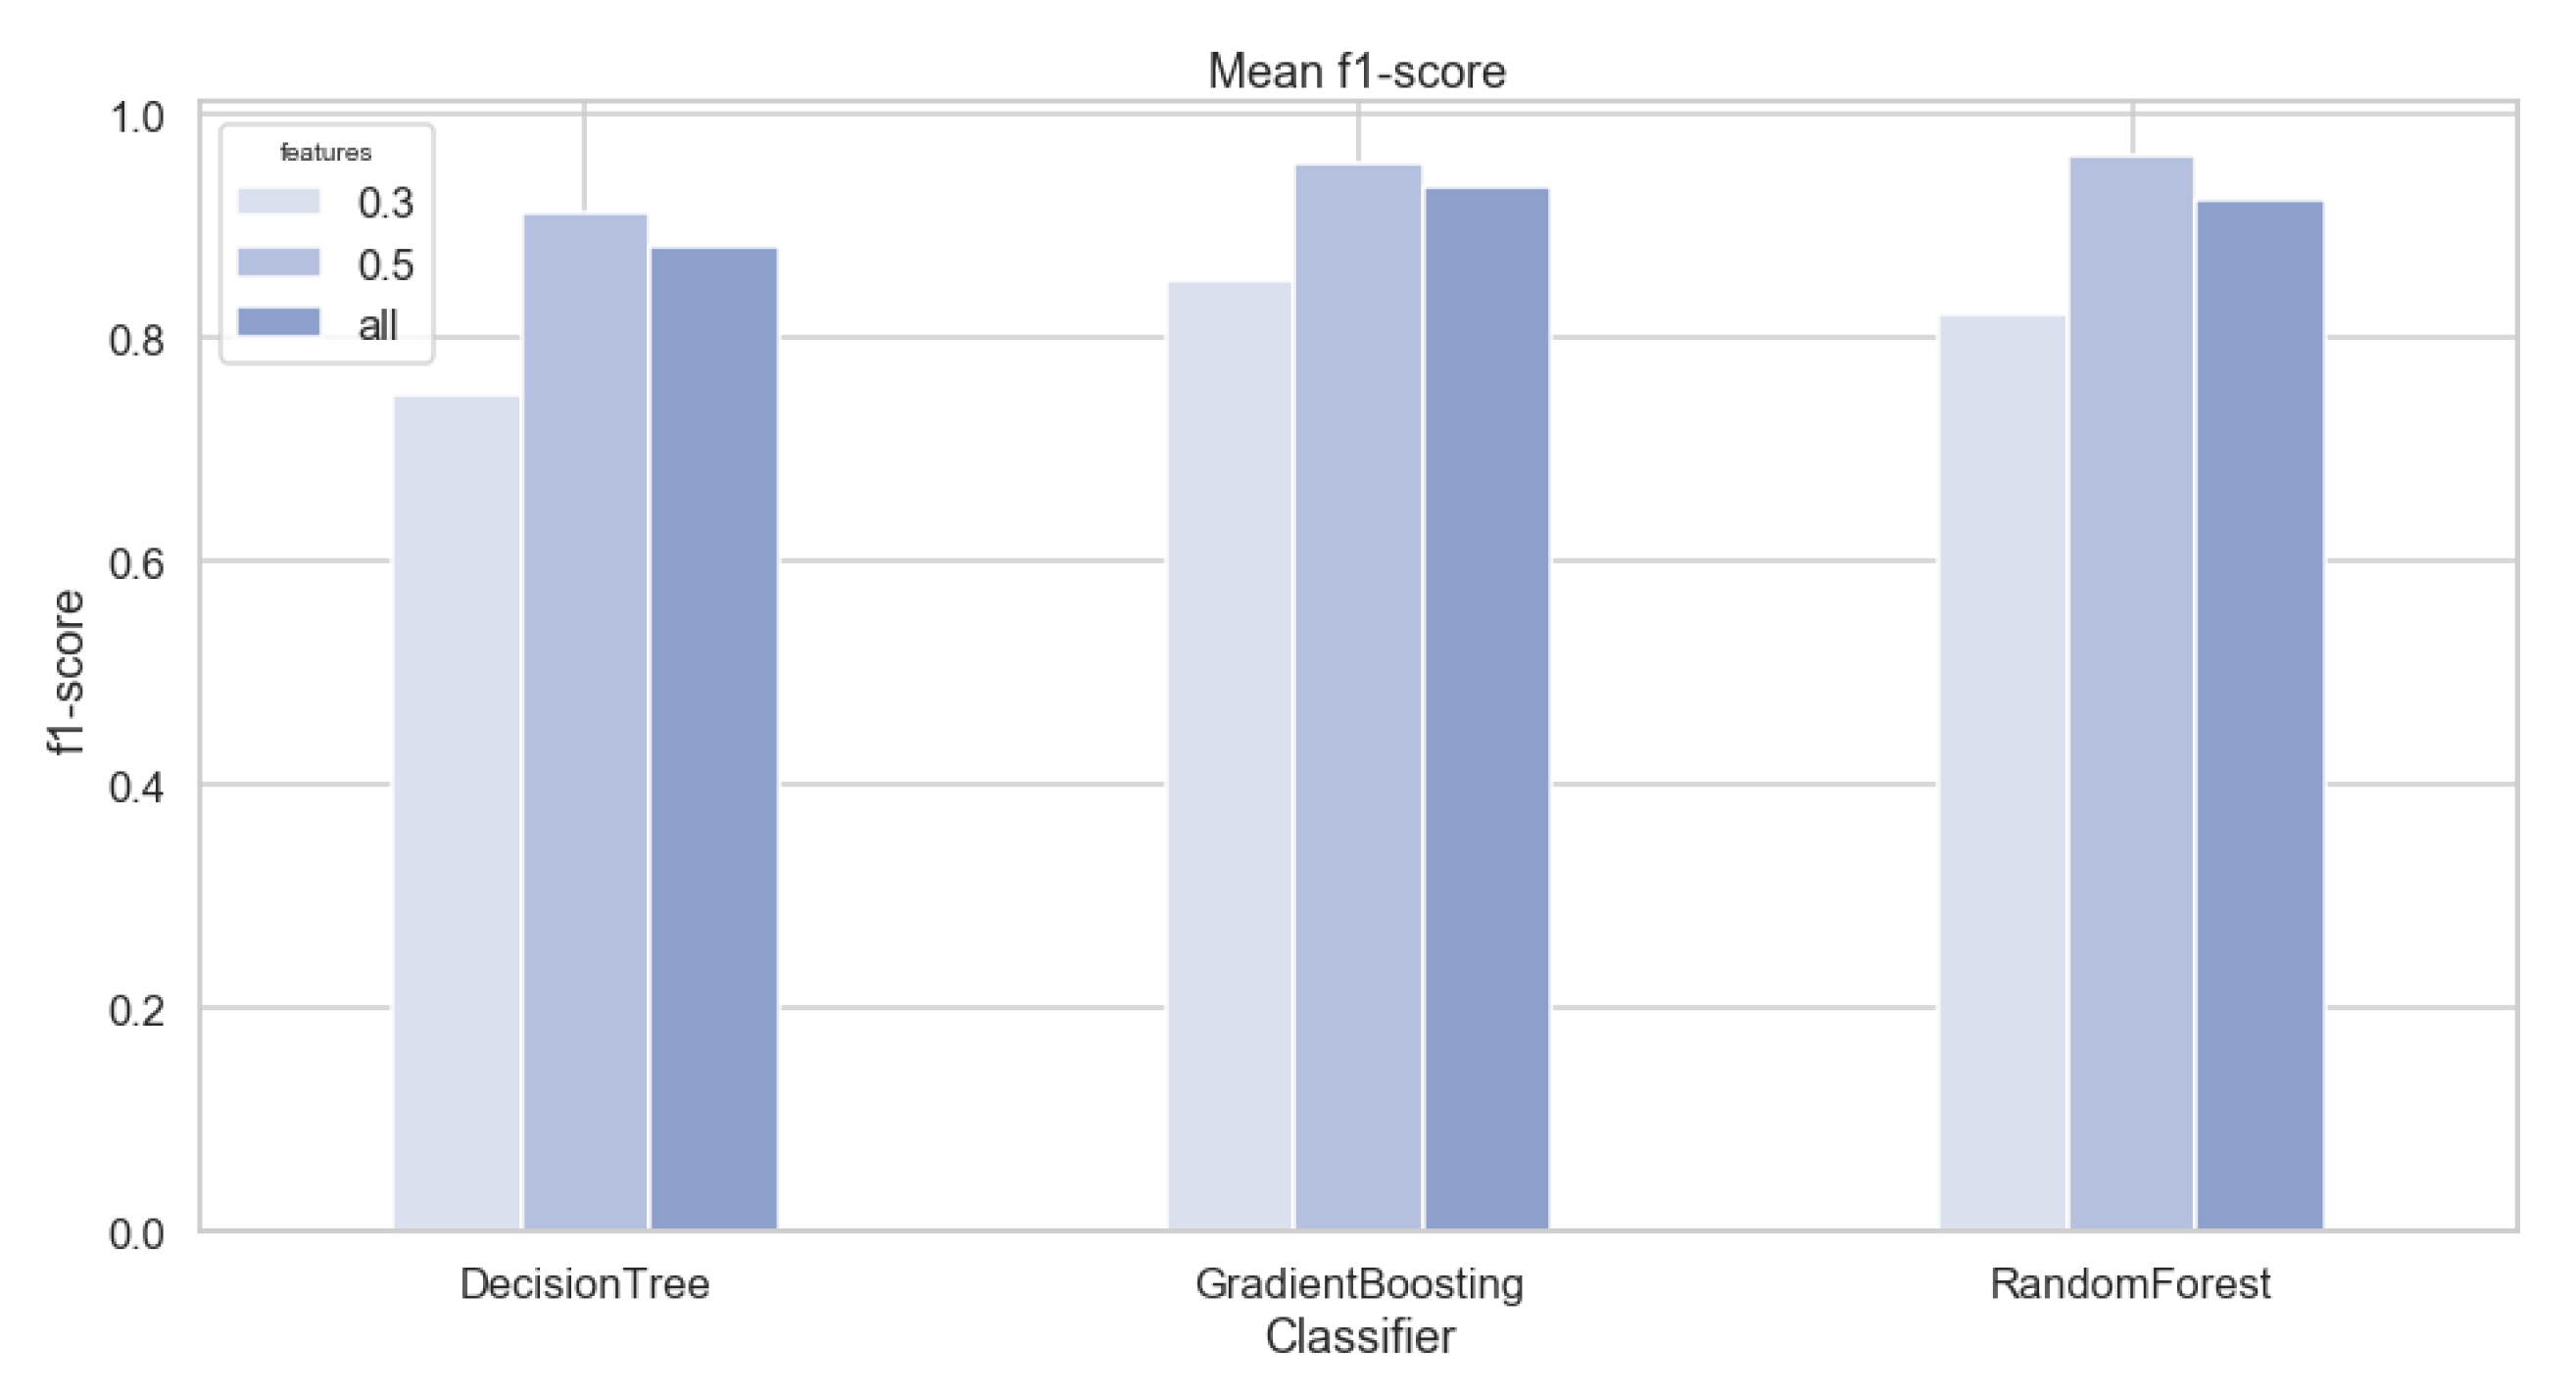
Features selection. Then, through the correlation test, the number of features is reduced choosing a proper threshold. From this step both the performance and quality of the predictive model will be affected.
Figure 6 shows the f-measure obtained without the feature selection step and with two different thresholds for the correlation test, 0.3 and 0.5. From the image it is clear that the threshold of 0.5 is outperforming the other two options with all the tested classifier while demonstrating the effectiveness of the proposed feature selection strategy.
Predictive analytics. The service performs a grid search over three different algorithms available in the MLLib library: Decision Tree (DT), Gradient Boosted Tree (GBT), Random Forest (RF). Each tested configuration has been validated performing a 3 fold cross-validation.
Table 2 shows the performance for each class of the tested classifiers after the grid-search with the stratified k-fold cross-validation.
The grid-search has been performed to analyze an exhaustive range of algorithm configurations including the max-depth of the trees ranging in
and the number of estimators ranging in
(just in case of RF). Based on the grid-search results, the proposed approach automatically selects the Random Forest (RF) configured with
max_depth:10 and
n_estimators:250 showing better results for all the classes in term of precision, recall and f-measure. RF and GBT have similar performances despite class 4 where RF is performing slightly better.
Table 3 shows the top 10 important features for the RF model along with their feature importance values calculated accordingly to [
35]. Feature names are composed by the name of the statistics and the segment identifier on which they have been calculated with the following format: <name_of_the_statistics>-<segment_id>. From the feature importance it is possible to notice that the most frequent statistical feature exploited by the RF model is the mean of the absolute change (i.e., the mean of the numerical differences between each couple of consecutive values in the segment) calculated in the first part of the input signals (segments 1, 4, 5, 6 and 10 in
Figure 5). Also segment 1 (i.e., at the beginning of the cycle in the acceleration phase) appears three times and segment 10 (i.e., the brake phase before idle phase) two times in the top ten features meaning that these segments are relevant for the prediction process.
The best model is then saved on HDFS or deployed on the edge enabling the real-time prediction step to be available both on the cloud or on premises.
In case of high performance constraints of the production environment, the model, trained on the cloud, can be deployed directly to the edge gateway. In this case the latency of the predictive analytics can be drastically reduced.
In the actual real case scenario, the edge gateway maintains a queue of incoming current signals and runs the edge prediction service that performs both the features computation and the prediction for each new incoming signal. The current implementation of the prediction service on the edge is able to perform the above two tasks (i.e., feature computation and real-time prediction) for multiple incoming signals, making the tasks parallel through a local deployment of the same spark service available in the cloud. However, to test the latency of the predictive analytic service deployed on the edge a dual core gateway with 4 GB of ram has been exploited receiving a flow of 1000 RobotBox signals in sequence. To assure its performance a sequential scenario has been simulated in which signals are evaluated in sequence one by one with no delay between each other. The edge prediction service reached, in the sequential scenario, an average computation time of 2.73 s with a standard deviation of 0.36. Considering that a robot cycle in the RobotBox use case last around 24 s, the performance reached by the edge prediction service are more than sufficient to have a real-time answer.
Self-assessment. The self-assessment service provides information about the reliability of the model, built on the historical data, over time.
To better evaluate the proposed approach, a model considering only the classes of data that usually are known by the domain experts has been generated. This is a likely assumption from the moment that usually, and especially in industrial use cases, for a given machinery, only some behaviors are known. Indeed, monitoring the malfunctioning of a machinery is a difficult task, since having a complete description of all the possible wrong behaviors is very complex: this motivation supports the role of this service in the SERENA cloud.
To assess the effectiveness of this service a model has been trained on the tension level dataset exploiting only the elements of classes 2 and 4 since they are supposed to be the known classes at training time. Then, a flow of new incoming data has been simulated exploiting the remaining classes in the dataset i.e., classes 0, 1 and 3. The test dataset has been injected in the SERENA platform and the self-assessment service has been triggered at specific timestamps. The test trigger’s timestamps has been measured in number of incoming samples to keep the analysis time independent and process independent.
For this reason, the self-assessment service has been triggered following the pattern in
Table 4. The cardinality of the data used to train the predictive model is reported in column
Training (), then, for each timestamp (
) the number of record for each class label injected is reported. Row
New data % shows the percentage of data that is new w.r.t. the data used to train the model, while row
Drift % reports the percentage of drift included at each timestamp.
From
Table 4 it is possible to notice that from time
to time
only data from known classes have been injected, then, starting from time
, class 0 is injected, followed by class 1 (from time
) and then by class 3 (from time
).
The graphs in
Figure 7 are extracted from the SERENA dashboard. They show the degradation of the model trained on classes 2 and 4 over time.
Figure 7a,b show the percentage of degradation measured by the self-assessment cloud service. From the charts it is possible to notice that until time
no degradation occurs, reflecting what expected from the injection pattern: only data with a known distribution has been collected by the system and the performance of the model remains unchanged.
Then, at time class 0 starts to be recorded by the system, however, this data has an unknown distribution to the model under analysis, since class 0 was not present in the training dataset. At time the self-assessment service shows a clear degradation of model performance, correctly identifying the presence of the new unknown distribution of data. The degradation then continues to increase until time correctly identifying the increasing of the drift with the new incoming data.
In particular it is possible to notice from
Figure 7a that label 2 is the class mostly affected by the presence of concept drift, while label 4 is slightly affected only when new data belonging to the unknown labels 1 and 3 are injected in the system.
Thus, the self-assessment service allows to correctly detect per-class predictive model performance degradation over time.
The interactive dashboard allows also to select a specific timestamp showing the details of the degradation w.r.t. the information learned at training time. It is possible to analyze the details of the silhouette curves calculated by the system at training time (silhouette base) and calculated after the arrival of new incoming data (silhouette degraded) comparing their trends in
Figure 7c,d for what concern degradation at time
and
Figure 7e,f for time
.
Comparing the curves in
Figure 7c,d they show that no degradation has occurred at time
since the curves are almost overlapped. While, analyzing the curves in
Figure 7e,f is possible to notice that the most degraded class is 2, showing a highly degraded silhouette curve (dotted curve) w.r.t. the base silhouette calculated at training time (continuous curve). Class 4 is instead softly degraded since it was affected mainly by the new classes 1 and 3.
In this case, a quantitative comparison of the proposed approach with state-of-the-art methodologies proposed to estimate model degradation over time was not performed, since to the best of the authors knowledge none of the available data analytics solutions in literature [
36,
37,
38] are capable of self-evaluating a predictive model degradation over time when ground-truth class labels are not available. Thus, any comparison to such approaches would not be objective. Techniques like [
36] are limited to detect abrupt concept drift due to context changes and they are not able to correctly deal with slowly drift as in the context of degrading flows of production data. In addition, strategies like [
38] have been developed and tested in very domain specific use cases, while the generality of the approach proposed here has been proved in [
29,
39]. Furthermore, the proposed concept drift detection strategy has been proved to reach near real-time performance even in big-data environments [
39] and to the best of authors knowledge no other solutions addressed this scenario.
Remaining Useful Life (RUL) estimation. The current implementation of the RUL estimation features a tunable approach for estimating the level of degradation of a machinery. In the presented experiments, relevant features to be included in the estimation of the RUL have been defined by a domain expert and validated under a robotic industry use case.
As described in
Section 4.1 the motor current signals are split in 24 segments to characterize each phase of the robotic operation. A sample current signal along with its segments is depicted in
Figure 5. When dealing with mechanical machinery, domain experts usually posses the knowledge to recognise the most arduous phases of robot activity that, in the long term, are the cause of its degradation.
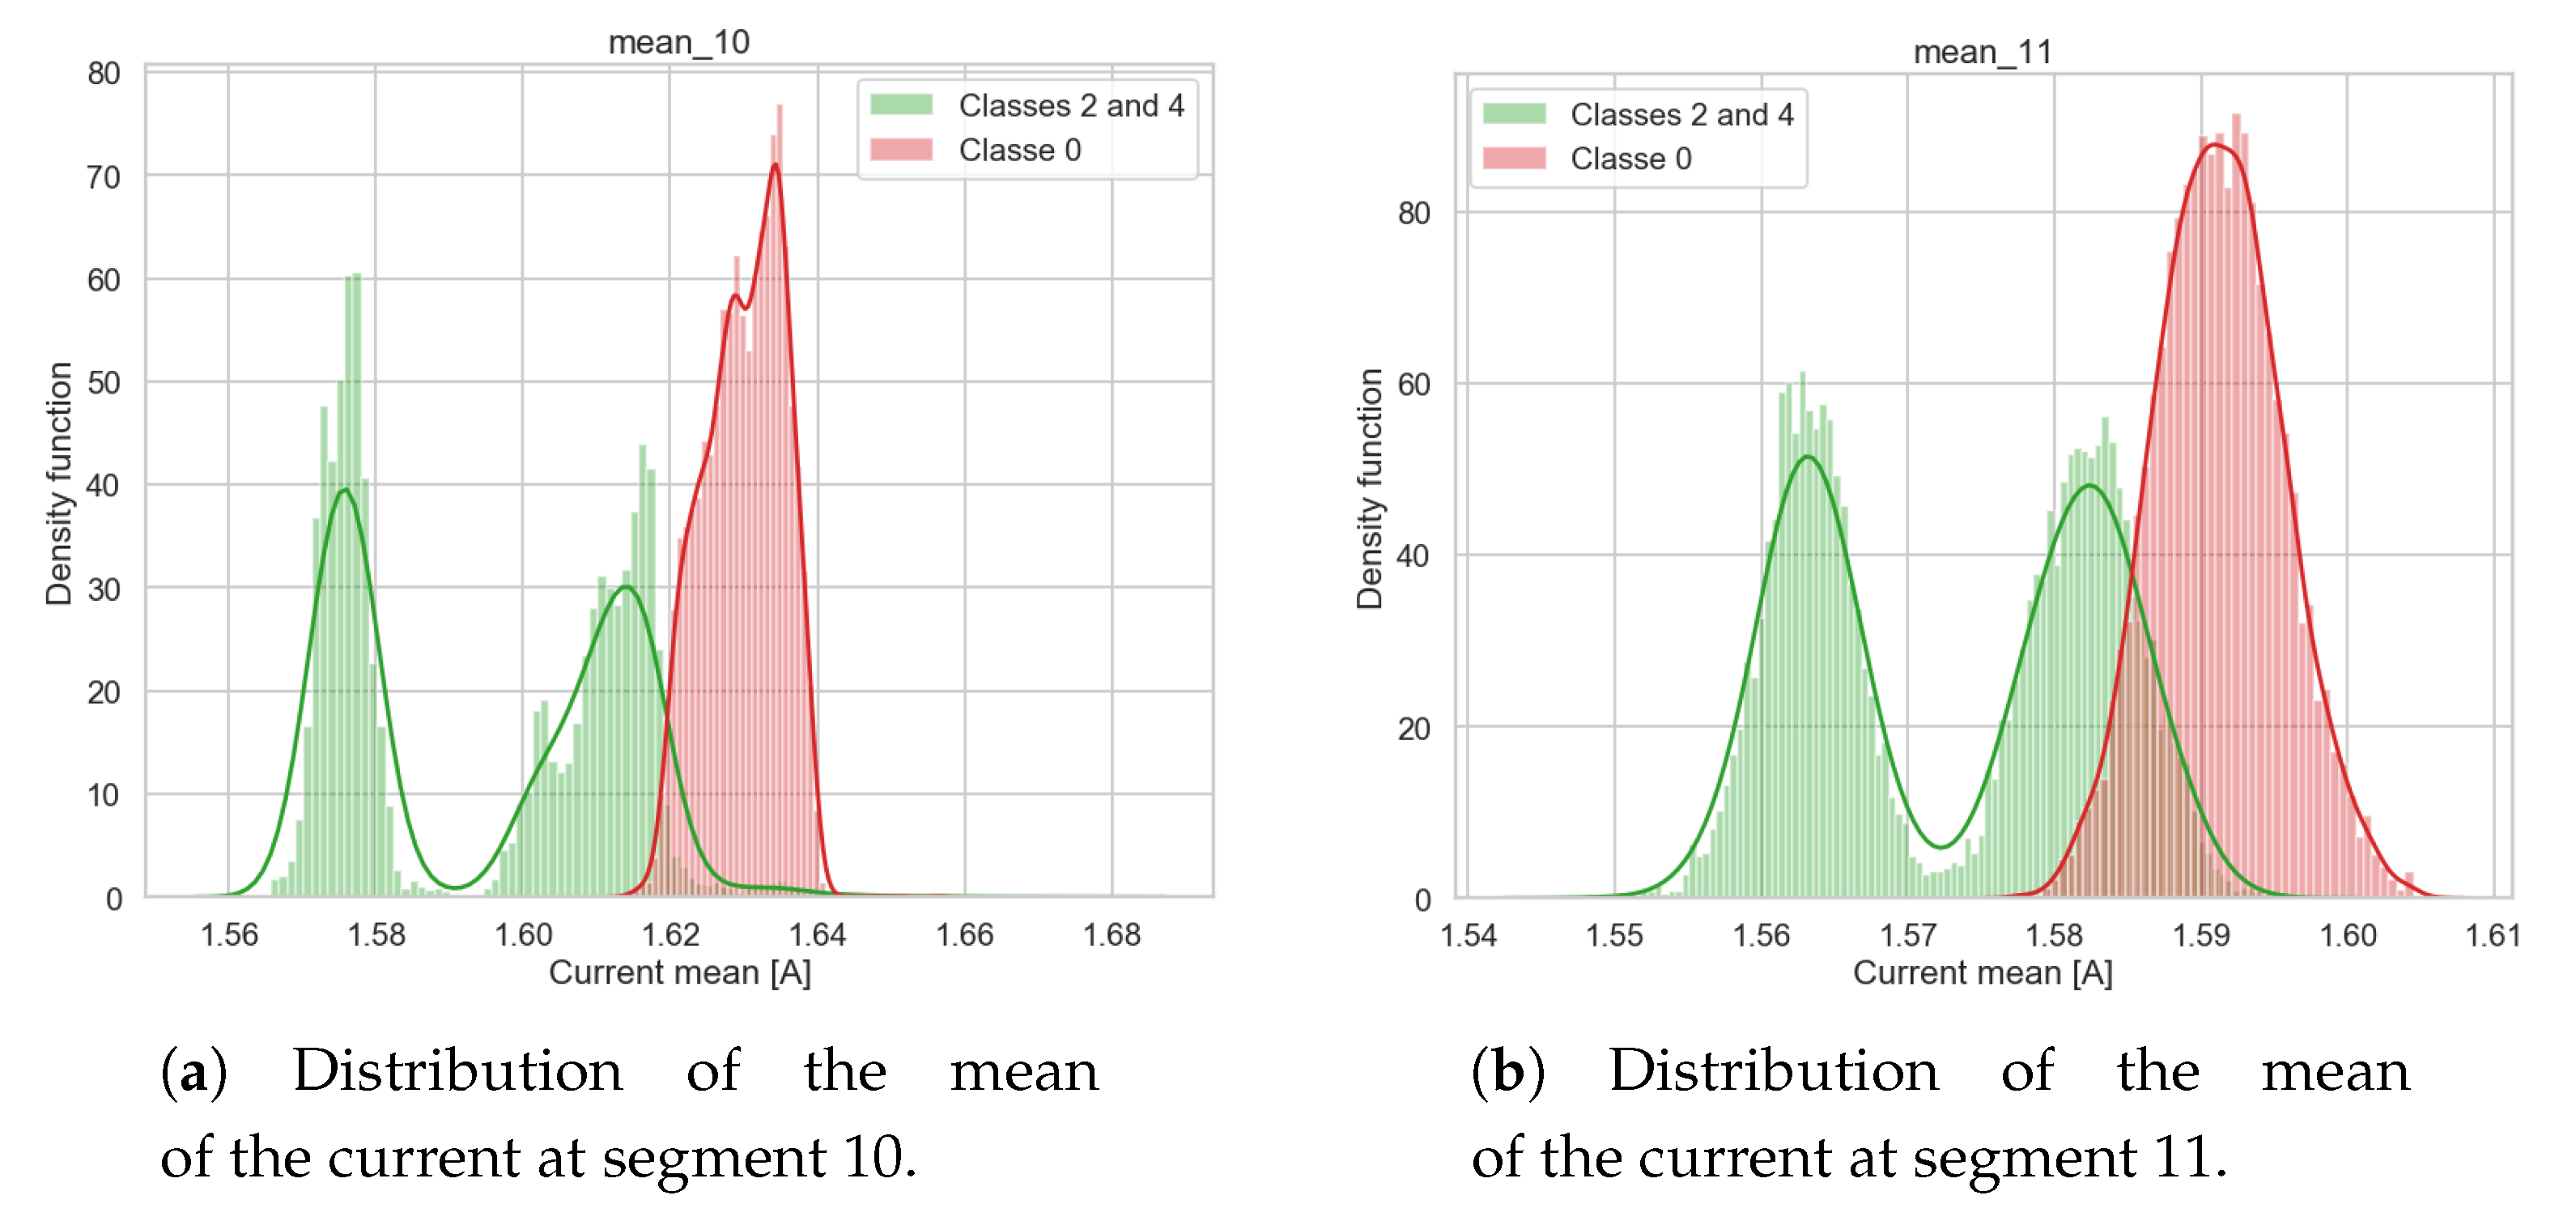
In this specific use case the phases in which the motor is breaking down before the idle phase (segments 10 and 11 in
Figure 5) have been selected as the phases affecting most its remaining useful life. To summarize the current signals in segments 10 and 11, the means of the current values have been calculated separately for each segment and each
RobotBox cycle.
Figure 8a,b show respectively the Gaussian kernel densities as estimated for the nominal/correct classes 2 and 4 and for the classes describing the machinery degradation i.e., class 0. However, in a real-life setting, only the correct functioning of the machinery is known as used in the proposed RUL estimation (i.e., the distribution of classes 2 and 4) while the distribution of signals when the machinery is degrading are not available (i.e., class 0). Nevertheless all of them are reported only to demonstrate that the Gaussian kernel densities represent a simple and easy to understand and interpret approach for summarizing the nominal profile and behavior of an asset versus profiles representing different evolving degradation stages. Given the distribution of the correct and known operational profiles (i.e. classes 2 and 4) the probability of a new robot cycle, in terms of current mean value in segments 10 and 11, to belong to the distribution of classes 2 and 4 is an indication of whether the robot cycle under analysis is still included in a correct range of values or not and its probability. In other words, if the probability of a feature (current mean in segment 10) belonging to the distribution of classes 2 or 4 is high it can be interpreted that the
RobotBox is still working as expected. Then if the probability decreases over time it means that the
RobotBox is gradually moving to higher degradation levels, thus the probability distribution of the current signals probably fits under class 0.
To simulate a real scenario for the estimation of the RUL of the
RobotBox, where only its correct functioning is known, the same data injection pattern described in
Table 4 has been exploited from time
to time
using classes 2 and 4 to simulate the correct functioning of the machine and class 0 to simulate the its incorrect functioning.
In particular, in the context of SERENA, the Gaussian distribution of the current mean value in segments 10 and 11 is calculated separately by analyzing all historical signals collected from the beginning of the
RobotBox life to time
. Then, for each timestamp
the percentage of RUL is estimated via Equation (
2) with new data from each cycle as shown in
Table 4.
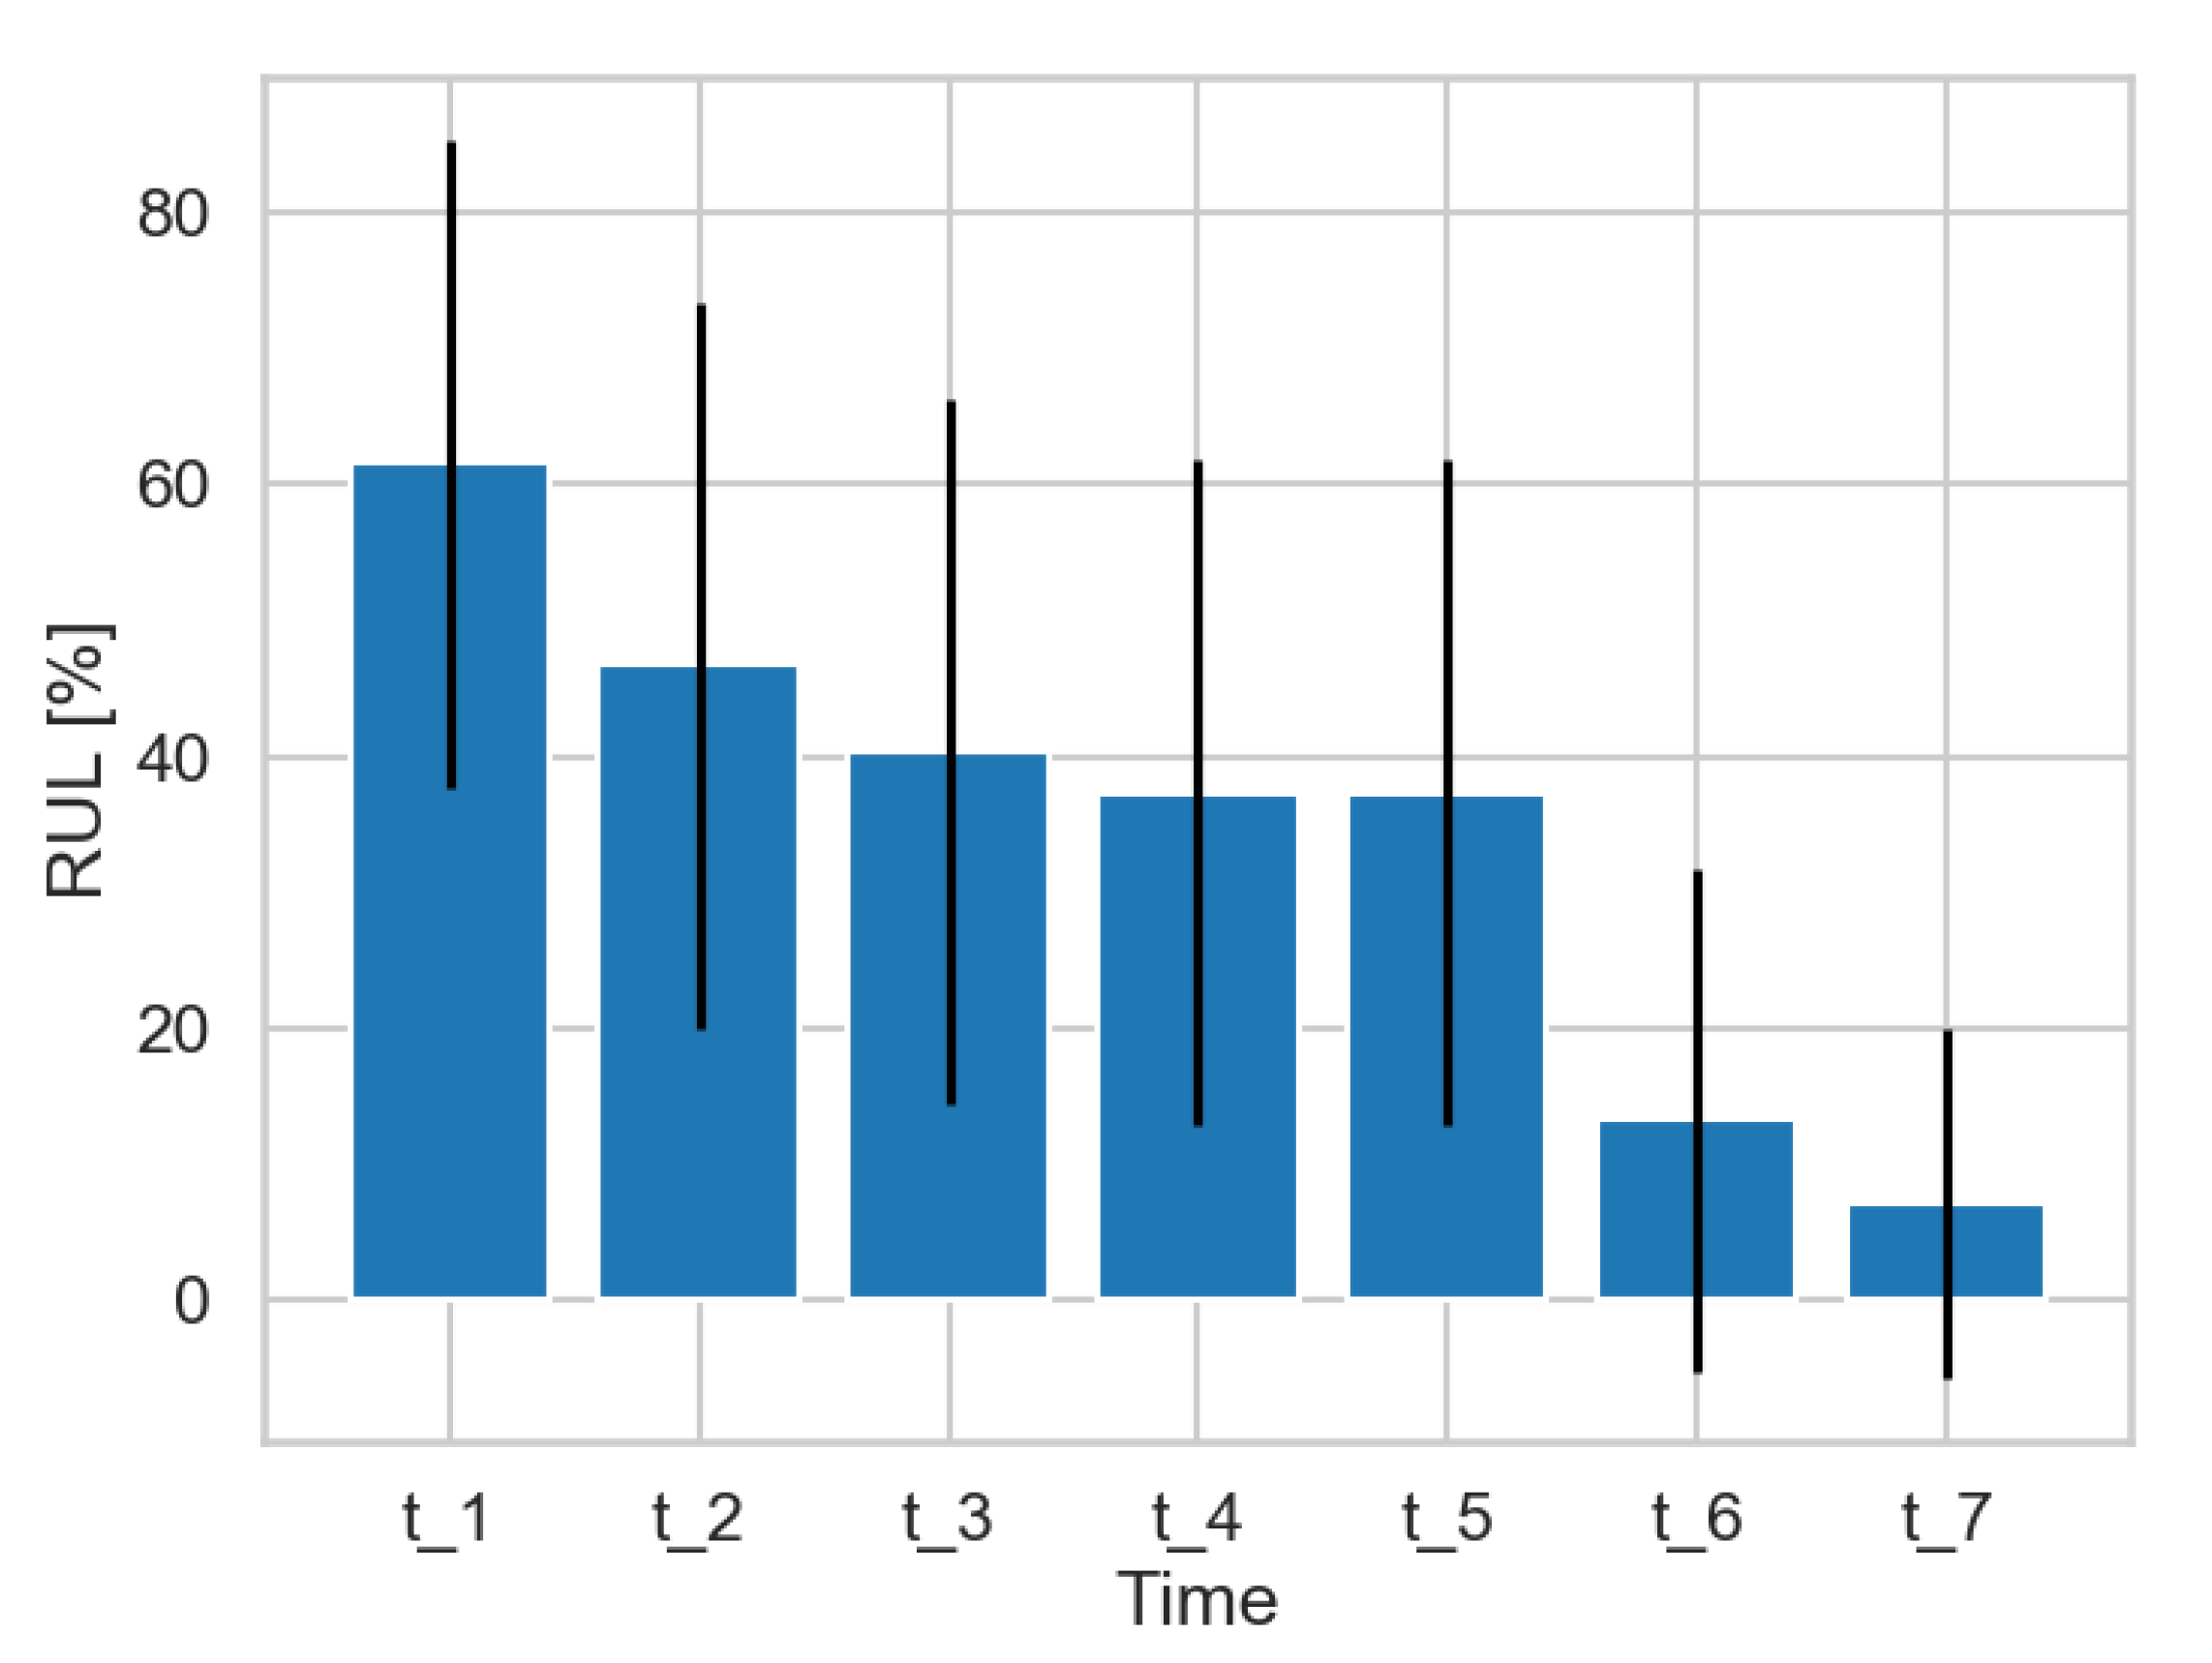
Figure 9 shows the RUL value estimated at each timestamp from
to
along with their error bands. As expected, the trend of the remaining useful life is clearly descending over time. At the time
only data belonging to the correct functioning is collected showing an estimated RUL of almost 62% with an error ranging between 40% and 85%. As soon as more data belonging to the correct distribution are collected the RUL slowly decreases as a result of the
RobotBox’s natural degradation. Then, starting from time
, data belonging to the wrong (unknown) functioning of the machine are injected and the RUL value is decreased to 13.30% at time
and to 7.18% at time
. These results were assessed with domain experts in the robotics industry, verifying that the high error in the RUL estimation in time
is a result of the limited number of robot cycles analyzed.
Scheduling. In the current experiment, a schedule triggered by a RUL estimation, as provided by the predictive analytics service, was generated in approximately 11 msec, and included the execution of two tasks; machine inspection and replacement of the gearbox, along with three potential resources; (1) a team of one newcomer and one of middle experience, (2) one newcomer and one expert and (3) one expert. The difference in task completion time as well as their cost are presented in the
Table 5, per task.
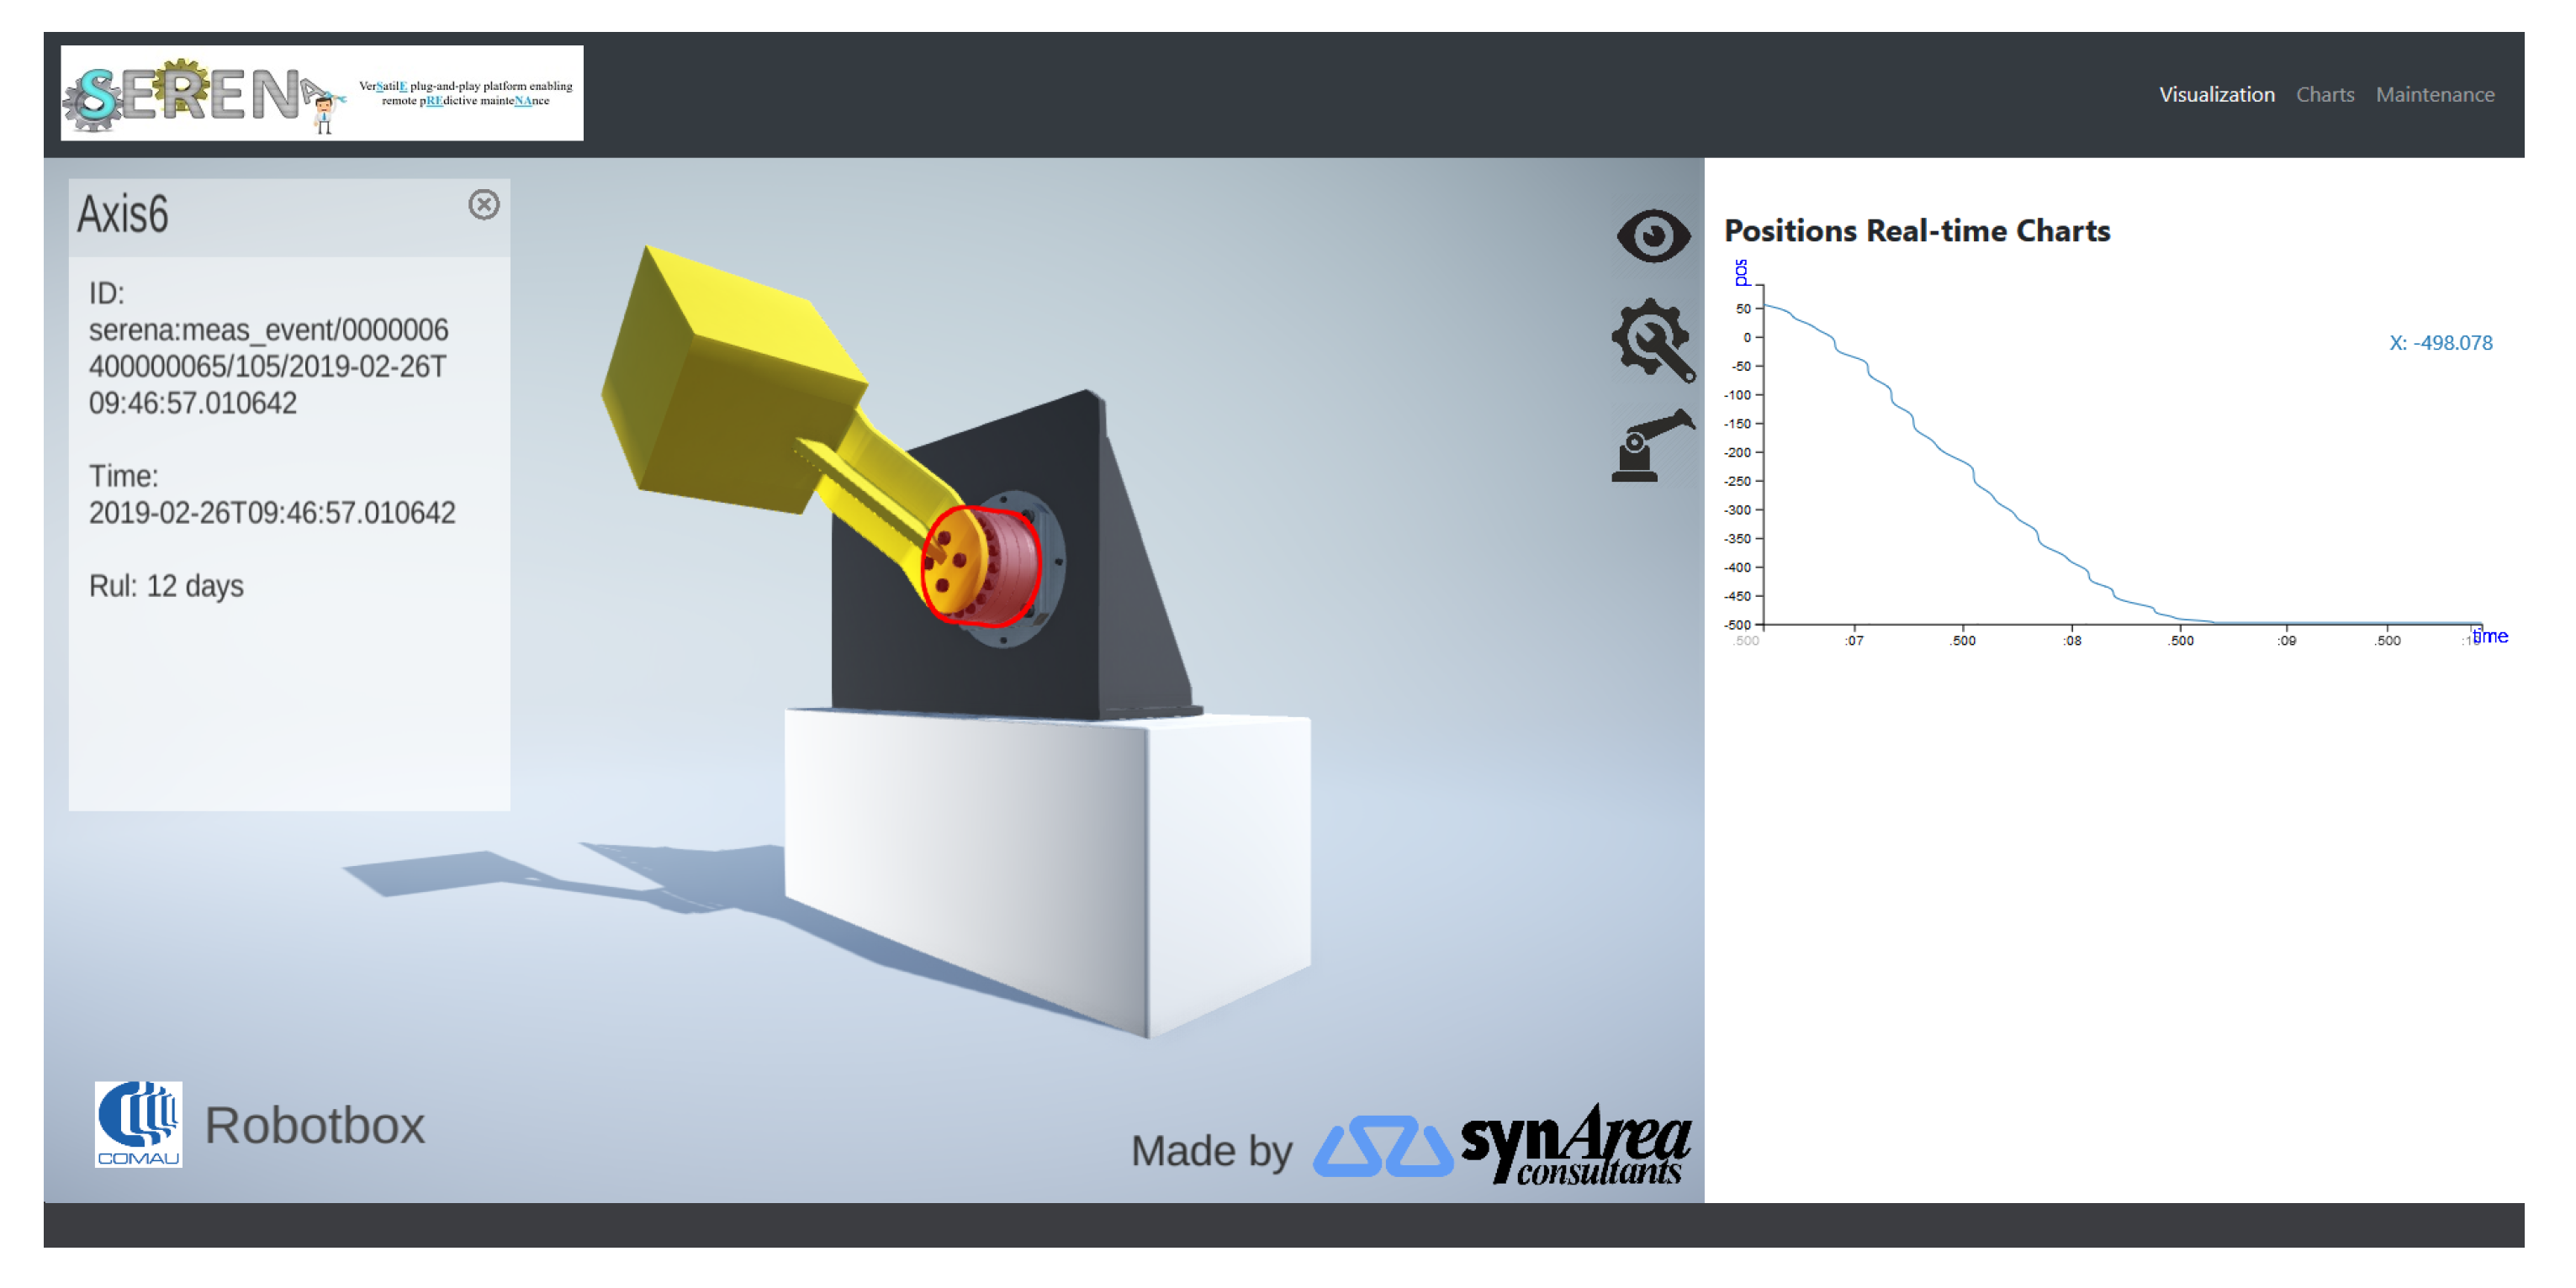
3D model visualization. This service is part of the SERENA cloud, and visualizes the 3D model of the
RobotBox, along with its real time movement, prediction information and a 3D virtual maintenance procedure.
Figure 10 shows a screenshot of the service interface that includes the real time position chart of the axis of rotation, which at runtime is mirrored by the movement of the yellow arm. The top bar provides links to: the “Charts” panel, which presents visual charts of the analytics information coming from the prediction service; and the “Maintenance” panel, which provides a step-by-step animated guide.

 ,
, 


