1. Introduction
Cyberattacks are becoming increasingly more sophisticated. For example, zero-day attacks exploit undisclosed vulnerabilities and advanced persistent threats (APT) attacks consist of multiple phases of attacks for a long period of time. With traditional intrusion detection systems based on signature and anomaly, it is challenging to detect these sophisticated attacks.
Signature-based intrusion detection systems (S-IDS) depend on known signatures to detect cyberattacks. There are two issues with S-IDSs. First, new attacks cannot be detected because new signatures are only obtained through post-analysis of attack events [
1,
2]. Even variant attacks are hard to detect as attackers work around the known signatures. Second, as the number of signatures increases, it is challenging to scale the detection mechanisms without impacting performance [
3].
Anomaly-based IDSs (A-IDS) detect cyberattacks by comparing the system behavior with pre-defined normal behavior [
2,
4]. A-IDS can be effective for unknown attacks as it does not rely on known signatures. The major issue with A-IDS is the large number of false positives generated [
5]. In simple applications, it is easy to define a normal behavior of the system. However, it is challenging to define a normal behavior in today’s complex applications running in an N-tier architecture with dynamic features [
6]. These applications obfuscate normal behaviors and thus create much false positives with anomaly detection based on a simple outlier detection.
Machine learning (ML) techniques are being actively employed in anomaly detection as an alternative to these issues. ML-based anomaly detection trains historical datasets to define normal behaviors and detect outlier events as attacks [
5,
7]. Although processing of massive datasets would help to set a flexible threshold of detection, there are still issues with false positives due to overfitting and unoptimized hyperparameters [
8,
9].
Most of existing S-IDS and A-IDS, including ML-based A-IDS, focus on a single computing or network element, whereas we focus on multiple elements. We use the terms element or host interchangeably to denote the computing or network element. Focusing on multiple elements in time and space rather than that of a single element would provide further evidence of an attack. Furthermore, this approach contributes to locate root causes by tracking the spatiotemporal behaviors.
In order to define the spatiotemporal attack patterns, we develop fundamental and essential behaviors that should appear in any attacks. We carefully study intrusion datasets as well as attack classifications including CAPEC [
10] and characterize system and network features caused by intrusions. We define these behaviors of a single element as Basic Cyberattack Actions (BCAs).
BCAs allow detection of novel and complex cyberattacks as long as the attacks show any combination of BCA patterns. Future attacks could also consist of many combinations of BCAs. We propose to look at number of computing and network elements together in space (i.e., networked groups of hosts) and time rather than relying on individual BCA of a single element. Combination of BCAs describe the spatiotemporal characterization of an attack and would provide further insight into the attack. We also develop a stochastic graph model to represent the combination of BCAs.
In order to demonstrate our detection idea based on the spatiotemporal patterns, we develop an IDS in our production datacenter. We inject known and possible unknown attacks comprising BCAs and illustrate how the system detects these attacks and locates the root causes by tracking BCAs in time and space. The performance evaluation with extensive attacks comprising complex BCAs is not the focus of this paper and will be addressed in the forthcoming paper.
The remainder of this paper is organized as follows: We review related works in
Section 2.
Section 3 defines BCAs based on existing attack classifications.
Section 4 defines a stochastic graph model to describe the behavior of BCA in time and space. In
Section 5, we describe our BCA detection system. In
Section 6, we evaluate our system with numerous attacks. Finally, the conclusions are presented in
Section 7.
2. Related Work
S-IDSs detect signatures of known attacks. Kumar and Spafford [
11] propose a pattern matching model for S-IDS based on Colored Petri Nets. Honeycomb [
12] automatically generates attack signatures using a honeypot system and detects these signatures using pattern matching techniques. Josue et al. [
13] propose a pattern matching algorithm to filter out the audit trail. Koral et al. [
14] define a set of state transition signatures and detects an attack sequence of the transition. Zhengbing et al. [
15] employ data mining techniques to develop more accurate signatures. These systems use known signatures and they are focused on improving the search and pattern matching speed. They do not consider unknown attacks without matching signatures.
A-IDSs define normal behaviors and detect outlier events as attacks. Although A-IDS is able to detect unknown attacks, it suffers from large numbers of false positives. Collaborative detection mechanisms are proposed to reduce false positives [
16,
17,
18,
19,
20]. They aggregate and correlate a number of alerts generated by different IDSs. IDES [
17] first proposes the IDS collaboration and EMERALD [
18] refines IDES. Cuppens and Miege [
16] used an expert system to develop an aggregation and correlation module. Valdes and Skinner [
19] employed a probability-based approach for a similarity recognition. Yu et al. [
20] develop a knowledge-based alert aggregation system. They collect a number of false alerts and process them based on correlation rules.
Numerous studies employ ML to identify legitimate behaviors. They define normal behavior patterns based on historical data from numerous system metrics. Bayesian network, decision Tree, and SVM (Support Vector Machine) are widely used in intrusion detection systems based on ML techniques. Kruegel et al. [
21] propose an event classification scheme based on Bayesian network to mitigate false alarms. Bilge et al. [
22,
23] detect malicious domains by employing a passive DNS analysis based on a decision tree. Feng et al. [
24], Kuang et al. [
25], Thaseen and Kumar [
26] apply SVM for better performance in intrusion detection. There are numerous studies that employ deep learning that belongs to ML. Khan et al. [
27], Li et al. [
28], Liu et al. [
29] and Kim et al. [
30] transform intrusion datasets to images and then detect attacks based on a convolutional neural network (CNN). Bontemps et al. [
31], Staudenmeyer and Omlin [
32] suggest an IDS model based on a long short-term memory recurrent neural network (LSTM) using the KDD dataset [
33]. There are further IDS studies that perform binary and multiclass classifications based on a recurrent neural network [
30,
34,
35,
36].
In addition, Dokas et al. [
37], Hu and Panda [
38] employ data mining techniques. Stephenson [
39] combines forensics with the intrusion detection and response. Ren and Jin [
40] develop a framework for the real time intrusion forensic system.
Although numerous studies on S-IDS and A-IDS have been addressed, most of the studies focus on a single element. Our focus is on behaviors of multiple elements in time and space rather than that of a single element. As an existing study considering the concept of time and space, Chen et al. [
41] identify spatiotemporal patterns of cyberattacks by analyzing victims’ IP addresses collected by Honeypots. The biggest difference from our work is that they define every packet arriving at Honeypots as attacks and analyze characteristics of attack traffic in order to predict cyberattacks, whereas our focus is on defining a novel method of detecting cyberattacks based on fundamental attack behaviors in time and space. They focus on the macroscopic characteristics of attack traffic and identify deterministic and stochastic patterns among a wide range of consecutive IP addresses. In addition, they only use IP addresses observed from the victim side, whereas we monitor not only the states of both attackers and victims but their spatiotemporal relationships.
3. Basic Cyberattack Action (BCA)
In order to detect an attack by looking at number of computing and network elements together, we carefully study existing attack classifications as well as intrusion datasets. We focus on system and network characteristics by intrusions. We finally define BCAs, fundamental behaviors of attacks. BCAs observed from multiple elements naturally lend themselves to be described in space and time.
CAPEC [
10] organizes more than 500 attack patterns employed to exploit vulnerabilities. CAPEC contains a comprehensive list with detailed information about each pattern. By analyzing CAPEC, we find that all attack patterns can be described with 10 essential methods of attack (MA) as shown in
Table 1. Every attack pattern in CAPEC consists of some combination of MAs. We define five types of BCAs associated with relevant MA. In this work, we do not include MA10 as it depends on the human trust behavior during an attack. For example, CAPEC-98 (phishing attacks) trick people into offering access to their sensitive information. It deals with the human trust issue and it does not manifest in a particular system behavior that can be attributed to particular BCAs.
Table 1 also shows how each MA maps to BCAs. We analyze two types of intrusion dataset and as well as CAPEC to find out the mapping.
Table 1 lists possible attacks corresponding to the mapping. The first intrusion dataset is KDD, the most widely-used dataset in intrusion detection. KDD classifies attacks into denial of service (DoS), remote-to-local (R2L), user to root (U2R) and Probing for IDS evaluation in the 1998 DARPA project. Numerous attacks belonging to the four classifications has been injected for dataset generation. The other one is CSE-CIC-IDS 2018 [
42] that has been actively used in recent intrusion studies. CSE-CIC-IDS 2018 was generated by injecting 6 types of attack, such as brute force, DoS and botnet.
There are many proposed methods to detect MAs. In this work, we are mainly interested in BCAs and we could use any of these methods for MA detection. Focusing on common and fundamental features of cyberattacks rather than specific characteristics of each attack would become increasingly necessary to detect new and variant attacks.
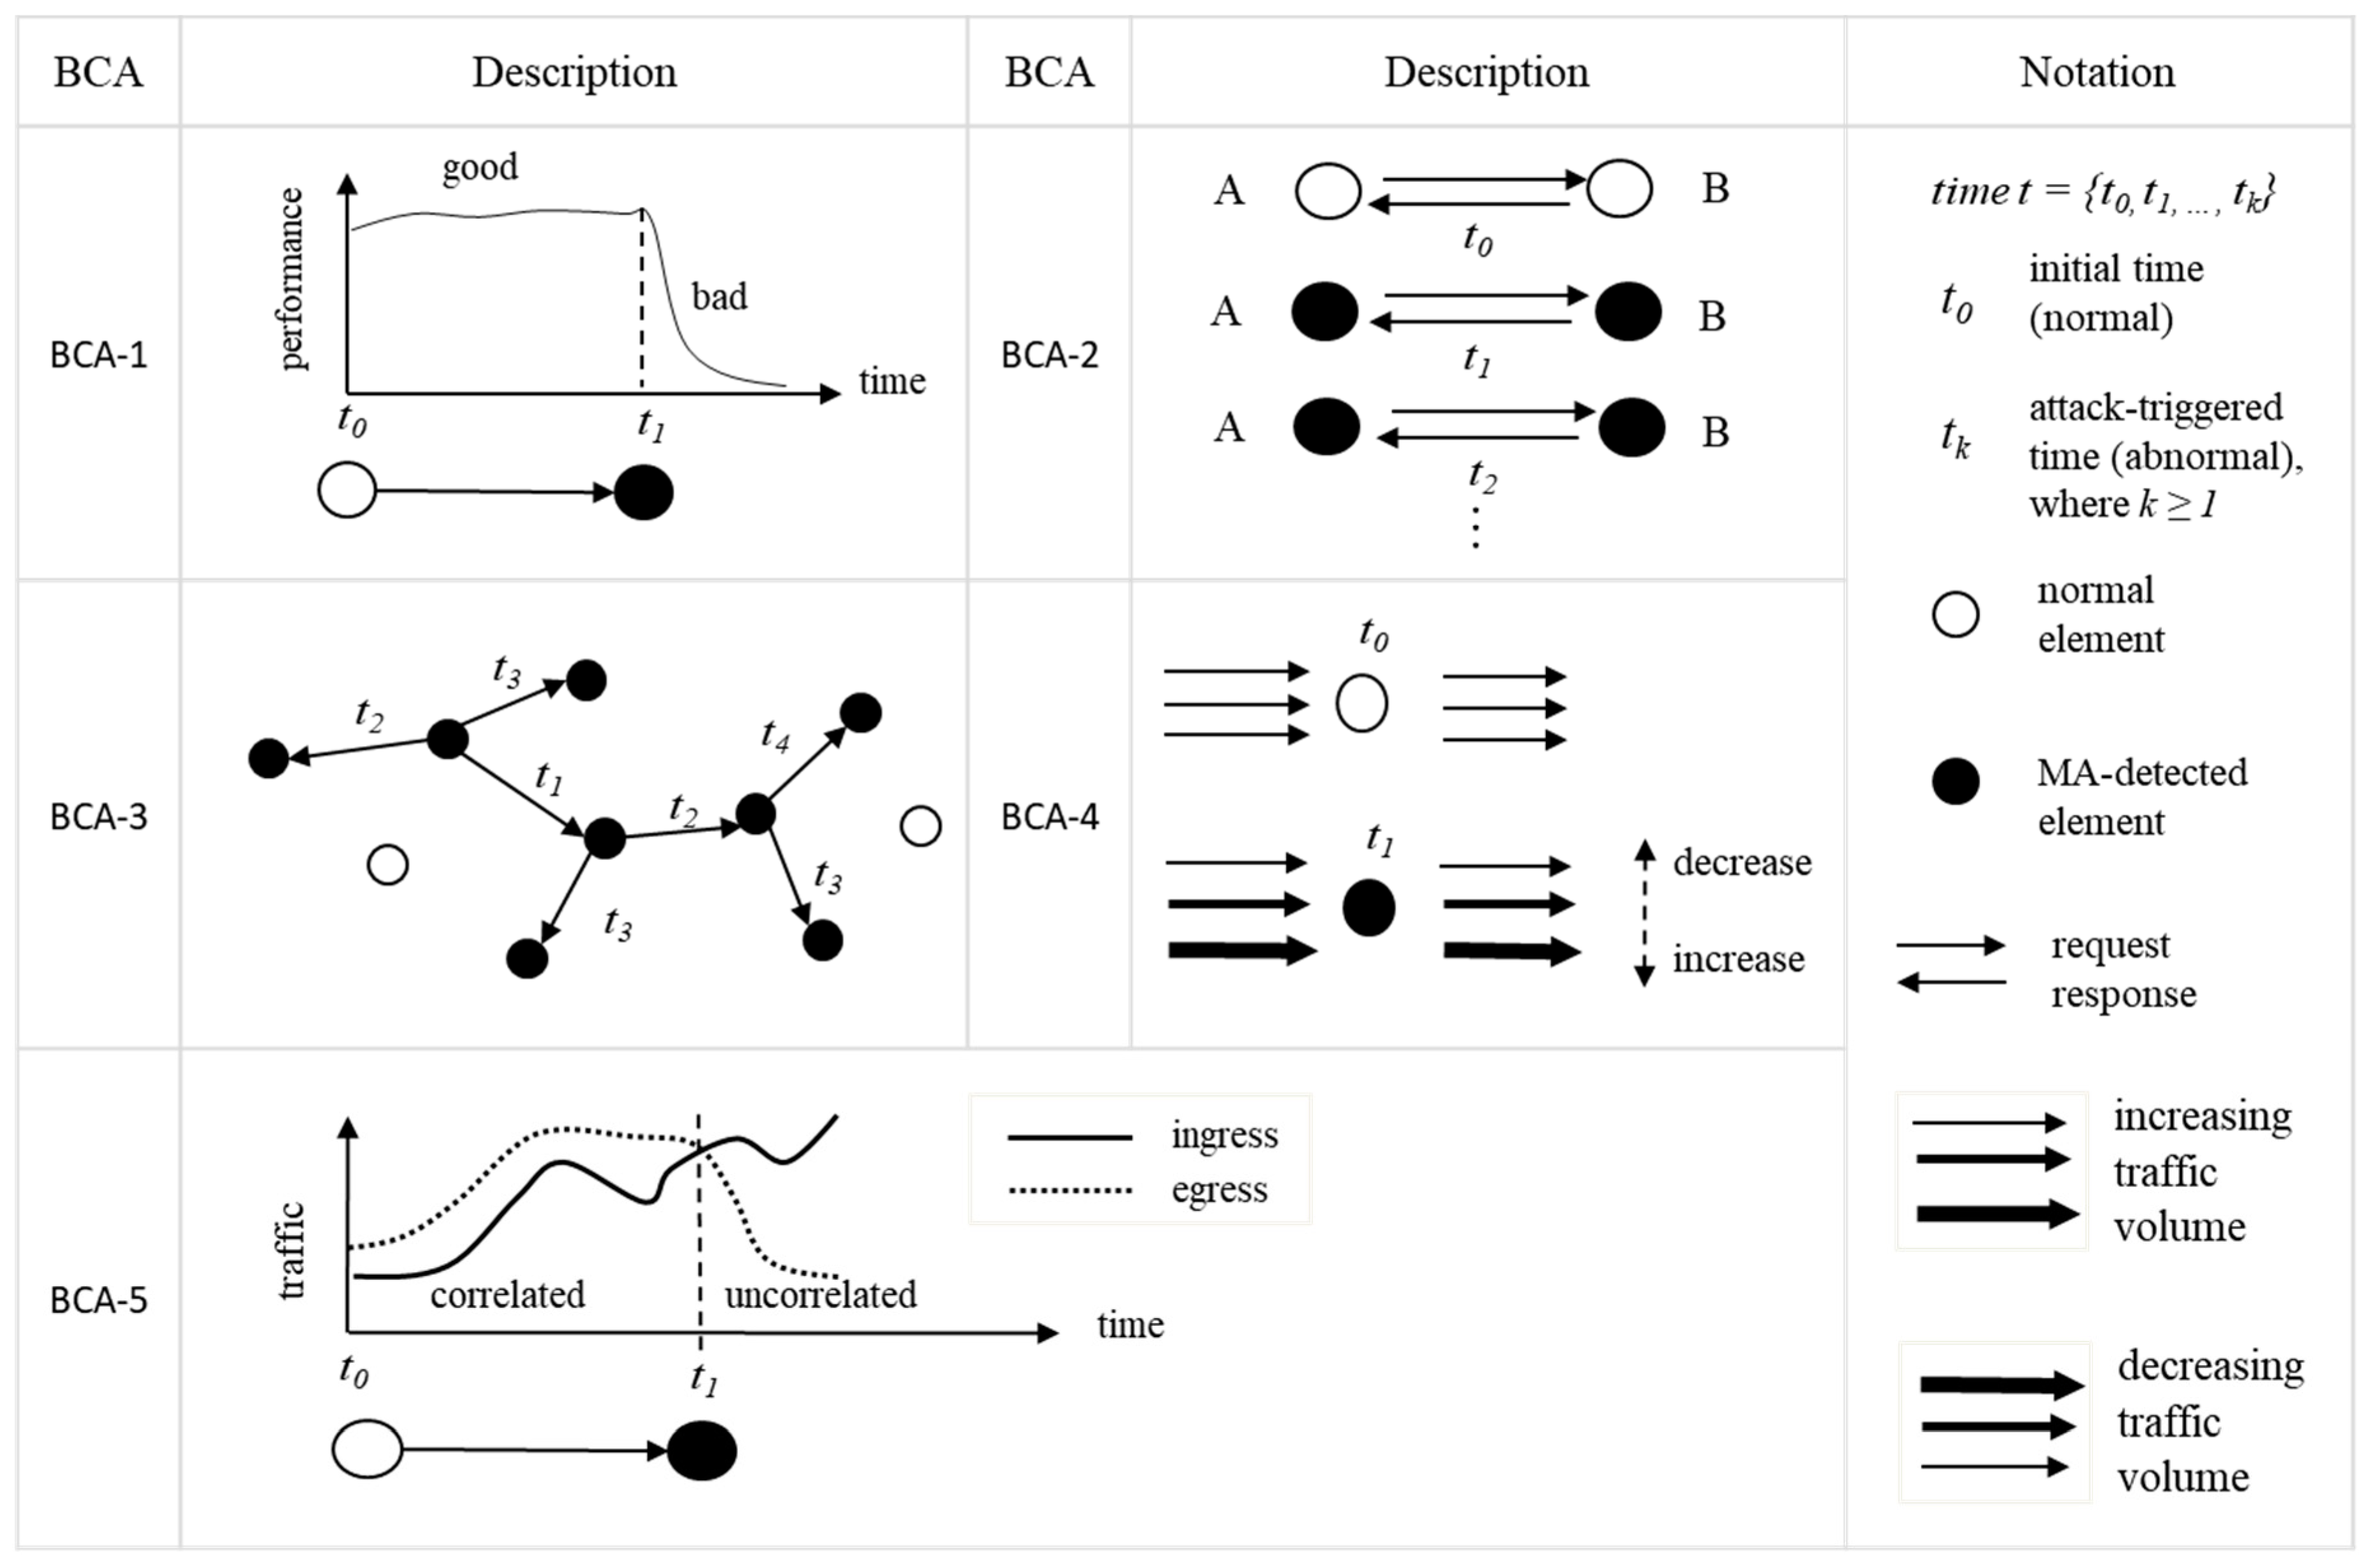
The five types of BCA are characterized as follows:
• BCA-1. Sudden performance degradation
Most attacks target to disrupt services offered by computing and network elements [
43,
44,
45]. A sudden performance degradation would describe an essential behavior of affected hosts. This behavior can also occur in hardware and software failures. MA1 (
Flooding), MA2 (
Protocol manipulation), MA3 (
Time and state), MA4 (
API abuse), MA5 (
Injection) and MA9 (
Modification of resources) would result in sudden performance degradation. According to CAPEC, these MAs cause resource consumption, instability, crash, unexpected state, or execution logic change. Known attacks such as DoS [
43,
46,
47,
48], malware injection [
43,
46,
49], buffer overflow [
43,
48], race condition [
48], symbolic link [
48] and a single point of failure [
46] belong to BCA-1. Detecting attacks based on a single MA may lead to many false positives. However, BCA detection that combines several essential attack behaviors would decrease false positives significantly.
• BCA-2. Iterative behavior
Many cyberattacks begin by obtaining an access to a target element. Most common method to obtain an access is through the brute force method of login trials with different passwords [
43,
46,
48]. The resulting behavior is iterative access requests and corresponding responses. MA8 (
Brute force) is based on a repetitive trial-and-error method. Known attacks such as login attempts [
43] and authentication attacks [
46,
48] belong to BCA-2. This pattern manifests distinctively from common application requests and responses. Normal transactions in client-server systems do not exhibit this iterative behavior. Therefore, these iterative actions result in an essential attack behavior of a computing element.
• BCA-3. Propagating behavior
Many attacks do not remain in a single target element. They tend to propagate to increase the number of infected hosts [
43,
50]. Attackers initially search for a vulnerable target. Once the target is infected by an attacker, the target becomes an attacker and starts propagating its search and infect tasks. This behavior is quite distinct from common application behavior. The resulting behavior is the increasing number of infected hosts as the time increases and such behavior translates to a spatiotemporal behavior of increasing infected elements. MA6 (
Analysis) corresponds to the initial search such as probing [
47] and scanning [
43]. Known attacks such as worm [
43,
48] and port scanning [
10] belong to BCA-3.
• BCA-4. Sudden increase or decrease in ingress and egress traffic
In additional to the performance degradation, the resulting behavior of attacks can be observed in either sudden increase or decrease of both ingress and egress traffic at the same time [
51,
52,
53,
54]. Usually the performance degradation would decrease the egress traffic corresponding to the responses of a server but the ingress traffic corresponding to the requests would remain the same. Decrease or increase in ingress and egress traffic usually result from malicious operation in computing or network elements. DDoS attacks [
43,
48] and flooding attacks [
49] belong to BCA-4. In addition, BCA-4 could occur in combination with BCA-1 because this type of attacks could decrease the server performance.
• BCA-5. Uncorrelated ingress and egress traffic
We observe in any servers that the ingress traffic is highly correlated to the egress traffic. As the number of requests increases, we expect the number of responses to increase. This behavior is true when the server is working in desired operational range. As long as the server is capable of responding all requests immediately, we expect the number of responses to closely track the number of requests. When the server is congested or malfunctioning, the ingress and egress traffic are not correlated. Many attacks manifest in this uncorrelated ingress and egress traffic behavior. For example, when attackers spoof their identities during an attack, they do not receive any responses while it sends large numbers of requests [
55]. Uncorrelated ingress and egress traffic would describe an essential behavior of a computing element with forged identity. In the existing works, masquerade [
48] belongs to BCA-5.
Figure 1 illustrates each BCA with the key behavioral features described above.
4. BCA Description and Composition
We now describe each BCA with associated MAs and spatiotemporal patterns. We use a stochastic graph model to describe the behavior of BCA in time and space. We define the stochastic graph model as follows.
Table 2 shows the notation of the graph model.
Definition 1. A stochastic graph G(t) represent the overall stochastic graph comprising of all elements i at time t. Gi(t) represents the stochastic graph only related to element i, where i , thus a subset graph of G(t) = {Gi(t)}. Gi(t) is modelled by 3-tuple of graph Gi(t) = (Vi (t), Ei (t), Λi(t)). Vi (t) = {null, MA1, MA2, …, MA9} represent the state of the element i. If the element detects MA3, its state is MA3, for example. Null represent that no MA is detected and is operating normally. Ei(t) = {ei,j} where i, is the set of edges that represent the communication between the node i and j. Λi(t) = {λi,j(t)} is the set of traffic volume from node i to all j, λi,j(t), where i. λi,j(t) represents the stochastic random variable associated with ei,j. Gi(t) does not contain any vertices not connected to element i. BCAs can now be modelled using the stochastic graph G as follows.
• BCA-1. Sudden performance degradation
MA1 (Flooding), MA3 (Time and state), MA4 (API abuse), MA5 (Injection) and MA9 (Modification of resources) degrade performance of computing elements. MA2 (Protocol manipulation) would disrupt services offered by an application server. Host i then has suddenly degraded performance. Ei(t) and could be zero or non-zero. BCA-1 is detected when host i has sudden performance degradation.
• BCA-2. Iterative behavior
MA8 (Brute force) manifests in an iterative behavior. When host i repeats the same behavior such as continuous login trials, the host would generate consistent traffic during the period of attack. and denote the time period for the successive iteration and the window size for the traffic analysis respectively. During the password attack, iterative access requests and responses between the attacker and the target server generate consistent traffic volume. The password attack could target one or multiple servers. Brute force attacks may target different victims and the number of neighbors the stochastic graph would increase in time.
• BCA-3. Propagating behavior
In propagating attacks, an infected host i becomes the attacker and starts infecting another host. Host i would infect more and more hosts as time increases. Host i keeps scanning other hosts j to find vulnerable hosts. MA6 corresponds to the scanning behavior. The total volume does not play significant role here. Traffic from i to all connected elements would usually increase but it is not necessary to show BCA-3 behavior.
• BCA-4. Sudden increase or decrease in ingress and egress traffic
In DDoS attacks, the traffic volume of both attackers and targets would suddenly increase exponentially. Host i under the DDoS attack results in . The traffic volume increases greater than the acceleration rate . HTTP DoS attacks disrupt a web application server by depleting the web resources. Ingress and egress traffic of the server i would suddenly decrease exponentially. In this attack, . The traffic volume decreases faster than rate MA1 (Flooding) and MA2 (Protocol manipulation) are the essential methods for the DDoS and HTTP DoS attack, respectively. Usually multiple new hosts show up in the DDoS attack, but it is not necessarily required.
• BCA-5. Uncorrelated ingress and egress traffic
MA7 (spoofing) belongs to BCA-5. In IP spoofing attacks, the attacker does not receive any responses while it sends requests. This behavior results in uncorrelated ingress and egress traffic. When Host i spoofs its identity, Λi(t) satisfies Ri,j (, ) < . Ri,j is the cross correlation of ingress and egress traffic of i. is a threshold coefficient of Ri,j and . Host i is hidden to other elements due to its spoofed IP address. As Host i is unknown to other elements during the attack, the number of its neighbor deceases.
5. BCA Detection System
Our system detects BCAs by monitoring spatiotemporal patterns according to the stochastic graph model. The spatiotemporal pattern describes the change of interactions among elements in time and space. There are many existing detection methods for MAs. We deploy any one of existing effective MA detection mechanisms. Periodically we generate a graph Gi for element i. MAs are associated to Gi when they are detected for element i. We match Gi against the stochastic graph models of BCAs to detect intrusions. We demonstrate the effectiveness of spatiotemporal patterns in detecting existing attacks as well as unknown attacks.
5.1. MA Detection
We apply existing mechanisms for MA detection in the host. Many of these mechanisms monitor system metrics and correlate metrics to detect a particular MA in a single computing or network element. We apply common MA detection mechanisms in the literature as shown in
Table 3.
Si denotes the system metrics for MA detection mechanisms.
Our focus is not on performance of particular MA detection mechanisms but to demonstrate the advantage of BCA and their spatiotemporal patterns. Improvement in existing MA detection would improve our overall system. Again MA detection is limited to a single element and tends to have many false positives and false negatives.
5.2. BCA Detection
Individual host i monitors any change in MA, traffic volume, or temporal and spatial relationship among elements. Periodically its stochastic graph Gi is generated. The spatiotemporal pattern of Gi is then compared to BCA models. When there is a match between Gi and any of BCA models, we determine there is an intrusion and cyberattack to Host i and its associated elements.
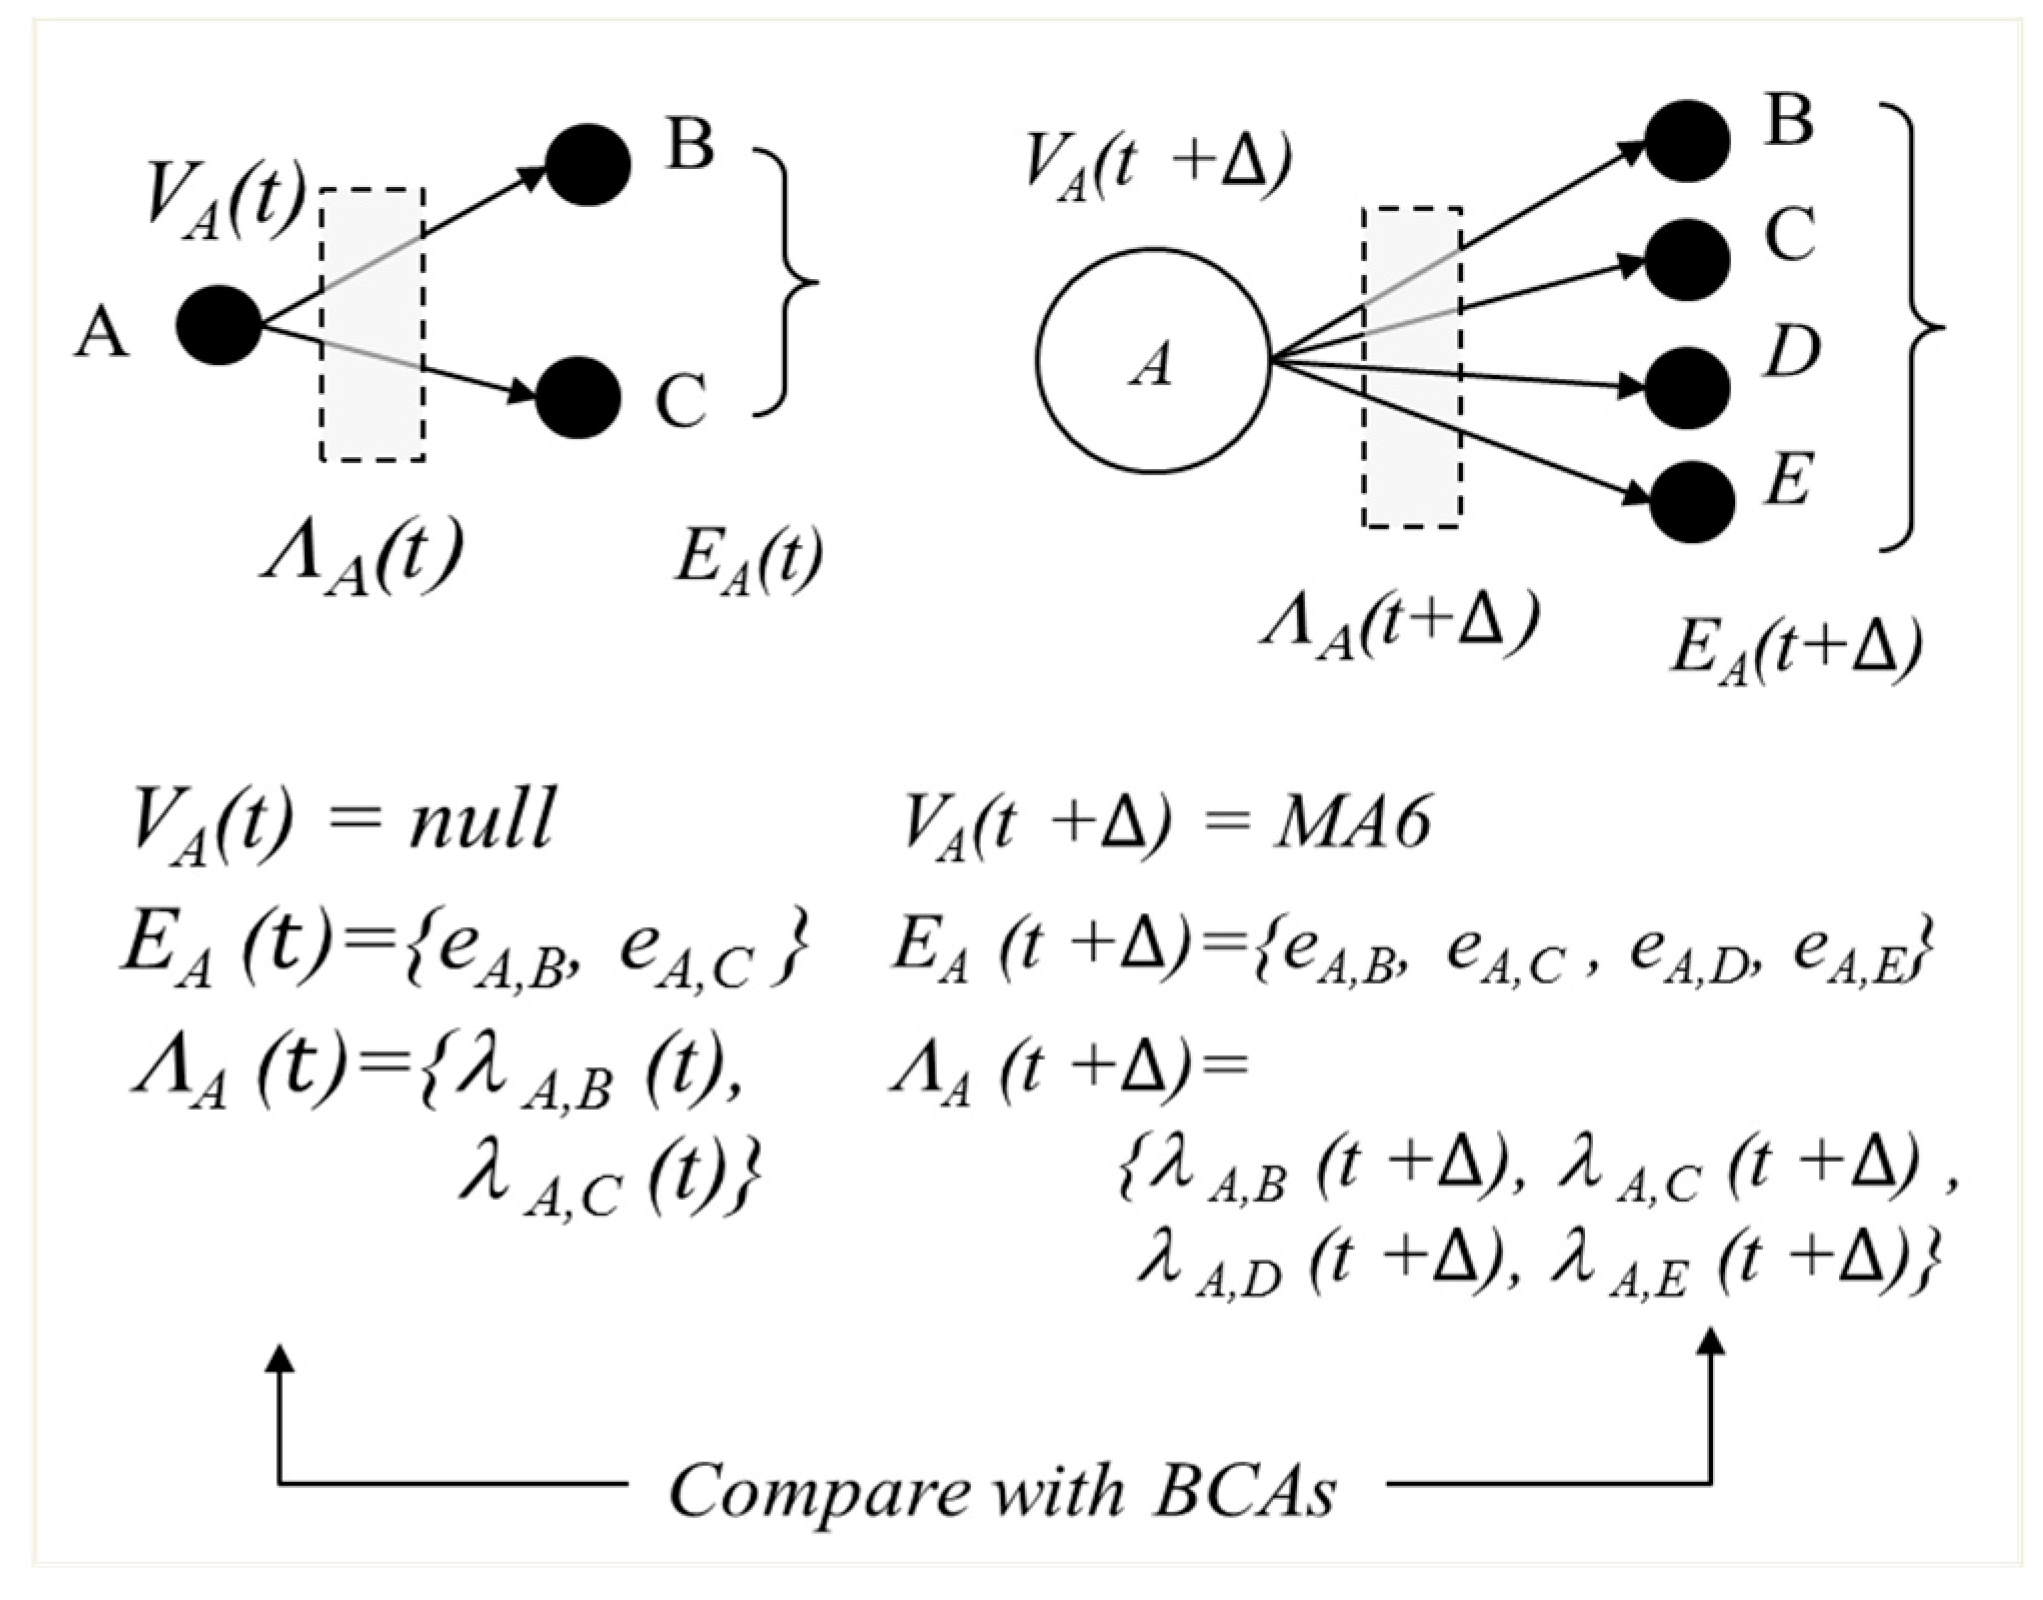
Here is an example of BCA detection mechanism. Assume that host
A generates
GA(
t) as shown in
Figure 2.
We then proceed to match with BCA graphs. Assume that
t0 =
t and
t1 =
t + ∆. BCA-3 matches
GA(
t1) in the example as shown in
Figure 3.
5.3. Combination of BCA Detections
The stochastic graph G contains all elements with detected MAs. Each element carries out BCA detection through matching its own stochastic graph with BCA graphs. We then see all BCA detected elements collectively. If any of these graphs are connected, meaning that there is a connecting edge between these graphs, we consider the validity of given BCA detections by those elements. By considering multiple elements together, we reduce additional false positives by finding contradicting combination of BCAs. We also further reassure the accuracy of the detection by examining multiple elements. Here are examples to illustrate further reduction in false positives as well as improving detection accuracy.
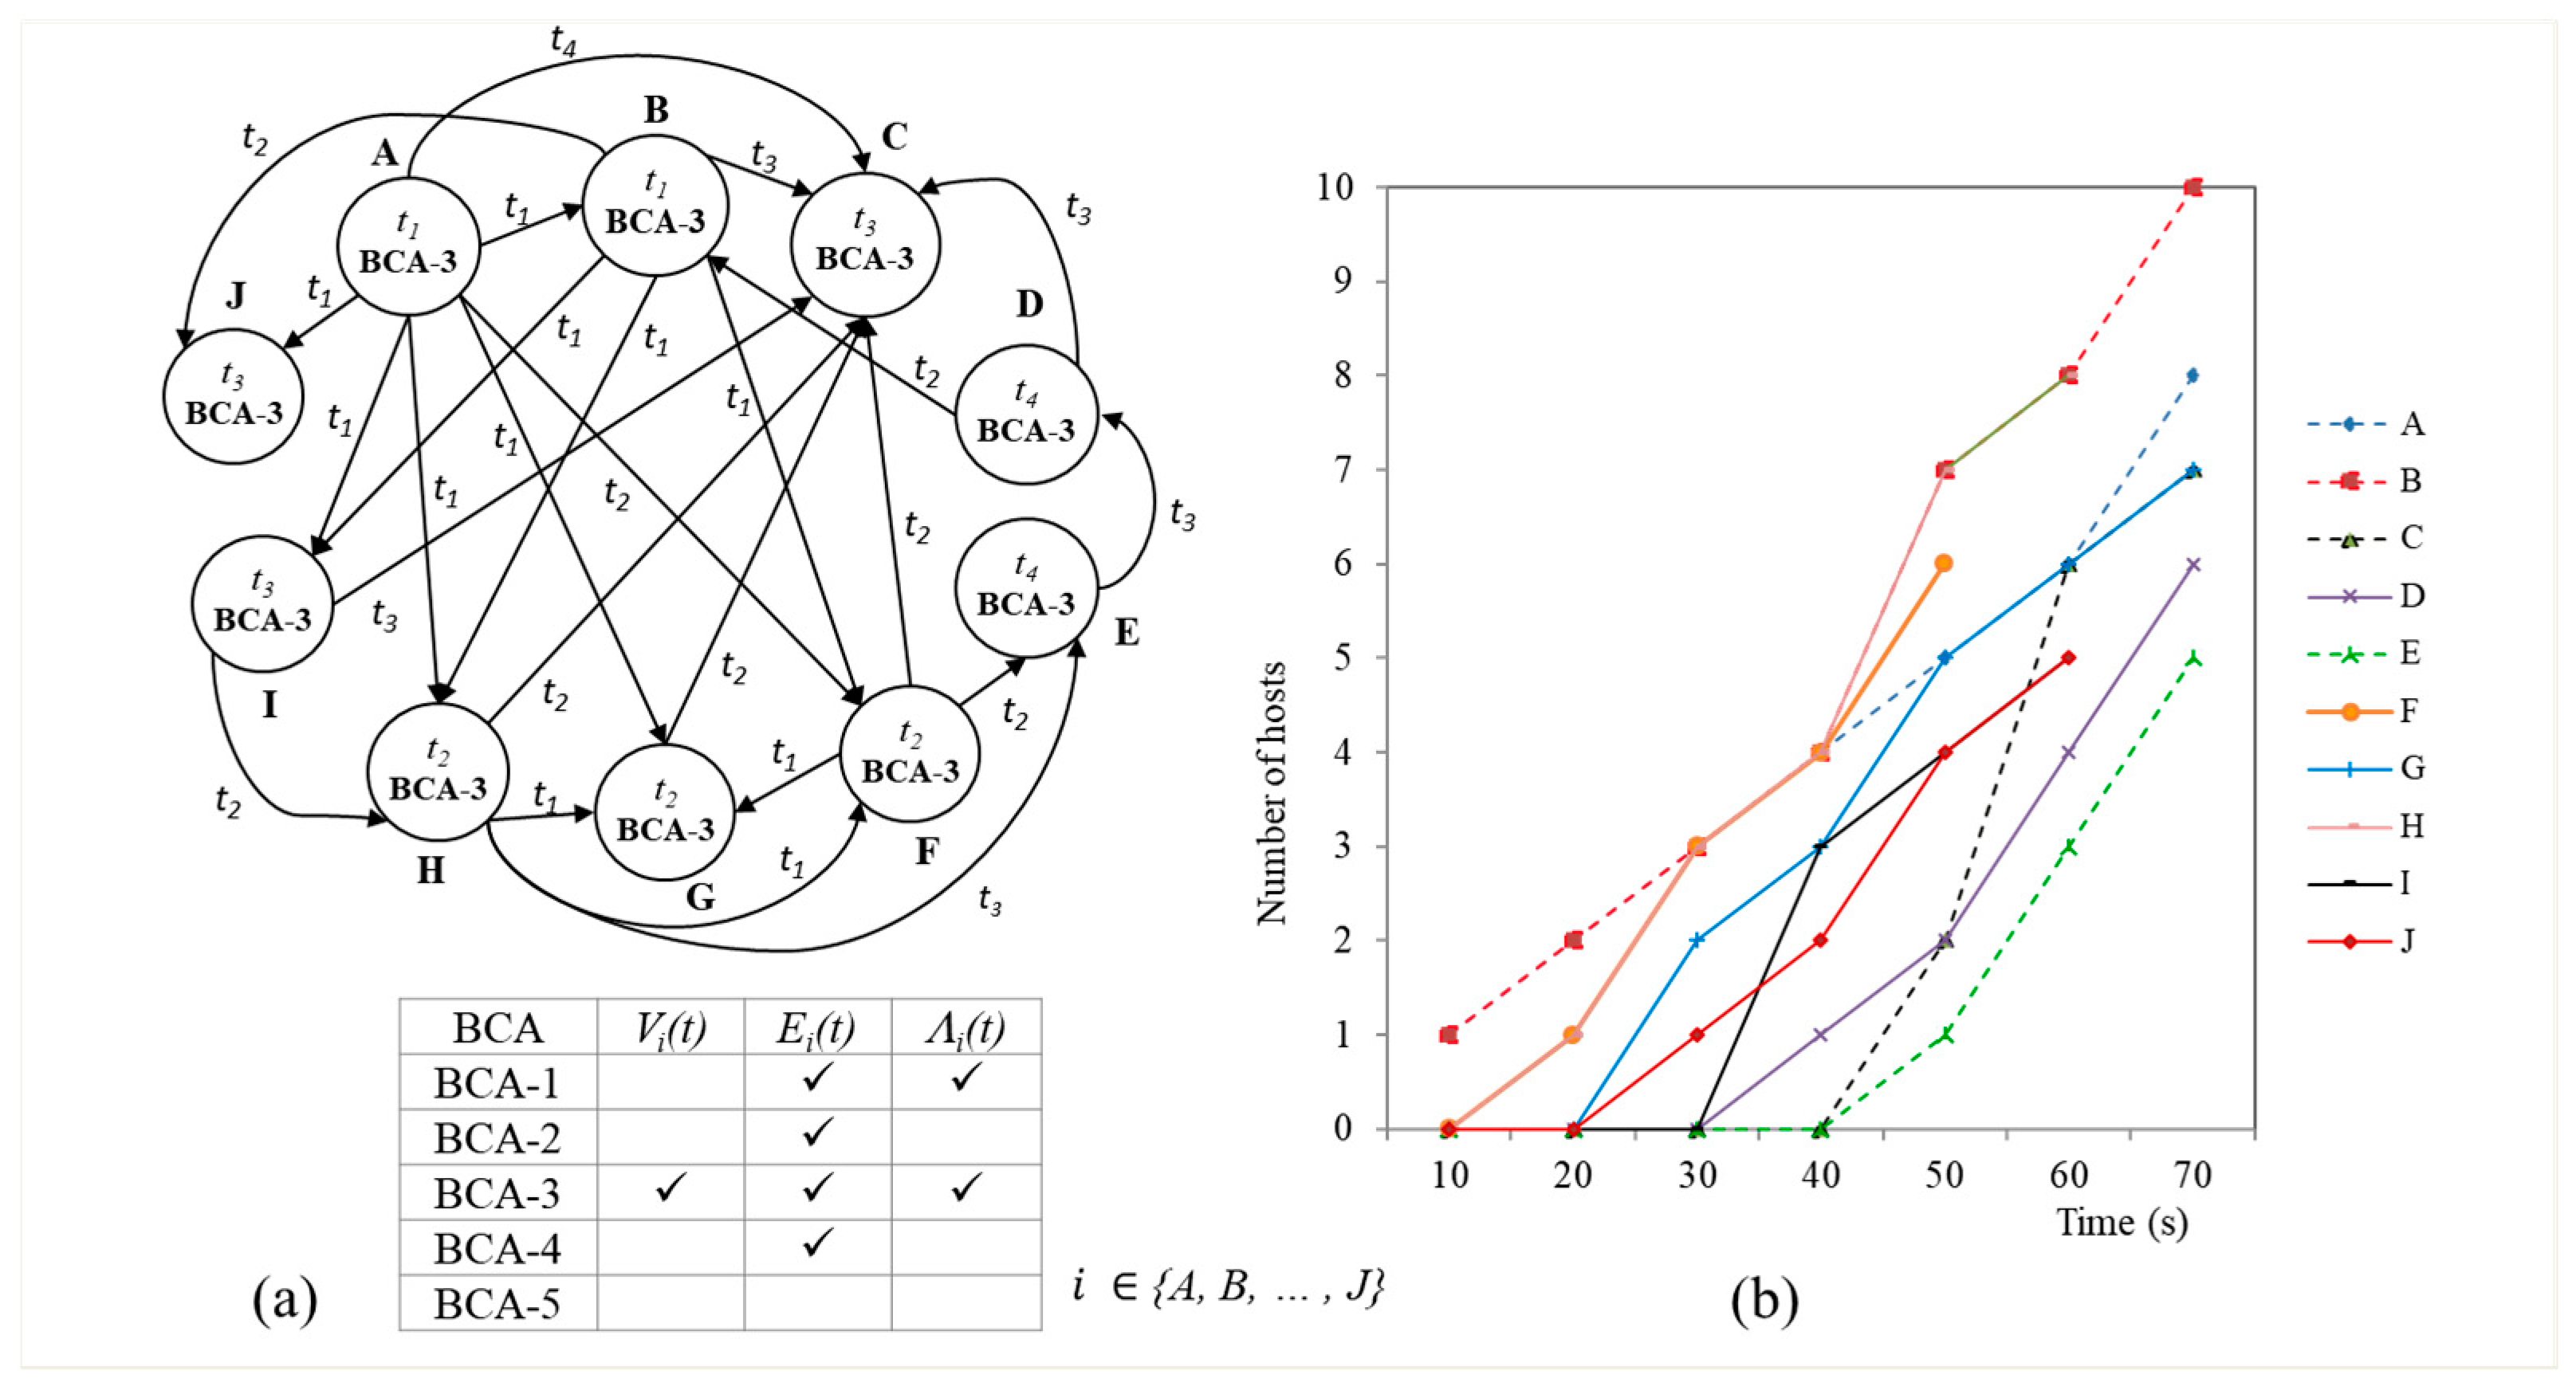
Figure 4 shows a worm attack.
Assume that hosts A-G detect BCA-3 at different times,
t1,
t2 and
t3. Each host generates
Gi(
t), where
i , according to BCA matching as shown in
Figure 4. Once a host is infected by the worm attack, the host starts propagating the worm to other hosts continuously. Hosts A-G detect BCA-3 as the worm propagates in space and time. Assume that only one host detects BCA-3 and others do not detect any BCA patterns. There is no evidence of propagation and we determine that particular single BCA-3 detection has to be false positive. Combination of multiple
Gi(
t) help us to reduce false positive. On the other hand, if there are multiple connected elements detecting BCA-3, then it confirms the propagating attack. Thus,
G(
t) comprising of all
Gi(
t) gives overall view of elements and helps to reduce false positives in many attack scenarios.
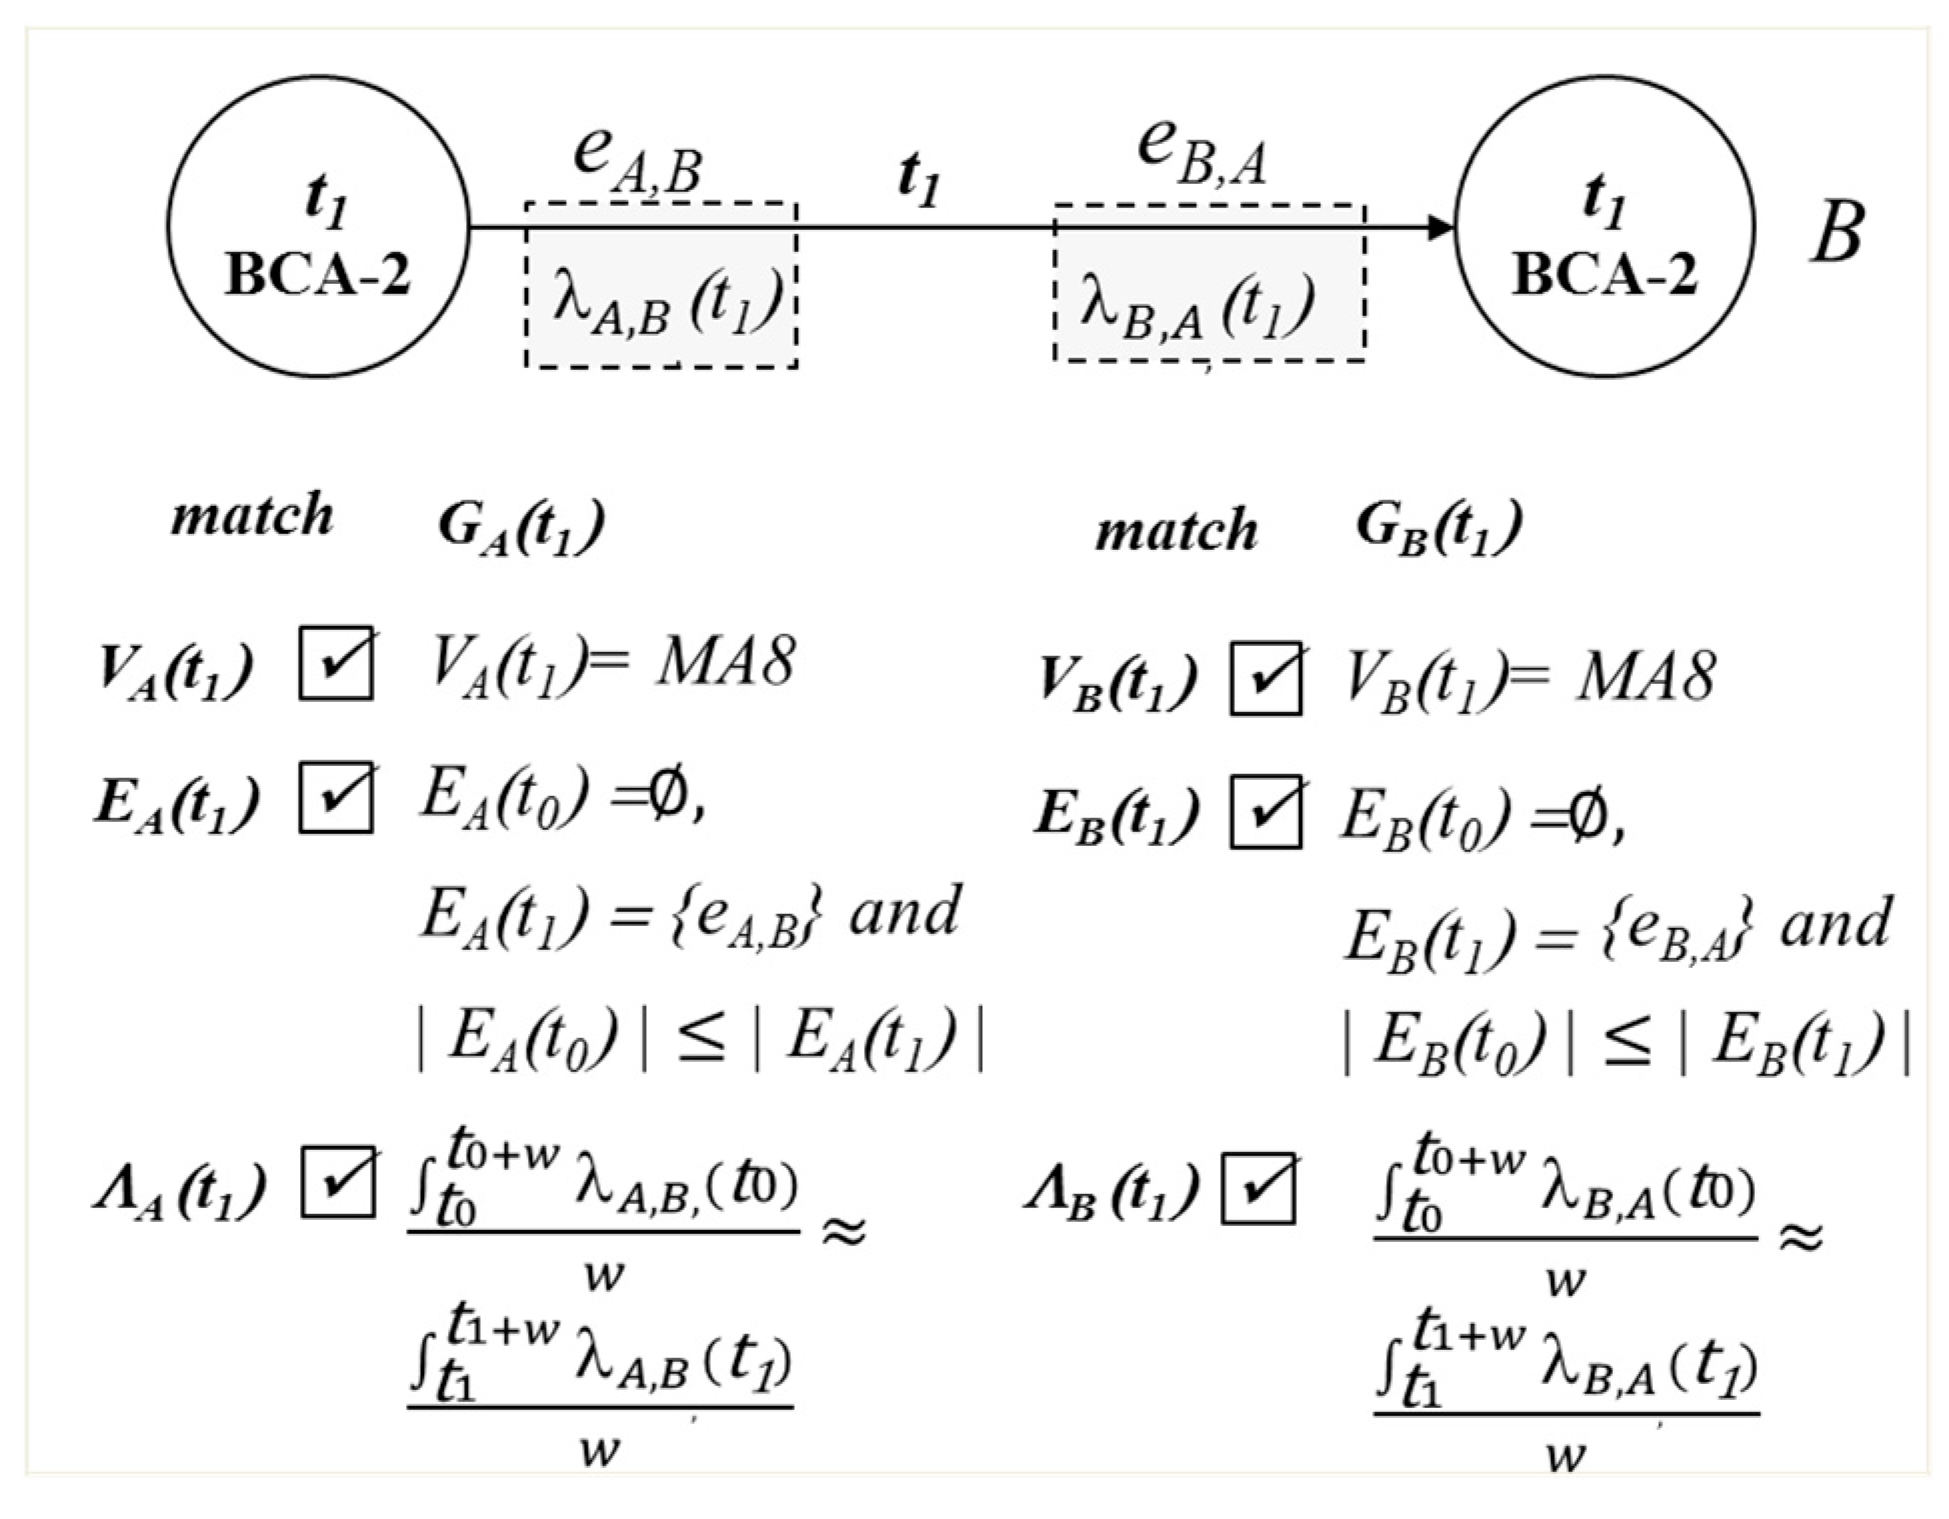
Figure 5 shows another example of advantage of having more comprehensive
G(
t). Host
A guesses a
B’s password using the brute force password attack. Host A sends login requests continuously until it finds out the correct password. During the attack, host
B repeats the same behavior to authenticate the passwords. In the password attack, the iterative behavior of either side of the host requires similar behavior from the other host. If only
A or
B detects BCA-2, we cannot definitely determine it as the brute force attack or a false positive. The combination of BCA-2 detected by
A and
B increases the confidence in detecting the attack.
5.4. Root Cause Analysis
Another advantage of using BCA graph is its ability to find possible root cause and location of the attack. The BCA graphs contain temporal and spatial relationship among elements. It is possible to trace the attack pattern to the originator using BCA graphs.
Figure 6 shows an example of locating the root cause.
At t0, host A, B, C, D and E are running normally in a multi-tier application. When C detects BCA-1 due to performance degradation, EC(t1) − EC(t0) = {eF,C}. Only eF,C shows up at t1 while other edges appeared at t0. Host F would be the attacker who disrupts host C by injection.
6. Experimental Evaluation
We deploy several experiments in our datacenter with a controlled VM cluster. We evaluate our system’s performance in known attack and unknown attack detection. We also compare our system with those only relying on existing MA detection. We demonstrate how BCAs reduce false positives in several scenarios. We demonstrate that the spatiotemporal characterization of attack patterns helps in accuracy and reliability of intrusion and cyberattack detection. More extensive performance evaluation is not the focus of this paper and will be addressed in the forthcoming paper.
6.1. Experimental Setup
We implement our system and deploy in our production datacenter with a controlled VM cluster. We run a small agent in virtual machines (VMs). Each agent runs MA detection and BCA detection using its own stochastic graph. The agent creates its stochastic graph periodically. The agent then match its graph to BCA graphs. When it finds the matching BCA, the agent sends an alarm along with its graph to the management server. The management server compiles graphs from all elements to generate and update overall stochastic graph, G. The management server then examines all connected graphs Gi to determine the attacks and possible root causes. The infrastructure for the experiments consists of the following components:
Physical servers: Fedora 21, QEMU 1.6.2 hypervisor
VM: Ubuntu 14.04 and Fedora 22, 1v CPU, 1024MB RAM
Cloud web application: Rubbos application [
59]
For the high reliability of the experimental evaluation, we deploy the Rubbos web application running in an N-Tier architecture. During attacks, web servers and database servers keep processing service requests from 100 clients on average per second.
6.2. Known Attacks
As shown in
Table 4, we inject four known attacks selected by analyzing intrusion datasets as well as CAPEC as described in
Section 3. We use released attack scripts as well as a penetration software for attack injection. Both Scenarios 1 and 4 detect multiple BCAs including BCA-4. Scenario 1 detects sudden decrease in traffic while scenario 4 detects sudden increase in traffic in BCA-4 detection.
6.2.1. Scenario 1
Slowloris attack is a DoS attack targeting an application layer. The attacker modifies HTTP headers with wrong termination characters. The attacker then sends the packets to a web application server. This attack disrupts the web server due to a large number of incomplete open HTTP connections. The attacker consumes all connections on the server.
Existing HTTP DoS detection systems manually configure the web application parameters or set appropriate firewall rules to drop the suspicious packets [
60]. Our system monitors the application metric
S8 (requests/s),
S9 (responses/s) and
S10 (ratio of requests and response). Here we have four hosts
A,
B,
C and
D as shown in
Figure 7a. We deploy
A (client),
B (web server), and
C (DB server) running a Rubbos application at
t0. We inject the Slowloris attack into
D using a released script [
61]. Host
D sends the modified HTTP requests (200 packets/s) to
B.
• BCA detection
S10 (ratio of response over requests) indicates the performance of
B for processing HTTP requests. When
B is operating normally, the value of
S10 fluctuates from 1 to 4, as shown in
Figure 7b.
S10 suddenly decreases when the attack is injected.
S10 decreases as
S9 (responses/s) suddenly decreases due to the performance degradation, as shown in
Figure 7c. Host
B detects MA2 (
Protocol manipulation) based on
S9 and
S10.
Host
B detects BCA-1 and BCA-4 based on
GB(
t1) as shown in
Table 5.
B satisfies
EB(
t1) and
ΛB(
t1) as well as
VB(
t1) for BCA-1 and BCA-4. Existing systems would also detect this attack by monitoring only MA2 using
S8,
S9 and
S10.
Although our focus is not on detection methods of MAs, we analyze false positives in detecting MA2 for the validation. Because our attack scenario has 100 clients in the cloud application, we deploy 50 clients, 100 clients, and 200 clients without attacks.
Table 6 shows the false positive rate (FPR) for
S8,
S9 and
S10, respectively.
• Root cause
According to GB(t1), only eB,D shows up at t1 as − = {eB,D}. The new element D would be the attacker disrupting B’s service by protocol manipulation (MA2).
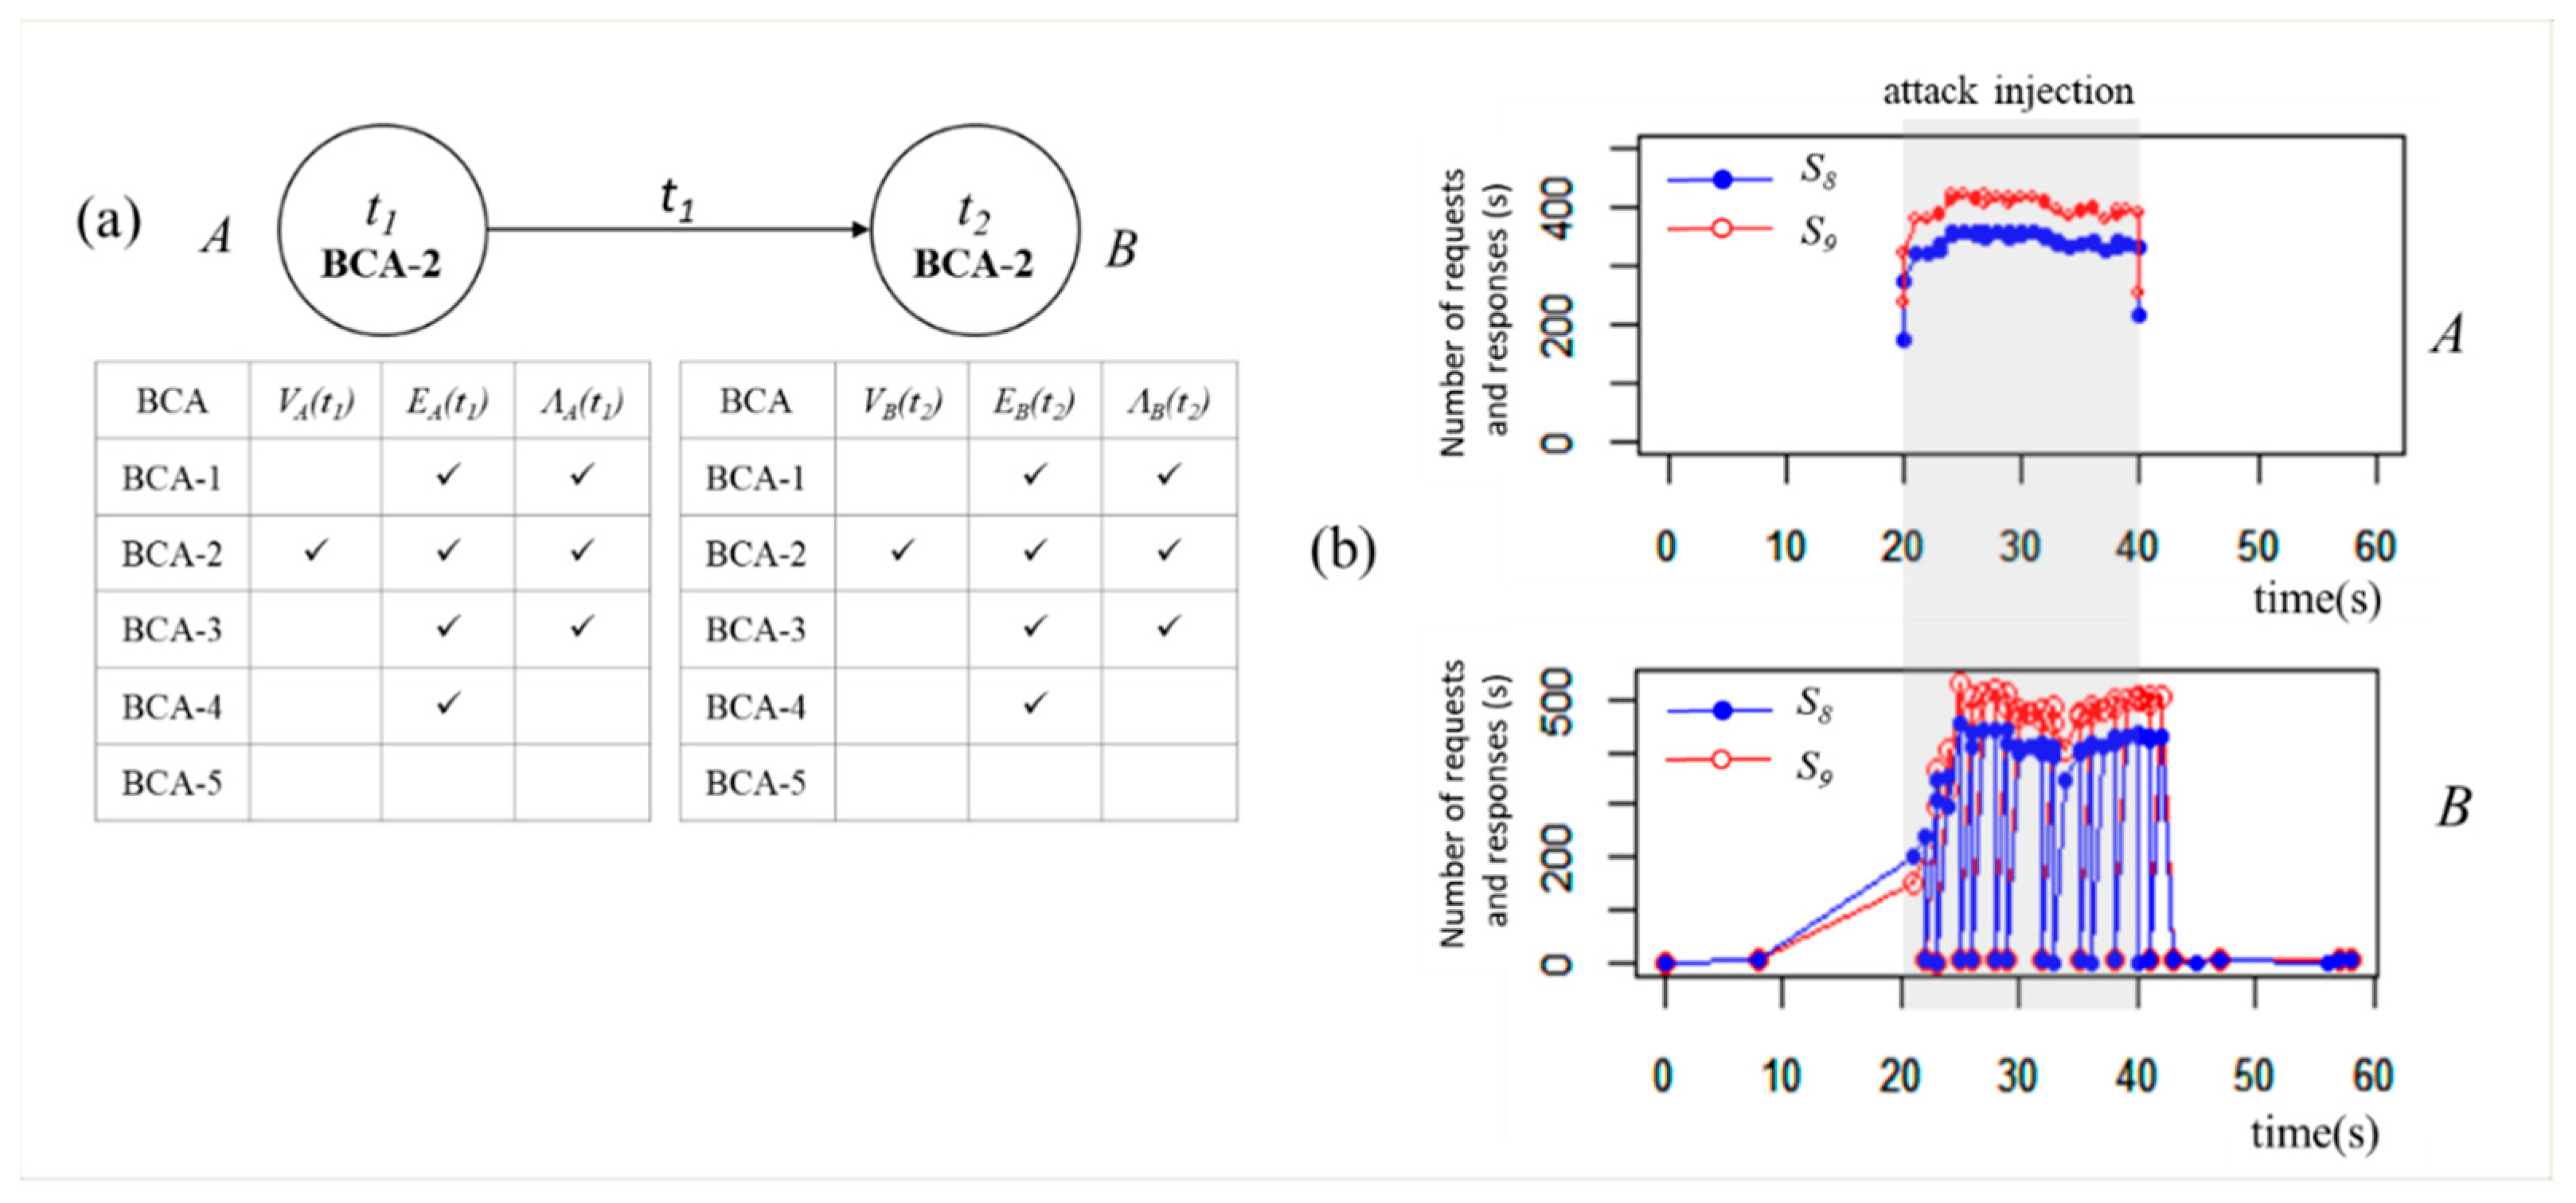
6.2.2. Scenario 2
We inject a password attack that tries guessing a victim’s password. In our experiment, we have two hosts,
A and
B as shown in
Figure 8a. We inject the attack into
A using Metasploit, a penetration software [
62]. Metasploit is open-source software and allows us to inject a variety of attacks with our custom modules. Host
A sends login requests more than 4000 times for 20 s guessing
B’s password. Host
B is a MySQL server.
• BCA detection
Our system monitors
S8 (requests/s) and
S9 (responses/s). From
A’s perspective,
S8 shows the number of trials of guessing the password for one second.
S9 is the number of responses from the MySQL server,
B. Host
A and
B detect MA8 (
Brute force) according to large values of
S8 and
S9, as shown in
Figure 8b.
Our system detects BCA-2 on both hosts from
GA(
t1) and
GB(
t2). Host
A and
B have a new neighbor (
EA(
t1) and
EB(
t2)) and they generate very consistent traffic (
ΛA(
t1) and
ΛB(
t2)) during the attack.
GA(
t1) and
GB(
t2) show that
A and
B satisfy all conditions for BCA-2 as shown in
Table 7. Without MA detection (
VA(
t1) and
VB(
t2)), it could be either BCA-1 or BCA-2.
Associating MA improves detection capability of our system. BCA-2 requires similar BCA-2 behavior from connected elements. The combination of BCA-2 detected by A and B in our system increases the confidence of correct detection. Existing systems that analyze elements independently could introduce many false positives.
For MA detection using S8 and S9, we have no false positive found. This is because number of requests to the database server is less than 70 per second for all 50 clients, 100 clients, 150 clients in normal state. However, FPR could increase if the application has much more clients than 150 clients.
• Root cause
According to G(t) comprising of GA(t1) and GB(t2), the new edge between A and B appears at t1 when A detects BCA-2. −= {eA,B}. A is more likely to be the attacker sending the login requests to B, because A detects BCA-2 earlier than B.
6.2.3. Scenario 3
We inject a worm spreading over a local network. An attacker infects a target via an SSH. The attacker usually uses known_hosts file to collect target addresses and to bypass the authentication process. In our experiment, we deploy 10 hosts A to J which have all of other hosts’ credentials. We first inject the worm into A using Metasploit. Host A repeats infecting other hosts. Once a target host is infected by the worm, it becomes the attacker and starts infecting another host.
• BCA detection
Our system monitors
S7 (number of neighbors) to detect the worm.
S7 refers to the number of trials to infect the worm via the SSH connection. Every host detects MA6 (
Analysis) as
S7 increases as time increases as shown in
Figure 9b. Our system detects MA6 when the number of neighbors (
S7) is greater than 5 (more than half of the entire hosts). Our system detects BCA-3 on every host based on
Gi(
t) where
i.
Table 8 shows an example of the BCA detection of
GA(
t1). Host
A has new neighbors (
EA(
t1)). Traffic volume, (
ΛA(
t1)), increases as the infection propagates through elements.
GA(
t1) matches all conditions of BCA-3. All hosts detect BCA-3 as the time increases. Overall
G(
t) consisting of multiple BCA-3 elements is consistent with the expected behavior of BCA-3 with propagating attacks. Again the overall view of all related hosts increases the confidence of correct detection in this scenario.
In order to analyze false positives in MA detection based on S7, we monitor clients in our datacenter. Because the clients usually communicate with a web server, the number of neighbors is not proportional to the number of clients. In our experiment without attacks, the number of neighbors is less than 3 with a normal application running.
• Root cause
According to G(t), A and B first detect BCA-3 at t1, while other hosts detect BCA-3 at between t2 and t4. Either A or B could be the attacker that initiated the worm among the hosts.
6.2.4. Scenario 4
We inject a distributed SYN flooding attack with a spoofed IP address using Hping3 [
63]. The attacker sends massive SYN packets to zombies with the victim’s IP address. The zombies then send SYN-ACK packets to the victim. The massive SYN-ACK packets deplete bandwidth of the victim. In this experiment, we deploy 6 hosts (
A–
F) as shown in
Figure 10a.
A is the attacker. Host
A keeps sending SYN packets to
B-E with
F’s IP address.
• BCA detection
Our system monitors
S4 (inbound traffic/s),
S5 (outbound traffic/s) and
S6 (ratio of inbound and outbound traffic). In this experiment,
S4 and
S5 are used for MA1 (
Flooding) detection.
S6 is used to detect MA7 (
Spoofing). Host
A sends massive SYN packets but does not receive any responses during the attack. These SYN packets increase
S5 as shown in
Figure 10b and
S6 increases accordingly. Host
A detects MA1 and MA7 due to the high value of
S5 and
S6 respectively. Host
F receives massive SYN-ACK packets from four hosts (
B–
E).
F detects MA1 due to the high value of
S4, as shown in
Figure 10c. In our experiment, the four hosts (
B–
E) do not detect MA1 because each host does not meet the detection threshold (500 kb/s). The range of
S4 and
S5 are from 180 kb/s to 450 kb/s. The total amount of traffic going to
F exceeds the threshold, thus host
F detects MA1.
Our system detects BCA-4 and BCA-5 as shown in
Table 9. Host
A detects BCA-5 as it has a low correlation between inbound and outbound traffic. Host
A and
F detect BCA-1 as their outbound and inbound traffic suddenly increase respectively. Both
A and
F match all conditions for BCA-4 and BCA-5. By combining BCA graphs, our system correctly detects not only the DDoS attack to
F but also the spoofing attack from
A.
For detection of MA1 and MA7, we have no false positive found until we deploy 150 clients with normal behaviors. In the application, the values of S4 and S5 are less than 100 kb/s and 200 kb/s with 100 clients and 150 clients, respectively. In addition, S6 has a value of at least 0.8 or higher with normal clients.
• Root cause
After host A detects BCA-5 at t1, both A and F detect BCA-4 at t2. Based on GA(t1) and GA(t2), we find host A spoofs its identity and sends massive traffic. According to GF(t2), F has new edges between F and the 4 hosts (B–E). We can infer that A initiated DDoS attack to F using B-E’s IP addresses.
6.3. Unknown Attack
We create an unknown attack based on the bait and switch method. It consists of a bait attack and the intended attack. The bait attack is designed to distract security managers’ attention away from the intended attack. The ultimate goal of this attack is to distribute malicious codes. We deploy 3 malicious hosts (
A,
B,
C), 4 clients (
D,
E,
F,
G), two web servers (
H,
I), and one DB server (
J).
Figure 11 shows seven hosts (
D–J) running normally in the multi-tier application at
t0.
The unknown attack consists of three attacks as follows:
Password attack (intended attack) at t1: This attack requires gaining access to the target server H. The attacker employs a slow password attack to find host H’s password. The slow brute force attack is harder to detect using the existing brute force detection mechanisms. We inject the slow password attack into host B which is one of the malicious hosts. Host B repeatedly sends HTTP login requests to host H (web server) until it finds the correct password.
Flooding attack (bait attack) at t2: The attacker employs a flooding attack to distract the security manager’s attention from the intended attack. We inject the flooding attack to malicious host A. Host A starts sending large number of SYN packets to I in order to disrupt the server I.
Redirection attack (intended attack) at t3: After host B gains access to host H through slow password attack, host B controls host H. Host B changes server H’s configuration to redirect all incoming requests to host C (malicious host) instead of intended DB server J. When C receives requests from H, C sends malicious codes as a response to all clients.
• BCA detection
Figure 12 shows overall
G(
t) from our system when the unknown attack is injected.
Password attack (intended attack): According to
VB(
), host
B does not detect MA8 (
Brute force) as shown in
Table 10. Existing systems using metrics
S8 (requests/s) and
S9 (responses/s) would not detect the slow brute force attack. Our system detects the pattern of BCA-2 based on
(ΕB (
) and (
ΛB (
) at
t1. Host
B finds a new edge to the target
H and generates consistent requests during the attack as shown in
Figure 13. BCA-2 requires similar BCA-2 behavior in the related host in the traditional password attack detection. In
Figure 12, host
H does not detect BCA-2 unlike host
B. Host
H fails to detect a slow rate of login request attack embedded among normal application requests. Our system detects host
B’s brute force behavior while existing systems fail to detect attacks on both
B and
H.
Flooding attack (bait attack): In the bait attack, host
A and
I detect MA1 (
Flooding) due to high inbound (
S4) and outbound (
S5) traffic at
t2. According to
GA(
t2) and
GI(
t2) in
Table 11, these hosts have a new edge between them and have a sudden increase in traffic as shown in
Figure 14. This flooding attack also results in the sudden decrease of traffic in host
J as host
I is disrupted by flooding attack. The security manager is distracted by host
I being attacked by host
A through the flooding.
Redirection attack (intended attack): According to
GJ(
t3) in
Table 12, host
J detects a removed edge between host
H at
t3. The removed edge triggers the detection of BCA-5. The removed edge belongs to application elements. In normal operation, we do not expect any application element to be removed without prior notification. Thus it further confirms the attack behavior. Host
J also detects a low correlation between inbound and outbound traffic due to the flooding and redirection attacks.
Overall G(t) graph indicates high possibility of the redirection attack based on other connected BCA detections. Our system correctly detects not only the bait attack but the intended attack where existing systems fail to detect the intended attack.
7. Conclusions
We have presented a different perspective on ways to detect cyberattacks. Rather than relying on traditional signatures and anomaly patterns, we proposed an approach based on fundamental and essential behaviors of cyberattacks. We defined these behaviors as Basic Cyberattack Action (BCA) and proposed five types of BCA such as a sudden performance degradation, iterative behavior, propagation behavior, sudden increase or decrease in ingress and egress traffic, and uncorrelated ingress and egress traffic. Individual BCA is detected by monitoring not only Methods of Attack (MAs) and traffic volume of a single element, but also the spatiotemporal relationship among elements. In order to represent combination of BCAs, we developed a stochastic graph model. The combination of BCAs describes the change of interactions among elements in time and space. By considering multiple elements together, we can reduce additional false positives by finding contradicting combination of BCAs. We also implemented and deployed our spatiotemporal-based intrusion detection system in our datacenter for preliminary validation of our idea. We demonstrated the effectiveness of BCAs in numerous known and unknown attack scenarios. For known attacks, we injected a Slowloris attack, password attack, SSH worm attack, and Smurf attack selected by analyzing intrusion datasets and CAPEC. Our experimental results showed that our system accurately detects all the known attacks comprising BCAs and locates possible root cause as well. Furthermore, we built an example of unknown attack based on a bait-and-switch method that combines three types of attacks such as a password attack, flooding attack, and redirection attack. The experimental results showed that such unknown attack is effectively detected by our system while existing detection mechanisms fail to detect the intended attack. Many existing systems may not be adequate for future unknown and advanced attacks. In addition, today’s complex applications may trigger a significant number of false positives. We believe that the characterization of attacks in spatiotemporal patterns with expected essential behaviors of any attack presents a new effective approach to the intrusion detection. The performance evaluation with not only extensive attacks comprising complex BCAs but a variety of applications will be addressed in the future.


