Abstract
The Micro-Phasor Measurement Unit (PMU) or distribution-level PMU (D-PMU) is a measurement device that measures the synchronized voltage and current values of electric power distribution networks. The synchronized data obtained by PMUs can be used for monitoring, diagnostic, and control distribution network applications, so that operators can understand the dynamic states of the distribution network in real-time. In this paper, we review the state-of-the-art PMU research which includes a list of PMU applications, monitoring and diagnostic functions, control applications, and optimal placement of the PMU. In addition, we analyze the benefits of PMUs in distribution networks; in particular, their reliability and resiliency, cost savings, and environmental and policy benefits.
1. Introduction
Recently, the integration of distributed energy resources (DERs), including renewables, electric vehicles (EVs), and demand response, in distribution networks has increased considerably and has changed the network load profile and configuration [1]. This complex interaction may cause great uncertainties, and even bidirectional power flow in the distribution network, which makes the supervision and operation of distribution networks more complicated [2].
Currently, most electric utilities worldwide use the supervisory control and data acquisition (SCADA) system to monitor and control electric power distribution networks. The SCADA system receives data from conventional measurement devices, called remote terminal units (RTUs), installed in dispersed locations of the power system [3]. It records unsynchronized voltage, current magnitude, and real and reactive power flow with low resolution, i.e., a couple of seconds [4]. Therefore, the SCADA system cannot capture the dynamic behavior of the current distribution network [5].
The phasor measurement unit (PMU) has been developed to monitor, protect, and control power networks [6]. It can provide synchronized measurements because the PMU has a global positioning system (GPS) antenna. Therefore, it measures voltage and current phasors, as well as their magnitude, in real-time with high accuracy and high precision of ±1° or ±1% [7]. Until now, PMU has been mainly deployed in transmission networks since it is expensive, and the distribution networks are large in quantity.
Distribution networks are very complex, because of the many nodes, short distances, small amplitude and angle differences between nodes, faster dynamics, and lack of standard documentation [2,8]. Thus, these complexities have raised the need to develop new monitoring systems of high accuracy and high precision that support the achievement of situational awareness in distribution networks, and enable the distribution operators to make operational decisions in response to such disturbances [9].
To improve situational awareness and alleviate these complexities, the micro-phasor measurement unit (PMU) or distribution-level PMU (D-PMU) has been developed in distribution networks [10]. This unit is capable of measuring the synchronized voltage and current phasors (both magnitude and phase angle) in real-time at higher resolution and precision, to facilitate a level of visibility into a distribution network [11,12]. The PMU reports four fundamental measurements on three phases, so it has 4 × 3 = 12 measurement channels. These four measurements are voltage magnitude, voltage phase angle, current magnitude, and current phase angle per phase with the maximum sampling rate of 120 Hz [13,14]; if the GPS antenna has established satellites, PMUs also use the GPS clock to ensure precise time synchronization [15].
Several review papers on PMU have mainly been conducted on its applications in distribution networks, such as monitoring and diagnostic applications, and control applications [16,17,18]. However, these papers have not reviewed recent research works related to PMU. In a recent review paper [19], the authors have reviewed the applications of PMU for emerging active distribution networks. Especially, this work has mainly focused on state awareness and event detection.
The objective of this paper is to provide a comprehensive survey of PMU related research in distribution networks. In this paper, we classify recent PMU papers into four divisions: A list of PMU applications, monitoring and diagnostic applications, control applications, and optimal PMU placement. In addition, we analyze the benefits of using PMU data in distribution networks. The main benefits of the PMU are reliability, resiliency, cost savings, efficiency, and environmental and policy considerations. The most similar work to our survey is the recent survey paper [19]. However, our work surveys adaptive protection and distribution network reconfiguration which are not covered by [19]. In addition, we discuss the benefits of using PMU data in distribution networks.
2. Micro-PMU Technology
2.1. The Features of PMU Technology
Micro-PMU provides time-synchronized voltage and current phasors in real-time with high accuracy, high precision, and high sampling rate. Synchronization is achieved by the same-time sampling of voltage and current phasors using timing signals from the GPS receiver [20]. It has accuracy angle of ±0.01, total vector error allowance of ±0.05% (precision), angle resolution of ±0.002, and magnitude resolution of ±0.0002% [7]. Its sampling rate is adjustable in the range (10–120) samples per second for a 60 Hz system [21]. The operators can monitor the distribution applications in real-time, due to the high performance of PMU technology in distribution networks.
2.2. Comparison of SCADA, PMU and PMU
Before PMU [PMU] began to be used in the transmission [distribution] network, SCADA was commonly used to monitor and control the power network. SCADA is based on steady-state power flow analysis, so due to unsynchronized data and low resolution, it cannot observe the dynamic state of the network [6]. PMU and PMU are used for monitoring and control wide-area of transmission networks and local area of distribution networks, respectively. Because distribution network covers relatively small area than transmission network, PMU should have higher accuracy. The accuracy and precision of PMU are typically ±0.01 and ±0.05%, respectively [7]. Table 1 shows the main differences of SCADA, PMU and PMU.

Table 1.
Comparison of supervisory control and data acquisition (SCADA), Phasor Measurement Unit (PMU) and Micro-Phasor Measurement Unit (PMU).
2.3. Phasor and Its Representation
Figure 1a,b, show the sinusoidal waveform and its phasor representation, respectively. A pure sinusoidal waveform can be represented by a unique complex number known as a phasor. A phasor is defined as a vector representation of the magnitude and phase angle of an AC voltage waveform.
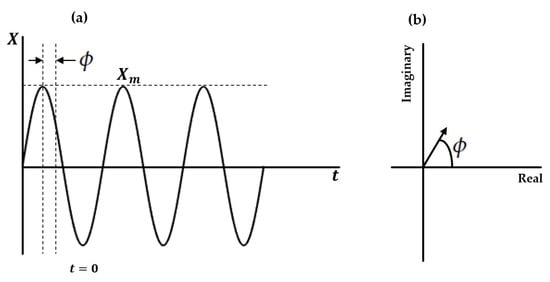
Figure 1.
(a) Sinusoidal waveform; (b) phasor representation.
In [22], a pure sinusoidal quantity is written as
where, is the frequency of the signal in radians per second and is the phase angle in radians, which is defined as the angular difference between the peak time and the reference time at . This reference time corresponds to the time tag assigned according to the GPS clock. The peak amplitude of the signal is . The root mean square (RMS) value of the input signal is , and its quantities are particularly useful for calculating the active and reactive power in an AC circuit. By using Euler’s formula, Equation (1) can also be written as follows:
The sinusoid of Equation (1) is represented by X, which is known as its phasor representation, and is shown as
The phase angle of the phasor is arbitrary, as it depends on the choice of the axis t = 0. The length of the phasor is equal to the root mean square value of the sinusoid.
It is stated that the phasor representation is only possible for a pure sinusoid. In practice, a waveform is corrupted with other signals of different frequencies, so it is necessary to extract a single signal frequency component of the signal. Then, the single frequency component represented by a phasor can be extracted with a Fourier transform.
2.4. Block Diagram of PMU and Its Functionality
Figure 2 shows the functional block diagram of a PMU. It has a high processing speed, phasor estimation and accurate time stamping of input signals [23]. The anti-aliasing filter has the role of removing the components of the signal whose frequency is equal to or greater than one-half the Nyquist rate [22]. The analog AC waveforms (voltage and current phasors) at the input are digitized by an analog to digital converter. A phase-locked oscillator converts the GPS one pulse per second signal into a sequence of high-speed timing pulses used in the waveform sampling. The phasor microprocessor executes the phasor calculations, and the calculated phasors are combined to form positive sequence measurements. The phasors are finally time tagged with the timing information provided by the clock, and the second of century count provided by the GPS receiver. The final phasor value is transmitted to a data center using a modem.

Figure 2.
Block diagram of the PMU.
3. Survey of Micro-PMU in Distribution Networks with Related Research
This section presents a survey of PMU-related research papers. Figure 3 shows that they are classified as a list of PMU applications, monitoring and diagnostic applications, control applications, and optimal PMU placement.

Figure 3.
PMU with related research.
3.1. List of Applications of PMU in Distribution Networks
This subsection presents the list of PMU applications which are presented in the recently published review papers and reports on PMU applications in distribution networks. The works in [16,17] summarize the different applications of PMU such as diagnostic and control applications, and their objectives. Moreover, the development process of the PMU network is described in the works. A recent review paper [19] review PMU based applications for emerging active distribution networks. The needs of PMU at the distribution level are explained and summarized its applications in [18,22,24]. A recent report [25] provides a comprehensive list of PMU applications, such as monitoring and diagnostics, planning, and operation and control applications. Table 2 summarizes the list of PMU data applications in distribution networks in these review papers.
Table 2.
Applications of PMU data in distribution networks.
3.2. Monitoring and Diagnostic Applications
Monitoring and diagnostic applications enable the operators to understand the present or past conditions of the distribution network. The increasing amount of DERs and variable loads in the distribution network have introduced new challenges of short-term variabilities. Some events in distribution networks are sinusoidal or non-sinusoidal transients in voltage and current waveforms that may be caused by faults, topology changes, load behavior, and source dynamics. The distribution operators can detect the events in real- time, by investigating data from the PMU installed in the distribution network [26]. For example, using PMU data, reverse power flow in distribution networks can be easily detected [27]. Upon detection of distribution system frequency event, power mismatch between generation and load demand which can be caused by power system disturbances is estimated at the early stage of the event [28].
High impedance fault detection: High-impedance fault detection is a challenging problem for conventional measurements, due to the small flow of current of this fault. With PMU data, identification of high-impedance fault location is proposed in [29] which uses the synchronized harmonic phasors, and focuses on the third harmonic components of pre-fault and post-fault measurements. This shows that only two PMUs are enough to estimate the location of a high-impedance fault in the distribution network.
Fault location identification: Determining accurate fault location can help to reduce the duration of outage and operation cost of distribution networks. Micro-PMU measurements help to improve the accuracy of finding the fault location. In [30], the authors propose a fault location identification algorithm that uses the recorded data of voltage and current phasors before and during the fault from PMUs installed on two terminals.
Another fault location finding method is proposed in [31]. This method consists of two steps: (i) The candidate fault locations are found using voltage and current information provided by the PMU at one terminal by iterating each line segment, and (ii) the actual fault is found by voltage difference, which is obtained by using the measurements from PMUs installed at two terminals in the distribution network. Figure 4 shows that the three faults locations marked as F, F1, and F2 are found using the measurements from two PMUs that are located on both ends. These fault locations are found by calculating the fault distance based on impedance to check if the fault is between two nodes.

Figure 4.
Examples of the fault location finding method in 11-bus distribution feeder.
In [32], the authors propose an algorithm to find a fault location in the distribution network, and analyzes the characteristics of PMU noise and its impact on the traditional impedance fault location. According to this work, both PMU noise and fault location error follow Gaussian distribution. The accuracy of the impedance method is influenced by PMU noise, and the accuracy of the double-ended impedance method is higher than that of the single-ended impedance method under PMU measurement error. In [33], a method to locate the source of events in distribution networks is proposed by using PMU data. The proposed method is based on the compensation theorem in circuit theory to generate an equivalent circuit to locate the event by using the voltage and current phasors from the PMUs. The source of the event can be detected by using the measurements of the two PMUs.
State estimation: State estimation in a power system gives the human operators situational awareness, as well as many automated control actions. It identifies the steady-state of voltage magnitude and phase angle at each node in a network. In the distribution network, the single-phase state estimator applied in the transmission network cannot be used, because the transmission network is assumed to be balanced, while the distribution network is not. In general, the state estimation for distribution networks is difficult, due to the numerous nodes, and lack of synchronized measurements. With PMU data, these difficulties can be alleviated, because the voltage and current phasors are directly measured [34]. Table 3 shows the summary of different methods applied for distribution system state estimation.
Table 3.
State estimation algorithms for distribution networks. WLS: Weighted Least Squares; BS: Bayesian Learning; LSE: Least Squares Estimation; : Linear State Estimation.
A tracking state estimation method is proposed in [35] that is based on the compensation theorem from circuit theory to produce an equivalent circuit. It uses only two PMU measurements installed at the substation, and at the end of the main feeder. Figure 5 shows a representation of the network based on the compensation theorem equivalent circuit. If an event occurs at node 3 that lies between downstream and upstream of the segment in the distribution network, an equivalent circuit is formulated by using the compensation theorem. A current source is at node 3, and the downstream and upstream network are replaced by their equivalent impedances. The equivalent impedances of the upstream and downstream network are formulated as and , respectively, where and denote the changes in current and voltage before and after the event recorded by PMU located upstream [downstream], respectively. The voltage and current phasors of node-installed PMUs in the presence of the current source are equal to the changes in nodal voltages and branch currents obtained after an event occurs, by subtracting the pre-event from the post-event voltage and current phasors. The product of bus current injection and bus impedance is not valid at bus 3. The least squares problem to estimate the voltage and current difference vectors induced by the event are considered ( and ). After obtaining the optimal solution ( and ), the system state after an event occurrence is updated as = + and = + , where and indicate the bus voltages and injection currents before the event.
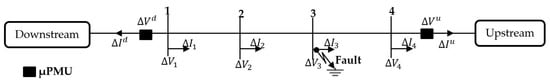
Figure 5.
Example of a network based on the compensation theorem equivalent circuit with two PMUs.
The three-phase state estimator has been applied in the distribution network [36], because the phases of the distribution network are generally unbalanced. In this work, the branch current based distribution system state estimator (DSSE) in both polar and rectangular formulations has been tested, and showed that in terms of computational time, the rectangular formulation has better performance than the polar formulation. The authors in [37] apply the linear state estimation method system state estimation using different types of measurements, including PMU measurements and pseudo-measurements. The linear DSSE and the standard nonlinear weighted least square (WLS) estimator shows similar performance, but the linear DSSE has better performance than WLS for certain conditions. In [38], it is shown that dynamic variable-weight state estimation using the measurements from PMU and SCADA improves the accuracy of the distribution network state estimation in real-time. A comprehensive mathematical analysis is presented in [39] with the objective of highlighting the most important factors affecting the accuracy of the voltage profile provided by WLS estimators in the distribution network.
In [40], the harmonic state estimation (HSE) is proposed to locate the harmonic sources and estimate harmonic voltage at distribution networks. This method uses two types of measurements: Smart meters and few PMUs. The main challenges for the harmonic state estimation are (i) unbalanced phases and phase coupling, and (ii) unknown measurement matrix because of low available measurements and unknown aggregate power. They propose a data-driven to HSE which copes with unknown measurement matrix by leveraging data from smart meters. The proposed sparse Bayesian learning-based estimator requires a minimum number of PMUs.
The adequate and economic performances of PMU are investigated in [41] to meet the estimation accuracy for DSSE. The accuracy of different PMU performance classes are defined based on time synchronism, and also the accuracy of SCADA and smart meters are defined. They use total vector error (TVE) as the performance metric of the state estimation. That helps to know whether the estimated voltage phasors are within the allowable range or not. Another performance metric defined in [41] is the confidence level. It maintains when the model is accurate, i.e., no bad data, while low confidence level implies the existence of bad data.
The short-circuit fault detection and identification based on state estimation is proposed in [42]. First, the authors revised the traditional DSSE to be compatible with fault conditions and then a fault location algorithm based on the revised DSSE is proposed to detect the location of the fault. To this end, the distribution network is divided into independent zones and the revised DSSE is executed for the boundary buses of all zones. After finding the faulted zone, the revised DSSE process is executed one more time in the detected faulted zone. Therefore, the exact faulted element (bus or branch) is determined. In [43], an optimal placement of PMUs is obtained for radial distribution networks, and then DSSE is performed based on the PMUs.
Topology status verification: Where remote status indicators are unavailable or unreliable, an empirical topology identification can enhance the safe operations and accurate state estimation. The connectivity is not directly sensed by PMUs, but can be inferred from the phase angle difference between points on opposite sides of a switch [44]. The authors in [45] propose an estimation method for detecting the switching action (open and closing) and topology transition in distribution networks. This method is based on the analysis of time-series voltage measurements from PMUs installed in the distribution network. In [46], the time-series signature verification method is applied for the topology detection. This is based on a comparison of the actual voltage phasors with a library of signals associated with the topology transitions of a given network.
Phase identification: The phases in distribution networks can be switched during restoration, reconfiguration, or maintenance activities. The correct phase labeling helps to avoid excessive losses or reduced life span of network components as a result of imbalance loads, or insufficient harmonic mitigation. The authors in [47] propose a phase identification method based on the comparison of the voltage magnitude and phase angle measurements at two nodes for phase identification. The voltage correlation between a pair of nodes on the same phase is an indication of phase matching, and the voltage phase angle differences are compared to minimize the phase identification error.
3.3. Control Applications
Adaptive protection: The deployment of PMUs in distribution networks and improvement of system integrity protection is proposed in [8] by the implementation of adaptive protection. This method considers uncertainties, and updates overcurrent relays in microgrid according to the changes. The uncertainties are detected using the algorithm based on Thévenin impedance estimation obtained by the PMU installed at the point of common coupling. Moreover, the detection of uncertainties in a microgrid is sent by PMUs installed at different locations of the microgrid.
In [48], the authors present the variability characteristics of currents, such as bidirectional power flow and the fluctuations of DERs. These also require changes to protect the system of the microgrid. They cause selectivity (failure to trip) and sensitivity (unnecessary tripping) for conventional protective devices with fixed settings. Using a PMU for a smart protection scheme, it can transfer the synchronized measurements to the microgrid central controller to calculate the fault index to detect all types of short-circuit. Thus, all mentioned protection issues can be solved.
Distribution network reconfiguration: In [49], the problem for a reconfiguration of the distribution network is formulated as mixed-integer nonlinear programming, because of the binary status of switches, and unbalances of the three-phase power flow equations. The reconfiguration problem consists of two phases: (i) Bi-level information granulation, and (ii) robust optimization for dealing with the uncertainty obtained for each information granule. With PMU, the network reconfiguration can be accomplished in the presence of the integration of DERs in the network.
3.4. Optimal PMU Placement in Distribution Networks
Observability of a distribution network is necessary to operate securely and efficiently to increase the accuracy and reliability of the network. The location of PMUs should be carefully considered for system observability. Complete observability is defined as all bus voltages and line currents phasors being uniquely determined. The PMU measures the voltage phasors of the installed bus and the current phasors of the incident lines to that bus; the voltage phasors of adjacent buses to that bus can be calculated using line parameters and Ohm’s law. Hence, all buses connected to that bus-installed PMU are observable. For example, in Figure 6, if a PMU is installed at bus 2, it directly measures the voltage phasors of the installed bus and the current phasors of lines 1–2, 2–3, and 2–4. Then, these measurements are used to calculate the voltage phasors of buses 1, 3, and 4.

Figure 6.
Example four-node system.
To obtain the minimum number of PMUs for complete observability, a graphic theoretic method is proposed in [50]. The proposed method is based on the collection of the set of vertices and edges. The distribution network is converted to a graph by considering the lines as edges, and buses as vertices. The spanning-tree consists of two types of vertex: Pendant and cut vertices. The proposed placement method is formulated in two steps: (i) Select the pendant vertices, and (ii) choose the cut vertices connected to these pendant vertices as the installation locations of PMUs. The unobservable vertices are grouped, and the PMU is installed at vertex that makes each group observable.
In [51], the authors propose a hybrid method based on global search algorithm to choose the optimal placement of PMU in distribution networks for complete observability. This method obtains the optimal solution with reasonable computational time. It has three main steps: (i) Identification of candidate locations, (ii) searching for a minimal number of PMUs, and (iii) redundancy comparison. Another optimal PMU placement research for complete observability is investigated in [52]. In this work, the radial topology of distribution networks is equivalently downsized to the scale of the networks. Their proposed search method finds a solution faster than the exhaustive search method with almost no performance degradation. However, it also consumes extensive time when the size of network increases. The solution for optimal PMU placement is accelerated by using the scaled network.
A recent work [53] proposes the combinational monitoring system with the PMUs and power flow measurements (PFMs) to minimize the installation cost, while guaranteeing complete observability. The proposed method uses a nonlinear programming algorithm, and obtains the minimum cost combination of PMUs and PFMS and their placement in distribution networks. Moreover, the optimal placement of PMU based on information evaluation and node selection strategy (IENS) by using greedy algorithm is presented in [2]. It uses the smart meters and pseudo-measurements of loads to reduce the number of PMUs. For both complete and incomplete observability, they propose an improved IENS which considers the characteristic of topological method as well. The improved IENS shows the same performance as topological method for complete observability but it has a better observable capability with the number of pseudo-measurements.
Table 4 summarizes the methods and performances of each reference papers which have been used for the optimal placement of PMU in distribution networks for full system observability. The performances are compared in terms of numbers of PMUs, PFMs, and FTUs, and computational time. The performance for the number of PMUs are the same among [50,51,52], but they have different computational time. In [53], the proposed method uses less number of PMUs than that of the works [50,51,52] because it uses combinational monitoring system with the PMUs and PFMs.
Table 4.
Performance comparison of the methods that have been used for optimal PMU placement in the distribution networks. PFM: Power Flow Measurement; FTU: Feeder Terminal Unit; CT: Computational Time.
4. Benefits of Using Micro-PMU Data
In this section, we analyze the benefits of PMUs in distribution networks. Table 5 shows the benefits of using PMU data can be classified into the improvement of reliability and resiliency, cost savings, and environmental and policy benefits from increasing the renewables.
Table 5.
Benefits of using PMU data in the distribution networks.
4.1. Reliability and Resiliency Benefits
With PMU, the reliability and resiliency of distribution networks can be improved by reducing not only the duration of outages but also the number of customers affected by outages. It helps to reduce the time required to restore the service through faster determination of fault location, faster line reclosing, faster forensic analysis, faster black-start, faster island resynchronization, and smoother generation synchronization. The oscillation detection and actions taken to restore the network stability can reduce the interruptions [54,55]. The number of outages can also be reduced by identifying the potential equipment failures, and repairing them before actual failure.
Phase angle can be used to monitor and improve the speed and accuracy of line reclosing and generator synchronization. When the interruptions occur in the distribution network, PMU data can be used to analyze the events, so that the operator can determine the causes. There are many events in distribution networks, but the conventional models used to monitor distribution networks are not accurate in predicting the network behavior under different network disturbance conditions [56].
If PMU data are available and are used for model validation, it is expected that better models of each distribution network [57] can be obtained. The use of PMU data allows operators to identify the events and it mitigate reliability concerns, because the data can be used to accurately find fault locations, perform phase angle monitoring for line reclosing, and verify line flows and network conditions before, during, and after the outage. Therefore, the PMU can help event detection and achieve faster service restoration, which is highly valuable for distribution utility and customers.
In [58], the authors present the benefits of PMU in developing countries. In developing countries, there are a number of unplanned power outages. The duration of unplanned outages can be reduced by finding causes and locations of the outages. Through the case study of Rwanda power system, this work shows that the total unplanned power outages duration can be reduced to 51.7%.
4.2. Cost Savings Benefits
The cost savings by using PMUs are obtained by equipment savings, labor savings, and other avoided costs. Moreover, the cost is further saved through congestion reduction, and reduction of labor cost associated with reduced forensic event analysis and model validation. These events can frequently occur by using more renewables in distribution networks. At the same time, as renewable generators replace fossil fuel-based generators, fuel costs can be saved [59].
In addition, PMUs can improve the operational tools and the operator’s instincts with PMU-based training and tools, including visualization, alarms, and alerts. PMU qualities can help the operators reduce outage duration, as well as minimize the effects on customers due to the speedy system restoration time [60].
Distribution networks can be efficiently operated resulting in high utilization of the existing distribution assets with PMUs. Better recognition of active and reactive power needs can improve grid utilization [54,61]. Therefore, utility company minimize line losses, delivered energy costs, and total generation requirements to provide the same amount of delivered electricity. The increased efficiency can lower the capital costs for distribution lines and generation assets.
With PMU data and analytics, equipment failures can be identified even before they occur, resulting in maintenance costs reduction. This can reduce crew labor costs, and enable more cost-effective equipment acquisition and inventory management. Moreover, using PMU data in distribution networks can reduce crew field time spent on searching for fault location for repairing [62].
4.3. Environmental and Policy Benefits
The environmental benefits of using PMU data in distribution networks occur due to the analytics that help the operators manage intermittent generating resources, such as wind and PV, without compromising reliability. This enables incrementally greater use of renewable generation with associated CO emissions reductions, as wind and PV replace fossil fuel-based generators.
Operators can have a more accurate view of the behavior of DERs on the distribution network with PMU. Increased system visibility enables the operators to avoid instability situations, such as when a period of high wind and solar production coincide with a period of low electrical demand.
In addition, PMU can promote the participation of prosumers. With prosumers, the power can flows bi-directional in distribution networks [63]. To operate the networks safely, more accurate measurements are required in the distribution level. With PMU, the utility company can operate the network well, resulting in more number of prosumers and regional electricity market.
5. Conclusions
The Micro-Phasor Measurement Unit (PMU) or distribution-level PMU (D-PMU) is designed for electric power distribution networks, and due to its high accuracy and high precision measurements of voltage and current phasors, has various applications in the distribution network. The PMU is expected to be essential for future distribution networks because many distributed energy resources (DERs) are integrated into the networks. This paper describes PMU technology in the distribution network, and presents a survey on PMU in distribution networks with recent research. In addition, it presents the various benefits of using PMU data in the distribution networks. The benefits come from improvements in network reliability and resiliency, cost savings, and environmental and policy benefits from renewables.
Author Contributions
All authors have contributed equally to this manuscript. All authors have read and agreed to the published version of the manuscript.
Funding
This work was supported in part by the “Human Resources Program in Energy Technology” initiative of the Korea Institute of Energy Technology Evaluation and Planning (KETEP), granted financial resource from the Ministry of Trade, Industry & Energy, the Republic of Korea (No. 20164010201010), and in part by the Korea Electric Power Corporation (Grant number: R18XA04).
Conflicts of Interest
The authors declare no conflict of interest.
References
- Primadianto, A.; Lu, C.N. A Review on Distribution System State Estimation. IEEE Trans. Power Syst. 2017, 32, 3875–3883. [Google Scholar] [CrossRef]
- Wu, Z.; Du, X.; Gu, W.; Ling, P.; Liu, J.; Fang, C. Optimal Micro-PMU Placement Using Mutual Information Theory in Distribution Networks. Energies 2018, 11, 1917. [Google Scholar] [CrossRef]
- Dong, Q.; Sun, J.; Wu, Q.; Liu, Y. A Method for Filtering Low Frequency Disturbance in PMU Data Before Coordinated Usage in SCADA. IEEE Trans. Power Syst. 2017, 32, 2810–2816. [Google Scholar] [CrossRef]
- Blas, L.L.F.; Bundoc, P.E.D.C.; Melchor, K.C.L.; Orillaza, J.R.C. Micro-Synchrophasors for Event Detection in an Electric Power System Simulator. In Proceedings of the IEEE Innovative Smart Grid Technologies—Asia (ISGT Asia), Singapore, 22–25 May 2018; pp. 178–183. [Google Scholar]
- Sun, Y.; Chen, X.; Yang, S.; Tseng, K.J.; Amaratunga, G. Micro PMU Based Monitoring System for Active Distribution Networks. In Proceedings of the IEEE 12th International Conference on Power Electronics and Drive Systems (PEDS), Honolulu, HI, USA, 12–15 December 2017; pp. 518–522. [Google Scholar]
- Usman, M.U.; Faruque, M.O. Applications of Synchrophasor Technologies in Power Systems. J. Mod. Power Syst. Clean Energy 2019, 7, 211–226. [Google Scholar] [CrossRef]
- Power Standards Lab. Introduction to microPMU. Available online: www.powerstandards.com$/wp-content/uploads/dlmuploads/2017/10/$Introduction-to-microPMU.pdf (accessed on 22 June 2019).
- Zanjani, M.G.M.; Mazlumi, K.; Kamwa, I. Application of μPMUs for Adaptive Protection of Overcurrent Relays in Microgrids. IET Gener. Transm. Distrib. 2018, 12, 4061–4068. [Google Scholar] [CrossRef]
- Shahsavari, A.; Farajollahi, M.; Stewart, E.; Cortez, E.; Mohsenian-Rad, H. Situational Awareness in Distribution Grid Using Micro-PMU Data: A Machine Learning Approach. IEEE Trans. Smart Grid 2019, 10, 6167–6177. [Google Scholar] [CrossRef]
- Stewart, E.; Liao, A.; Roberts, C. Open μPMU: A Real World Reference Distribution Micro-Phasor Measurement Unit Data Set for Research and Application Development; Technical Report 1006408; LBNL: Berkeley, CA, USA, 2016.
- Mohsenian-Rad, H.; Stewart, E.; Cortez, E. Distribution Synchrophasors: Pairing Big Data with Analytics to Create Actionable Information. IEEE Power Energy Mag. 2018, 16, 26–34. [Google Scholar] [CrossRef]
- Jamei, M.; Scaglione, A.; Roberts, C.; Stewart, E.; Peisert, S.; McParland, C.; McEachern, A. Anomaly Detection Using Optimally Placed Sensors in Distribution Grids. IEEE Trans. Power Syst. 2017, 33, 3611–3623. [Google Scholar] [CrossRef]
- Shahsavari, A.; Farajollahi, M.; Stewart, E.; von Meier, A.; Alvarez, L.; Cortez, E.; Mohsenian-Rad, H. A Data-Driven Analysis of Capacitor Bank Operation at a Distribution Feeder Using Micro-PMU Data. In Proceedings of the IEEE Power & Energy Society Innovative Smart Grid Technologies Conference (ISGT), Washington, DC, USA, 23–26 April 2017; pp. 1–5. [Google Scholar]
- Shahsavari, A.; Sadeghi-Mobarakeh, A.; Stewart, E.; Mohsenian-Rad, H. Distribution Grid Reliability Analysis Considering Regulation Down Load Resources Via Micro-PMU Data. In Proceedings of the IEEE International Conference on Smart Grid Communications (SmartGridComm), 6–9 November 2016; pp. 472–477. [Google Scholar]
- Shahsavari, A.; Farajollahi, M.; Stewart, E.; Roberts, C.; Megala, F.; Alvarez, L.; Cortez, E.; Mohsenian-Rad, H. Autopsy on Active Distribution Networks: A Data-Driven Fault Analysis Using Micro-PMU Data. In Proceedings of the North American Power Symposium (NAPS), Morgantown, WV, USA, 17–19 September 2017; pp. 1–7. [Google Scholar]
- Von Meier, A.; Culler, D.; McEachern, A.; Arghandeh, R. Micro-Synchrophasors for Distribution Systems; ISGT: Washington, DC, USA, 2014; pp. 1–5. [Google Scholar]
- Arghandeh, R. Micro-Synchrophasors for Power Distribution Monitoring, a Technology Review, systems and Control. arXiv 2016, arXiv:1605.02813. [Google Scholar]
- Von Meier, A.; Stewart, E.; McEachern, A.; Andersen, M.; Mehrmanesh, L. Precision Micro-Synchrophasors for Distribution Systems: A Summary of Applications. IEEE Trans. Smart Grid 2017, 8, 2926–2936. [Google Scholar] [CrossRef]
- Liu, Y.; Wu, L.; Li, J. D-PMU based applications for emerging active distribution systems: A review. Electr. Power Syst. Res. 2020, 179, 106063. [Google Scholar] [CrossRef]
- Haridas, R.P. GPS Based Phasor Technology in Electrical Power System. Int. J. Electr. Electr. Eng. 2015, 3. [Google Scholar] [CrossRef]
- Lee, L.; Centeno, V. Comparison of μPMU and PMU. In Proceedings of the Clemson University Power Systems Conference (PSC), Charleston, SC, USA, 4–7 December 2018; pp. 1–6. [Google Scholar]
- Jain, A.; Bhullar, S. Micro-phasor Measurement Units (μPMU) and Its Applications in Smart Distribution Systems; ISGW: Compendium of Technical Papers; Springer: Singapore, 2018; pp. 81–92. [Google Scholar]
- Das, H.P.; Pradhan, A.K. Development of a Micro-Phasor Measurement Unit for Distribution System Applications. In Proceedings of the National Power Systems Conference (NPSC), Bhubaneswar, India, 19–21 December 2016; pp. 1–5. [Google Scholar]
- Von Meier, A.; Arghandeh, R. Chapter 34-Every Moment Counts: Synchrophasors for Distribution Networks with Variable Resources. In Renewable Energy Integration; Jones, L.E., Ed.; Academic Press: Boston, UK, 2014; pp. 429–438. [Google Scholar]
- Von Meier, A.; Arghandeh, R. Diagnostic applications for Micro-Synchrophasor Measurements. In Proceedings of the Innovative Smart Grid Technologies Conference (ISGT), Washington, DC, USA, 22–24 April 2014; pp. 1–5. [Google Scholar]
- Liao, A.L.; Stewart, E.M.; Kara, E.C. Micro-Synchrophasor Data for Diagnosis of Transmission and Distribution Level Events. In Proceedings of the IEEE/PES Transmission and Distribution Conference and Exposition (T&D), Dallas, TX, USA, 3–5 May 2016; pp. 1–5. [Google Scholar]
- Shahsavari, A.; Farajollahi, M.; Stewart, E.; Roberts, C.; Mohsenian-Rad, H. A data-driven analysis of lightning-initiated contingencies at a distribution grid with a PV farm using micro-PMU data. In Proceedings of the North American Power Symposium (NAPS), Morgantown, WV, USA, 3–5 May 2017; pp. 1–6. [Google Scholar]
- Yao, W.; You, S.; Wang, W.; Deng, X.; Li, Y.; Zhan, L.; Liu, Y. A Fast Load Control System Based on Mobile Distribution-Level Phasor Measurement Unit. IEEE Trans. Smart Grid 2019, 11, 895–904. [Google Scholar] [CrossRef]
- Farajollahi, M.; Shahsavari, A.; Mohsenian-Rad, H. Location Identification of High Impedance Faults Using Synchronized Harmonic Phasors. In Proceedings of the IEEE Power & Energy Society Innovative Smart Grid Technologies Conference (ISGT), Washington, DC, USA, 23–26 April 2017; pp. 1–5. [Google Scholar]
- Lee, J. Automatic Fault Location on Distribution Networks Using Synchronized Voltage Phasor Measurement Units. In Proceedings of the Power Conference, Baltimore, MA, USA, 28–31 July 2014; pp. 1–8. [Google Scholar]
- Zhou, Z.; Gao, W.; Zhang, Y. Research on μPMU based fault location for active distribution network. In International Forum on Energy, Environment Science and Materials (IFEESM); Atlantis Press: Shenzhen, China, 2015. [Google Scholar]
- Xinyu, R.; Jinhan, H.; Xiaojun, W.; Zhenji, W. Analysis of μPMU Noise Characteristics and Its Influence on Distribution Network Fault Location. In Proceedings of the IEEE 2nd International Electrical and Energy Conference (CIEEC), Beijing, China, 4–6 November 2018; pp. 190–195. [Google Scholar]
- Farajollahi, M.; Shahsavari, A.; Stewart, E.M.; Mohsenian-Rad, H. Locating the Source of Events in Power Distribution Systems Using Micro-PMU Data. IEEE Trans. Power Syst. 2018, 33, 6343–6354. [Google Scholar] [CrossRef]
- Chen, X.; Tseng, K.J.; Amaratunga, G. State Estimation for Distribution Systems Using Micro-Synchrophasors. In Proceedings of the IEEE PES Asia-Pacific Power and Energy Engineering Conference (APPEEC), Brisbane, QLD, Australia, 15–18 November 2015; pp. 1–5. [Google Scholar]
- Farajollahi, M.; Shahsavari, A.; Mohsenian-Rad, H. Tracking State Estimation in Distribution Networks Using Distribution-Level Synchrophasor Data. In Proceedings of the IEEE Power & Energy Society General Meeting (PESGM), Portland, OR, USA, 5–10 August 2018; pp. 1–5. [Google Scholar]
- Almutairi, S.; Miao, Z.; Fan, L. Performance of Branch-Current Based Distribution System State Estimation. In Proceedings of the North American Power Symposium (NAPS), Fargo, ND, USA, 9–11 September 2018; pp. 1–6. [Google Scholar]
- Farajollahi, M.; Shahsavari, A.; Mohsenian-Rad, H. Linear Distribution System State Estimation Using Synchrophasor Data and Pseudo-Measurement. In Proceedings of the International Conference on Smart Grid Synchronized Measurements and Analytics (SGSMA), College Station, TX, USA, 21–23 May 2019; pp. 1–6. [Google Scholar]
- Yang, C.; Li, Y.; Yang, B.; Du, M.; Wang, S. Dynamic Variable-Weight Least Squares for State Estimation of Distribution Network Based on Data Fusion. In Proceedings of the IEEE Conference on Energy Internet and Energy System Integration (EI2), Beijing, China, 26–28 November 2017; pp. 1–5. [Google Scholar]
- Muscas, C.; Pau, M.; Pegoraro, P.A.; Sulis, S. Uncertainty of Voltage Profile in PMU-Based Distribution System State Estimation. IEEE Trans. Instrum. Meas. 2016, 65, 988–998. [Google Scholar] [CrossRef]
- Zhou, W.; Ardakanian, O.; Zhang, H.; Yuan, Y. Bayesian Learning-Based Harmonic State Estimation in Distribution Systems with Smart Meter and DPMU Data. IEEE Trans. Smart Grid 2019, 11, 832–845. [Google Scholar] [CrossRef]
- Kim, J.; Kim, H.; Choi, S. Performance Criterion of Phasor Measurement Units for Distribution System State Estimation. IEEE Access 2019, 7, 106372–106384. [Google Scholar] [CrossRef]
- Gholami, M.; Abbaspour, A.; Moeini-Aghtaie, M.; Fotuhi-Firuzabad, M.; Lehtonen, M. Detecting the Location of Short-Circuit Faults in Active Distribution Network Using PMU based State Estimation. IEEE Trans. Smart Grid 2019. [Google Scholar] [CrossRef]
- Sohel, I.H.; Kesici, M.; Sengul, M.; Alboyaci, B. Micro-Synchrophasor Based State Estimation in Distribution System. In Proceedings of the 7th International Istanbul Smart Grids and Cities Congress and Fair (ICSG), Istanbul, Turkey, 25–26 April 2019; pp. 199–203. [Google Scholar]
- Arghandeh, R.; Gahr, M.; von Meier, A.; Cavraro, G.; Ruh, M.; Andersson, G. Topology Detection in Microgrids with Micro-Synchrophasors. In Proceedings of the Power Energy Society General Meeting, Denver, CO, USA, 26–30 July 2015; pp. 1–5. [Google Scholar]
- Cavraro, G.; Arghandeh, R.; Poolla, K.; Von Meier, A. Data-Driven Approach for Distribution Network Topology Detection. In Proceedings of the IEEE Power & Energy Society General Meeting, Denver, CO, USA, 26–30 July 2015; pp. 1–5. [Google Scholar]
- Cavraro, G.; Arghandeh, R. Power Distribution Network Topology Detection with Time-Series Signature Verification Method. IEEE Trans. Power Syst. 2017, 33, 3500–3509. [Google Scholar] [CrossRef]
- Wen, M.H.; Arghandeh, R.; von Meier, A.; Poolla, K.; Li, V.O. Phase Identification in Distribution Networks with Micro-Synchrophasors. In Proceedings of the IEEE Power & Energy Society General Meeting, Denver, CO, USA, 26–30 July 2015. [Google Scholar]
- Elbana, M.S.; Abbasy, N.; Meghed, A.; Shaker, N. μPMU-Based Smart Adaptive Protection Scheme for Microgrids. J. Mod. Power Syst. Clean Energy 2019, 7, 887–898. [Google Scholar] [CrossRef]
- Akrami, A.; Doostizadeh, M.; Aminifar, F. Optimal Reconfiguration of Distribution Network Using μPMU Measurements: A Data-Driven Stochastic Robust Optimization. IEEE Trans. Smart Grid 2019, 11, 420–428. [Google Scholar] [CrossRef]
- Tahabilder, A.; Ghosh, P.K.; Chatterjee, S.; Rahman, N. Distribution System Monitoring by Using Micro-PMU in Graph-Theoretic Way. In Proceedings of the 4th International Conference on Advances in Electrical Engineering (ICAEE), Dhaka, Bangladesh, 28–30 September 2017; pp. 159–163. [Google Scholar]
- Chen, X.; Chen, T.; Tseng, K.J.; Sun, Y.; Amaratunga, G. Hybrid Approach Based on Global Search Algorithm for Optimal Placement of μPMU in Distribution Networks. In Proceedings of the IEEE Innovative Smart Grid Technologies-Asia (ISGT-Asia), Melbourne, VIC, Australia, 28 November–1 December 2016; pp. 559–563. [Google Scholar]
- Chen, X.; Chen, T.; Tseng, K.J.; Sun, Y.; Amaratunga, G. Customized Optimal μPMU Placement Method for Distribution Networks. In Proceedings of the IEEE PES Asia-Pacific Power and Energy Engineering Conference (APPEEC), Xi’an, China, 25–28 October 2016; pp. 135–140. [Google Scholar]
- Dusabimana, E.; Nishimwe, H.L.F.; Yoon, S. Optimal Placement of Micro-Phasor Measurement Units and Power Flow Measurements to Monitor Distribution Network. In Proceedings of the International Council on Electrical Engineering (ICEE), Hong Kong, China, 2–6 July 2019. [Google Scholar]
- Silverstein, A.; Weimar, M.; Petersen, J. The Value Proposition for Synchrophasor Technology: Itemizing and Calculating the Benefits from Synchrophasor Technology Use Version 1.0; Tech. Rep. NASPI-2015-TR; North Amercan SynchroPhasor Initiative: Washington, DC, USA, October 2015. [Google Scholar]
- Patel, M.; Aivaliotis, S.; Ellen, E. Real-Time Application of Synchrophasors for Improving Reliability; Tech. Rep.; North American Electric Reliability Corporation: Atlanta, GA, USA, October 2010. [Google Scholar]
- Silverstein, A.; Andersen, E.; Tuffner, F.; Kosterev, D.; Jr, K.T.; Dagle, J. Model Validation Using Synchrophasor Data; NASPI Technical Report; North Amercan SynchroPhasor Initiative: Washington, DC, USA, March 2015. [Google Scholar]
- Overholt, P.; Kosterev, D.; Eto, J.; Yang, S.; Lesieutre, B. Improving Reliability Through Better Models: Using Synchrophasor Data to Validate Power Plant Models. IEEE Power Energy Mag. 2014, 12, 44–51. [Google Scholar] [CrossRef]
- Dusabimana, E.; Yoon, S. Improvement to Power System Reliability and Resiliency in Developing Countries Using PMU. In Proceedings of the The Korean Institute of Electrical Engineers 50th Summer Conference, Sokcho, Korea, 10–12 July 2019. [Google Scholar]
- NASPI (North American Synchrophasor Initiative). Synchrophasor Technology and Renewable Integration; Techncal Report; NASPI: Washington, DC, USA, 7 June 2012. [Google Scholar]
- Silverstein, A. Diagnosing Equipment Health and Mis-Operations Using PMU Data; North American Synchrophasor Initiative: Washington, DC, USA, May 2015. [Google Scholar]
- Hurtgen, M.; Maun, J.C. Applications of PMU Measurements in the Belgian Electrical Grid; Technical Report; AuthorZilla: Gurgaon, India, 2012. [Google Scholar]
- Kandel, A. Benefits and Costs of PIER Research Enabling Synchrophasor Applications; Staff Report; California Energy Commission: Sacramento, CA, USA, May 2016. [Google Scholar]
- Zafar, R.; Mahmood, A.; Razzaq, S.; Ali, W.; Naeem, U.; Shehzad, K. Prosumer Based Energy Management and Sharing in Smart Grid. Renew. Sustain. Energy Rev. 2018, 82, 1675–1684. [Google Scholar] [CrossRef]
© 2020 by the authors. Licensee MDPI, Basel, Switzerland. This article is an open access article distributed under the terms and conditions of the Creative Commons Attribution (CC BY) license (http://creativecommons.org/licenses/by/4.0/).